beyond tax evasion and misreported trade: global evidence on
TRANSCRIPT

1
Beyond Tax Evasion and Misreported Trade: Global Evidence on Trade
Agreements, Accounting Standards, and Organized Crime
Derek Kellenberg
University of Montana
Arik Levinson
Georgetown University
April 14, 2014
[Preliminary Draft: Please consult authors before citing]
Abstract: In contrast to prior disaggregated product level studies on tariff evasion which have
focused on select country pairs, we develop a model that allows us to consistently estimate
average tariff evasion effects on aggregate bilateral trade data. This has two distinct advantages
over prior work. We are able to obtain a more general test for average tariff evasion effects
across a large number of countries at different development levels and identify important
policy relevant factors for misreporting of trade that cannot be identified at the product level of
aggregation. On a panel of 128 importing and exporting countries over 11 years we find
general evidence of tariff evasion effects through underreporting of imports. The results
however are dependent on membership in regional trade agreements and level of economic
development. In addition, we find robust evidence that the strength of auditing and accounting
standards, product tax rates, and motivations for avoiding capital controls are also strongly
correlated with exporter incentives to underreport exports.
JEL Codes: F13, F14, H26
Keywords: Tariff evasion, international trade, auditing and accounting standards, organized
crime, regional trade agreements (RTA)

2
I. Introduction
One need not look very far these days to find stories of tariff evasion in the press. For
example, in 2012, China customs authorities detained 50 individuals who were accused of being
engaged in a tariff evasion ring that underreported prices on foreign seafood, estimated to
have cost China $11.6 million in tariff revenues1. In October of 2014, Mexican tax authorities
disrupted a tariff evasion ring that involved 22 customs officers and 197 companies from
Mexico, the United States, Panama, China, Singapore, and South Korea2. The tariff evasion
scheme involved the use of fake invoices on products, which was estimated to have cost the
Mexican government more that $37 million in unpaid tariffs. Also in 2014, Pakistani
investigators uncovered a scam involving a textile importer and customs officials to
underreport the value of 110 cargo containers of cloth to the tune of $1.7 million in evaded
tariff payments3. Stories such as these contain many common themes. Prime among them are
the avoidance of paying tariffs through evasion, often with the involvement of some sort of
organized criminal component or corrupt customs officials, as well as an element of the
strength of regulatory enforcement and ability to catch perpetrators. Further, the stories are
not specific to particular countries but often involve firms and organizations that span many
different countries and at different levels of economic development.
The stories above are exemplary only for the fact that they represent a miniscule
fraction of the actual tariff evasion that likely takes place globally. Accurate global figures on
tariff evasion and misreported trade are difficult to come by, but it has been estimated that in
2012 alone, more than $729 billion flowed out of developing countries as the result of trade
misinvoicing and tariff evasion (Kar and Spanjers, 2014). The magnitude and importance of
tariff evasion has not gone unnoticed by economists. Since the seminal paper by Fisman and
Wei (2004) examining the effect of tariff rates on trade evasion between China and Hong Kong
there have been a number of papers in recent years examining the issue for other pairs of
1 http://www.seafoodsource.com/news/supply-trade/19001-chinese-authorities-arrest-50-for-tariff-evasion
2 http://latino.foxnews.com/latino/news/2014/10/23/mexico-dismantles-textile-industry-tariff-evasion-ring/
3 http://tribune.com.pk/story/801951/tariff-evasion-customs-seize-dry-port-records-to-probe-rs170-million-scam/
3
select countries and regions using similar methods. In particular, this literature has included
examinations of tariff evasion effects on exports from Germany to 10 transition economies
(Javorcik and Narciso, 2008), imports to India (Mishra, Topalova and Subramanian, 2008), direct
exports from China to the United States (Ferrantino, Liu, and Wang, 2012), trade between the
US and Canada (Stoyanov, 2012), imports of Kenya, Mauritius, and Nigeria (Bouët and Roy,
2012), and most recently, Tanzanian imports from three developing country trading partners
(Epaphra, 2015). These papers have by and large confirmed the Fisman and Wei result that
higher tariff rates lead to greater tariff evasion for the majority of the selected bilateral country
pairs in these studies. From a methodological perspective, these papers have all followed
Fisman and Wei in employing disaggregated product level data at the HS-6 digit level for select
subsets of bilateral country pairs and relied on product level variation in tariff rates to identify
tariff evasion effects. As a result, while the combined body of evidence in this literature
suggests that higher tariff rates lead to greater evasion, the results cannot be considered
generalizable beyond the specific sets of countries examined. To the extent that this prior
research has been focused on particular country pairs where evasion is most likely to occur, our
knowledge on this subject may be biased when thinking about tariff evasion across much
broader scales and across broader sets of countries.
Possibly more important is the fact that disaggregated product level data between
select countries does not allow for estimation of many important country level characteristics
that may also influence exporter and importer decisions to misreport trade. Things which are
evident in many of the stories surrounding tariff evasion, like overall country level of regulatory
enforcement or the prevalence of organized crime. Data on these factors are simply not
available across disaggregated products and therefore cannot be identified at that level of
disaggregation4. To the extent that these country level characteristics are important,
4 A few papers such as Javorcik and Narciso (2008) and Mishra, Topalova and Subramanian (2008) have used
measures of product differentiation for certain product categories to make inferences about customs enforcement
on tariff evasion. The idea being that the more differentiated products are, the more difficult it is for customs
agents to catch tariff evaders relative to more homogeneous goods. These studies do find evidence of greater
tariff evasion in product categories that are more differentiated (and therefore harder to enforce). However, the
method is an indirect measure of enforcement and has only been applied to select product categories and select
country pairs.
4
identification of their effects can only be made using country level data and variation across
bilateral country pairs.
In this paper we depart from the disaggregated product approach to estimating tariff
evasion. We do so by first developing a firm level theory model of tariff evasion that
incorporates several new motivations for both importing and exporting firms to misreport
trade. We then use the model, along with a simple accounting identity, to develop a proxy
variable estimation strategy to obtain consistent estimates on model parameters on aggregated
country level bilateral trade data. There are several advantages to our approach. First, we are
able to estimate important policy relevant country level characteristics for which data is
available but have not previously been explored in prior literature. Among them are measures
of the strength of auditing and accounting standards across countries, country participation in
regional trade agreements (RTA’s), and costs associated with organized crime. Second, our
estimation strategy allows us to estimate the average tariff evasion effect across a wide variety
of importers and exporters. This allows for a far more generalizable test of the tariff evasion
effect across countries than in prior studies.
Using panel data on bilateral observations of reported imports and exports for 128
countries over 11 years, we find generalizable support for the hypothesis that higher tariffs lead
to greater underreporting of imports. This result however is not uniform across countries. The
effect is only robust for bilateral country pairs who are not members of an RTA. For bilateral
country pairs who are members of an RTA, the tariff evasion effect disappears. The reasoning is
quite simple but until now has never been explicitly tested. Countries who are members of an
RTA often face zero, or near zero, average tariff rates, eliminating tariffs as a motivation to
underreport to customs agents. In addition, we find that high income countries have a much
higher elasticity of underreporting imports than lower income countries. For bilateral country
pairs who are not members of an RTA, if the importer is a high income country a 1% increase in
average tariff rates leads to a 3% increase in underreporting of imports. If the importer is a low
income country, a 1% increase in average tariff rates leads to a 1% increase in underreporting
of imports. Our results provide strong evidence that tariff evasion is generally prevalent across
a wide range of countries who are not members of an RTA and that the elasticities of trade
5
evasion with respect to average tariff rates are not uniform across countries of different levels
of development.
In addition, we find robust evidence that stronger auditing and accounting standards in
exporting countries decreases underreporting to exporting country customs officials. In our
theory model we demonstrate that exporters also have reasons to underreport exports, such as
to avoid taxes in their domestic market or as a means of avoiding capital controls. We find that
a 10% increase in the strength of auditing and accounting standards in the exporting country
decreases underreporting of exports by 3.4%. From a policy perspective this has important
implications as it implies that countries can decrease underreporting of exports that lead to
losses in domestic tax revenues and circumvention of capital controls by increasing the strength
of their regulatory regime through more stringent auditing and accounting standards. This
effect is consistent across both high income and lower income countries.
Our theory model also assumes that misreporting to customs officials is not costless.
Extortion payments, bribes or payments for false documents are all assumed to be costs of
illegal misreporting for firms that wish to circumvent legal tax or tariff obligations. We proxy
these costs using a measure of organized crime costs imposed on firms in importing and
exporting countries. The results are consistent with greater costs of evasion leading to less
underreporting by both importers and exporters. However, the results are somewhat
dependent on sample selection and not robust to all specifications of the model.
Finally, our theory and empirical models also account for domestic tax evasion as well as
motivations for using trade misreporting as a means of evading capital controls in the importing
and exporting countries. We find evidence that tax rates in the exporting country lead to
greater underreporting of exports to exporting country customs officials, while proxy estimates
on shadow prices of capital controls are consistent with exporters using underreporting of
exports as a means of illicitly moving capital into the country.
While our model has many advantages over prior work it is important to be clear at the
outset about exactly what type of misreporting and evasion we are able to capture with the
aggregated trade approach, as well as forms of tariff evasion that we cannot. Simply, our
aggregated trade approach only allows us to estimate a pure misreporting effect. Our
6
aggregated model cannot capture tariff evasion that is the result of misclassifying products into
product categories that have lower tariff rates as misclassification effects are netted out in the
process of aggregating across industries. This has both disadvantages and advantages relative
to the studies using product level data. The disadvantage is that by netting misclassification out
in the aggregate data we are systematically underestimating total tariff evasion. In this sense,
our estimates should be viewed as a lower bound on the general tariff evasion effect. To the
extent that misclassification is also prevalent globally, then the total tariff evasion effect will be
larger than we can estimate here.
On the upside, our aggregated approach avoids having to address more difficult
specification and interpretation issues related to disentangling misreporting from
misclassification when using disaggregated data. More importantly, as mentioned above our
aggregated approach allows us to generally test for pure misreporting effects across a large set
of importers and exporters and estimate country specific characteristics that cannot be
identified using product level data.
In the next section we develop a microeconomic model of misreporting for importing
and exporting firms that leads to clear predictions for how various country characteristics affect
firm incentives to misreport trade. In Section III, we use the model in conjunction with an
accounting identity to develop an estimating equation of aggregate bilateral trade that uses
proxy variables for consistent estimation of unobserved deviations from the true value of trade
between countries. In section IV we further discuss the estimation strategy and describe the
data, while in section V. we present the results and discussion as they relate to the predictions
of the model. Finally, in sections VI and VII we present a variety of robustness tests and in
section VIII we conclude.
II. A Firm-Level Model of Trade Misreporting
Our model of trade evasion begins by assuming that in each industry i, in year t, there is
a representative exporting firm in country x and a representative importing firm in country m.
To simplify notation we omit subscripts i and t in the preceding model but it is understood that
the model pertains to industry specific bilateral trading pairs in a particular time period. The
representative exporting and importing firms privately negotiate and know the true value of
7
free on board (FOB) exports, xV , but this value is not known by customs officials. This FOB
value is the true value of goods when they arrive at the exporting port before shipping to the
importing country. Formally, let p be the true price in a common international currency (US$)5
and q the true quantity of good i that are privately negotiated between the exporter and
importer, such that qpVx ×= . We assume that x
V is an equilibrium value determined by
profit maximizing decisions of both the importing and exporting firms. The underlying structure
of the market for each individual firm may be perfectly competitive or imperfectly competitive
but we make no assumptions on the nature of competition. We simply make the assumption
that each firm is maximizing profits, given the market structure and competition that they face,
and that they know the true profit maximizing price ( p ), quantity ( q ), and therefore value
( xV ) that is privately negotiated.
Prior to shipping to the importing country, each exporting firm has to make a cost
minimizing decision on how they are going to report the value of the goods shipped. Let xδ be
the percentage deviation from the true value of exports that the firm reports to the exporting
country customs agents. Firms may choose to underreport the value of exports ( xδ < 0), report
the true value of exports ( xδ = 0), or over-report the true export value ( xδ > 0). Given that xδ
represents the percentage deviation from the true value of exports, the model is flexible to
how those deviations take place. That is, deviations may come in the form of misreporting
prices (such as with transfer pricing) or to deviations in quantities as they have the same impact
on the overall value reported.
Why would firms choose to misreport the value of their exports? We consider three
primary motivations. First, exporters may face product, sales, or service taxes on the proceeds
of goods shipped. By reporting a lower value of exports than the true value they decrease their
overall tax burden. Likewise, an exporter that receives export subsidies has an incentive to
over-report the true export value. The goal of this paper is not to disentangle the wide variety
5 We could assume that the value of exports is negotiated in the exporting country local currency unit (LCU) and
then later introduce exchange rates to convert to the importer LCU. However, this needlessly complicates the
model and has no bearing on the primary results of the model. Thus, it is simpler to assume that all transactions
are negotiated in a common real currency value.
8
of various taxes and subsidies on exported goods, but rather to control for these tax
motivations for misreporting. Thus, we define the net exporting country tax rate on goods
shipped to an importing country, 0≥xθ , as well as export subsidies, .0≥xs
Second, we allow for exporters to be faced with potential capital controls by the
exporting country. In an effort to stabilize currency and capital account fluctuations, some
countries have instituted capital controls to constrain the amount of capital flowing into or out
of the country (Prasad and Rajan, 2008). Countries with more stringent capital controls may
incentivize firms to misreport trade transactions in an effort to elude capital controls and move
money in or out of the country (Patnaik, Gupta, and Shah, 2012). We assume that
macroeconomic capital controls across countries imply an effective shadow tax xξ of using
export misreporting as a means of capital control evasion and is assumed to be exogenous from
the individual firm’s perspective.
Third, we consider the role that organized crime plays in the choice of exporters to
misreport the true value of exports. Specifically, exporting firms in countries with a greater
degree of organized crime are more likely to face extortion payments and bribes if they attempt
to misreport the true value of exported goods (Dutt and Traca, 2010). We model this
“extortion” tax or bribe, 0≥xλ , as a cost to be paid to misreport exports.
Each of these motivations is represented in the representative exporting firm’s cost
function, xC , for deciding how much of the true value of exported goods, x
V , to report to the
exporting country customs agent:
( )( ) [ ]( )xxx
x
xxxmxxxxxxxxVAzVsVC ξδ
δλθδ ++ΩΨ+−+=
2
2),(1 . (1)
The first term, ( )( )xxxxsV −+ θδ1 , represents the net tax bill paid to the exporting country
officials of shipping ( )xδ+1 of the true value of exports, xV , negotiated with the importer. The
second term, [ ]( )2
2),(
x
xxxmxxxAzV
δλ+ΩΨ , represents the costs associated with illegally
misreporting the value of exports and is comprised of two potential costs. The first component,
9
[ ]( )2
2),(
x
xxmxxxAzV
δΩΨ , is the expected cost of detection by authorities for misreporting.
The term, 1)(0 ≤⋅Ψ< x , is the probability that a firm gets caught misreporting and is a function
of the strength of the exporting country’s auditing and accounting standards, xz , and whether
country x and m are members of the same RTA, xm
A . Stronger auditing and accounting
standards and participation in trade agreements are assumed to increase the probability of
detection such that 0≥∂
Ψ∂x
x
z and 0≥
∂
Ψ∂xm
x
A. Stronger auditing and accounting standards are
expected to increase detection for obvious reasons, but participation in RTA’s may also increase
detection if RTA participation leads to harmonization of trade classifications, product standards,
or cooperation in enforcement that make it more difficult for firms to misreport and evade
customs officials. The variable, 0>Ω x , is the country specific marginal penalty for
misreporting. This penalty may take the form of fines or the value of jail time or other
punishment that an exporter may face. Like Swenson (2001) and Ferrantino, Liu, and Wang
(2012) we assume that the degree of the penalty is linearly increasing in the volume of trade
and quadratic in the degree to which the firm misreports their exports.
The term [ ]( )2
2
x
xxV
δλ reflects the fact that penalties for getting caught may not be the
only costs associated with illegal misreporting of exports. In order to effectively misreport
exports, firms may also pay costs to effectively hide their decision to misreport. These costs
may include payments for counterfeit shipment receipts, bribes to customs inspectors,
extortion payments to local mafia or corrupt officials, or for costs associated with laundering
proceeds that are not reported. We loosely term these costs as costs related to organized
crime. Like the expected cost of detection, we assume that these ‘organized crime’ costs are
proportionally increasing in the volume of trade and quadratic in the degree of misreporting. It
is important to note that firms that choose not to misreport trade ( xδ = 0) face no expected
penalties associated with getting caught, nor do they incur penalties associated with organized
crime. It is only when under or over-reporting that these costs become relevant.
10
The last term in equation (1), xxxV ξδ , represents the net costs associated using
misreporting as a mechanism to avoid capital controls. When 0<xξ , firms have an incentive to
over-report the true value of exports to move capital into the exporting country. This could be
accomplished by over-reporting the value of exports to exporting country officials by xδ and
then moving capital equal to xxV δ , which is the difference between the actual value of exports
and the reported value of exports, from the importing country into the exporting country.
Conversely, when 0>xξ , firms have an incentive to under-report the true value of exports and
move capital out of the exporting country. This could be accomplished by underreporting the
value of exports to the exporting country official by - xδ and leaving the difference, - xxV δ , in
an account in the importing country to be saved or invested abroad. A shadow value of 0=xξ
could imply an exporting country has no capital controls or simply that the macroeconomic
conditions imply a zero shadow price of using trade misreporting as a channel for avoiding
capital controls.
Similarly, the representative importer in country m, imports and reports to customs
agents a value that is based on the true cost, insurance, and freight (CIF) value of goods shipped
from country x to country m. That is, the true CIF trade value, m
V is the true trade value
negotiated in the exporting country in the common international currency, xV , multiplied by
( )xmxmDσ , a multiplier that adjusts the true privately negotiated FOB value for CIF costs in
transporting the goods from country x to country m. Formally,
( )xmxmxmDVV σ= . (2)
Cost and freight multiplier charges, ( ) 1>⋅σ , from country x to country m are a function of
geographic and cultural characteristics, xmD , such as distance, common borders or common
language spoken, as well as other characteristics such as the quality of transportation
infrastructure between the two countries.
The representative importer knows the true private value of goods negotiated with the
representative exporter, xV , as well as the true CIF costs, and must decide whether to report
11
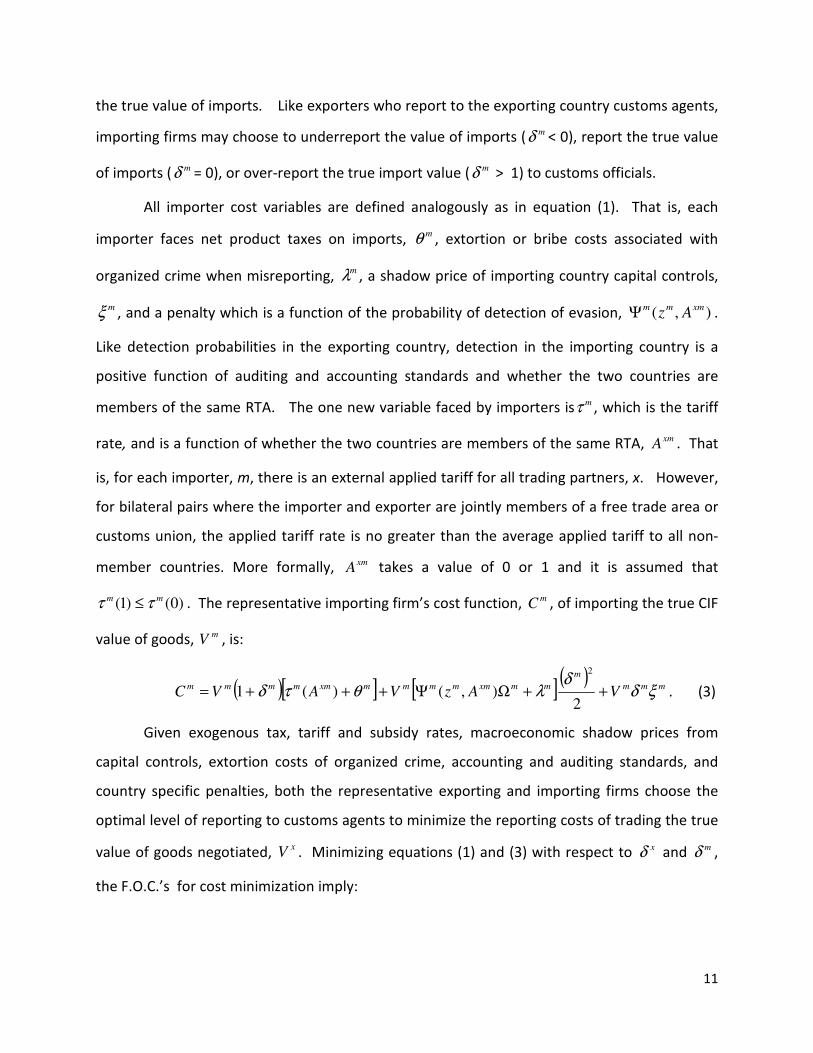
the true value of imports. Like exporters who report to the exporting country customs agents,
importing firms may choose to underreport the value of imports ( mδ < 0), report the true value
of imports ( mδ = 0), or over-report the true import value ( mδ > 1) to customs officials.
All importer cost variables are defined analogously as in equation (1). That is, each
importer faces net product taxes on imports, mθ , extortion or bribe costs associated with
organized crime when misreporting, mλ , a shadow price of importing country capital controls,
mξ , and a penalty which is a function of the probability of detection of evasion, ),(xmmm
AzΨ .
Like detection probabilities in the exporting country, detection in the importing country is a
positive function of auditing and accounting standards and whether the two countries are
members of the same RTA. The one new variable faced by importers is mτ , which is the tariff
rate, and is a function of whether the two countries are members of the same RTA, xmA . That
is, for each importer, m, there is an external applied tariff for all trading partners, x. However,
for bilateral pairs where the importer and exporter are jointly members of a free trade area or
customs union, the applied tariff rate is no greater than the average applied tariff to all non-
member countries. More formally, xmA takes a value of 0 or 1 and it is assumed that
)0()1( mm ττ ≤ . The representative importing firm’s cost function, mC , of importing the true CIF
value of goods, mV , is:
( )[ ] [ ]( )mmm
m
mmxmmmmmxmmmmmVAzVAVC ξδ
δλθτδ ++ΩΨ+++=
2),()(1
2
. (3)
Given exogenous tax, tariff and subsidy rates, macroeconomic shadow prices from
capital controls, extortion costs of organized crime, accounting and auditing standards, and
country specific penalties, both the representative exporting and importing firms choose the
optimal level of reporting to customs agents to minimize the reporting costs of trading the true
value of goods negotiated, x
V . Minimizing equations (1) and (3) with respect to xδ and mδ ,
the F.O.C.’s for cost minimization imply:
12
+ΩΨ
+−−=
xxxmxx
xxx
x
Az
s
λ
ξθδ
),(, and (4)
+ΩΨ
++−=
mmxmmm
mmxmm
m
Az
A
λ
ξθτδ
),(
)(. (5)
The above optimal conditions imply several things about the relationship between taxes, tariffs,
organized crime, accounting standards, and RTA membership. First, both importers and
exporters may have incentives to underreport or over-report the true value of trade to customs
officials. The denominators of the terms in brackets in equations (4) and (5) are strictly
positive, so the decision to underreport or over-report rests on the sign of the numerators in
both equations. If the numerators of the terms in brackets are positive, indicating that the
firms face net overall costs of trade, then firms will strategically underreport the true value of
trade. This will be true whenever the combined costs of taxation and tariffs outweigh export
subsidy payments or incentives to avoid capital controls. When the numerators of the terms in
brackets in equation (4) and (5) are negative, such as in industries or countries that receive
large export subsidies or where capital controls are severe enough to generate a large negative
shadow price on capital control evasion, firms will strategically over-report the true value of
trade.
Regardless of the overall sign of xδ and mδ in equations (4) and (5), there are several
variables for which the marginal impacts can be signed irrespective of the incentive to over
report or underreport. First, the marginal effects of greater net tax rates
<
∂
∂<
∂
∂0,0
m
m
x
x
θ
δ
θ
δ
are negative for both exporters and importers. All else equal, a firm that has an incentive to
underreport ( )0, <mx δδ , underreports more when tax rates increase while a firm that has an
incentive to over-report ( )0, >mx δδ over-reports less as tax rates increase. Conversely, the
marginal effect of greater export subsidy payments to exporters is positive
>
∂
∂0
x
x
s
δ. Second,
exporters with incentives to underreport ( )0, <mx δδ , underreport less when export subsidy
13
rates increase while exporters with an incentive to over-report ( )0, >mx δδ , over-report even
more as subsidy rates increase.
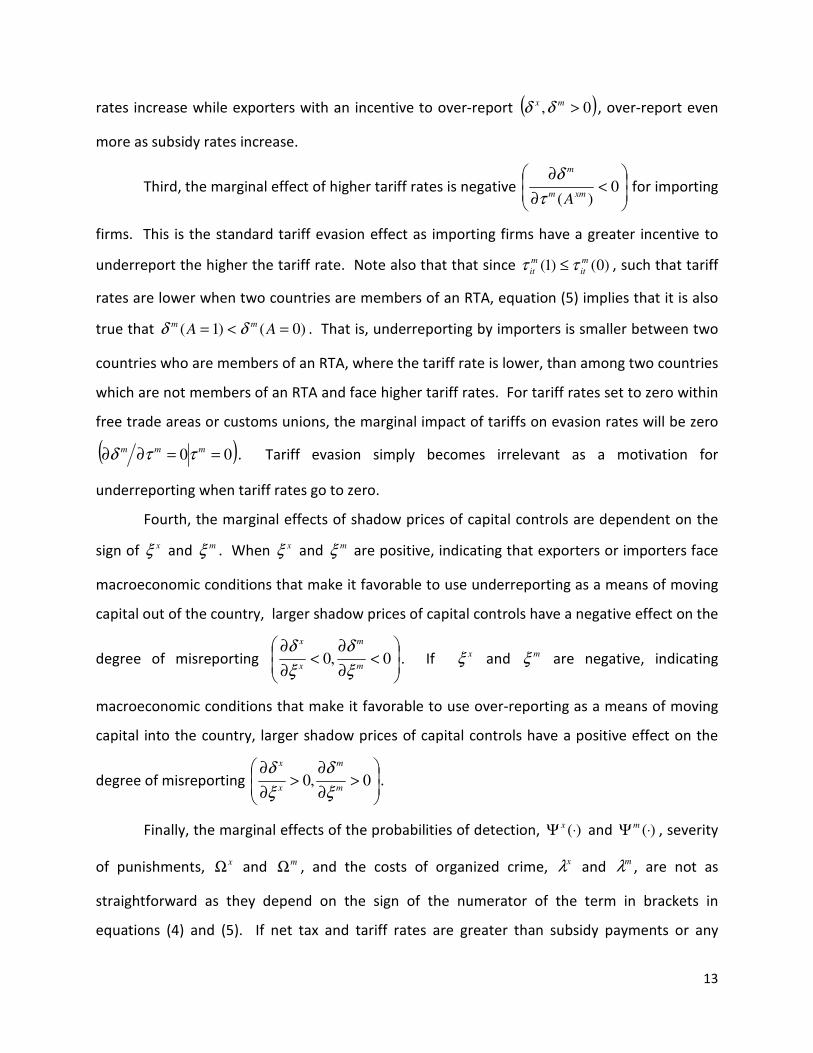
Third, the marginal effect of higher tariff rates is negative
<
∂
∂0
)( xmm
m
Aτ
δ for importing
firms. This is the standard tariff evasion effect as importing firms have a greater incentive to
underreport the higher the tariff rate. Note also that that since )0()1( m
it
m
it ττ ≤ , such that tariff
rates are lower when two countries are members of an RTA, equation (5) implies that it is also
true that )0()1( =<= AAmm δδ . That is, underreporting by importers is smaller between two
countries who are members of an RTA, where the tariff rate is lower, than among two countries
which are not members of an RTA and face higher tariff rates. For tariff rates set to zero within
free trade areas or customs unions, the marginal impact of tariffs on evasion rates will be zero
( )00 ==∂∂ mmm ττδ . Tariff evasion simply becomes irrelevant as a motivation for
underreporting when tariff rates go to zero.
Fourth, the marginal effects of shadow prices of capital controls are dependent on the
sign of xξ and mξ . When xξ and mξ are positive, indicating that exporters or importers face
macroeconomic conditions that make it favorable to use underreporting as a means of moving
capital out of the country, larger shadow prices of capital controls have a negative effect on the
degree of misreporting
<
∂
∂<
∂
∂0,0
m
m
x
x
ξ
δ
ξ
δ. If xξ and mξ are negative, indicating
macroeconomic conditions that make it favorable to use over-reporting as a means of moving
capital into the country, larger shadow prices of capital controls have a positive effect on the
degree of misreporting
>
∂
∂>
∂
∂0,0
m
m
x
x
ξ
δ
ξ
δ.
Finally, the marginal effects of the probabilities of detection, )(⋅Ψ x and )(⋅Ψ m , severity
of punishments, xΩ and mΩ , and the costs of organized crime, xλ and
mλ , are not as
straightforward as they depend on the sign of the numerator of the term in brackets in
equations (4) and (5). If net tax and tariff rates are greater than subsidy payments or any
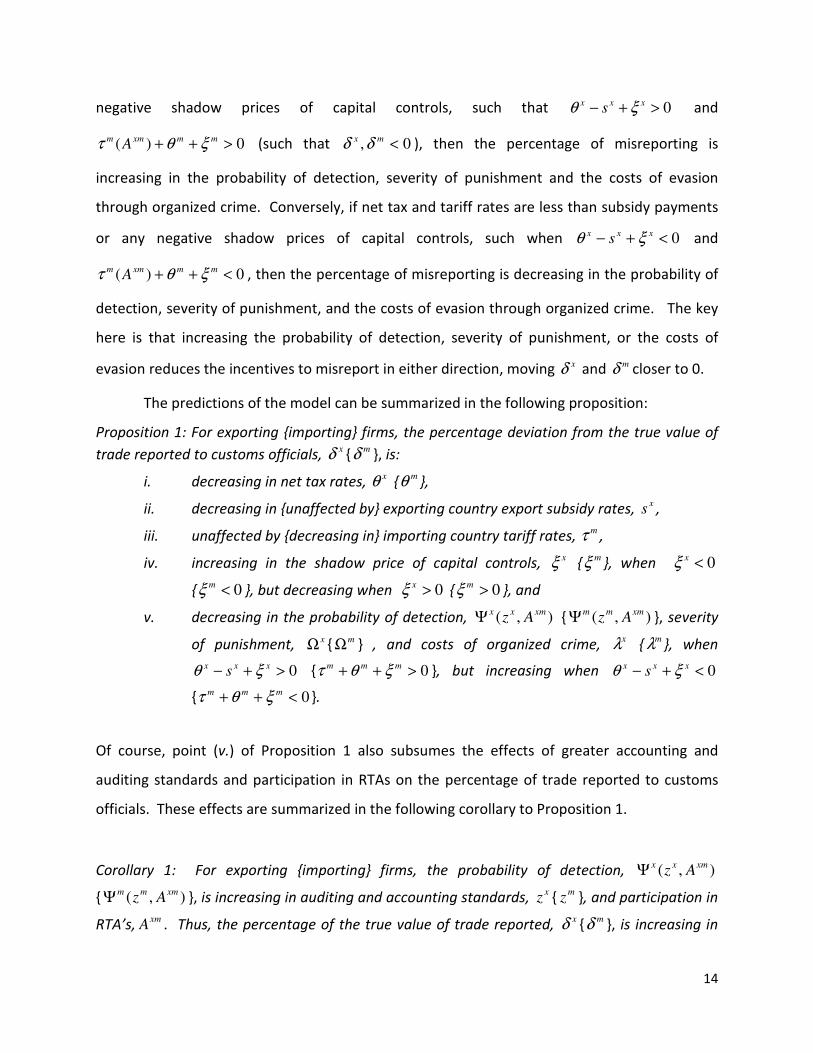
14
negative shadow prices of capital controls, such that 0>+− xxxs ξθ and
0)( >++ mmxmmA ξθτ (such that 0, <mx δδ ), then the percentage of misreporting is
increasing in the probability of detection, severity of punishment and the costs of evasion
through organized crime. Conversely, if net tax and tariff rates are less than subsidy payments
or any negative shadow prices of capital controls, such when 0<+− xxxs ξθ and
0)( <++ mmxmmA ξθτ , then the percentage of misreporting is decreasing in the probability of
detection, severity of punishment, and the costs of evasion through organized crime. The key
here is that increasing the probability of detection, severity of punishment, or the costs of
evasion reduces the incentives to misreport in either direction, moving xδ and mδ closer to 0.
The predictions of the model can be summarized in the following proposition:
Proposition 1: For exporting importing firms, the percentage deviation from the true value of
trade reported to customs officials, xδ
mδ , is:
i. decreasing in net tax rates, xθ
mθ ,
ii. decreasing in unaffected by exporting country export subsidy rates, x
s ,
iii. unaffected by decreasing in importing country tariff rates, mτ ,
iv. increasing in the shadow price of capital controls, xξ
mξ , when 0<xξ
0<mξ , but decreasing when 0>xξ 0>mξ , and
v. decreasing in the probability of detection, ),(xmxx
AzΨ ),(xmmm
AzΨ , severity
of punishment, xΩ mΩ , and costs of organized crime, xλ
mλ , when
0>+− xxxs ξθ 0>++ mmm ξθτ , but increasing when 0<+− xxx
s ξθ
0<++ mmm ξθτ .
Of course, point (v.) of Proposition 1 also subsumes the effects of greater accounting and
auditing standards and participation in RTAs on the percentage of trade reported to customs
officials. These effects are summarized in the following corollary to Proposition 1.
Corollary 1: For exporting importing firms, the probability of detection, ),(xmxx
AzΨ
),(xmmm
AzΨ , is increasing in auditing and accounting standards, x
z m
z , and participation in
RTA’s,xm
A . Thus, the percentage of the true value of trade reported, xδ
mδ , is increasing in
15
auditing and accounting standards and participation in RTA’s when 0>+− xxxs ξθ
0>++ mmm ξθτ , but decreasing when 0<+− xxxs ξθ 0<++ mmm ξθτ .
Like the effects of higher organized crime costs, greater accounting and auditing
standards or participation in free trade agreements that increase the probability of
misreporting detection, decrease the incentive to misreport in both directions. In the following
section we develop an empirical strategy for using the predictions of the model to estimate the
impact of these various factors on reporting gaps in international trade data.
III. An Aggregated Empirical Model of Trade Misreporting
Proposition 1 and Corollary 1 provide straightforward predictions on how the
percentage of true exports and imports reported to customs officials are impacted by a variety
of factors. From an empirical standpoint there are challenges to testing these predictions due
to the fact that we cannot directly observe the degree to which firms misreport exports and
imports. In this section, we develop a proxy variable empirical strategy to account for
unobservable misreporting by importers and exporters, using data on observable
characteristics that come directly from the theory model.
To begin, we define two potential types of reporting error. First, as discussed in the
model above importers and exporters have many incentives to underreport or over-report their
true trade values to customs agents. We refer to this type of reporting error as strategic
reporting error. Second, we recognize that in a complex trading world with many different
agents and reporting mechanisms, random errors in reporting are also certain to occur. We
refer to this sort of error as random reporting error.
We define x
mitE as the bilateral value of exports from country x to country m in industry i
in year t that are reported to the exporting country customs agents. Similarly, m
xitI is defined as
the value of the same bilateral transaction to importing country customs agents for importing
country m, from country x, in industry i and year t. In a world where there is no strategic
reporting error, no random reporting error, and no CIF charges between bilateral country pairs,
reported exports, x
mitE , and reported imports, m
xitI , are just equal to the true value of trade
negotiated by representative importers and exporters, x
mitV , such that for each industry i,
16
x
mit
m
xit
x
mit VIE == . (6)
Summing equation (6) over all industries we get aggregate reported exports and imports
and can rewrite the identity as
x
mt
x
mt VE = and x
mt
m
xt VI = , (7)
where ∑=
=n
i
x
mit
x
mt EE1
, ∑=
=n
i
x
mit
x
mt VV1
, and ∑=
=n
i
m
xit
m
xt II1
, respectively. Equation (7) simply says that
in the absence of strategic reporting errors, random reporting errors, or CIF charges, aggregate
reported bilateral imports and exports are equal to the true value of bilateral imports and
exports negotiated by firms across industries for each bilateral country pair.
Of course, strategic and random reporting errors do occur. The reported value of
exports and imports in equation (7) may deviate from the true value traded for two reasons.
First, as demonstrated in the previous section, firms have reasons to strategically misreport
their true values. Given that our empirical analysis seeks to identify country level, rather than
industry level, characteristics, we define the average level of strategic reporting deviations of
exports and imports from country x to country m in year t as
∑=
=n
i
x
mit
x
mtn 1
1δδ and ∑
=
=n
i
m
xit
m
xtn 1
1δδ . (8)
In addition to firms strategic misreporting of the true value of exports and imports,
there is a second form of deviation in the form of random reporting error, x
mitε and m
xtε . Again,
because we are interested in bilateral country level characteristics we define the average
unobserved random reporting error for exports and imports as
∑=
=n
i
x
mit
x
mtn 1
1εε and ∑
=
=n
i
m
xit
m
xtn 1
1εε . (9)
Reported imports, m
xitI , also deviate from the true value of imports negotiated in the
exporting country for a third reason. Reported imports include CIF charges of transporting
goods from country x to country m, so reported imports are larger than the true FOB export
values. Thus, we define country level measures of average strategic importer CIF costs as
∑=
=n
i
xm
it
xm
tn 1
1σσ . (10)

17
It is important to note here that the mean values of x
mtδ , m
xtδ , x
mtε , m
xtε , xm
tσ are all
theoretically well-defined but unobservable by the customs official and econometrician.
Adjusting aggregate bilateral reported exports and imports in equation (7) for average CIF costs,
strategic misreporting, and random reporting errors in equations (8)-(10) we get the identities:
( ) x
mt
x
mt
x
mt
x
mt VE εδ+= 1 , (11)
and
( ) m
xt
m
xt
xm
t
x
mt
m
xt VI εδσ += 1 , (12)
where x
mtε and m
xtε are assumed to be log normally distributed, and 1>xm
tσ . Equations (11)
and (12) are accounting identities that demonstrate that customs officials, and therefore
researchers, only observe the reported aggregate values of FOB exports, x
mtE , and CIF imports,
m
xtI , which are functions of four unobserved country characteristics: (i) the true value of goods
traded, (ii) strategic misreporting, (iii) random error, and (iv) CIF costs.
Taking the ratio of aggregate reported imports in equation (12) to the aggregate
reported exports in equation (11) yields:
( )( ) x
mt
x
mt
m
xt
m
xt
xm
t
x
mt
m
xt
E
I
εδ
εδσ
+
+=
1
1. (13)
In equilibrium, private firms and private sellers know the true value of goods that are
negotiated between the importer and exporter such that the true unobserved value of x
mtV
drops out. The only deviations in reported imports and reported exports are due to CIF
charges, the degree to which importers and exporters strategically misreport trade values, and
random reporting errors. Taking the log of both sides of equation (13) we get:
( ) ( ) xmt
x
mt
m
xt
xm
t
x
mt
m
xt EI εδαδασα ++−++=− 1ln1lnlnlnln 321, (14)
where x
mt
m
xtxmt εεε lnln −= is a normally distributed error term for the bilateral pair, xm, in year
t and we have included the parameters 1321 === ααα simply to help facilitate the discussion
of the estimation strategy to follow. The above equation implies that the aggregate bilateral
reporting gap, defined as x
mt
m
xt EI lnln − , can be estimated as a log linear function of average CIF
costs, xm
tσ , and the equilibrium average misreported values of imports and exports, m
xtδ and
18
x
mtδ . In theory, if we had data on xm
tσ , m
xtδ , and x
mtδ we could consistently estimate 1α ,
2α ,
and 3α , but direct data on CIF charges and the average percentages misreported are not
observable. Fortunately, our theory model suggests a number of proxy variables that are
observable as well as predictions for how those variables will impact the trade gap through
xm
tσ , m
xtδ , and x
mtδ . We define a vector of proxy variables for CIF costs, xm
tX , that are
correlated with xm
tσ but do not directly affect the trade gap x
mt
m
xt EI lnln − as
σσ εσ t
xm
t
xm
t += Xβln , (15)
where σβ is a vector of coefficients on the CIF proxy variables to be estimated and σε t is a mean
zero, normally distributed error. Likewise, we define a set of potential proxy variables for
( )m
xtδ+1 and ( )x
mtδ+1 as ( )m
t
m
t
m
t
m
t
m
t
xm
t
m
xt zA τξλθ ,,,,,∈P and ( )x
t
x
t
x
t
x
t
xm
t
x
mt zA ξλθ ,,,,∈P , where
variables with bars indicate country average values. The theory suggests that strategic
misreporting is a function of participation in RTA’s ( )xm
tA , net tax rates ( )x
t
m
t θθ , , accounting
and auditing standards ( )x
t
m
t zz , organized crime costs ( )x
t
m
t λλ , , shadow prices on capital
controls ( )x
t
m
t ξξ , , and tariff rates ( )m
tτ . Thus, any of these variables are valid potential proxies
for unobserved strategic misreporting by importers and exporters. We define linear
approximations of unobserved strategic misreporting by importers and exporters as
( ) m
t
m
xt
mm
xt εδ +=+ Pβ1ln , (16)
and
( ) x
t
x
mt
xx
mt εδ +=+ Pβ1ln . (17)
Where, again, mβ and xβ are vectors of coefficients on the proxy variables to be estimated and
m
tε and x
tε are mean zero normally distributed errors. Plugging equations (15)-(17) into
equation (14) and simplifying we get:
**
0lnln xmt
x
mt
xm
xt
mxm
t
x
mt
m
xt EI εβ σ +−++=− PβPβXβ , (18)
where ( )x
t
m
txmtxmt εεεε −+=* . From equation (14) we know that the trade gap is derived from
two simple accounting identities in equations (11) and (12). The implication for our model is
that the trade gap in equation (18) is only directly influenced by xm
tσ , m
xtδ , and x
mtδ , which are
19
all unobservable. Since none of the proxy variables used as explanatory variables in equations
(15) – (17) directly impact the identity in equation (14), and only impact the trade gap indirectly
through xm
tσ , m
xtδ , and x
mtδ , the coefficients in equation (18) are valid proxies6 and yield
consistent estimators of σβ , mβ , and xβ .
IV. Estimation Strategy and Data
Our empirical strategy is to estimate equation (18) to determine how country level
proxy characteristics, m
xtP and x
mtP , from our theory model influence the reporting gap while
also controlling for proxies of CIF costs, xm
tX . It is critical to recognize that consistent
estimation of equation (18) simply requires that we have at least one valid proxy for each of
,m
xtP x
mtP , and xm
tX . Even though our theory suggests a number of potential proxies,
( )m
t
m
t
m
t
m
t
m
t
xm
t
m
xt zA τξλθ ,,,,,∈P and ( )x
t
x
t
x
t
x
t
x
t
xm
t
x
mt zsA ξλθ ,,,,,∈P , of strategic misreporting and
the gravity model trade literature suggests several valid instruments that are correlated with
CIF costs, we need not include all proxy variables for consistent estimation. The coefficients
,σβ mβ , and xβ are consistent and do not suffer from omitted variables bias because m
xtP , x
mtP ,
and xm
tX do not have a direct impact on the trade gap and are uncorrelated with the random
component of the error term.
The reporting gap is measured using aggregate bilateral trade values between 128
countries for the years 2002-20127. The data comes from the UN Comtrade database8 and
contains annual observations on aggregate FOB exports reported by each exporting country
and CIF imports reported by each importing country for each bilateral country pair. Thus, each
bilateral flow is measured and recorded twice; once by the exporting country and once by the
importing country.
6 See chapter 4 of Wooldridge (2002) for further discussion of the consistency of coefficients in proxy variable
estimation. 7 Bilateral trade data is available for many more years than we examine in this paper, but our analysis is
constrained by the years for which we have proxy variable data on the strength of accounting and auditing
standards and organized crime costs, which is 2002-2012. 8 Database can be found at http://comtrade.un.org/db/.
20
We do not directly observe the explanatory variables xm
tσ , m
xtδ , or x
mtδ , but we have a
number of observable proxies for them and our theoretical model provides us with clear
predictions of how those proxies affect the reported trade gap through these variables. First,
our proxies for CIF costs, xm
tX , include time invariant geographic and cultural variables that are
standard measures for trade and transport costs in a large gravity model trade literature9.
These include bilateral distance between countries and whether countries share a common
border or common language10. Greater distance is expected to increase CIF costs and have a
positive effect on the trade gap, while sharing a common border or common language are
expected to decrease CIF costs and thus have a negative impact on the reported trade gap. In
addition, we include a measure of the bilateral quality of port infrastructure between the two
countries as a time varying proxy of CIF costs. Port quality comes from executive survey data
from the Global Competitiveness Report (GCR)11 for the years 2002-2012. The survey question
relating to port quality can be found in the first row of Table 1 where countries with developed
ports that are among the world’s best receive the highest scores on a scale from 1 to 7. To
calculate a bilateral CIF measure we multiply the exporter and importer scores in each year.
Bilateral pairs where both countries have high port quality receive the highest scores, while
bilateral pairs where both countries have underdeveloped ports have the lowest scores. Better
or more efficient bilateral port infrastructure between the two countries decreases CIF costs
(Clark, Dollar, and Micco, 2004) and so we expect better bilateral port infrastructure quality to
have a negative effect on the reported trade gap.
Several observable proxies for importer and exporter strategic misreporting, m
xtP and
x
mtP , are also suggested by the theory model. Our primary interest in this paper is to obtain
consistent estimates of the impacts of tariff rates, RTA participation, the strength of accounting
and auditing standards, and organized crime costs on the reported trade gap via their
9 See Head and Mayer (2013) for a survey of the gravity model literature and variables used for approximating
transport costs. 10
Bilateral distance, common border, and common language are from the CEPII gravity database which can be
found at http://www.cepii.fr/CEPII/en/bdd_modele/presentation.asp?id=8 . 11
Country level characteristics from survey questions from the GCR have been used extensively in empirical
studies on international trade and investment. See Carr et al. (2001), Yeaple (2003), Javorcik and Wei (2004),
Eckholm et al. [2007], and Kellenberg (2012) for a few of many examples.
21
influences on strategic misreporting. For each of these variables we briefly discuss the
expected sign on their coefficients as suggested by the theory as well as the data used for
estimation.
From Proposition 1(iii) we know that importing country strategic misreporting is
decreasing in importing country tariff rates, so the coefficient on tariff rates is expected to have
a negative impact on the trade gap. Data on weighted average tariff rates for each country and
year were obtained from the WBDI database12. Dummy variables for whether two countries
are members of an RTA, which may be a Free Trade Area (FTA), Customs Union (CU), or
Economic Integration Agreement (EIA) was generated using a data generating program
described in de Sousa (2012)13. Trade agreements are expected to have two possible effects on
the misreporting of importing countries. First, is what might be referred to as a minimizing of
the tariff evasion effect as RTA’s that generate zero (or near zero) average aggregate tariff rates
with member countries are expected to have zero marginal effects of tariffs on misreporting of
imports. Again, this is evidenced by taking the partial derivative of equation (5) with respect to
mτ when 0=mτ . To measure this effect we interact the RTA dummy with the average
weighted tariff rate to distinguish between the marginal tariff evasion effects among RTA
members relative to marginal effects between bilateral country pairs who are not members of
an RTA. The combined marginal impact of tariff rates on the trade gap should be zero for
members of the same RTA if average tariff rates within the RTA are near zero. The simple
intuition is that importers inside of an RTA that face zero (or near zero) tariff rates have little
incentive to underreport imports.
The second potential effect of RTA’s is through the probability of detection for firms in
importing and exporting countries that attempt to misreport. However, the signing of the
coefficient on the RTA dummy is not possible for a number of reasons. First, as indicated in
12
Simple un-weighted average tariff rates are also available from the WBDI. However, the simple correlation
between un-weighted and weighted average tariff rates is 0.93. All of the regressions in the following discussion
were also run with the un-weighted average tariff rates with virtually identical results. Thus, we only present the
results using the weighted average tariff rates as this should theoretically be a more accurate measure of a
countries overall average tariff rate. 13
The Stata do-files for the RTA program can be found at http://jdesousa.univ.free.fr/data.htm. These files have
been used in several prior studies on RTA’s which include Head, Mayer, and Ries (2010), Baghdadi et al. (2013) and
Head and Ries (2010) among others.
22
Corollary 1, the sign of the marginal impact of RTA’s through the probability of detection is
conditional on the sign of the numerators in equations (4) and (5). Further, the marginal impact
of RTA’s on importers and exporters cannot be distinguished as the indicator xm
tA is a bilateral
proxy and is therefore the same for both sets of countries. In general, if participation in trade
agreements increases the probability of detection in both countries then misreporting in both
countries should fall. However, the net effect of this on our estimated trade gap will depend on
the direction and relative magnitude of this effect on importers and exporters Thus, the
coefficient on RTA’s should be interpreted as the net, non-tariff, effect of RTA’s on the trade
gap and could be positive or negative.
Like port quality data, country data on average accounting and auditing standards
( )x
t
m
t zz , and costs of organized crime ( )x
t
m
t λλ , come from the GCR surveys. The specific
questions relating to the strength of auditing and accounting standards and organized crime
costs can be found in the second and third rows of Table 1. The questions are both on a 1 to 7
scale with higher scores indicating stronger auditing and accounting standards for that variable.
To be consistent with the theory section we’d like to have the organized crime cost proxy
reflect higher values for countries with greater costs of organized crime activity and lower
values for countries with lower organized crime costs. However, the survey question asks
about costs of organized crime in such a way that lower organized crime costs receive a higher
valued score (i.e. 7 = does not impose significant costs). To ease interpretation, we rescale the
organized crime values such that a value of 7 corresponds to countries with the greatest costs
of organized crime and 1 corresponds to countries with the lowest organized crime costs.
Signing the coefficients on the proxies ,,,m
t
x
t
m
t zz λ and x
tλ depends on whether countries
have an overall incentive to underreport or over-report. If the numerator of the term in
brackets in equation (4) is positive, indicating that tax rates outweigh any potential subsidies or
negative shadow prices of capital control evasion, then increases in x
tz or x
tλ are positively
correlated with x
mtδ and have a negative marginal impact on the trade gap in equation (18).
The intuition is straightforward. Holding imports constant and assuming exporters are
underreporting, stronger accounting and auditing standards that increase the probability of

23
detection, or increases in organized crime costs that make misreporting more costly, decrease
exporter strategic underreporting, decreasing the trade gap. If the numerator in the term in
brackets in equation (4) is negative, indicating that potential subsidies or a negative shadow
price of capital control evasion are greater than tax rates, then increases in x
tz or x
tλ are
negatively correlated with x
mtδ and have a positive marginal impact on the trade gap. Again,
the intuition is straightforward. If we assume exporters are over-reporting and hold imports
constant, stronger auditing and accounting standards that increase the probability of detection
or greater organized crime costs decrease exporter strategic over-reporting, increasing the
trade gap.
Identical reasoning can be applied for signing m
tz and m
tλ for importers. If the
numerator of the term in brackets in equation (5) is positive, indicating that tax rates and tariffs
outweigh any potential subsidies or negative shadow prices of capital control evasion,
increases in m
tz or m
tλ are positively correlated with m
xtδ and have a positive marginal impact
on the trade gap. The positive marginal impact on the trade gap occurs because, holding
exports constant, increases in m
tz or m
tλ decrease strategic underreporting by importers,
increasing the reported trade gap. Likewise, if the numerator of the term in brackets in
equation (5) is negative, increases in m
tz or m
tλ are negatively correlated with m
xtδ and have a
negative marginal impact on the trade gap. In this last case, the trade gap falls as importers
decrease the extent of their over-reporting activity. To summarize the predictions on stronger
accounting and auditing standards and greater organized crime costs we present their
predicted signs conditional on the overall signs of xδ and mδ in Table 2, while descriptive
statistics on the all of the data used in the regression results to follow are provided in Table 3.
V. Results and Discussion
Table 4 presents the results of several regressions of equation (18). To demonstrate the
consistency of the proxy variable approach outlined above, in columns (1) – (3) we run the basic
regression using generalized least squares (GLS) and progressively adding more proxies in each
regression. Column (1) contains estimates of the basic model using only one proxy for each of
24
the three vectors of potential proxies m
xtP , x
mtP , and xm
tX , with tariff rates the proxy for m
xtP ,
exporter auditing and accounting standards the proxy for x
mtP , and bilateral port quality the
proxy for xm
tX . The coefficients on tariffs and port quality are statistically significant and of the
expected sign. All else equal, greater tariffs and better bilateral port quality decrease the
reported CIF value of imports, generating a negative impact on the reported trade gap.
Likewise, the negative and statistically significant coefficient on the strength of auditing and
accounting standards in the exporting country is consistent with the scenario where exporting
countries have aggregate incentives to underreport exports. Holding reported imports
constant, stronger auditing and accounting standards in the exporting country induce firms to
report a greater percentage of their true exports, decreasing the reported trade gap.
In column (2) we add bilateral distance, a common border dummy, and a common
official language dummy as additional proxies for xm
tX . All three proxies are statistically
significant and of the expected sign. CIF costs are increasing in distance, generating a positive
impact on the reported trade gap, while sharing a common border and a common language
decrease CIF costs, decreasing the reported trade gap. In column (3) we further add importer
auditing and accounting standards, a dummy for whether the two countries are members of an
RTA, and costs of organized crime in both countries as additional proxies for m
xtP and x
mtP . The
results on the strength of auditing and accounting standard and organized crime costs are all
statistically significant and consistent with economy wide underreporting of imports and
exports. Stronger auditing and accounting standards and higher costs of organized crime
reduce the extent of strategic underreporting by both importers and exporters, generating
opposite signs for the impact on the reported trade gap. When exporters decrease
underreporting, the trade gap declines. On the other hand, when importers decrease the
extent of their underreporting, the trade gap increases. The net effect of RTA’s on the reported
trade gap in column (3) is insignificant.
It is important to note that the estimates across all three specifications are remarkably
stable even as we add additional proxies to the model, lending strong support to the fact that
our proxy variable estimation strategy does not suffer from omitted variables bias.
25
In column (4) we add an interaction term for tariffs and RTA’s. The coefficient on the
interaction term is positive and significant, indicating that the impact of tariff evasion on the
reported trade gap is smaller for bilateral country pairs that are members of an RTA than for
bilateral pairs that are not members of an RTA. At the bottom of the table the coefficient for
the combined impact of tariffs for RTA members of -1.766 is reported14, indicating that a 1%
increase in tariffs decreases the reported trade gap by 1.766%. This effect is statistically
significant and much smaller than the -3.23 coefficient for bilateral pairs who are not members
of an RTA. That is, the tariff evasion effect is smaller between countries who are members of
an RTA and presumably face lower average tariff rates than for bilateral country pairs who are
not RTA members and face higher average tariff rates. Once we control for the differential
impacts that RTA’s have through a direct effect and through tariffs, the net impact of RTA’s is
now also negative and statistically significant.
Although our proxy variable estimation strategy yields consistent and stable estimates
across columns (1) – (4), even with a variety of proxies included in the estimation, unobserved
heterogeneity across time or specific bilateral country pairs could still potentially bias the
estimates. Recall that the error term in equation (18) is defined as ( )x
t
m
txmtxmt εεεε −+=* . This
error is a random bilateral error over time. If however there are unobserved characteristics
that influence reporting gaps across all countries over time, that happen to also be correlated
with one of our proxies, then our estimates may be biased. For example, if stronger auditing
and accounting standards across time happen to be correlated with technological
advancements in computing and software capabilities in all countries, and this leads to a
decrease in misreporting, then our proxy estimates on auditing and accounting standards may
be biased. Likewise, unobserved bilateral reporting characteristics between countries that do
not change over time that are correlated with the error term may generate bias. For example,
Stoyanov (2012) notes that since 1990 the U.S. and Canada have not based their export data on
actual export declarations by exporters, but rather exchanged import data and substituted each
other’s reported import data (which they keep better data for) as their reported export data
14
The combined impact of tariffs for RTA members is the sum of coefficients for [Importer Tariff on all Products] +
[Importer Tariff on all Products x RTA]. For column (4) of Table 4 this is -3.23+1.464 = -1.766. An F-test was
conducted to determine the joint significance of the sum.
26
(for which they typically have less reliable data). To the extent that these types of reporting
arrangements are prevalent across other country pairs then unobserved bilateral specific
heterogeneity in the error term must be controlled for.
In column (5) of Table 4 we control for unobserved time specific heterogeneity by
including year dummies. While some of the coefficient estimates change slightly from column
(4), the results are quite similar, indicating that the impact of any bias from unobserved
heterogeneity over time is minimal. In column (6) we also include bilateral pair fixed effects to
control for unobserved heterogeneity across bilateral country pairs. Two things are important
to keep in mind with regard to the bilateral country fixed effect estimation. First, all estimates
are now interpreted as within bilateral pair effects, as opposed to the across bilateral pair
estimates in columns (1) – (5). Second, since we are controlling for time invariant unobserved
bilateral pair heterogeneity we are unable to identify other time invariant bilateral
characteristics such as distance, common border, or common currency as they are absorbed by
the bilateral fixed effects. Only proxies that vary across time and within bilateral pairs can be
identified. The regression indicates that there is a substantial amount of unobserved bilateral
heterogeneity across country pairs. In columns (1) – (5) the R2 was an abysmal 0.01 to 0.02,
indicating that the proxies in the model explained an extremely small amount of the variation in
the reported trade gap. However, when we control for bilateral fixed effects the R2 rises
substantially to 0.57. This unobserved heterogeneity likely biased several of our proxy variables
as bilateral port quality, the direct effect of RTAs, auditing and accounting standards, and the
organized crime cost variables are no longer statistically significant from zero.
The impact of tariffs and auditing and accounting standards in the exporting country
remain statistically significant. The marginal effect of tariffs for countries that are not members
of the same RTA is -1.197, while the marginal effect for RTA members is not statistically
different from zero (as evidenced by the statistically insignificant coefficient of -0.122). This is
in line with the predictions of the theory model where countries that face zero average tariff
rates, such as within an FTA or CU, will have marginal effects with respect to tariffs that are also
equal to zero. Tariff evasion effects only matter when countries are not members of an RTA.

27
The coefficient estimate on the strength of exporting country auditing and accounting
standards remains negative and statistically significant.
VI. Robustness Regressions
In Table 5 we report several robustness regressions by exploring additional potential
proxies suggested by our theory section. In column (1), we add a dummy for World Trade
Organization (WTO) membership15 as well as an interaction with tariff rates to see if WTO
membership has had similar impacts on the trade gap as RTA membership. While WTO
membership won’t reduce average tariff rates to the extent an FTA or CU might, most favored
nation (MFN) status may lower average tariff rates for members and provide similar benefits as
RTA membership. Unfortunately, the WTO variable suffers a bit as our data contains a large
number of bilateral pairs who are WTO members over the entire sample period. In fact,
bilateral pairs where both countries are WTO members account for 90% of the observations in
the dataset, meaning that identification must come from a relatively small number of non-
member countries. This may explain the insignificance of both the direct WTO coefficient and
the WTO effect through tariffs. Nonetheless, the insignificant net impact of WTO membership
on the overall trade gap is consistent with the findings of Javorcik and Narciso (2013) who
found that WTO membership has led to no net difference in the value of the reported trade gap
for 15 recent member countries. Importantly, parameter estimates on tariffs and auditing and
accounting standards in the exporting country remain consistent and significant.
In columns (2) and (3) we explore the impacts of net product tax rates in the exporting
and importing countries. From Proposition 1 we know that strategic misreporting is decreasing
in tax rates for both importers and exporters. This implies that greater importing country tax
rates have a negative effect on the trade gap in equation (18), but a positive effect on the trade
gap for exporting country tax rates. The reason for the opposite sign for exporters is that xβ
enters equation (18) negatively. Intuitively, we can see that if we hold reported imports
constant and tax rates increase in the exporting country, exporters underreport a greater
percentage of the value of exports, increasing the trade gap. We calculate net product tax rates
15
Data on World Trade Organization membership was obtained from accession dates on the WTO website at
https://www.wto.org/.
28
by dividing tax revenues on products (minus subsidies) that are related to the sale, production
or use of goods and services in a country and dividing by GDP. This measure provides a proxy of
the net tax rates on goods and services faced by importers and exporters across countries16.
Data coverage on tax rates however is not as extensive as for the other variables in Table 4,
with only 65,944 observations available. This is substantially fewer observations than the
87,930 observations in Table 4 and in column (1) of Table 5. Further, the loss in observations is
biased toward losing less developed countries where tax data is less reliable. Given that we are
not only adding tax rates as additional proxies, but also substantially altering our sample, in
column (2) we first run the same regression as in column (6) of Table 4 to understand how
changing the sample size affects the results. Then in column (3) we add net taxes on products
for both exporters and importers.
Despite the decrease in observations, the results in column (2) are remarkably similar to
those on the full sample in column (6) of Table 4. The one notable exception is that the costs of
organized crime are now positive and statistically significant, which is consistent with a
decrease in underreporting by importers (and an increase in the trade gap) as evasion efforts
become more costly. In column (3) of Table 5 the coefficients on net taxes on products are of
the expected sign with the exporter coefficient being large and statistically significant. A 1%
increase in exporting country tax rates increases exporter underreporting and leads to a 1.37%
increase in the reported trade gap.
Finally, in columns (4) – (6) we include proxies for the shadow prices of capital control
evasion. Identifying the specific channels and data through which capital controls may affect
the incentives of firms to misreport trade is difficult and is beyond the scope of this paper. Our
main goals in this paper are to identify the effects of tariffs inside and outside of RTA’s as well
as the effects of auditing and accounting standards and organized crime on the reported trade
gap. As discussed and demonstrated above, the proxy variable estimation strategy is a
16
Data on both net taxes on products and GDP are from the World Bank Development Indicators (WBDI) database.
We also explored other less related tax rate proxies found in the WBDI, including measures of value added tax
revenues and overall tax revenues as a percentage of GDP. However, these other measures were always
insignificant, did not qualitatively change the results of any of the other relevant variables in the model, and
suffered from much smaller and selective sample sizes due to more severe missing data problems. Thus, we do
not present these less related alternative proxies.
29
consistent estimator of these effects as long as we have a single proxy for each of m
xtP , x
mtP , and
xm
tX , and we control for unobserved bilateral country pair heterogeneity. Nonetheless, our
theory model suggests that circumventing capital controls may be an incentive for firms to
misreport trade so we estimate a model that includes a proxy for the shadow price of capital
controls. Lemmen and Eijffinger (1996) find a positive correlation between inflation rates and
measures of capital controls so we employ data17 on the inflation rate in the importing and
exporting countries. Inflation can be correlated with large capital inflows that make it difficult
for countries to control monetary policy without capital control restrictions (Cordero and
Montecino, 2010 and Lartey, 2012). While we have no ex ante predictions from our theory on
how inflation rates may affect the shadow price of using trade misreporting as a means of
evading capital controls, we can make inferences based on the sign and direction of the proxy
estimates.
From Proposition 1 (iv) we know that for both exporters and importers the percentage
deviation from the true value of trade reported to customs officials is increasing in the shadow
price of capital controls when the shadow price is negative. Recall that a negative shadow price
means firms have an incentive to use misreporting to move capital into the country.
Conversely, when the shadow price of capital is positive, incentivizing capital outflow from the
country, the percentage deviation from the true value of trade is decreasing in the shadow
price. Given that the marginal effects of shadow prices on misreporting go in the same
direction for importers and exporters, but these impacts have opposite signs for the trade gap
in equation (14), we expect that the sign of the inflation proxy on the trade gap will also have
opposing signs for exporters and importers. To the extent inflation induces a positive capital
control shadow price then the expected sign on inflation is negative for importers and positive
for exporters. On the other hand, if inflation induces a negative shadow price, then the
expected sign on inflation is negative for importers and positive for exporters.
Unfortunately, incomplete inflation data across countries reduces our available sample
size even further to 63,787. To ensure that any changes in coefficient estimates are not the
result of the changing sample, in column (4) of Table 5 we again first estimate the base model
17
Inflation rate data also comes from the WBDI database.
30
of column (6) in Table 4 on the new smaller sample. The significance of some of the proxies
appears to be sensitive to sample selection as bilateral port quality is now statistically
significant and of the expected sign and organized crime costs in the importing country are no
longer statistically significant. The effects of tariffs and auditing and accounting standards in
the exporting country, however, remain stable and statistically significant. In column (5) we
add back our net tax rate proxies and in column (6) we add exporter and importer inflation
rates as proxies for the shadow price of capital controls.
Exporter net taxes on products remain statistically significant and of the expected sign in
both column (5) and (6). Likewise, in column (6) the signs on exporter and importer inflation
rates are of opposing signs as our theory predicts. The signs are consistent with a negative
overall shadow price on capital controls, such that firms have an incentive to use misreporting
to move capital into the country. In addition, the exporter inflation rate is negative and
statistically significant, indicating that a 1% increase in inflation in the exporting country is
correlated with a 0.23% reduction in the reported trade gap. Importantly, the estimates on
tariff rates and exporter auditing and accounting standards continue to remain consistently
significant and robust to changing samples and the inclusion of alternative proxies.
VII. Are There Differential Impacts for High Income and Lower Income
Countries?
As an additional check on our results we explore whether there are differential impacts
of tariffs, auditing and accounting standards, and organized crime for countries of different
development levels. In particular, we define a dummy variable for high income countries,
defined according to the World Bank’s classification of high income countries, and interact this
dummy with our tariff, auditing and accounting, and organized crime cost measures. The
interaction terms tell us how the marginal effects of high income countries differ from the
marginal effects of lower income countries. The regression results of the interactions are
presented in Table 6, where column (1) corresponds to interactions of the tariff variable,
column (2), interactions with the auditing and accounting standard variable, and column (3),
interactions with organized crime costs. In general, there appears to be no difference in the
effects of auditing and accounting standards or organized crime costs for high income and
31
lower income countries. There is however an intriguing difference in the effects of tariff
evasion between the two income groups.
To better facilitate discussion of these differences, Table 7 reports the combined
marginal impacts of high income and lower income countries from the regression results in
Table 6. For both lower income and high income countries, tariffs have a negative and
statistically significant effect on the reported trade gap when importing from a non-RTA trading
partner, but the effect in high income countries is 3 times larger than the effect in lower income
countries. This difference is both statistically and economically significant. However, for both
high income importers and lower income importers the tariff effect is not statistically different
from zero when trading partners are members of the same RTA. The marginal effect of
stronger auditing and accounting standards is statistically significant in both lower income and
high income countries, with the effect in lower income countries slightly stronger than in high
income countries. The difference between the two, however, is not statistically significant.
Finally, the effects of organized crime costs in both lower income and high income countries
remain statistically insignificant from zero.
VIII. Conclusion
This paper departs from the disaggregated approach to tariff evasion estimation that
has been prevalent in prior work and develops an estimating strategy, built upon a
microeconomic model of firm behavior and a basic accounting identity, which allows for
consistent estimation of average tariff evasion effects using aggregate bilateral trade data. Our
approach has two primary advantages over prior studies. First, it allows us to test average tariff
evasion effects on a large number of developed and developing country importers and
exporters, rather than just a few select countries as has been the case in more disaggregated
product level studies. In this sense, our results are more generalizable as they relate to a broad
range of countries at different levels of development and across all sectors of the economy.
Second, our aggregate country level approach also allows us to test important country level
characteristics that cannot be measured using disaggregated product level variation.
We find strong evidence that underreporting of imports is statistically significant and
increasing in average tariff rates, but the effect is not uniform across all trading pairs. If the
32
importer is a high income country and bilateral pairs are not members of an RTA, the tariff
evasion elasticity is 3 times larger than the tariff evasion elasticity for an importer in a lower
income country. For country pairs that are members of the same RTA the tariff evasion effect
disappears, regardless of the level of economic development of the importer. Tariff evasion is
simply not a relevant motivation for misreporting when average tariff rates are near zero. The
results indicate that tariff evasion effects are dependent on both the level of development
across countries as well as their participation in RTA’s.
In addition, we find robust evidence that stronger auditing and accounting standards in
exporting countries decreases underreporting by exporters. Exporters are also more likely to
underreport exports to customs officials the greater are product tax rates in the exporting
country and when the shadow price of capital controls is negative, making it profitable to use
trade misinvoicing as a means of circumventing capital control regulations. Likewise, the costs
of evasion, as measured by organized crime costs across countries, have the expected signs and
decrease misreporting for both importers and exporters. However, these results are less robust
to various specifications and samples.
These last results confirm that when we look beyond disaggregated tariff rates, policy
relevant country characteristics such as domestic tax rates and the strength of auditing and
accounting standards across countries are significant in explaining firm motivations for
underreporting of exports. These factors must be taken into account by governments and
customs authorities seeking to protect revenue sources associated with tariff and tax evasion
on trade across international borders.
33
References
Baghdadi, Leila, Immaculada Martinez-Zarzoso, Celestino Suarez-Burguet, and Habib Zitouna,
2013, Are RTA agreements with environmental provisions reducing emissions?, Journal
of International Economics, 90(2): 378-390.
Bouët, Antoine and Devesh Roy, 2012, Trade protection and tax evasion: Evidence from Kenya,
Mauritius, and Nigeria, The Journal of International Trade & Economic Development: An
International and Comparative Review, 21(2): 287-320.
Carr, David L., James R. Markusen, and Keith E. Maskus, 2001, Estimating The Knowledge-
Capital Model of the Multinational Enterprise, American Economic Review, 91(3), 995-
1001.
Clark, Ximena, David Dollar, and Alejandro Micco, 2004, Port Efficiency, Maritime Transport
Costs, and Bilateral Trade, Journal of Development Economics, 75(2): 417-450.
Cordero, José Antonio and Juan Antonio Montecino, 2010, Capital Controls and Monetary
Policy in Developing Countries, CEPR Working paper.
de Sousa, Jose, 2012, The currency union effect on trade is decreasing over time, Economics
Letters, 117(3): 917-920.
Dutt, Pushan and Daniel Traca, 2010, Corruption and Bilateral Trade Flows: Extortion or
Evasion?, The Review of Economics and Statistics, 92(4): 843-860.
Ekholm, Karolina, Rikard Forslid, and James R. Markusen, 2007, Export Platform Foreign Direct
Investment, Journal of the European Economic Association, 5(4), 776-95.
Epaphra, Manamba, 2015, Tax Rates and Tax Evasion: Evidence from Missing Imports in
Tanzania, International Journal of Economics and Finance, 7(2): 122-137.
Fisman, Raymond and Shang-Jin Wei, 2004, Tax Rates and Tax Evasion: Evidence from “Missing
Imports” in China, Journal of Political Economy, 112(2): 471-496.
Ferrantino, Michael J., Xuepeng Liu, and Zhi Wang, 2012, Evasion behaviors of exporters and
importers: Evidence from the U.S. – China trade data discrepancy, Journal of
International Economics, 86: 141-157.
Head, Keith and Thierry Mayer, 2013, Gravity Equations: Workhorse, Toolkit, and Cookbook,
CEPII Working Paper No. 2013-27.

34
Head, Keith, Thierry Mayer, and John Ries, 2010, The erosion of colonial trade linkages after
independence, Journal of International Economics, 81(1): 1-14.
Head, Keith, and John Ries, 2010, Do trade missions increase trade?, Canadian Journal of
Economics, 43(3): 754-775.
Javorcik, Beata S., and Gaia Narciso, 2013, Accession to the World Trade Organization and Tariff
Evasion, CEPR Discussion Paper No. 9592.
Javorcik, Beata S. & Shang-Jin Wei, 2004, Pollution Havens and Foreign Direct Investment: Dirty
Secret or Popular Myth? Contributions to Economic Analysis & Policy, 3(2), Article 8.
Lartey, Emmanuel K.K., 2012, Financial openness, nontradable inflation and optimal monetary
policy, Economics Letters, 117: 782-785.
Kar, Dev and Joseph Spanjers, 2014, Illicit Financial Flows from Developing Countries: 2003-
2012, Global Financial Integrity report available at
http://www.gfintegrity.org/report/2014-global-report-illicit-financial-flows-from-
developing-countries-2003-2012/
Lemmen, Jan J.G. and Sylvester C.W. Eijffinger, 1996, The Fundamental Determinants of
Financial Integration in the European Union, Weltwirtschaftliches Archiv, 123(3): 432-
456.
Mishra, Prachi, Arvind Subramanian, and Petia Topalova, 2008, Tariffs, enforcement, and
customs evasion: Evidence from India, Journal of Public Economics, 92: 1907-1925.
Patnaik, Ila, Abhijit Sen Gupta and Ajay Shah, 2012, Determinants of Trade Misinvoicing, Open
Economies Review, 23: 891-910.
Prasad, Eswar S. and Raghuram G. Rajan, 2008, A Pragmatic Approach to Capital Account
Liberalization, Journal of Economic Perspectives, 22:3: 149-172.
Stoyanov, Andrey, 2012, Tariff evasion and rules of origin violations under the Canada-U.S. Free
Trade Agreement, Canadian Journal of Economics, 45(3): 879-902.
Swenson, Deborah L., 2001, Tax reforms and evidence of transfer pricing, National Tax Journal,
54(1): 7-25.
Wooldridge, Jeffrey, 2002, Econometric Analysis of Cross Section and Panel Data, MIT Press,
Cambridge, MA.
35
Yeaple, Stephen R., 2003, The Role of Skill Endowments in the Structure of U.S. Outward
Foreign Direct Investment, Review of Economics and Statistics, 85(3), 726-34.
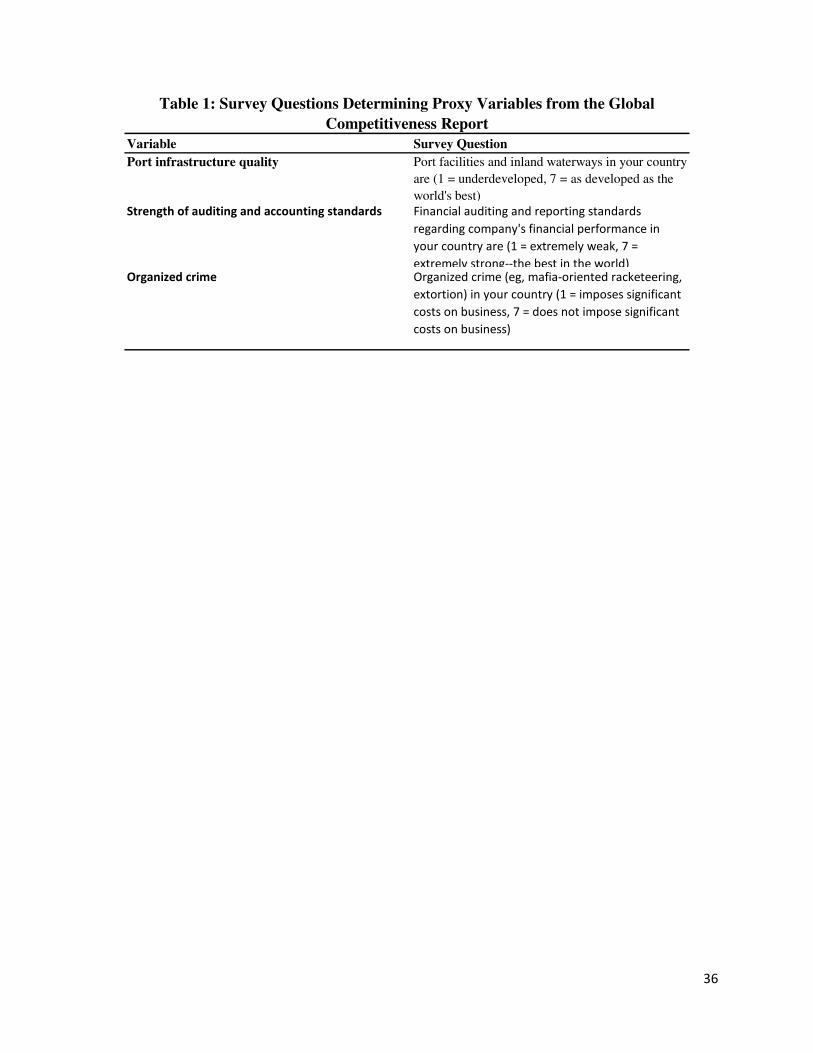
36
Variable Survey Question
Port infrastructure quality Port facilities and inland waterways in your country
are (1 = underdeveloped, 7 = as developed as the
world's best)
Strength of auditing and accounting standards Financial auditing and reporting standards
regarding company's financial performance in
your country are (1 = extremely weak, 7 =
extremely strong--the best in the world)Organized crime Organized crime (eg, mafia-oriented racketeering,
extortion) in your country (1 = imposes significant
costs on business, 7 = does not impose significant
costs on business)
Table 1: Survey Questions Determining Proxy Variables from the Global
Competitiveness Report
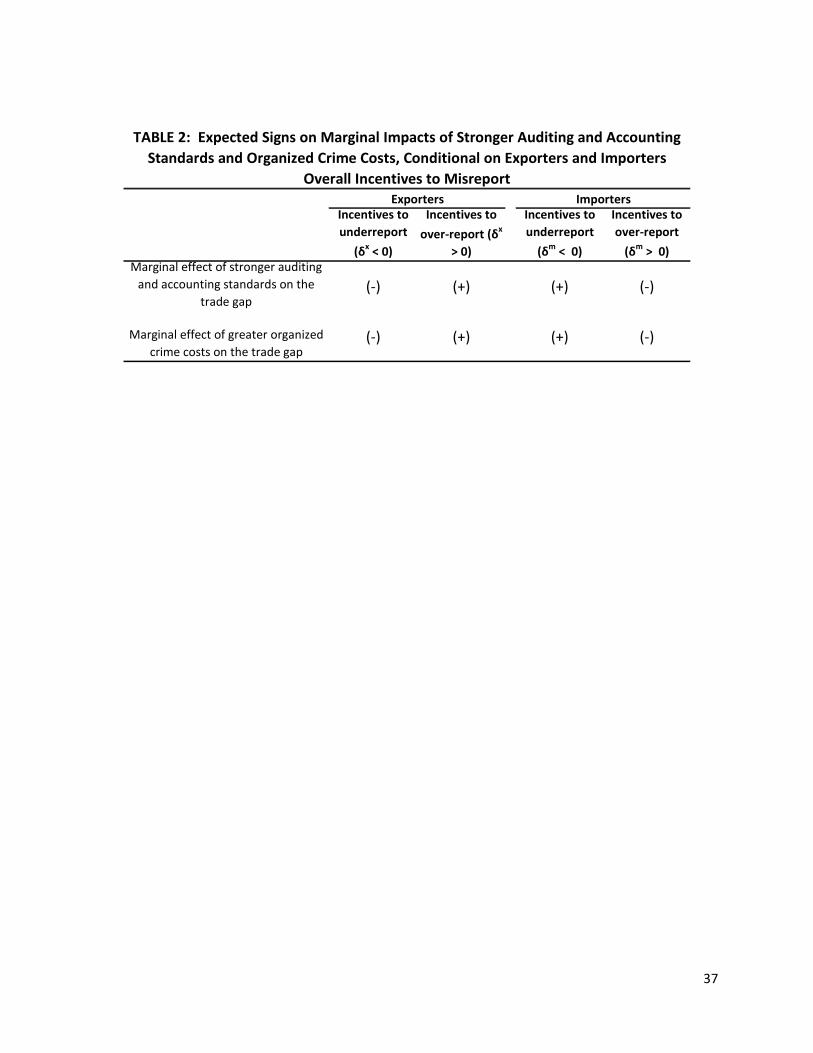
37
Incentives to
underreport
(δx < 0)
Incentives to
over-report (δx
> 0)
Incentives to
underreport
(δm
< 0)
Incentives to
over-report
(δm
> 0)
Marginal effect of stronger auditing
and accounting standards on the
trade gap(-) (+) (+) (-)
Marginal effect of greater organized
crime costs on the trade gap(-) (+) (+) (-)
TABLE 2: Expected Signs on Marginal Impacts of Stronger Auditing and Accounting
Standards and Organized Crime Costs, Conditional on Exporters and Importers
Overall Incentives to Misreport
Exporters Importers
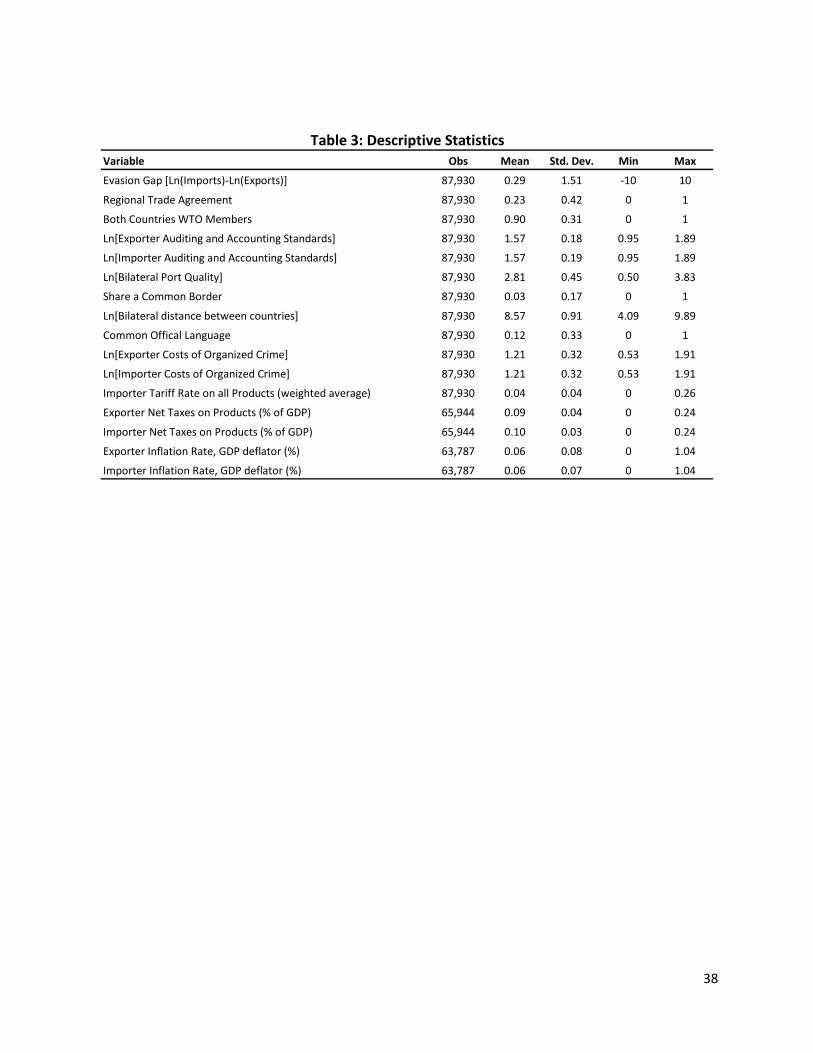
38
Variable Obs Mean Std. Dev. Min Max
Evasion Gap [Ln(Imports)-Ln(Exports)] 87,930 0.29 1.51 -10 10
Regional Trade Agreement 87,930 0.23 0.42 0 1
Both Countries WTO Members 87,930 0.90 0.31 0 1
Ln[Exporter Auditing and Accounting Standards] 87,930 1.57 0.18 0.95 1.89
Ln[Importer Auditing and Accounting Standards] 87,930 1.57 0.19 0.95 1.89
Ln[Bilateral Port Quality] 87,930 2.81 0.45 0.50 3.83
Share a Common Border 87,930 0.03 0.17 0 1
Ln[Bilateral distance between countries] 87,930 8.57 0.91 4.09 9.89
Common Offical Language 87,930 0.12 0.33 0 1
Ln[Exporter Costs of Organized Crime] 87,930 1.21 0.32 0.53 1.91
Ln[Importer Costs of Organized Crime] 87,930 1.21 0.32 0.53 1.91
Importer Tariff Rate on all Products (weighted average) 87,930 0.04 0.04 0 0.26
Exporter Net Taxes on Products (% of GDP) 65,944 0.09 0.04 0 0.24
Importer Net Taxes on Products (% of GDP) 65,944 0.10 0.03 0 0.24
Exporter Inflation Rate, GDP deflator (%) 63,787 0.06 0.08 0 1.04
Importer Inflation Rate, GDP deflator (%) 63,787 0.06 0.07 0 1.04
Table 3: Descriptive Statistics
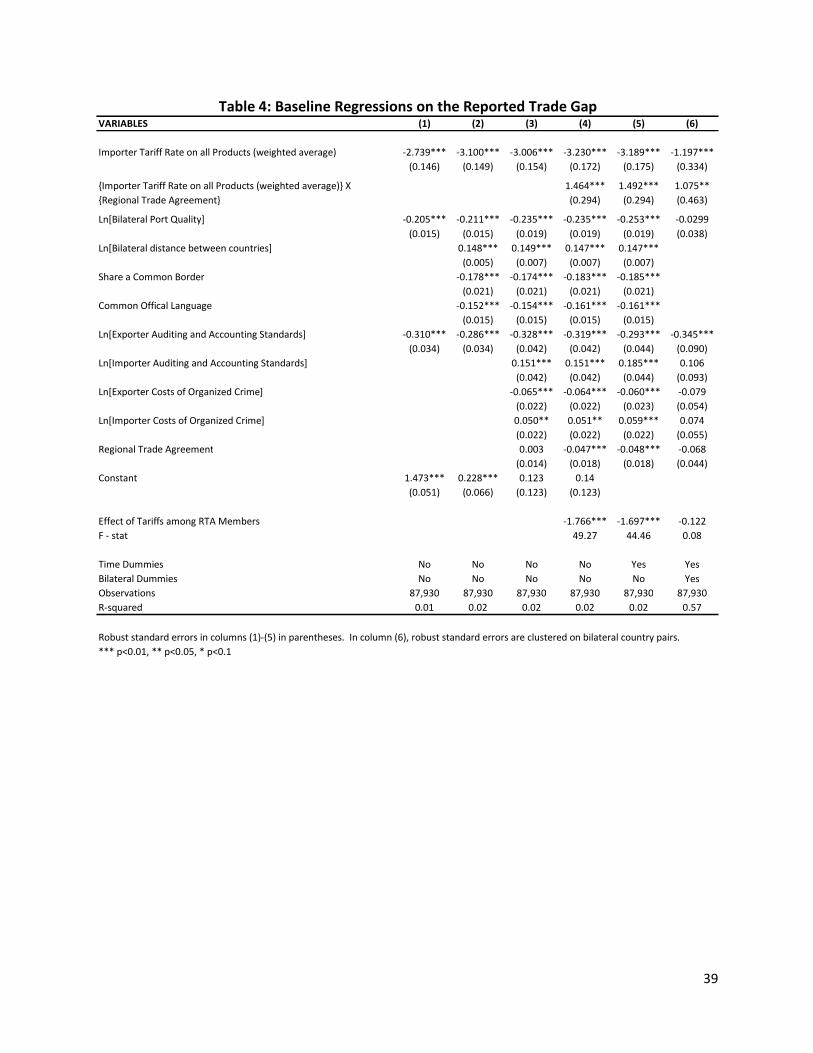
39
VARIABLES (1) (2) (3) (4) (5) (6)
Importer Tariff Rate on all Products (weighted average) -2.739*** -3.100*** -3.006*** -3.230*** -3.189*** -1.197***
(0.146) (0.149) (0.154) (0.172) (0.175) (0.334)
Importer Tariff Rate on all Products (weighted average) X 1.464*** 1.492*** 1.075**
Regional Trade Agreement (0.294) (0.294) (0.463)
Ln[Bilateral Port Quality] -0.205*** -0.211*** -0.235*** -0.235*** -0.253*** -0.0299
(0.015) (0.015) (0.019) (0.019) (0.019) (0.038)
Ln[Bilateral distance between countries] 0.148*** 0.149*** 0.147*** 0.147***
(0.005) (0.007) (0.007) (0.007)
Share a Common Border -0.178*** -0.174*** -0.183*** -0.185***
(0.021) (0.021) (0.021) (0.021)
Common Offical Language -0.152*** -0.154*** -0.161*** -0.161***
(0.015) (0.015) (0.015) (0.015)
Ln[Exporter Auditing and Accounting Standards] -0.310*** -0.286*** -0.328*** -0.319*** -0.293*** -0.345***
(0.034) (0.034) (0.042) (0.042) (0.044) (0.090)
Ln[Importer Auditing and Accounting Standards] 0.151*** 0.151*** 0.185*** 0.106
(0.042) (0.042) (0.044) (0.093)
Ln[Exporter Costs of Organized Crime] -0.065*** -0.064*** -0.060*** -0.079
(0.022) (0.022) (0.023) (0.054)
Ln[Importer Costs of Organized Crime] 0.050** 0.051** 0.059*** 0.074
(0.022) (0.022) (0.022) (0.055)
Regional Trade Agreement 0.003 -0.047*** -0.048*** -0.068
(0.014) (0.018) (0.018) (0.044)
Constant 1.473*** 0.228*** 0.123 0.14
(0.051) (0.066) (0.123) (0.123)
Effect of Tariffs among RTA Members -1.766*** -1.697*** -0.122
F - stat 49.27 44.46 0.08
Time Dummies No No No No Yes Yes
Bilateral Dummies No No No No No Yes
Observations 87,930 87,930 87,930 87,930 87,930 87,930
R-squared 0.01 0.02 0.02 0.02 0.02 0.57
*** p<0.01, ** p<0.05, * p<0.1
Table 4: Baseline Regressions on the Reported Trade Gap
Robust standard errors in columns (1)-(5) in parentheses. In column (6), robust standard errors are clustered on bilateral country pairs.
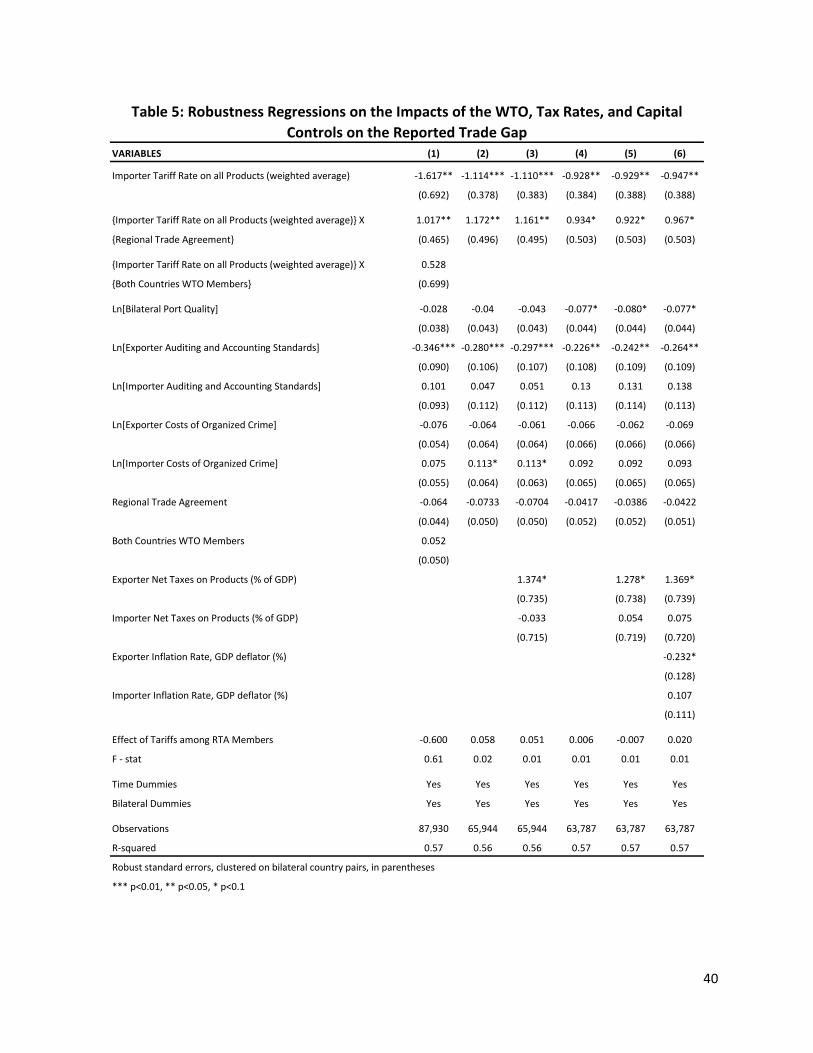
40
VARIABLES (1) (2) (3) (4) (5) (6)
Importer Tariff Rate on all Products (weighted average) -1.617** -1.114*** -1.110*** -0.928** -0.929** -0.947**
(0.692) (0.378) (0.383) (0.384) (0.388) (0.388)
Importer Tariff Rate on all Products (weighted average) X 1.017** 1.172** 1.161** 0.934* 0.922* 0.967*
Regional Trade Agreement (0.465) (0.496) (0.495) (0.503) (0.503) (0.503)
Importer Tariff Rate on all Products (weighted average) X 0.528
Both Countries WTO Members (0.699)
Ln[Bilateral Port Quality] -0.028 -0.04 -0.043 -0.077* -0.080* -0.077*
(0.038) (0.043) (0.043) (0.044) (0.044) (0.044)
Ln[Exporter Auditing and Accounting Standards] -0.346*** -0.280*** -0.297*** -0.226** -0.242** -0.264**
(0.090) (0.106) (0.107) (0.108) (0.109) (0.109)
Ln[Importer Auditing and Accounting Standards] 0.101 0.047 0.051 0.13 0.131 0.138
(0.093) (0.112) (0.112) (0.113) (0.114) (0.113)
Ln[Exporter Costs of Organized Crime] -0.076 -0.064 -0.061 -0.066 -0.062 -0.069
(0.054) (0.064) (0.064) (0.066) (0.066) (0.066)
Ln[Importer Costs of Organized Crime] 0.075 0.113* 0.113* 0.092 0.092 0.093
(0.055) (0.064) (0.063) (0.065) (0.065) (0.065)
Regional Trade Agreement -0.064 -0.0733 -0.0704 -0.0417 -0.0386 -0.0422
(0.044) (0.050) (0.050) (0.052) (0.052) (0.051)
Both Countries WTO Members 0.052
(0.050)
Exporter Net Taxes on Products (% of GDP) 1.374* 1.278* 1.369*
(0.735) (0.738) (0.739)
Importer Net Taxes on Products (% of GDP) -0.033 0.054 0.075
(0.715) (0.719) (0.720)
Exporter Inflation Rate, GDP deflator (%) -0.232*
(0.128)
Importer Inflation Rate, GDP deflator (%) 0.107
(0.111)
Effect of Tariffs among RTA Members -0.600 0.058 0.051 0.006 -0.007 0.020
F - stat 0.61 0.02 0.01 0.01 0.01 0.01
Time Dummies Yes Yes Yes Yes Yes Yes
Bilateral Dummies Yes Yes Yes Yes Yes Yes
Observations 87,930 65,944 65,944 63,787 63,787 63,787
R-squared 0.57 0.56 0.56 0.57 0.57 0.57
Robust standard errors, clustered on bilateral country pairs, in parentheses
*** p<0.01, ** p<0.05, * p<0.1
Table 5: Robustness Regressions on the Impacts of the WTO, Tax Rates, and Capital
Controls on the Reported Trade Gap
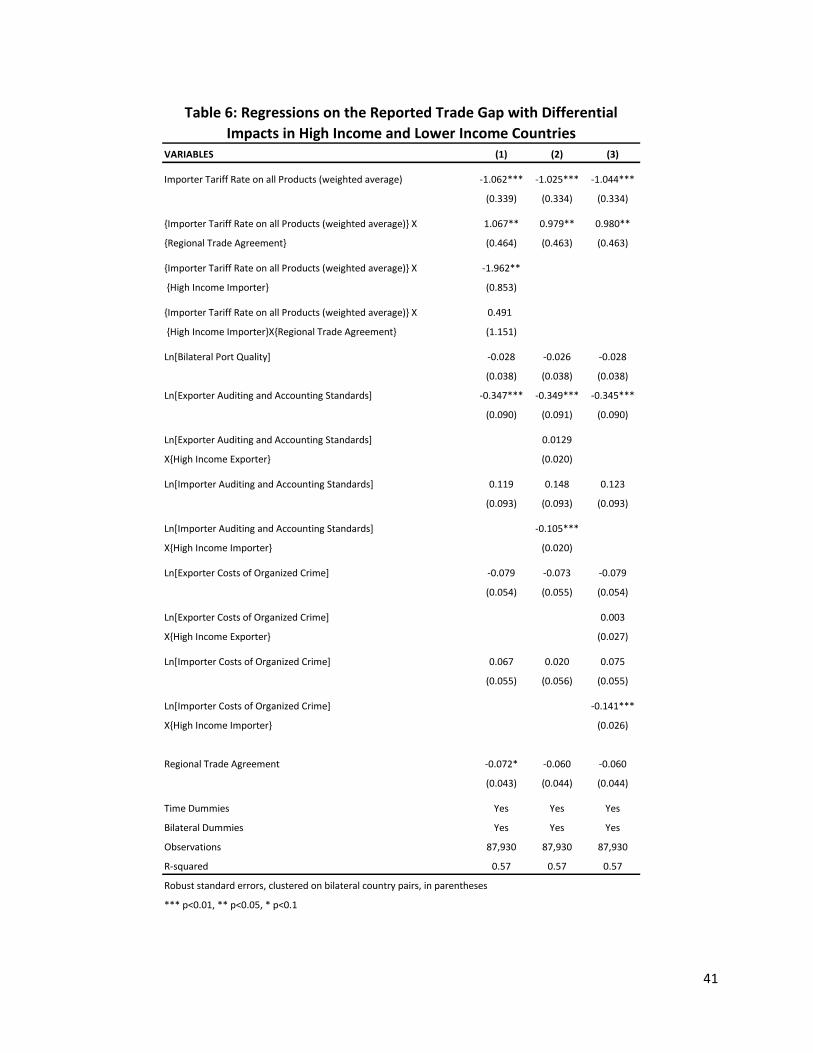
41
VARIABLES (1) (2) (3)
Importer Tariff Rate on all Products (weighted average) -1.062*** -1.025*** -1.044***
(0.339) (0.334) (0.334)
Importer Tariff Rate on all Products (weighted average) X 1.067** 0.979** 0.980**
Regional Trade Agreement (0.464) (0.463) (0.463)
Importer Tariff Rate on all Products (weighted average) X -1.962**
High Income Importer (0.853)
Importer Tariff Rate on all Products (weighted average) X 0.491
High Income ImporterXRegional Trade Agreement (1.151)
Ln[Bilateral Port Quality] -0.028 -0.026 -0.028
(0.038) (0.038) (0.038)
Ln[Exporter Auditing and Accounting Standards] -0.347*** -0.349*** -0.345***
(0.090) (0.091) (0.090)
Ln[Exporter Auditing and Accounting Standards] 0.0129
XHigh Income Exporter (0.020)
Ln[Importer Auditing and Accounting Standards] 0.119 0.148 0.123
(0.093) (0.093) (0.093)
Ln[Importer Auditing and Accounting Standards] -0.105***
XHigh Income Importer (0.020)
Ln[Exporter Costs of Organized Crime] -0.079 -0.073 -0.079
(0.054) (0.055) (0.054)
Ln[Exporter Costs of Organized Crime] 0.003
XHigh Income Exporter (0.027)
Ln[Importer Costs of Organized Crime] 0.067 0.020 0.075
(0.055) (0.056) (0.055)
Ln[Importer Costs of Organized Crime] -0.141***
XHigh Income Importer (0.026)
Regional Trade Agreement -0.072* -0.060 -0.060
(0.043) (0.044) (0.044)
Time Dummies Yes Yes Yes
Bilateral Dummies Yes Yes Yes
Observations 87,930 87,930 87,930
R-squared 0.57 0.57 0.57
*** p<0.01, ** p<0.05, * p<0.1
Table 6: Regressions on the Reported Trade Gap with Differential
Impacts in High Income and Lower Income Countries
Robust standard errors, clustered on bilateral country pairs, in parentheses

42
(1) (2) (3)
Lower Income Countries
Tariffs among non-RTA Members -1.062***
(0.339)
Tariffs among RTA Members 0.005
[0.00]
Auditing and Accounting Standards Exporter -0.349***
(0.091)
Auditing and Accounting Standards Importer 0.148
(0.093)
Organized Crime Costs Exporter -0.079
(0.054)
Organized Crime Costs Importer 0.075
(0.055)
High Income Countries
Tariffs among non-RTA Members -3.024***
[12.41]a
Tariffs among RTA Members -1.466
[1.92]
Auditing and Accounting Standards Exporter -0.341***
[14.16]
Auditing and Accounting Standards Importer 0.043
[0.65]
Organized Crime Costs Exporter -0.076
[1.65]
Organized Crime Costs Importer -0.066
[1.23]
*** p<0.01, ** p<0.05, * p<0.1
Table 7: Combined Marginal Effects of Tariffs, Auditing and
Accounting Standards, and Organized Crime Costs for Lower Income
and High Income Countries
For coefficent estimates that come directly from Table 6, standard errors are reported in parentheses.
For coeffient estimates that require linear tests of multiple coeffiecients from Table 6, F-stats are reported
in brackets. The a suberscript indicates that the High Income country estimate is statistically different
from the Lower Income country estimate.