beyond monetary poverty - world bank
TRANSCRIPT

4
This chapter reports on the results of the World Bank’s first exercise of multidimensional global
poverty measurement. Information on income or consumption is the traditional basis for the
World Bank’s poverty estimates, including the estimates reported in chapters 1–3. However,
in many settings, important aspects of well-being, such as access to quality health care or a
secure community, are not captured by standard monetary measures. To address this concern,
an established tradition of multidimensional poverty measurement measures these nonmone-
tary dimensions directly and aggregates them into an index. The United Nations Development
Programme’s Multidimensional Poverty Index (Global MPI), produced in conjunction with the
Oxford Poverty and Human Development Initiative, is a foremost example of such a multi-
dimensional poverty measure. The analysis in this chapter complements the Global MPI by
placing the monetary measure of well-being alongside nonmonetary dimensions. By doing so,
this chapter explores the share of the deprived population that is missed by a sole reliance on
monetary poverty as well as the extent to which monetary and nonmonetary deprivations are
jointly presented across different contexts.
The first exercise provides a global picture using comparable data across 119 countries
for circa 2013 (representing 45 percent of the world’s population) combining consumption or
income with measures of education and access to basic infrastructure services. Accounting
for these aspects of well-being alters the perception of global poverty. The share of poor
increases by 50 percent—from 12 percent living below the international poverty line to 18
percent deprived in at least one of the three dimensions of well-being. Across this sample,
only a small minority of the poor is deprived in only one dimension: more than a third of the
poor suffer simultaneous deprivations in all three dimensions. More than in any other region
of the world, in Sub-Saharan Africa shortfalls in one dimension occur alongside deprivations in
other dimensions. In South Asia, the relatively high incidence of deprivations in education and
sanitation imply that poverty rates could be more than twice as high when these nonmonetary
dimensions are added.
A second complementary exercise for a smaller set of countries (six) explores the inclusion
of two additional nonmonetary dimensions. When measures of health and household security
(the risk of experiencing crime or a natural disaster) are included alongside the previous three
dimensions, the profile of the poor changes. In most countries, the share of the poor living in
female-headed households is greater than when the nonmonetary dimensions are excluded
and, in some countries, the poor also have a significantly higher presence in urban areas.
Beyond Monetary Poverty
87
88 POVERTY AND SHARED PROSPERITY 2018
various goods taking their relative prices into account, these relative prices serve as natural weights with which to aggregate those quan-tities consumed.1 That is why they form the basis for the first three chapters in this report. It is why poverty has typically been defined in terms of whether a household’s income reaches or surpasses a monetary threshold, the poverty line, which represents the minimum amount needed to purchase a sufficient quan-tity of essential goods and services.
Yet the point of the example is that monetary-based measures do not encompass all aspects of human well-being. One reason for this is that not all goods and services that matter to people are obtained exclusively through markets. Consequently, the prices necessary to cost these goods and services ei-ther do not exist or do not accurately reflect their true consumption value (World Bank 2017b). Common examples of nonmarket goods without prices are public goods such as a clean environment and a secure commu-nity. Examples of goods with prices that often do not reflect true consumption value include those that require large public investments to make them available—the provision of a power grid is often necessary before a house-hold can access electricity. Other core services at least partially provided through systems supported by direct government spending include health care and education. General government health expenditure accounts for more than half of total global health expen-diture. Likewise, governments on average spend the equivalent of nearly 5 percent of the gross domestic product (GDP) of their economies on education. The presence of such goods renders the traditional monetary welfare measure incomplete with respect to a variety of core aspects of well-being.
This chapter presents a broader picture of well-being than that found in chapters 1–3, by considering a notion of poverty that rec-ognizes the centrality of the monetary mea-sure, but looks to complement it by explicitly treating access to key nonmarket goods as separate dimensions of well-being. Specif-ically, the chapter previews a multidimen-sional poverty measure derived from stan-dardized data for 119 countries that provide a global picture for circa 2013. The multidi-mensional measure is anchored on consump-
Why look beyond monetary poverty?Consider the following hypothetical exam-ple. Two families have the same income, say US$3.00 per person per day. However, only one family has access to adequate water, sani-tation, and electricity, whereas the other lives in an area lacking the necessary infrastruc-ture for basic services, such as a power grid or water mains. Members of this second family will still consume water and use energy for lighting and cooking, but they may have to spend hours per week fetching water from a well, or pay higher prices to obtain lower- quality water from a truck. For sanitation, they may use a private or communal latrine, without the convenience or hygiene benefits of a sewerage connection. And with no ac-cess to an electricity grid, the second family’s choice set for lighting and power options is severely reduced. Both households will spend some of their US$3.00 per person per day to meet their energy and water needs. Yet, be-cause their choice sets (including the prices they face) are so different, the differences in their living standards arising from the access that the first family enjoys are not captured by a monetary measure of poverty alone. The first family clearly enjoys a higher stan-dard of living than the second, but a welfare judgment that considers only their incomes will pronounce them equally well-off. This is an example of when public action—or lack thereof—can directly affect the well-being of households by expanding—or not—their choice sets in ways that incomes and prices fail to fully internalize. It is possible that, under a broader assessment of poverty, the second family might be considered poor or deprived, even though its daily income is above the in-ternational poverty line of US$1.90 per day.
To be clear: Income (or consumption ex-penditures valued at prevailing market prices) is hugely important for human well-being. Indeed, income and consumption are the workhorse metrics of individual welfare in economic analysis. They summarize a house-hold’s capacity to purchase multiple goods and services that are crucial for well-being, such as food, clothing, and shelter. And they do so with one remarkable property: because con-sumers choose the quantities they consume of

BEYOND MONETARY POVERTY 89
and national level (box 4.1). The capability framework inspired the development of the first global efforts to measure poverty multi-dimensionally. These were carried out by the United Nations Development Programme (UNDP), through the Human Poverty Index in the late 1990s (UNDP 1997) and, more re-cently, through the Global Multidimensional Poverty Index (Global MPI), introduced in the 2010 Human Development Report (UNDP 2010), developed with the Oxford Poverty and Human Development Initiative (OPHI), and reported annually for over 100 countries. At the country level, an increasing number of governments are choosing to ex-pand or complement their poverty measures with multidimensional indicators (see spot-light 4.1 at the end of this chapter). The ef-forts of the UNDP, OPHI, and most govern-ments build on influential research by Sabina Alkire and James Foster (see, for example, Alkire and Foster 2011).
The efforts here are also indebted to these previous efforts by other researchers, gov-ernments, and international institutions. In addition, they follow on the World Develop-ment Report (WDR) 2000/01 Attacking Pov-erty (World Bank 2001), which recognized the many dimensions of poverty and considered deprivations in education and health alongside income in its analysis of the evolution of pov-erty. The present report goes beyond the WDR 2000/01 by taking advantage of richer house-hold-level data that combine monetary and nonmonetary indicators to present deprivation in each domain as well as measures that aggre-gate these different deprivations. This proposal follows from the recommendations of the Commission on Global Poverty, led by Profes-sor Sir A. B. Atkinson, to consider complemen-tary indicators to monetary poverty “where a dashboard approach is proposed as part of the Complementary Indicators, . . . together with a measure of the extent of overlapping depriva-tions” (World Bank 2017b, 100).
The present exercise is also related to the Sustainable Development Goals (SDGs) es-tablished by the United Nations in 2015, which include a call for governments to re-port on their progress in improving the na-tional multidimensional poverty indicator (Indicator 1.2.2 of SDG 1, end poverty in all its forms everywhere).2 The focus of this
tion or income as one dimension of welfare, and includes several direct measures of access to education and utilities (such as electricity, water, and sanitation) as additional dimen-sions. Although this multidimensional mea-sure has wide country coverage, it still lacks information on other important dimensions of well-being including health care and nu-trition, as well as security from crime and natural disasters. Consequently, in a more exploratory manner, the chapter extends the analysis by adding these dimensions for a smaller subset of countries for which infor-mation for all these dimensions can be cap-tured within the same household survey.
The two exercises—one with broad coun-try coverage, but fewer dimensions than one would ideally like, and the other with a rela-tively extensive set of dimensions, but available only as a pilot for a few countries—represent the World Bank’s first steps toward including multidimensional poverty indicators in the set of complementary indicators of global poverty, as suggested by the Commission on Global Poverty (World Bank 2017b). Going forward, the World Bank will monitor prog-ress on multidimensional poverty at the global level using the three-dimensional measures presented in this chapter, while continuing its efforts to incorporate the dimensions missing from the global analysis for future rounds.
This approach adopts a living standards perspective, in that each dimension is valued instrumentally, that is, each dimension rep-resents the ability to command goods and services that households value for other ends (in other words, consuming or owning these commodities allows for the satisfaction of different needs and wants). But it is also con-sistent with the capability framework, which calls for expanding the evaluative space for assessing welfare (Sen 1987). The capability approach advocates for a broader perspective to capture the “plurality of different features of our lives and concerns” (Sen 2009, 233). In this approach people have varying abilities to convert resources into the opportunity to be and do what they most value—that is, into what Sen terms “capabilities.”
Of course, measuring poverty multi-dimensionally is not a new endeavor. In-deed, multidimensional poverty measures have become widespread both at the global

90 POVERTY AND SHARED PROSPERITY 2018
harmonization, several key insights emerge from the analysis.
Considerations for constructing multidimensional poverty measuresThis is the initial step by the World Bank to expand the space of assessment beyond the monetary to explicitly include access to non-
chapter, on steps to develop a useful global multidimensional poverty measure, should not be taken as a preference for such a global measure over possibly richer country-level measures when assessing national progress. The requirement of a global multidimen-sional poverty measure for standardized household indicators across many countries necessarily limits indicator choice to the rel-atively few that are consistently measured. Nonetheless, despite this constraint of data
BOX 4.1 Early Applications of Multidimensional Poverty Measurement
The approach followed in this chapter builds on previous applications of the multidimensional poverty concept. There is a long history of assessing the deprivation of individuals by combining multiple components of well-being. Inspired by empirical studies in the 1970s and early 1980s, various European countries have been measuring the share of the population that is deprived in a select number of socially perceived necessities as a core indicator of social exclusion.a In many of these cases, such as in Ireland, the United Kingdom, and, later, the European Union, the assessment of multiple deprivations combines income poverty with the counting of these material deprivations.b Since the 1980s, many countries in Latin America have complemented monetary poverty measures developed through household surveys with an indicator of unsatisfied basic needs that counts the number of deprivations in several indicators, including school enrollments among
children, housing conditions, access to basic services, and the economic capacity of household members. The basic needs indicators are generally calculated using census data.
The Mexican government has taken a lead in adopting a multidimensional approach in the official poverty measure. Following a comprehensive consultative process initiated in 2006, and grounded on a human rights perspective, the government, since 2010, has measured poverty as the share of the population that is deprived simultaneously in monetary terms and in at least one of six social indicators reflecting core social rights. These indicators cover gaps in education, access to health services, access to social security, access to basic residential services, housing conditions, and access to food (CONEVAL 2010).
Since 2010, OPHI and the UNDP have been computing the Global MPI for over 100 countries. The Global MPI replaced
the Human Poverty Index, which appeared in the Human Development Reports from 1997 to 2009 measuring country-level aggregate deprivations in health, education, and standard of living. The Global MPI combines 10 indicators grouped in three dimensions, namely, education, health, and standard of living, and identifies each person as poor or nonpoor according to how many deprivations they face (Alkire and Santos 2010; Alkire et al. 2015).
This work has been adapted and adopted by many developing countries (see spotlight 4.1). The 2018 edition of the Global MPI includes 105 countries, with a population coverage of 75 percent of the global population (OPHI 2018). A comparison of the indicators included in the Global MPI, as well as the Mexican poverty measure and (selected indicators) for Europe 2020 and the multidimensional poverty measures presented in the chapter, is found in annex 4A.
a. The Level-of-Living Survey in Sweden and Townsend (1979) and Mack and Lansley (1985) in the United Kingdom are considered pioneers in Europe in this approach. Excellent reviews on early applications include Aaberge and Brandolini (2015) and Alkire et al. (2015). For the Swedish survey, see LNU (The Swedish Level-of-Living Survey) (database), Swedish Institute for Social Research, Stockholm University, Stockholm, https://www.sofi.su.se/english/2.17851/research/three-research-units/lnu-level-of-living.b. In Ireland, “consistent poverty” is measured as the population share that is both income poor and deprived in two or more essential items. In the United Kingdom, a similar approach has been used since 2010 to measure child poverty. In the European Union, the Europe 2020 poverty and social exclusion headline indicator combines income poverty (the at-risk-of-poverty rate), household quasi-joblessness, and severe material deprivation (lacking at least four of nine items that are considered fundamental to enjoying an adequate standard of living). See Atkinson et al. (2002); Marlier et al. (2007).

BEYOND MONETARY POVERTY 91
former is not available) captures people’s access to certain crucial goods and ser-vices, including food, clothing, and shelter. The consumption measure uses market prices to aggregate across the various con-sumption goods.3 Market prices reflect the ability of people to purchase goods and services, while allowing for variation in individual preferences. Other aspects of well-being on which prices are not avail-able or are arguably not a good representa-tion of value should therefore complement monetary poverty. Public goods as well as private goods that are heavily subsidized are cases in which prices either do not exist or, if they do exist, do not closely represent the household’s valuation of the good.
• Relevance. The indicators included should be relevant in that they are widely ac-knowledged to represent essential aspects of well-being. Indicator thresholds should reflect minimum basic needs, comparable with the US$1.90 per person per day pov-erty lines. The SDGs and other similar ini-tiatives provide useful guidance.
• Data availability. Indicators should ideally be derived from the same data source (typ-ically a household survey). One of the key features of the multidimensional approach is that it can be used to assess the extent to which deprivation in one dimension is related to deprivation in other dimensions for the same individual. However, because of the requirement about data sources, the choice of the dimensions and indicators to be included will ultimately be shaped by the availability of meaningful data.
• Parsimony. The multidimensional mea-sure should be parsimonious. It should involve only a small number of judiciously selected dimensions to lend prominence to multidimensionality, while ensuring suffi-cient population coverage.
Because of data limitations, there exists a trade-off between the number of dimensions (measured by harmonized indicators) that can be included in the multidimensional pov-erty measure and the number of countries that can be included in the analysis. For ex-ample, comprehensive assessments of health
market goods and services that are essen-tial for well-being. In addition to a measure based on economic resources, it incorporates a core set of indicators for nonmonetary di-mensions and presents results on the extent to which these deprivations arise and overlap. Furthermore, it presents summary measures that combine the information into a single index, the multidimensional poverty head-count ratio.
Broadening the poverty measure to in-corporate additional directly measured com-ponents involves two steps. First, one must select the dimensions, the indicators, and the respective sufficiency thresholds for each indicator. For example, in the case of the ed-ucational dimension, one possible indicator could be school enrollment for the school- age children in the household, and the suf-ficiency threshold is that all children are in school (and therefore every household mem-ber is considered deprived if at least one child is not enrolled). To consider the existence of multiple deprivations occurring in the case of a same individual, all indicators need to be observed or inferred for the same individual, typically from the same data source. Second, the information on each dimension is then aggregated into one index. Summary indexes can be applied to generate rankings across population groups and countries, while ac-knowledging the multiplicity of deprivations. This section briefly discusses the proposed choices in each of these two stages.
Selected dimensions and indicators
The selection of the dimensions and indica-tors relevant to the measurement of standards of living is never simple. Possessing a clear conceptual framework to advise this process is therefore fundamental. The approach to the selection of the nonmonetary indicators is guided by the idea that poverty, at least in part, represents an inability to reach a min-imum standard of material well-being com-prising both market and nonmarket goods.
The choice of dimensions is informed by the following core principles:
• Centrality of private consumption. Pri-vate consumption (or income, when the

92 POVERTY AND SHARED PROSPERITY 2018
Most often, this is a measure of school enrollment (among children and youth of school age) or educational attainment (among adults). The education dimension here similarly has these two components. These indicators are available for many countries and are standardized in recent surveys across 119 countries.
3. Access to basic infrastructure. The third dimension encompasses access to key ser-vices that often require large-scale public investments to make them widely avail-able. Access to electricity and a certain standard of drinking water and sanitation are critical for economic activity and sur-vival (related to SDGs 6 and 7). Although many individuals pay for the provision of these services (through utility bills or oth-erwise), the choice set available to users (and their prices) depends to a large ex-tent on the initial investments that gov-ernments have made on electricity grids and water and sewer networks. This pub-lic action often determines the price and quality of the service provided.4 For the 119-country sample, indicators can be standardized across multipurpose house-hold surveys to reflect wider definitions of “at least limited” drinking water and “at least limited” sanitation used in the SDG monitoring, whereas, for the smaller six-country sample, the chosen indicator applies a more stringent definition also used under the SDG framework of access to “at least basic” water and sanitation.5
4. Health and nutrition. Health is widely considered a core dimension of well- being. It is the focus of SDG 3: ensure healthy lives and promote well-being for all at all ages. As in other cases, health care is typically not supplied entirely through the market or valued entirely at market prices. The empirical challenge of in-cluding this dimension for a large set of countries limits the feasibility of investi-gating health and nutrition meaningfully in the 119-country sample. However, for a smaller selection of countries, one may analyze indicators of access to formal health care services as well as direct in-dividual assessments of nutrition. Four indicators are included in the health and
services and health outcomes are rarely avail-able in the same household survey that also contains the lengthy questionnaires typically necessary to measure consumption poverty.
For this reason, the chapter conducts two complementary exercises. To get a global picture, the next section presents an analysis including a large number of countries (119, covering 45 percent of the world’s popu-lation) and includes three dimensions, in-cluding consumption, represented by six in-dicators. The second exercise uses data for a much smaller set of countries (six) to explore the impact of adding two additional dimen-sions. The analysis that follows should be un-derstood as an initial exploration to generate a consistent, conceptually robust, and prac-tical proposal for expanding current poverty measurement methods to include other non-monetary dimensions of well-being.
The five well-being dimensions consid-ered in this chapter are the following:
1. Monetary well-being. The first dimension is the monetary measure of well-being that the World Bank uses as its principal pov-erty measure: the income or consumption expenditure per person per day, valued at 2011 purchasing power parity (PPP) U.S. dollars, that is available to the individuals in the household (SDG target 1.1). This is the well-being measure and threshold fea-tured in chapter 1 of this report. The di-mension encompasses the range of goods and services that can be purchased at mar-ket prices. The sufficiency threshold is the international poverty line, currently set at US$1.90 per person per day. Individuals living in households in which per capita income falls below this cutoff are consid-ered deprived in the monetary dimension of well-being.
2. Education. Although education may be available through private or public institu-tions, provision among a large share of the population is fully or partially subsidized in most countries. The price that families must pay therefore does not adequately represent the value of the service. Indexes of multidimensional poverty typically include at least one indicator of access to formal education (related to SDG 4).
BEYOND MONETARY POVERTY 93
incidence of crime at the household level as well as the threat of crime, often defined by the incidence of crime in the commu-nity. The six-country study includes this indicator. In addition, this dimension in-corporates a measure of the prevalence of natural disasters that severely affected households’ well-being beyond short-term losses in consumption. Although information on the incidence of natural disasters is sometimes captured in shock modules in household surveys—such as in the six-country study analyzed in this chapter—other environmental qualities essential for a good life, such as air free of pollution, are most often not included and thus cannot be incorporated at this stage.6
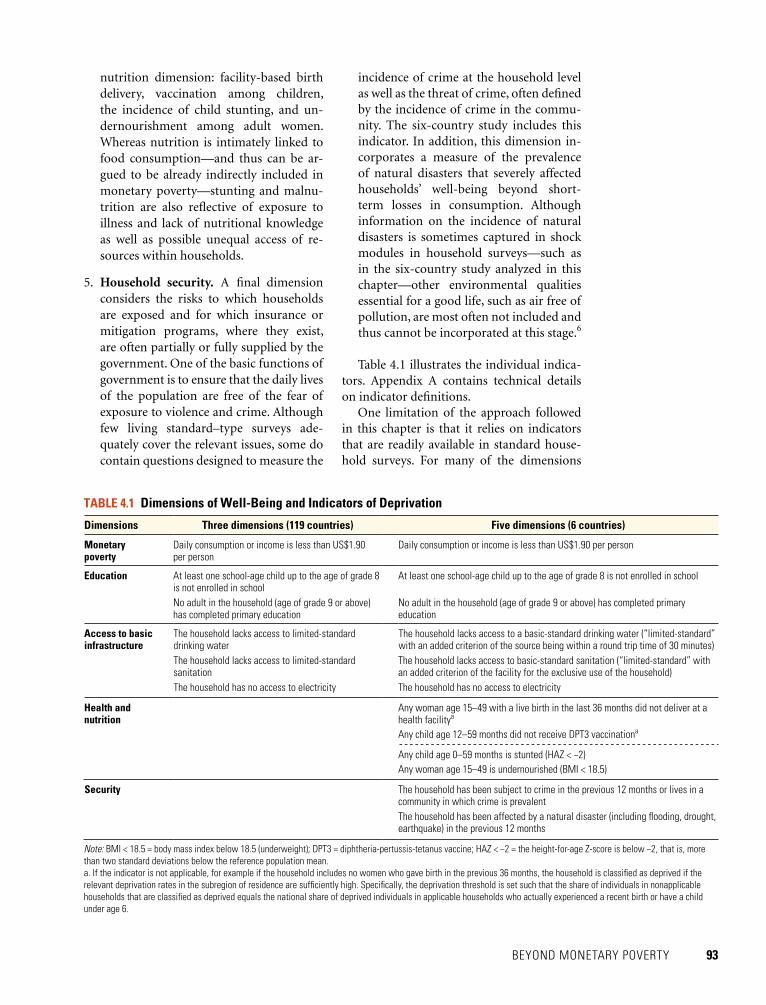
Table 4.1 illustrates the individual indica-tors. Appendix A contains technical details on indicator definitions.
One limitation of the approach followed in this chapter is that it relies on indicators that are readily available in standard house-hold surveys. For many of the dimensions
nutrition dimension: facility-based birth delivery, vaccination among children, the incidence of child stunting, and un-dernourishment among adult women. Whereas nutrition is intimately linked to food consumption—and thus can be ar-gued to be already indirectly included in monetary poverty—stunting and malnu-trition are also reflective of exposure to illness and lack of nutritional knowledge as well as possible unequal access of re-sources within households.
5. Household security. A final dimension considers the risks to which households are exposed and for which insurance or mitigation programs, where they exist, are often partially or fully supplied by the government. One of the basic functions of government is to ensure that the daily lives of the population are free of the fear of exposure to violence and crime. Although few living standard–type surveys ade-quately cover the relevant issues, some do contain questions designed to measure the
TABLE 4.1 Dimensions of Well-Being and Indicators of Deprivation
Dimensions Three dimensions (119 countries) Five dimensions (6 countries)
Monetary poverty
Daily consumption or income is less than US$1.90 per person
Daily consumption or income is less than US$1.90 per person
Education At least one school-age child up to the age of grade 8 is not enrolled in school
At least one school-age child up to the age of grade 8 is not enrolled in school
No adult in the household (age of grade 9 or above) has completed primary education
No adult in the household (age of grade 9 or above) has completed primary education
Access to basic infrastructure
The household lacks access to limited-standard drinking water
The household lacks access to a basic-standard drinking water (“limited-standard” with an added criterion of the source being within a round trip time of 30 minutes)
The household lacks access to limited-standard sanitation
The household lacks access to basic-standard sanitation (“limited-standard” with an added criterion of the facility for the exclusive use of the household)
The household has no access to electricity The household has no access to electricity
Health and nutrition
Any woman age 15–49 with a live birth in the last 36 months did not deliver at a health facilitya
Any child age 12–59 months did not receive DPT3 vaccinationa
Any child age 0–59 months is stunted (HAZ < −2)Any woman age 15–49 is undernourished (BMI < 18.5)
Security The household has been subject to crime in the previous 12 months or lives in a community in which crime is prevalentThe household has been affected by a natural disaster (including flooding, drought, earthquake) in the previous 12 months
Note: BMI < 18.5 = body mass index below 18.5 (underweight); DPT3 = diphtheria-pertussis-tetanus vaccine; HAZ < −2 = the height-for-age Z-score is below −2, that is, more than two standard deviations below the reference population mean.a. If the indicator is not applicable, for example if the household includes no women who gave birth in the previous 36 months, the household is classified as deprived if the relevant deprivation rates in the subregion of residence are sufficiently high. Specifically, the deprivation threshold is set such that the share of individuals in nonapplicable households that are classified as deprived equals the national share of deprived individuals in applicable households who actually experienced a recent birth or have a child under age 6.

94 POVERTY AND SHARED PROSPERITY 2018
combine household information on well- being across dimensions into a single num-ber. Such indicators facilitate comparisons across countries and time, especially if the extent of deprivation within countries varies across dimensions under consideration.
Any aggregation of indicators into a single index invariably involves a decision on how each of the indicators is to be weighted. There are various approaches to the selection of weights, including those stipulated by policy makers and those that are based on a poll of the preferences among the target population (Decancq and Lugo 2013). Although there are advantages and disadvantages to each of the methods, the approach chosen here follows standard practice in the field. Dimensions are weighted equally, and within each dimension each indicator is also equally weighted. The result is that each indicator has a different weight depending on the number of elements within its dimension. Weights must also ad-just as the number of considered dimensions changes, as illustrated in tables 4.2 and 4.3, where the number of dimensions rises from three to five.7
The main summary measure presented in the chapter is the multidimensional poverty headcount ratio, denoted by H. This index describes the share of people who are consid-ered multidimensionally deprived and par-allels the headcount measure used for global poverty monitoring (the poverty rate). Indi-viduals are considered multidimensionally deprived if they fall short of the threshold in at least one dimension or in a combina-tion of indicators equivalent in weight to a full dimension. In other words, in the three- dimension exercise, households will be con-sidered poor if they are deprived in indica-tors whose weight adds up to 1/3 or more. Analogously, in the five-dimension exercise, the weights on all deprivations must add up to 1/5 or more for a household to be clas-sified as poor. For example, in the three- dimension case, every person who lives in a household without access to water and sani-tation and with a child who does not attend school is considered multidimensionally de-prived, whereas members of another house-hold may be deprived because the household income does not meet basic needs. The index is thus a simple expression of an approach
considered, relevant information on the im-portant aspect of service quality is sometimes available in specialized surveys, but not in standard household surveys that also record other data on well-being. Essential infor-mation on quality thus cannot be used for various indicators here (box 4.2). If this in-formation becomes available through multi-purpose household surveys in the future or if a method can be developed to apply relevant administrative data at a sufficiently granular level, then subsequent measures of multi-dimensional well-being may reflect quality more accurately.
One dimension often featured in multidi-mensional well-being indexes, but not con-sidered here, is employment in a stable, dig-nified job. Employment may matter beyond the monetary benefits individuals derive from it because jobs can give people a sense of self-esteem and help them stay connected with society. An unstable employment con-tract could be detrimental to well-being be-cause of the financial and other risks associ-ated with such jobs. Employment is not part of the multidimensional poverty measure presented here for two reasons. First, many of the frequently used indicators of employment in high-income countries, such as unemploy-ment and wage employment, are not as rel-evant in low-income countries, which have very different labor market structures (Lugo 2007). Second, whatever relevant indicators of employment exist, these indicators are not available or not sufficiently harmonized in the different surveys considered here.
Aggregating multiple indicators into a single index
Each of the five dimensions discussed above is considered fundamental to well-being, even if other, equally important aspects of living standards are missing. They are im-portant not only separately but also in the way they are often present or absent together. The chapter therefore examines the share of people deprived according to each separate indicator, along with measures that capture the degree to which these deprivations arise together by counting the number of depriva-tions that individuals experience. In addition, the chapter presents summary indicators that

BEYOND MONETARY POVERTY 95
BOX 4.2 Incorporating Aspects of Quality into Multidimensional Poverty Measures
The measure of multidimensional poverty considered in this chapter does not contain sufficient information to thoroughly assess household well-being in all major dimensions, especially as it relates to the quality of services utilized. Although such information sometimes becomes available through specialized surveys, these specialized surveys often do not include all relevant dimensions of poverty. Therefore, the data requirement is too large for multidimensional poverty indicators to be accurately and consistently estimated across countries. In practice, this means that the indicators of multidimensional poverty considered here are restricted to reporting on the access of households to services, but not the quality of these services. Going forward, additional efforts are needed to collect richer data that include both access and quality of services.
Ensuring inclusive, equitable education of high quality is one of the core SDGs. Access to education is considered a fundamental right, but it needs to lead to “relevant and effective learning outcomes” (SDG target 4.1). An ideal indicator of education in a multidimensional poverty index ought to be the attainment by individuals of a basic level of learning capability (World Bank 2018d). Although indicators that account for learning outcomes are rare and might prove difficult to calculate through questions
that could be included in standard household surveys, a possible solution may involve national or subnational indicators of learning outcomes. Recently, the World Bank has harmonized data gathered through international educational testing programs—such as the Latin American Laboratory for Assessment of the Quality of Education, the Program for the Analysis of Education Systems of Confemen, the Program for International Student Assessment, the Southern and Eastern Africa Consortium for Monitoring Educational Quality, and the Trends in International Mathematics and Science Study—to allow for comparable indicators of learning to be computed across countries.a These data are core to the newly designed Human Capital Index (HCI) that the World Bank is presenting as part of the Human Capital Project (World Bank 2019). The HCI is a measure of human capital, designed as an indicator of each country’s future labor productivity, going beyond years of schooling. Specifically, the HCI combines, for each country, information on the level of education adjusted for quality and indicators of health status (stunting and mortality) (Kraay 2018).
The core drinking water and sanitation indicators of SDG 6.1 and 6.2 focus on the concept of safely managed, which contains a quality dimension that is not captured in the indicators described in this chapter. The World Health
Organization–United Nations Children’s Fund Joint Monitoring Programme for Water Supply, Sanitation and Hygiene (JMP) developed an operational model for monitoring SDG 6, on safely managed drinking water, sanitation, and hygiene.b Safely managed drinking water sources are basic drinking water sources located in the household, available as needed, and compliant with standards on fecal and chemical content. Similarly, safely managed sanitation services are basic sanitation facilities that are not shared and through which excreta are safely disposed in situ or transported and treated off-site.
Measures of quality could improve the indicator on electricity. In many countries, households may have access to electricity, but, because of frequent power outages, the service is unreliable. This ought to be incorporated so the indicator captures the benefits derived from the electricity rather than only a binary measure of access. Likewise, the quality of maternal care could be incorporated into the indicator on the births at health facilities. Many pregnant women may deliver at facilities, but the conditions of the facilities and the expertise of the people assisting the delivery can vary greatly. Accurate data on the quality of the facilities and the skills of the staff assisting in the deliveries would improve the accuracy of the health service indicator.
a. See LLECE (Latin American Laboratory for Assessment of the Quality of Education), Regional Bureau for Education in Latin America and the Caribbean, United Nations Educational, Scientific and Cultural Organization, Santiago, Chile, http://www.unesco .org/new/en/santiago/education/education-assessment-llece/; PASEC (Program for the Analysis of Education Systems of Confe-men) (database), PASEC and Conference of the Ministers of Education of French-Speaking Countries, Dakar, Senegal, http://www.pasec.confemen.org/donnees/; PISA (Programme for International Student Assessment) (database), Organisation for Economic Co-operation and Development, Paris, http://www.oecd.org/pisa/pisaproducts/; SACMEQ (Southern and Eastern Africa Consortium for Monitoring Educational Quality) (database), SACMEQ, Gaborone, Botswana, http://www.sacmeq.org/ ReadingMathScores; TIMSS (Trends in International Mathematics and Science Study) (database), International Association for the Evaluation of Educational Achievement, Amsterdam, http://www.iea.nl/timss.b. See JMP (WHO/UNICEF Joint Monitoring Programme for Water Supply, Sanitation and Hygiene) (database), United Nations Children’s Fund, New York; World Health Organization, Geneva, https://washdata.org/data.

96 POVERTY AND SHARED PROSPERITY 2018
in table 4.1, namely educational attainment among adults and access to limited-standard sanitation. Considering these two indicators alongside monetary poverty and using a sam-ple of 119 countries for circa 2013 (on data, see box 4.3.), the exercise finds 12 percent of the people to be monetarily poor, but, among them, only one individual in five is deprived only in the monetary dimension.8 The rest of the 12 percent are deprived at least in either educational attainment or access to limited- standard drinking water, with 5 percent of individuals experiencing deprivations in all three dimensions. At the same time, many individuals are not monetarily poor but are deprived in other aspects of well-being.
This observation raises several questions: How does our view of global poverty change if poverty is defined as insufficiency not only in monetary resources but also in a range of nonmonetary attributes that directly affect people’s well-being? Who are the new poor? In how many ways are they deprived? How do different regions fare if a wide-angle view of poverty is considered? Insights into the dif-ferential prevalence, nature, and distribution of multidimensional poverty in contrast to monetary poverty can be important for the formulation of effective poverty reduction policies. Highlighting the additional depriva-tions experienced by the extreme poor sen-sitizes policy makers to the importance of improving those aspects of human welfare not captured by the monetary measure alone. This is even more important as more people leave extreme poverty behind because a siz-able share of the non-income-poor popula-tion experiences other deprivations.
whereby the number of deprivations that people suffer are counted (Atkinson 2003).
The chapter also presents two alterna-tive multidimensional poverty indexes (see annex 4B for a formalization of the mea-sures). The first one, the adjusted head-count measure M, combines the incidence of poverty H with the average breadth of deprivation suffered by each poor person, as proposed by Alkire and Foster (2011). In addition, the chapter uses a measure that penalizes for the compounding ef-fect of multiple deprivations experienced by the same household (Chakravarty and D’Ambrosio 2006; Datt, forthcoming). As a result, if a household is deprived in any two indicators, its deprivation will be con-sidered greater than the sum of the depri-vations of two other households each only deprived on a single indicator. The measure is referred to as the distribution-sensitive multi dimensional measure, denoted by D. By incorporating information of the extent of deprivation suffered by individuals, both these measures bring valuable elements to the analysis. Although the three measures (H, M, and D) are presented in the chapter, precedence is given to the multidimensional poverty headcount ratio H because it is the closest analogue to the monetary poverty headcount ratio, used to monitor the first of the World Bank’s twin goals (see chapter 1 of this report).
A first global picture Expanding a poverty measure to include nonmonetary aspects brings into focus deprivations that may otherwise remain hid-den. For example, consider a slight extension of the monetary poverty measure: the addi-tion of only two of the indicators described
TABLE 4.3 Indicator Weights: Analysis of Five Dimensions
Five dimensions Weights
Income per capita 1/5Child school enrollment 1/10Adult school attainment 1/10Basic-standard drinking water 1/15Basic-standard sanitation 1/15Electricity 1/15Coverage of key health services 1/10Malnourishment (child and adult) 1/10Incidence of crime 1/10Incidence of natural disaster 1/10
TABLE 4.2 Indicator Weights: Analysis of Three Dimensions
Three dimensions Weights
Income per capita 1/3Child school enrollment 1/6Adult school attainment 1/6Limited-standard drinking water 1/9Limited-standard sanitation 1/9Electricity 1/9

BEYOND MONETARY POVERTY 97
A different image of the world emerges through the multidimensional lens. The pov-erty rate in Sub-Saharan Africa continues to be worryingly high, with almost two in three individuals (64.3 percent) living in multidi-mensional poverty in circa 2013. This is an increase of 40 percent from an already high monetary poverty rate of 44.9 percent. South Asia, however, changes even more dramat-ically. More than twice as many people in South Asia are multidimensionally poor as they are monetarily poor (table 4.4).
This raises important questions about the success of poverty reduction in South
Table 4.4 describes the share of people who are poor because of either monetary depriva-tion or multidimensional poverty as defined by the three dimensions and six indicators il-lustrated in table 4.1. The indicators cover the dimensions of monetary poverty, education (two indicators), and access to basic infrastruc-ture (three indicators). Approximately one individual in eight (11.8 percent) in the 119- country sample in circa 2013 lives in a house-hold experiencing monetary poverty, whereas almost one person in five (18.3 percent) lives in a multidimensionally deprived household.9 The multidimensional measure yields a more expansive view of poverty by counting as poor any individual with a cumulative deprivation above the critical threshold of 1/3.
The monetary poverty measure presented in chapter 1 outlines a bipolar world, with Africa on one end (a high poverty rate) and all the other regions, South Asia included, on the other end (a relatively low poverty rate). The separation of Sub-Saharan Africa from the other regions is seen more clearly when looking at the poverty trends over the last 25 years. East Asia and Pacific, South Asia, and Sub-Saharan Africa all started with a relatively high poverty rate in 1990; however, while poverty declined rapidly in the first two regions, the decline was much slower in Sub-Saharan Africa. Consequently, Sub-Saharan Africa today comprises most of the world’s poor. If the trend contin-ues, by 2030 the extreme poor will almost exclusively be in the region.
TABLE 4.4 People Living in Monetary or Multidimensional Poverty, 119 Economies, circa 2013
Region
Monetary Multidimensional
Number of economies
Population coverage (%)
Headcount ratio
Share of the poor (%)
Headcount ratio (H)
Share of the poor (%)
East Asia and Pacific 5.3 8.1 7.5 7.3 13 28.9Europe and Central Asia 0.3 0.4 1.1 0.8 17 90.0Latin America and the Caribbean 3.9 5.7 6.1 5.8 17 91.5Middle East and North Africa 3.2 2.2 5.9 2.6 9 72.1South Asia 11.9 12.3 26.6 17.7 5 23.0Sub-Saharan Africa 44.9 70.9 64.3 65.4 29 60.7Rest of the world 0.5 0.5 0.5 0.3 29 39.6
Total 11.8 100.0 18.3 100.0 119 45.0
Source: Estimates based on the harmonized household surveys in 119 economies, circa 2013, GMD (Global Monitoring Database), Global Solution Group on Welfare Measure-ment and Capacity Building, Poverty and Equity Global Practice, World Bank, Washington, DC.Note: The reported multidimensional headcount ratio is estimated on the basis of three dimensions—monetary, education, and basic infrastructure access, as defined in table 4.1—and an overall poverty cutoff of one-third of the weighted deprivations. The data are derived from household surveys conducted in about 2013 (+/−3 years). Because of the unavailability or incomparability of data, analysis does not include all countries. The last column shows the percentage of regional or global populations covered by the surveys. Percentages may not sum to 100 because of rounding.
BOX 4.3 Chapter 4: Data Overview
This chapter relies on information from the harmonized household surveys in the Global Monitoring Database (GMD) for circa 2013. Surveys have been included in the multidimensional poverty analysis if they satisfy the following criteria:
• They include a monetary welfare measure (income or expenditure) and indicators on education and basic infrastructure access that may be used to construct a multidimensional poverty measure.
• The surveys were conducted within three years of 2013, that is, from 2010 to 2016.
The extreme poverty rate (headcount ratio) reported in this chapter cannot be compared to the information presented in chapter 1 for practical and methodological reasons. For more details, see appendix A.

98 POVERTY AND SHARED PROSPERITY 2018
doubles in the five South Asian countries be-cause of the relatively low correlation in depri-vations across dimensions. In these countries, a household that is deprived in education at-tainment has a high probability of being de-prived in school enrollment as well, making its members multidimensionally poor. But the correlation between the monetary dimension and the education indicators is weak, which means the same households are not deprived in the monetary dimension. This adds new households to the count of the poor.
Because the difference in poverty incidence according to the two measures is the result of cumulative nonmonetary deprivations, it is natural to inquire about the components most responsible for the difference. Table 4.5 presents the poverty headcount ratio at US$1.90 a day as well as the deprivation rate associated with each of the five nonmonetary indicators. Despite having made progress in poverty reduction, the countries included in the sample for South Asia still are highly de-prived in the education dimension. An issue
Asia. The challenge in securing higher living standards for the population of South Asia is more daunting when poverty in all its forms is considered. Although South Asia is ex-pected to meet the goal of reducing extreme poverty below 3 percent by 2030, many peo-ple will still be living in unsatisfactory con-ditions if no progress is made in the other components of well-being.
It is apparent from table 4.4 that the multi-dimensional poverty headcount is always higher than the monetary poverty headcount. This regularity arises because of the relative importance assigned to each component and the stipulated overall poverty threshold that determines if a household is considered multidimensionally poor. If a household is deprived in at least one dimension, then the members are considered multidimension-ally poor. Because the monetary dimension is measured using only one indicator, any-one who is income poor is automatically also poor under the broader poverty concept. The difference between the headcounts therefore hinges on those individuals among whom the privation is a result of a shortfall in the nonmonetary dimensions of life despite their ability to command sufficient financial re-sources to cross the monetary poverty thresh-old. These households would be deemed nonpoor under the narrower poverty con-cept on the basis of insufficiency in monetary resources, leaving policy makers with an un-duly optimistic assessment of poverty from a multidimensional perspective.
The underlying structure of the depriva-tion experienced by the multidimensionally poor is depicted in figure 4.1. There is a large degree of overlap between dimensions. Only a small minority of the multidimensionally poor are deprived in only one dimension, whereas more than a third are simultaneously deprived in all three dimensions. The over-lap is highest in Sub-Saharan Africa (annex 4C, figure 4C.1). A larger overlap between dimensions indicates a larger extent of in-terdependence, which implies that policy in-terventions targeted exclusively toward one dimension may not reduce multidimensional poverty and therefore a multipronged ap-proach might be required.
Going from monetary to multidimen-sional poverty, the poverty rate more than
FIGURE 4.1 Individuals in Multidimensional Poverty, 119 Economies, circa 2013
Source: Estimates based on the harmonized household surveys in 119 economies, circa 2013, GMD (Global Monitoring Database), Global Solution Group on Welfare Measurement and Capacity Building, Poverty and Equity Global Practice, World Bank, Wash-ington, DC.Note: The diagram shows the share of population that is multi-dimensionally poor, and the dimensions they are deprived in. For example, the numbers in the blue oval add up to 11.8 percent, which is the monetary headcount. Adding up all numbers in the figure results in 18.3 percent, which is the proportion of people that are multidimensionally deprived.
1.3Monetary
0.6Education
0.7
Basic infrastructure
0.6
3.3
5.2
6.6

BEYOND MONETARY POVERTY 99
rate, but Pakistan’s level of deprivation in education attainment and enrollment is far higher than that of Vietnam (Table 4C.4). These countries typify the development ex-perience of the two regions. Expansion in access to education preceded or was contem-poraneous with the growth in income in East Asia, whereas despite rising incomes human development has lagged in South Asia (World Bank 2018d). Iraq experiences the highest deprivation in the education dimension, and it is one of the few countries where school enrollment outcome is worse than education attainment. Over the last 15 years, access to schooling in Iraq has been disrupted because of conflict, which is a reminder that progress cannot be taken for granted, especially in fragile and conflict-affected situations.
The examination of indicator deprivation rates does not reveal information about the simultaneity of deprivations. To consider this aspect, other tools are needed. One of the simplest approaches involves counting the number of indicators in which people are de-prived contemporaneously. Figure 4.2 shows the shares of individuals deprived according to the maximum of six indicators. Approxi-mately 60 percent of people in the 119 coun-tries are not deprived in any of the six indi-cators. More than 80 percent of Sub-Saharan Africans exhibit at least one deprivation, but a smaller share of South Asians (65.6 per-cent) experience at least one deprivation; as
of apparent global concern is poor sanitation: approximately a quarter of the population in the 119-country sample lives in households lacking access to even a limited standard of sanitation. The populations in regions with low monetary poverty like East Asia and Pa-cific, Latin America and the Caribbean, and the Middle East and North Africa suffer a san-itation deprivation rate several times as high as that in the monetary dimension. Globally, almost one individual in six is not connected to electricity. Yet this is overwhelmingly a South Asian and Sub-Saharan African phe-nomenon: approximately one South Asian in four and two Sub-Saharan Africans in three lack electricity at home.
An examination of deprivation rates, one indicator at a time, generally confirms that the regional ranking for any one indicator is consistent with the others. Regions more de-prived in one indicator are highly likely to be more deprived in other indicators. However, there are anomalies. For example, the Europe and Central Asia region shows the lowest in-cidence of monetary poverty; however, the share of people deprived in school enroll-ment in the region is higher than in both the East Asia and Pacific and the Latin America and Caribbean regions.
Important insights on the pattern of de-velopment can be gleaned from country outcomes as well. For example, Pakistan and Vietnam both have a low absolute poverty
TABLE 4.5 Individuals in Households Deprived in Each Indicator, 119 Economies, circa 2013
RegionMonetary
(%)
Educational attainment
(%)
Educational enrollment
(%)Electricity
(%)Sanitation
(%)
Drinking water
(%)
East Asia and Pacific 5.3 7.5 3.2 4.5 14.0 11.3Europe and Central Asia 0.3 0.9 5.6 0.5 6.8 2.6Latin America and the Caribbean 3.9 12.2 2.7 3.3 15.6 6.4Middle East and North Africa 3.2 11.1 7.9 3.8 14.6 4.2South Asia 11.9 31.6 22.6 23.8 39.5 7.0Sub-Saharan Africa 44.9 46.2 20.8 64.8 61.9 33.9Rest of the world 0.5 1.2 0.0 0.0 0.6 0.0
Total 11.8 17.0 9.0 15.9 23.8 10.9
Source: Estimates based on the harmonized household surveys in 119 economies, circa 2013, GMD (Global Monitoring Database), Global Solution Group on Welfare Measure-ment and Capacity Building, Poverty and Equity Global Practice, World Bank, Washington, DC.Note: The definition of the indicators and the deprivation thresholds are as follows: Monetary poverty: a household is deprived if income or expenditure, in 2011 purchasing power parity U.S. dollars, is less than US$1.90 per person per day. Educational attainment: a household is deprived if no adult (grade 9 equivalent age or above) has completed primary education. Educational enrollment: a household is deprived if at least one child (grade 8 equivalent age or below) is not enrolled in school. Electricity: a household is deprived if it does not have access to electricity. Sanitation: a household is deprived if it does not have access to even a limited standard of sanitation. Drinking water: a house-hold is deprived if it does not have access to even a limited standard of drinking water. The data reported refer to the share of people living in households deprived according to each indicator.

100 POVERTY AND SHARED PROSPERITY 2018
The adjusted headcount measure M defined in the previous section is sensitive to both the incidence and breadth of multidimen-sional poverty. If a poor household becomes deprived in additional elements, the changes are registered by the measure—something that will not be captured by the headcount H. The adjusted headcount measure, however, does not take into account the deprivations of households deemed to be multidimension-ally nonpoor. This can ignore a substantial portion of deprivation. Of the total popula-tion in the sample, 15.5 percent is deprived in only one indicator and another 8.2 per-cent deprived in two indicators (table 4.6). A subset of these households is not identified as multidimensionally poor because their total weighted deprivation does not cross the poverty threshold of one-third. In fact, most individuals experiencing one deprivation and two-thirds of individuals experiencing two deprivations are not multidimensionally poor. They face an average of 0.13 and 0.25 weighted deprivations, respectively, which is missed by the intensity-sensitive measure.
The picture of poverty can shift yet again under the distribution-sensitive measure D, the third measure, because it differs from the adjusted headcount measure in two crucial ways. Unlike the adjusted headcount mea-sure, the distribution-sensitive measure is not associated with a prespecified poverty threshold so it counts deprivations experi-enced by all households. Second, it penalizes compounding deprivations such that poverty is higher when one household experiences two deprivations than when two households experience one deprivation each.
The regional estimates for multidimen-sional headcount, adjusted headcount, and distribution-sensitive measures are presented in table 4.7. Because the scales of the two measures do not lend themselves to easy comparison, the focus is on the regional con-tribution to global poverty under each ap-proach. Moving from multidimensional pov-erty headcount (H) to the intensity-sensitive measure (M), the concentration of poverty shifts further to Africa. This shift is driven by the breadth of deprivation in Sub-Saharan Africa, which is twice as high as in South Asia and several times higher than in other re-gions of the world (table 4.7).
the number of deprivations rises, a large gap opens between South Asia and Sub-Saharan Africa. Whereas 20.5 percent of South Asia’s population is deprived in three or more in-dicators, 55.1 percent of Africans are so de-prived. On the shares experiencing four or more deprivations, South Asia catches up to the world at large. Thus, in addition to the relatively larger share of Sub-Saharan Afri-cans who are deprived in each dimension, Sub-Saharan Africans suffer from a greater average number of deprivations than people elsewhere.
Incorporating breadth of poverty into the measurement
Summarizing the information on the num-ber of deprivations into a single index proves useful in making comparisons across popula-tions and across time. Aggregate multidimen-sional poverty measures provide an easy way to rank countries and monitor their progress.
FIGURE 4.2 Share of Individuals Deprived in at Least a Given Number of Indicators, 119 Economies, circa 2013
Source: Estimates based on the harmonized household surveys in 119 economies, circa 2013, GMD (Global Monitoring Database), Global Solution Group on Welfare Measurement and Capacity Building, Poverty and Equity Global Practice, World Bank, Washington, DC.
0
10
20
30
40
50
60
70
80
90
100
1 2 3 4 5 6
Shar
e of
pop
ulat
ion
(%)
Number of indicators deprived in
Europe and Central AsiaLatin America and the Caribbean
East Asia and Pacific
Middle East and North Africa
South AsiaSub-Saharan Africa
Rest of the world
Total

BEYOND MONETARY POVERTY 101
An appealing feature of the adjusted head-count measure M is that the overall measure can be easily decomposed into the relative contribution of each indicator. Such de-compositions matter for understanding the drivers of multidimensional poverty, and the sectors that ought to be given priority in the design of poverty-alleviating policies. If the poverty rate is high because of income in-sufficiency, a focus on economic growth or income support is appropriate; but, if edu-cation or access to utilities plays a dominant role in multidimensional poverty, invest-ments in the corresponding sectors may yield the highest returns to poverty reduction.
In high-income countries, multidimen-sional poverty, though extremely low, almost
The distribution of global poverty is subject to two countervailing effects when going from the intensity-sensitive measure (M) to the distribution-sensitive measure (D). Counting all deprivations pushes the distribution of poverty to regions that have few multidimensionally poor but many who suffer from at least one deprivation. At the same time, assigning more importance to compounding deprivations pulls it toward regions with high breadth of deprivation. The first effect more than offsets the second in Europe and Central Asia, Latin America and the Caribbean, and the Middle East and North Africa, resulting in a slightly higher contribution of these regions to global pov-erty under D than under M (table 4.7).
TABLE 4.6 The Multidimensionally Poor and the Breadth of Deprivation, by Number of Deprivations, 119 Economies, circa 2013
Number of deprivations
Share of the population (%)
Multidimensional poverty status Breadth of deprivation
Nonpoor (%) Poor (%) Nonpoor Poor
0 62.0 62.0 0.0 0.00 n.a. 1 15.5 14.1 1.4 0.13 0.332 8.2 5.7 2.5 0.25 0.433 6.0 0.0 6.0 n.a. 0.484 4.8 0.0 4.8 n.a. 0.655 2.8 0.0 2.8 n.a. 0.836 0.7 0.0 0.7 n.a. 1.00
Total 100.0 81.7 18.3 0.04 0.58
Source: Estimates based on the harmonized household surveys in 119 economies, circa 2013, GMD (Global Monitoring Database), Global Solution Group on Welfare Measure-ment and Capacity Building, Poverty and Equity Global Practice, World Bank, Washington, DC.Note: A household is multidimensionally poor if it is deprived in more than a third of weighted deprivations. Breadth of deprivation refers to the average number of deprivations relative to the total number of indicators. It varies from 0 to 1, where 1 represents a person deprived in all six indicators. The shares may not sum to 100 because of rounding. n.a. = not applicable.
TABLE 4.7 Regional Contributions to Multidimensional Poverty, 119 Economies, circa 2013
RegionBreadth of deprivation
Share of the population (%)
Multidimensional headcount (H)
Adjusted headcount measure (M)
Distribution-sensitive measure (D)
H Contribution (%) M Contribution (%) D Contribution (%)
East Asia and Pacific 0.07 17.8 7.5 7.3 0.03 5.8 0.02 5.5Europe and Central Asia 0.02 13.3 1.1 0.8 0.00 0.5 0.01 0.9Latin America and the Caribbean 0.07 17.4 6.1 5.8 0.03 4.7 0.02 5.1Middle East and North Africa 0.06 8.1 5.9 2.6 0.03 2.1 0.02 2.2South Asia 0.21 12.1 26.6 17.7 0.14 15.9 0.09 15.2Sub-Saharan Africa 0.44 18.6 64.3 65.4 0.40 70.8 0.29 70.9Rest of the world 0.00 12.7 0.5 0.3 0.00 0.2 0.00 0.2
Total 0.14 100.0 18.3 100.0 0.11 100.0 0.07 100.0
Source: Estimates based on the harmonized household surveys in 119 economies, circa 2013, GMD (Global Monitoring Database), Global Solution Group on Welfare Measure-ment and Capacity Building, Poverty and Equity Global Practice, World Bank, Washington, DC.Note: Breadth of deprivation refers to the average number of deprivations relative to the total number of indicators. It varies from 0 to 1, where 1 represents a person deprived in all six indicators.

102 POVERTY AND SHARED PROSPERITY 2018
poverty is predominantly a rural phenome-non: 45.8 percent of the total sample popula-tion is rural, but 81.3 percent of the monetary poor are living in rural areas (annex 4C, table 4C.1). If poverty is considered more broadly with the multidimensional lens, the distribu-tion of poverty tilts even more toward rural areas. Thus, 83.5 percent of the multidimen-sionally poor are rural dwellers, implying that, relative to urban households, rural house-holds suffer cumulatively more deprivations in access to education and essential utilities. The most pronounced shifts of poverty to-ward rural areas are observed in East Asia and Pacific and in Latin America and the Carib-bean (figure 4.4). In these regions, the shift in the composition is largely driven by depriva-tions in limited standard sanitation and adult educational attainment. In contrast, poverty becomes more urban in the Middle East and North Africa and South Asia, suggesting that urban residents in these regions, although not monetarily poor, experience deprivations in some of these additional aspects of life.
With respect to household composition, households with children are overrepresented among both the monetary poor and the mul-tidimensionally poor, regardless of the gender or number of adults in the household (figure 4.5; also annex 4C, table 4C.2).10 The shift
exclusively arises because of insufficient in-come given the near-universal access to edu-cation and infrastructure services (figure 4.3). For the multidimensionally poor in Europe and Central Asia, access to electricity is a much more important driver of poverty than else-where. The comparison across Sub-Saharan Africa and South Asia reveals how the underly-ing structure of deprivations differs across the two regions. In South Asia, the education di-mension has a disproportionate contribution to poverty (46 percent), whereas the contribu-tion of monetary poverty is relatively low (24.6 percent). In Sub-Saharan Africa, the services (39.7) and the monetary (36.1) dimensions contribute the most to multidimensional pov-erty, and the education dimension contributes the least (24.2 percent). This may suggest a dif-ferent policy focus in the two regions. The pri-ority in these South Asian countries should be wider access to education whereas expansion of basic infrastructure services will have the strongest impact in Sub-Saharan Africa.
Who are the monetarily and multidimensionally poor?
As the definition of poverty broadens to in-clude additional aspects of deprivation, the composition of the poor changes. Monetary
FIGURE 4.3 Contribution of Indicators to the Adjusted Headcount Measure (M), 119 Economies, circa 2013
Source: Estimates based on the harmonized household surveys in 119 economies, circa 2013, GMD (Global Monitoring Database), Global Solution Group on Welfare Measurement and Capacity Building, Poverty and Equity Global Practice, World Bank, Washington, DC.
Rest of the world
0 20 40 60 80 100
East Asia and Pacific
Europe and Central Asia
Latin America and the Caribbean
Middle East and North Africa
South Asia
Sub-Saharan Africa
Total
MonetaryElectricity
Educational attainmentLimited-standard sanitation
Educational enrollmentLimited-standard water
Percent

BEYOND MONETARY POVERTY 103
from an exclusively monetary approach to a multidimensional account of poverty does not substantially change the demographic composition of the poor, though house-holds with only one adult woman (with or without children) represent a slightly larger share in the latter case (8.8 percent compared with 8.1 percent). All indicators included in this chapter are measured at the household level and thus do not distinguish differences within households. The estimates also assume that resources are distributed equally within a household, that all household members have similar needs, and that there are no scale economies in larger households. Assessing individual well-being requires measuring intrahousehold resource allocation and the needs of each household member. Chapter 5 investigates methods that estimate individual well-being from underlying household data.11
A deeper look Extending monetary poverty by including measures of access to education and basic in-frastructure services changes the understand-ing of poverty. However, even this extension to three dimensions fails to capture other key dimensions of well-being. This section augments multidimensional poverty by also including measures of access to health care services and lack of security. The analysis is carried out on six countries for which in-formation on households from a single data source is available. This exercise is exploratory in nature and the numbers presented might diverge from recent official sources (and even from the analysis performed in the previous section) because in all but one country the analysis is based on different household sur-veys than the one used for calculating mone-tary poverty. Instead, it uses surveys that are comprehensive enough to include the addi-tional dimensions. The purpose of the exer-cise is to illustrate the gains and insights that could emerge if this information was avail-able for a larger set of countries.
Accounting for the two extra dimensions of well-being further enhances the under-standing of poverty. The proportion of peo-ple identified as poor under the expanded definition is higher than with the three- dimensional measure, suggesting that the
FIGURE 4.5 Contribution to Monetary and Multidimensional Poverty, by Household Type, 119 Economies, circa 2013
Source: Estimates based on the harmonized household surveys in 119 economies, circa 2013, GMD (Global Monitoring Database), Global Solution Group on Welfare Measurement and Capacity Building, Poverty and Equity Global Practice, World Bank, Washington, DC.
FIGURE 4.4 Difference in the Share of the Poor in Rural Areas, Multidimensional Headcount vs. Monetary Headcount, 119 Economies, circa 2013
Source: Estimates based on the harmonized household surveys in 119 economies, circa 2013, GMD (Global Monitoring Database), Global Solution Group on Welfare Measurement and Capacity Building, Poverty and Equity Global Practice, World Bank, Washington, DC.Note: The lines indicate the difference in percentage points of the rural share of the poor when com-paring multidimensional and monetary poverty. A positive value indicates that the rural share of the poor is greater with the multidimensional measure.
Perc
enta
ge p
oint
diff
eren
ceRest
of theworld
Sub-SaharanAfrica
TotalSouthAsia
MiddleEast and
NorthAfrica
LatinAmericaand the
Caribbean
Europeand
CentralAsia
East Asiaand
Pacific
–4
–2
0
2
4
6
8
10
0
10
20
30
40
50
60
70
80
90
100
Perc
ent
Population Monetary poor Multidimensional poor
Two adults, with childOne adult male, with no childrenOne adult male, with childrenOne adult female, with no children
Only childrenOnly seniorsMultiple adults, with no childrenMultiple adults, with childrenTwo adults, without child One adult female, with children
104 POVERTY AND SHARED PROSPERITY 2018
fare after the multidimensional poverty mea-sure is extended.12
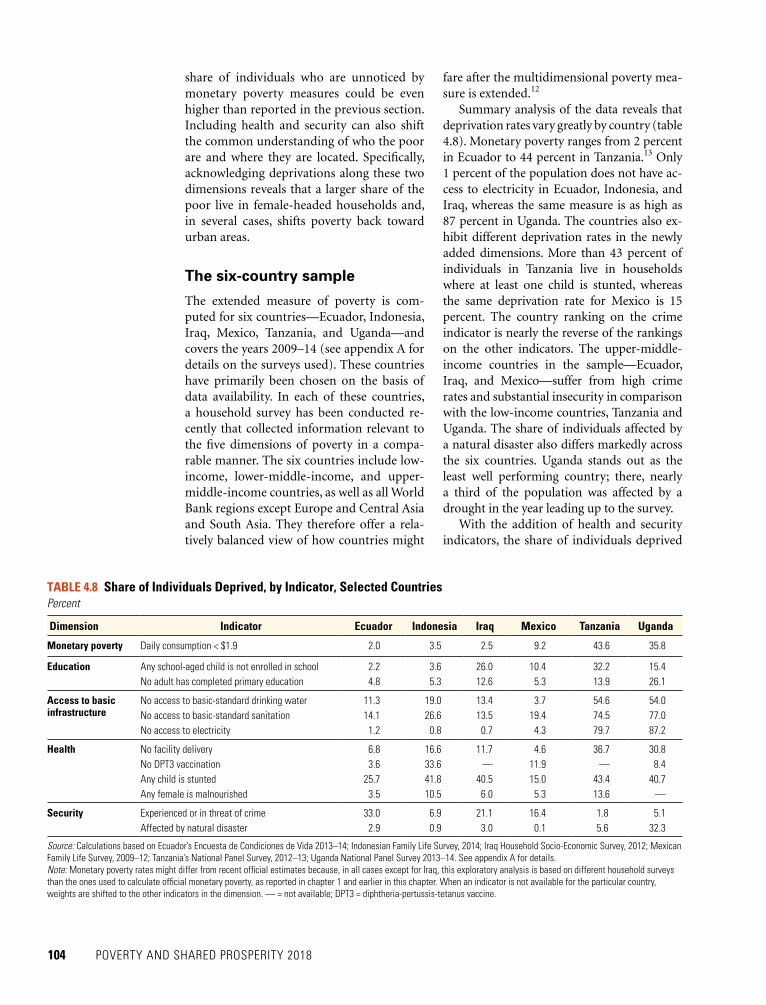
Summary analysis of the data reveals that deprivation rates vary greatly by country (table 4.8). Monetary poverty ranges from 2 percent in Ecuador to 44 percent in Tanzania.13 Only 1 percent of the population does not have ac-cess to electricity in Ecuador, Indonesia, and Iraq, whereas the same measure is as high as 87 percent in Uganda. The countries also ex-hibit different deprivation rates in the newly added dimensions. More than 43 percent of individuals in Tanzania live in households where at least one child is stunted, whereas the same deprivation rate for Mexico is 15 percent. The country ranking on the crime indicator is nearly the reverse of the rankings on the other indicators. The upper-middle- income countries in the sample—Ecuador, Iraq, and Mexico—suffer from high crime rates and substantial insecurity in comparison with the low-income countries, Tanzania and Uganda. The share of individuals affected by a natural disaster also differs markedly across the six countries. Uganda stands out as the least well performing country; there, nearly a third of the population was affected by a drought in the year leading up to the survey.
With the addition of health and security indicators, the share of individuals deprived
share of individuals who are unnoticed by monetary poverty measures could be even higher than reported in the previous section. Including health and security can also shift the common understanding of who the poor are and where they are located. Specifically, acknowledging deprivations along these two dimensions reveals that a larger share of the poor live in female-headed households and, in several cases, shifts poverty back toward urban areas.
The six-country sample
The extended measure of poverty is com-puted for six countries—Ecuador, Indonesia, Iraq, Mexico, Tanzania, and Uganda—and covers the years 2009–14 (see appendix A for details on the surveys used). These countries have primarily been chosen on the basis of data availability. In each of these countries, a household survey has been conducted re-cently that collected information relevant to the five dimensions of poverty in a compa-rable manner. The six countries include low- income, lower-middle-income, and upper- middle-income countries, as well as all World Bank regions except Europe and Central Asia and South Asia. They therefore offer a rela-tively balanced view of how countries might
TABLE 4.8 Share of Individuals Deprived, by Indicator, Selected CountriesPercent
Dimension Indicator Ecuador Indonesia Iraq Mexico Tanzania Uganda
Monetary poverty Daily consumption < $1.9 2.0 3.5 2.5 9.2 43.6 35.8
Education Any school-aged child is not enrolled in school 2.2 3.6 26.0 10.4 32.2 15.4No adult has completed primary education 4.8 5.3 12.6 5.3 13.9 26.1
Access to basic infrastructure
No access to basic-standard drinking water 11.3 19.0 13.4 3.7 54.6 54.0No access to basic-standard sanitation 14.1 26.6 13.5 19.4 74.5 77.0No access to electricity 1.2 0.8 0.7 4.3 79.7 87.2
Health No facility delivery 6.8 16.6 11.7 4.6 36.7 30.8No DPT3 vaccination 3.6 33.6 — 11.9 — 8.4Any child is stunted 25.7 41.8 40.5 15.0 43.4 40.7Any female is malnourished 3.5 10.5 6.0 5.3 13.6 —
Security Experienced or in threat of crime 33.0 6.9 21.1 16.4 1.8 5.1Affected by natural disaster 2.9 0.9 3.0 0.1 5.6 32.3
Source: Calculations based on Ecuador’s Encuesta de Condiciones de Vida 2013–14; Indonesian Family Life Survey, 2014; Iraq Household Socio-Economic Survey, 2012; Mexican Family Life Survey, 2009–12; Tanzania’s National Panel Survey, 2012–13; Uganda National Panel Survey 2013–14. See appendix A for details.Note: Monetary poverty rates might differ from recent official estimates because, in all cases except for Iraq, this exploratory analysis is based on different household surveys than the ones used to calculate official monetary poverty, as reported in chapter 1 and earlier in this chapter. When an indicator is not available for the particular country, weights are shifted to the other indicators in the dimension. — = not available; DPT3 = diphtheria-pertussis-tetanus vaccine.

BEYOND MONETARY POVERTY 105
mension, or the correlational structure link-ing the various dimensions. The last reason may be less apparent, but it is conceptually important: if households deprived in any of the added dimensions were already de-prived according to the three-dimension measures, implying that the correlation be-tween the deprivations are high, then adding new dimensions need not raise the poverty headcount rates. Conversely, if the new di-mensions are uncorrelated or, especially, neg-atively correlated with deprivation according to the three-dimension measure, then the ad-dition of the new dimensions may lead to an upward surge in poverty rates. Similar to the three-dimension multidimensional measure above, decompositions of the adjusted head-count ratios (M) can be used to unpack how much the different dimensions contribute to poverty in each of the countries studied.
The addition of the health and security dimensions to the three-dimension measure shifts the drivers of poverty in several coun-tries (figure 4.8). Measured in three dimen-
in at least one indicator is troublingly high (figure 4.6). In Tanzania and Uganda, as many as 95 percent of the population is de-prived in at least one indicator. Even in the top-performing countries, Ecuador and Mexico, more than half the population is deprived in at least 1 of the 12 indicators. If a household is considered worthy of atten-tion when it is deprived in any of the rele-vant indicators, then monetary poverty and even multidimensional poverty measures in three dimensions fail to capture many house-holds. The number of deprivations people experience declines rapidly as the deprived indicator count increases, and virtually no one is deprived in all 12 indicators (or 11 or 10) in any country. Yet the decline occurs more quickly in some countries than in oth-ers. In Tanzania and Uganda, about half of the population is deprived in five indicators, highlighting the compounded disadvantages many households suffer in these countries.
Comparing alternative measures of poverty
Because of the frequency of cumulative deprivations, headcount ratios rise several- fold in some countries if one shifts from monetary poverty to the multidimensional poverty measure in five dimensions (figure 4.7). In Iraq, 2.5 percent of the population are counted among the monetary poor; 10.4 percent are poor if three dimensions are considered (with a cutoff of one-third); and 28.4 percent are poor if five dimensions are considered (with a cut-off of one-fifth). Pov-erty rates climb by an average 41 percent if the five-dimension measure is used instead of the three-dimension measure. Clearly, as the poverty measure becomes more comprehen-sive and deprivation in a single dimension (or indicators whose weights add up to that of a single dimension) continues to define poverty, the count of individuals living in poverty rises.
The headcount ratios mask the dimen-sions and indicators driving the rise in pov-erty rates, and those dimensions and indica-tors vary across countries. The increase may be caused by any of the added dimensions, more stringent definitions in the services di-
FIGURE 4.6 Share of Individuals Deprived in at Least a Given Number of Indicators, Selected Countries
Source: Calculations based on Ecuador’s Encuesta de Condiciones de Vida 2013–14; Indonesian Family Life Survey, 2014; Iraq Household Socio-Economic Survey, 2012; Mexican Family Life Survey, 2009–12; Tanzania’s National Panel Survey, 2012–13; Uganda National Panel Survey 2013–14. See appendix A for details.
0
20
40
60
80
100
Shar
e of
the
popu
latio
n (%
)
Number of indicators deprived in1 2 3 4 5 6 7 8 9 10 11 12
EcuadorMexico
IndonesiaTanzania
IraqUganda

106 POVERTY AND SHARED PROSPERITY 2018
2.05.9
10.3
3.57.3
16.1
2.5
10.4
28.4
9.213.3
16.2
43.6
63.3
71.9
35.8
54.8
76.0
0
10
20
30
40
50
60
70
80
Ecuador Indonesia Iraq Mexico Tanzania Uganda
Shar
e of
pop
ulat
ion
(%)
Monetary poverty Multidimensional poverty (3 dimensions) Multidimensional poverty (5 dimensions)
FIGURE 4.7 The Headcount Ratio, by Alternative Poverty Measures, Selected Countries
Source: Calculations based on Ecuador’s Encuesta de Condiciones de Vida 2013–14; Indonesian Family Life Survey, 2014; Iraq Household Socio-Economic Survey, 2012; Mexican Family Life Survey, 2009–12; Tanzania’s National Panel Survey, 2012–13; Uganda National Panel Survey 2013–14. See appendix A for details.Note: The figure shows the share of the population that is considered poor under three different definitions of poverty. Monetary poverty = individuals living on less than US$1.90 a day. Multidimensional poverty (three dimensions) = individuals deprived in at least 33 percent of the (weighted) indicators according to the multidimensional headcount measure; the dimensions considered are monetary poverty, edu-cation and access to basic infrastructure. Multidimensional poverty (five dimensions) = individuals deprived in at least 20 percent of the (weighted) indicators according to the multidimensional headcount measure and considering all five dimensions. Each dimension in the three-dimension measure is weighted 0.33. Each dimension in the five-dimension measure is weighted 0.20. In the multidimension mea-sures, each indicator is weighted equally within dimensions. Monetary poverty rates might differ from recent official estimates because, in all cases except for Iraq, this exploratory analysis is based on different household surveys than the ones used to calculate official mon-etary poverty, as reported in chapter 1 and earlier in this chapter.
FIGURE 4.8 Contribution to Multidimensional Poverty (M), by Dimension, Selected Countries
Source: Calculations based on Ecuador’s Encuesta de Condiciones de Vida 2013–14; Indonesian Family Life Survey, 2014; Iraq Household Socio-Economic Survey, 2012; Mexican Family Life Survey, 2009–12; Tanzania’s National Panel Survey, 2012–13; Uganda National Panel Survey 2013–14. See appendix A for details.Note: The figure shows the contribution of each dimension to the adjusted-headcount ratio M based on the dimensional breakdown method of Alkire et al. (2015).
0
20
40
60
80
100
Ecuador
3 5 3 5 3 5Dimensions
3 5 3 5 3 5
Indonesia Iraq Mexico Tanzania Uganda
Cont
ribut
ion
to to
tal p
over
ty (%
)
Monetary Education Basic infrastructure Health Security

BEYOND MONETARY POVERTY 107
of the households that suffer from crime do not experience other deprivations, and hence do not meet the criteria for classification among the poor. Consequently, security con-tributes only modestly to multidimensional poverty in Mexico. In Tanzania and Uganda, health care deprivations are positively cor-related with monetary poverty, education deprivations, and deprivation in services. Yet, because many households already meet the cutoff for classification among the poor without adding the health care dimension, the dimension does not contribute much to the ranks of the poor.
Poverty profiling with five dimensions of well-being
The correlational structure between the di-mensions of well-being and their association with population characteristics may change the composition of the poor and the corre-sponding policy actions needed to reduce poverty. In Ecuador and Iraq, where the contribution to poverty from the security dimension is relatively large, many of the individuals suffering from threats of crime reside in urban centers. As a result, the share of the poor who reside in urban areas in Iraq rises from 31 percent to 44 percent if the focus shifts from monetary poverty to five-
sions, deprivations in the education dimen-sion are behind two-thirds of the headcount ratio in Iraq. If the five-dimension measure is used, the role of educational deprivations decreases noticeably, and the two extra di-mensions are behind roughly half the poverty headcount. Particularly, health deprivations emerge as an area with large contributions to poverty in Iraq. In contrast, in Tanzania and Uganda, the two new dimensions account for only 20 percent of poverty; and, in both the three-dimension measure and the five- dimension measure, monetary poverty and lack of access to basic infrastructure services are the major contributors to poverty.
These effects are partially driven by the extent to which the deprivations tend to ap-pear together, and the number of depriva-tions experienced by households. In Ecuador and Mexico, monetary poverty and threat of crime are negatively correlated, implying that the two indicators capture different types of households; households that suffer from monetary poverty are less likely to suffer from deprivations associated with crime relative to households that do not suffer from monetary poverty. When deprivations linked to crime are included in the measure of multidimen-sional poverty, many new households may be added to the ranks of the poor, which is the case in Ecuador. In the case of Mexico, many
FIGURE 4.9 The Poor, by Sociodemographic Characteristics, Selected Countries
Source: Calculations based on Ecuador’s Encuesta de Condiciones de Vida 2013–14; Indonesian Family Life Survey, 2014; Iraq Household Socio-Economic Survey, 2012; Mexican Family Life Survey, 2009–12; Tanzania’s National Panel Survey, 2012–13; Uganda National Panel Survey 2013–14. See appendix A for details.
0
Ecuad
or
Indon
esia
Iraq
Mexico
Tanza
nia
Ugand
a
Ecuad
or
Indon
esia
Iraq
Mexico
Tanza
nia
Ugand
a
10
20
30
40
50
60
Monetary poorMultidimensionally poor (5 dimensions)
0
2
4
6
8
10
12
14b. Poor living in female-headed householdsa. Poor living in urban areas
Shar
e of
poo
r (%
)
Shar
e of
poo
r (%
)
Monetary poorMultidimensionally poor (5 dimensions)

108 POVERTY AND SHARED PROSPERITY 2018
within a country. In Ecuador, for example, the thinly populated province of Pastaza is one of several eastern provinces with high poverty rates according to the monetary pov-erty measure, but it has an exceptionally high poverty rate according to the extended mul-tidimensional poverty measure (map 4.1). Similar changes occur in other countries, suggesting that the geographical concentra-tion of poverty shifts if more dimensions are considered. This may have important impli-cations for policies aiming to eliminate the pockets of poverty and for the allocation of resources across regions within a country.
ConclusionMonetary poverty is the World Bank’s work-horse measure to assess progress in poverty reduction across the world. This chapter ex-amines the effects of extending the measure of poverty by adding nonmonetary dimensions in an attempt to broaden the measurement of well-being. The analysis should be viewed as a starting point for a deeper investigation of the measurement of poverty that recognizes that many dimensions of well-being are not all readily available through markets.
dimension poverty, and similarly from 18 percent to 37 percent in Ecuador (figure 4.9). In contrast, in Mexico, Tanzania and Uganda, where the security addition had a relatively small contribution to total poverty, urban poverty rates change only marginally in re-sponse to the addition of more dimensions. In Indonesia, where health deprivations make up the greatest contribution to poverty, the share of poor in urban areas decreases, suggesting that lack of health care primarily is germane to rural areas.
Adding more dimensions also highlights differences in the types of households con-sidered poor. If the five-dimension measure is used instead of the monetary poverty mea-sure, the share of the poor living in female- headed households, defined as households in which the only adult is a woman, increases in all six countries in the sample except Tanza-nia. In Indonesia, the shift causes the poverty rate among individuals in female-headed households to rise from less than the average rate to more than the average rate, hence tar-geting female-headed households becomes an important means to combat poverty.
As the composition of poverty changes, so does the spatial concentration of poverty
MAP 4.1 Provincial Poverty Rates, Ecuador
Source: Calculations based on Ecuador’s Encuesta de Condiciones de Vida 2013–14. See appendix A for details.
a. Monetary measure b. Three-dimension measure c. Five-dimension measure

BEYOND MONETARY POVERTY 109
human suffering. Although this appreciation is not new or original, elevating additional aspects of well-being to the same level as consumption or income poverty can high-light the relevance of those aspects in com-parison to an exclusive focus on monetary poverty.
Going forward, the World Bank will mon-itor progress on multidimensional poverty using the three-dimension poverty head-count presented in this chapter. However, the empirical challenges of a multidimensional poverty measure, especially at the global level, are great. The analysis described in this chapter relies heavily on available data for the various components of well-being. The data on 119 countries had to have been standard-ized so indicators on education and utilities could be examined alongside consumption. However, household consumption or income surveys often lack adequate information on many key aspects of well-being, such as health, nutrition, and security. Thus, the ex-tended analysis on additional dimensions of poverty was restricted to six countries. These exercises are also suboptimal because infor-mation on the quality of the related services is missing. Richer datasets harmonized with respect to the measurement of essential ser-vice access and quality are needed. This ap-peal does not necessarily mean that already lengthy household survey questionnaires should be lengthened further. Where possi-ble, alternative information sources, such as administrative data or vital statistics, can be combined with survey data at relatively little additional cost in order to broaden the un-derstanding of well-being.
In addition to income and consumption, up to four other dimensions of poverty are included in the analysis, represented by a total of 12 indicators of well-being. Although there are many other valuable indicators that could have been included in the portfolio of nonmonetary indicators, the selected indica-tors satisfy explicit principles, including the centrality of private consumption, data avail-ability and parsimony.
The consideration of access to education and basic infrastructure alongside income, in a sample of 119 economies for circa 2013 re-veals that about a third of those that are mul-tidimensionally deprived are not captured by monetary poverty. The most prevalent depri-vation is access to adequate sanitation, which is associated with higher deprivation rates than income. In the exploratory analysis for six countries in which indicators of health, nutrition, and security are added to the anal-ysis of poverty, new aspects of deprivation are uncovered. In some cases, the incidence of crime or the threat of crime is weakly or even negatively associated with monetary poverty. This implies that the characteristics of the poor shift as the definition of poverty is broadened to include security. For several countries, a larger share of the multidimen-sional poor live in urban areas and in fe-male-headed households.
A growing toolbox for the assessment of well-being enhances the understanding of poverty. In some regions, deprivations in one dimension are accompanied by deprivations in other dimensions, whereas this is not the case for other regions. This has important implications for policies aimed at reducing
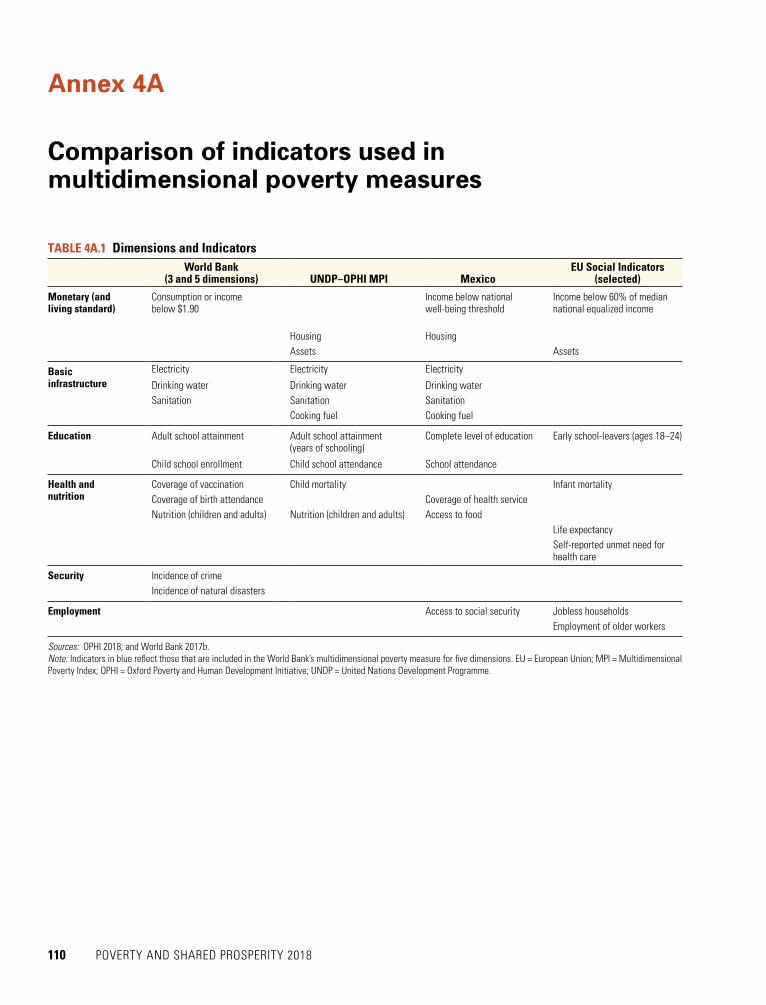
110 POVERTY AND SHARED PROSPERITY 2018
TABLE 4A.1 Dimensions and Indicators
World Bank
(3 and 5 dimensions) UNDP–OPHI MPI MexicoEU Social Indicators
(selected)
Monetary (and living standard)
Consumption or income below $1.90
Income below national well-being threshold
Income below 60% of median national equalized income
Housing HousingAssets Assets
Basic infrastructure
Electricity Electricity Electricity Drinking water Drinking water Drinking water Sanitation Sanitation Sanitation
Cooking fuel Cooking fuel
Education Adult school attainment Adult school attainment (years of schooling)
Complete level of education Early school-leavers (ages 18–24)
Child school enrollment Child school attendance School attendance
Health and nutrition
Coverage of vaccination Child mortality Infant mortalityCoverage of birth attendance Coverage of health serviceNutrition (children and adults) Nutrition (children and adults) Access to food
Life expectancy Self-reported unmet need for
health care
Security Incidence of crime Incidence of natural disasters
Employment Access to social security Jobless households Employment of older workers
Annex 4A
Comparison of indicators used in multidimensional poverty measures
Sources: OPHI 2018; and World Bank 2017b. Note: Indicators in blue reflect those that are included in the World Bank’s multidimensional poverty measure for five dimensions. EU = European Union; MPI = Multidimensional Poverty Index; OPHI = Oxford Poverty and Human Development Initiative; UNDP = United Nations Development Programme.

BEYOND MONETARY POVERTY 111
The adjusted headcount measure M was developed by Alkire and Foster (2011), as a special case of the Alkire–Foster family of multi dimensional poverty measures. One of the main char-acteristics of the measure is that it uses a dual cutoff. The first cutoff is the specific sufficiency threshold for each dimension. The second cutoff is often identified by the parameter k and rep-resents the number of (weighted) deprivations needed before an individual may be considered multidimensionally deprived. The deprivations among individuals who are poor in at least k dimensions are aggregated for an entire society as follows:
Annex 4B
Multidimensional poverty measures: A formalization
where yij is the achievement of person i on dimension j ; z j is the sufficiency threshold for di-mension j ; Iij is a dimension-specific indicator function that takes the value of 1 if yij < zj and 0 otherwise; a is a parameter of the measure’s sensitivity to the depth of poverty; and I(ci ≥ k) is a poverty indicator function that equals 1 if the number of (weighted) dimensions in which the individual is deprived is at least equal to the parameter k. The measure M(a, k ; y) is de-composable across population groups, which can facilitate a regional analysis and is useful for targeting. It also satisfies several desirable properties, including dimensional breakdown, which is useful to understand the contribution of each dimension to overall poverty.
The most common application of the measure involves setting a equal to zero. This special case is known as the adjusted-headcount ratio (M), and is defined as the share of multidimensionally poor households multiplied by the average number of deprivations expe-rienced by the multidimensionally poor. This case is used more frequently because, in many applications, some indicators are categorical, and thus higher values of a are not appropriate. This measure can be seen as more appealing than the multidimensional headcount H because it incorporates information on the breadth of poverty. The special case included in the pres-ent chapter is as follows:
For a = 0, k = 13
, then
Equations in PSPR
2.1
g"# = g&'() + g+,(-'."#(B2.2.1)
2.2
g+,(-'."# = g"# −g&'() ≡ sharedprosperitypremium(B2.2.2)
3.1
SPL = max(US$1.90, US$1.00 + 0.5 ×medianconsumption) in2011PPPU. S. dollars(3.1)
4.1
𝑀𝑀(𝛼𝛼, 𝑘𝑘; 𝑦𝑦) = 1𝑛𝑛YZY𝑤𝑤\
]
\^_
`1 −𝑦𝑦a\𝑧𝑧\cd
𝐼𝐼a\f 𝐼𝐼(𝑐𝑐a ≥ 𝑘𝑘),(4.3.1)j
a^_
4.2
𝑀𝑀 = 1𝑛𝑛YkY𝑤𝑤\
]
\^_
𝐼𝐼a\l 𝐼𝐼 m𝑐𝑐a ≥13n
j
a^_
= 𝐻𝐻 × 𝐴𝐴,(4.3.2)
4.3
𝑀𝑀(𝛼𝛼, 𝛽𝛽, 𝑦𝑦) = 1𝑛𝑛YZY𝑤𝑤\
]
\^_
`1 −𝑦𝑦a\𝑧𝑧\cd
𝐼𝐼a\f
rj
a^_
; 𝑓𝑓𝑓𝑓𝑓𝑓𝛼𝛼 ≥ 0, 𝛽𝛽 > 1.(4.3.3)
4.4
𝐷𝐷 = 𝑀𝑀(0, 2, 𝑦𝑦) = 1𝑛𝑛YZY𝑤𝑤\
]
\^_
𝐼𝐼\x𝑦𝑦a\ < 𝑧𝑧\zf
{
(4.3.4)j
a^_
5.1
𝑊𝑊},~ = 𝜂𝜂},~(𝑧𝑧)(𝛼𝛼},~(𝑧𝑧) +𝛽𝛽# ln(𝜂𝜂},~(𝑧𝑧)𝑥𝑥))
𝑊𝑊Å,~ = 𝜂𝜂Å,~(𝑧𝑧)(𝛼𝛼Å,~(𝑧𝑧) +𝛽𝛽# ln(𝜂𝜂Å,~(𝑧𝑧)𝑥𝑥))
𝑊𝑊Ç,~ = 𝜂𝜂Ç,~(𝑧𝑧)É𝛼𝛼Ç,~(𝑧𝑧) + 𝛽𝛽# ln Ñ𝜂𝜂Ç,~(𝑧𝑧)
𝑠𝑠 𝑥𝑥Üá
5.2 (in-text on p33)
𝛼𝛼\,~(𝑧𝑧) +𝛽𝛽# ln(𝜂𝜂\,~(𝑧𝑧)𝑥𝑥)
(4B.1)
(4B.2)
Equations in PSPR
2.1
g"# = g&'() + g+,(-'."#(B2.2.1)
2.2
g+,(-'."# = g"# −g&'() ≡ sharedprosperitypremium(B2.2.2)
3.1
SPL = max(US$1.90, US$1.00 + 0.5 ×medianconsumption) in2011PPPU. S. dollars(3.1)
4.1
𝑀𝑀(𝛼𝛼, 𝑘𝑘; 𝑦𝑦) = 1𝑛𝑛YZY𝑤𝑤\
]
\^_
`1 −𝑦𝑦a\𝑧𝑧\cd
𝐼𝐼a\f 𝐼𝐼(𝑐𝑐a ≥ 𝑘𝑘),(4.3.1)j
a^_
4.2
𝑀𝑀 = 1𝑛𝑛YkY𝑤𝑤\
]
\^_
𝐼𝐼a\l 𝐼𝐼 m𝑐𝑐a ≥13n
j
a^_
= 𝐻𝐻 × 𝐴𝐴,(4.3.2)
4.3
𝑀𝑀(𝛼𝛼, 𝛽𝛽, 𝑦𝑦) = 1𝑛𝑛YZY𝑤𝑤\
]
\^_
`1 −𝑦𝑦a\𝑧𝑧\cd
𝐼𝐼a\f
rj
a^_
; 𝑓𝑓𝑓𝑓𝑓𝑓𝛼𝛼 ≥ 0, 𝛽𝛽 > 1.(4.3.3)
4.4
𝐷𝐷 = 𝑀𝑀(0, 2, 𝑦𝑦) = 1𝑛𝑛YZY𝑤𝑤\
]
\^_
𝐼𝐼\x𝑦𝑦a\ < 𝑧𝑧\zf
{
(4.3.4)j
a^_
5.1
𝑊𝑊},~ = 𝜂𝜂},~(𝑧𝑧)(𝛼𝛼},~(𝑧𝑧) +𝛽𝛽# ln(𝜂𝜂},~(𝑧𝑧)𝑥𝑥))
𝑊𝑊Å,~ = 𝜂𝜂Å,~(𝑧𝑧)(𝛼𝛼Å,~(𝑧𝑧) +𝛽𝛽# ln(𝜂𝜂Å,~(𝑧𝑧)𝑥𝑥))
𝑊𝑊Ç,~ = 𝜂𝜂Ç,~(𝑧𝑧)É𝛼𝛼Ç,~(𝑧𝑧) + 𝛽𝛽# ln Ñ𝜂𝜂Ç,~(𝑧𝑧)
𝑠𝑠 𝑥𝑥Üá
5.2 (in-text on p33)
𝛼𝛼\,~(𝑧𝑧) +𝛽𝛽# ln(𝜂𝜂\,~(𝑧𝑧)𝑥𝑥)
where H is the multidimensional headcount rate, that is, the share of individuals who are multidimensionally deprived, and A is the average number of deprivations among those in-dividuals who are multidimensionally deprived. This chapter first reports H as a summary measure across countries and regions and then H A.

112 POVERTY AND SHARED PROSPERITY 2018
Datt (forthcoming) proposes an alternative family of multidimensional poverty measures, known as the distribution-sensitive multidimensional poverty measures. The measure pro-posed does not make use of a dual cutoff, recognizing the essentiality of every deprivation. Every deprivation is counted toward the measurement of poverty even if a person is deprived in a single indicator with low weight. In addition, the measure penalizes for any compounding effect of deprivations characterized by parameter b . The larger the value of b , the higher the weight it places on the cumulative deprivations.
Although M(a, b, y) is sensitive to the intensity of deprivation suffered by individuals, it does not satisfy the dimensional breakdown (unlike the previous measure).
If some of the indicators are binary, as in the case of this chapter, a is set at 0, and M(a, b, y) coincides with the measure of social exclusion presented by Chakravarty and D’Ambrosio (2006). The measure is also a member of the M-gamma class of indicators pre-sented in Alkire and Foster (2016). The measure used in the chapter is defined as follows:
Equations in PSPR
2.1
g"# = g&'() + g+,(-'."#(B2.2.1)
2.2
g+,(-'."# = g"# −g&'() ≡ sharedprosperitypremium(B2.2.2)
3.1
SPL = max(US$1.90, US$1.00 + 0.5 ×medianconsumption) in2011PPPU. S. dollars(3.1)
4.1
𝑀𝑀(𝛼𝛼, 𝑘𝑘; 𝑦𝑦) = 1𝑛𝑛YZY𝑤𝑤\
]
\^_
`1 −𝑦𝑦a\𝑧𝑧\cd
𝐼𝐼a\f 𝐼𝐼(𝑐𝑐a ≥ 𝑘𝑘),(4.3.1)j
a^_
4.2
𝑀𝑀 = 1𝑛𝑛YkY𝑤𝑤\
]
\^_
𝐼𝐼a\l 𝐼𝐼 m𝑐𝑐a ≥13n
j
a^_
= 𝐻𝐻 × 𝐴𝐴,(4.3.2)
4.3
𝑀𝑀(𝛼𝛼, 𝛽𝛽, 𝑦𝑦) = 1𝑛𝑛YZY𝑤𝑤\
]
\^_
`1 −𝑦𝑦a\𝑧𝑧\cd
𝐼𝐼a\f
rj
a^_
; 𝑓𝑓𝑓𝑓𝑓𝑓𝛼𝛼 ≥ 0, 𝛽𝛽 > 1.(4.3.3)
4.4
𝐷𝐷 = 𝑀𝑀(0, 2, 𝑦𝑦) = 1𝑛𝑛YZY𝑤𝑤\
]
\^_
𝐼𝐼\x𝑦𝑦a\ < 𝑧𝑧\zf
{
(4.3.4)j
a^_
5.1
𝑊𝑊},~ = 𝜂𝜂},~(𝑧𝑧)(𝛼𝛼},~(𝑧𝑧) +𝛽𝛽# ln(𝜂𝜂},~(𝑧𝑧)𝑥𝑥))
𝑊𝑊Å,~ = 𝜂𝜂Å,~(𝑧𝑧)(𝛼𝛼Å,~(𝑧𝑧) +𝛽𝛽# ln(𝜂𝜂Å,~(𝑧𝑧)𝑥𝑥))
𝑊𝑊Ç,~ = 𝜂𝜂Ç,~(𝑧𝑧)É𝛼𝛼Ç,~(𝑧𝑧) + 𝛽𝛽# ln Ñ𝜂𝜂Ç,~(𝑧𝑧)
𝑠𝑠 𝑥𝑥Üá
5.2 (in-text on p33)
𝛼𝛼\,~(𝑧𝑧) +𝛽𝛽# ln(𝜂𝜂\,~(𝑧𝑧)𝑥𝑥)
(4B.3)
(4B.4)
; for
Equations in PSPR
2.1
g"# = g&'() + g+,(-'."#(B2.2.1)
2.2
g+,(-'."# = g"# −g&'() ≡ sharedprosperitypremium(B2.2.2)
3.1
SPL = max(US$1.90, US$1.00 + 0.5 ×medianconsumption) in2011PPPU. S. dollars(3.1)
4.1
𝑀𝑀(𝛼𝛼, 𝑘𝑘; 𝑦𝑦) = 1𝑛𝑛YZY𝑤𝑤\
]
\^_
`1 −𝑦𝑦a\𝑧𝑧\cd
𝐼𝐼a\f 𝐼𝐼(𝑐𝑐a ≥ 𝑘𝑘),(4.3.1)j
a^_
4.2
𝑀𝑀 = 1𝑛𝑛YkY𝑤𝑤\
]
\^_
𝐼𝐼a\l 𝐼𝐼 m𝑐𝑐a ≥13n
j
a^_
= 𝐻𝐻 × 𝐴𝐴,(4.3.2)
4.3
𝑀𝑀(𝛼𝛼, 𝛽𝛽, 𝑦𝑦) = 1𝑛𝑛YZY𝑤𝑤\
]
\^_
`1 −𝑦𝑦a\𝑧𝑧\cd
𝐼𝐼a\f
rj
a^_
; 𝑓𝑓𝑓𝑓𝑓𝑓𝛼𝛼 ≥ 0, 𝛽𝛽 > 1.(4.3.3)
4.4
𝐷𝐷 = 𝑀𝑀(0, 2, 𝑦𝑦) = 1𝑛𝑛YZY𝑤𝑤\
]
\^_
𝐼𝐼\x𝑦𝑦a\ < 𝑧𝑧\zf
{
(4.3.4)j
a^_
5.1
𝑊𝑊},~ = 𝜂𝜂},~(𝑧𝑧)(𝛼𝛼},~(𝑧𝑧) +𝛽𝛽# ln(𝜂𝜂},~(𝑧𝑧)𝑥𝑥))
𝑊𝑊Å,~ = 𝜂𝜂Å,~(𝑧𝑧)(𝛼𝛼Å,~(𝑧𝑧) +𝛽𝛽# ln(𝜂𝜂Å,~(𝑧𝑧)𝑥𝑥))
𝑊𝑊Ç,~ = 𝜂𝜂Ç,~(𝑧𝑧)É𝛼𝛼Ç,~(𝑧𝑧) + 𝛽𝛽# ln Ñ𝜂𝜂Ç,~(𝑧𝑧)
𝑠𝑠 𝑥𝑥Üá
5.2 (in-text on p33)
𝛼𝛼\,~(𝑧𝑧) +𝛽𝛽# ln(𝜂𝜂\,~(𝑧𝑧)𝑥𝑥)

BEYOND MONETARY POVERTY 113
Annex 4C
Statistical tables
TABLE 4C.1 People Living in Monetary or Multidimensional Poverty, by Rural-Urban Areas, 119 Economies, circa 2013
Region
Rural share of total
population (%)
Monetary headcount ratio (%)
Multidimensional headcount ratio (%)
Economies (number)
Population coverage (%)Rural Urban
Rural share of the poor Rural Urban
Rural share of the poor
East Asia and Pacific 55.7 6.5 3.9 67.8 10.2 4.2 75.5 13 28.9
Europe and Central Asia 33.5 0.5 0.2 52.7 1.8 0.8 52.2 17 90.0
Latin America and the Caribbean 21.0 11.2 1.9 61.0 19.9 2.5 68.2 17 91.5
Middle East and North Africa 43.6 6.4 0.9 84.8 11.5 1.9 82.2 9 72.1
South Asia 70.6 15.2 3.9 90.3 33.3 10.5 88.4 5 23.0
Sub-Saharan Africa 67.0 55.9 22.6 83.4 81.8 28.8 85.2 29 60.7
Rest of the world 24.6 0.6 0.4 30.7 0.6 0.4 30.7 29 39.6
Total 45.8 21.0 4.1 81.3 33.6 5.6 83.5 119 45.0
Source: Estimates based on the harmonized household surveys in 119 economies, circa 2013, GMD (Global Monitoring Database), Global Solution Group on Welfare Measure-ment and Capacity Building, Poverty and Equity Global Practice, World Bank, Washington, DC.Note: Location of residence is missing for 1 percent of the total sample.
TABLE 4C.2 People Living in Monetary or Multdimensional Poverty, by Household Type, 119 Economies, circa 2013
ProfilePopulation share (%)
Monetary poverty Multidimensional poverty
Headcount ratio (%) Share of the poor (%) Headcount ratio (%) Share of the poor (%)
One adult female, with child 4.4 20.3 7.63 32.7 7.92One adult female, without child 2.8 1.8 0.42 5.5 0.84One adult male, with child 0.8 17.1 1.09 30.3 1.25One adult male, without child 2.4 1.7 0.35 5.5 0.74Two adults, with child 37.3 14.9 47.48 23.5 48.29Two adults, without child 7.7 1.6 1.04 4.4 1.86Multiple adults, with child 31.1 15.1 39.92 21.4 36.59Multiple adults, without child 9.7 1.8 1.53 3.0 1.6Only seniors 3.9 1.4 0.45 3.9 0.83Only children 0.0 24.9 0.08 38.7 0.08Total 100.0 11.7 100.0 18.2 100.0
Source: Estimates based on the harmonized household surveys in 119 economies, circa 2013, GMD (Global Monitoring Database), Global Solution Group on Welfare Measure-ment and Capacity Building, Poverty and Equity Global Practice, World Bank, Washington, DC.Note: The monetary and multidimensional poverty rates in this table differ slightly from those reported in tables 4.5, 4.6, and 4.7 because household type cannot be constructed for 0.4 percent of the sample because of missing information.
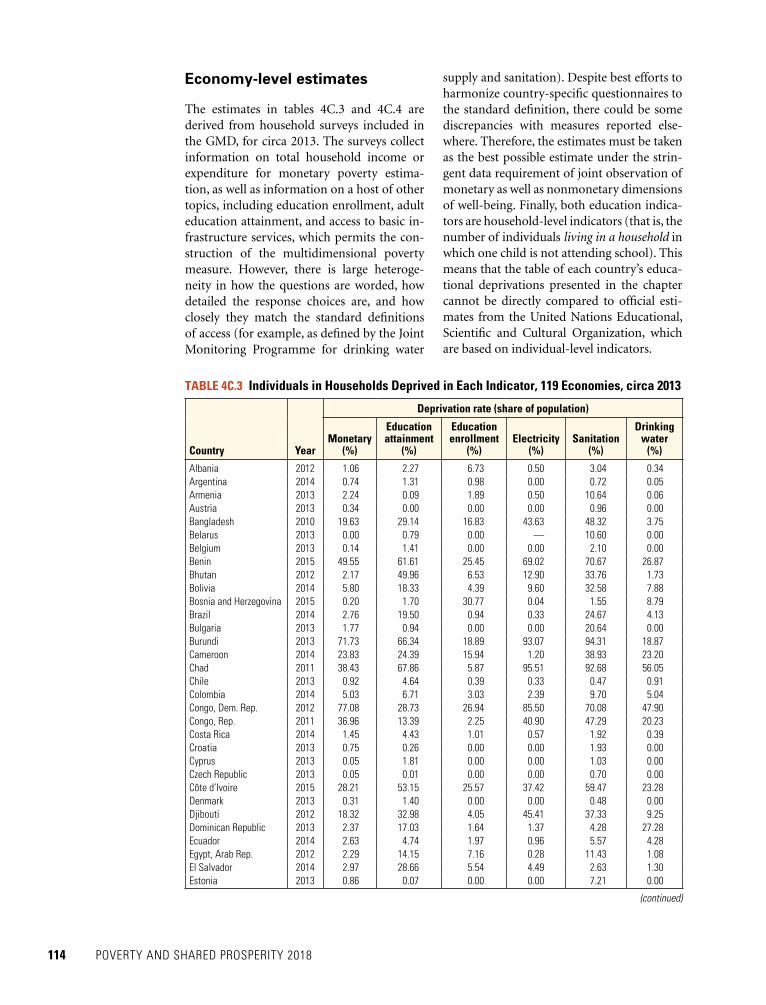
114 POVERTY AND SHARED PROSPERITY 2018
Economy-level estimates
The estimates in tables 4C.3 and 4C.4 are derived from household surveys included in the GMD, for circa 2013. The surveys collect information on total household income or expenditure for monetary poverty estima-tion, as well as information on a host of other topics, including education enrollment, adult education attainment, and access to basic in-frastructure services, which permits the con-struction of the multidimensional poverty measure. However, there is large heteroge-neity in how the questions are worded, how detailed the response choices are, and how closely they match the standard definitions of access (for example, as defined by the Joint Monitoring Programme for drinking water
supply and sanitation). Despite best efforts to harmonize country-specific questionnaires to the standard definition, there could be some discrepancies with measures reported else-where. Therefore, the estimates must be taken as the best possible estimate under the strin-gent data requirement of joint observation of monetary as well as nonmonetary dimensions of well-being. Finally, both education indica-tors are household-level indicators (that is, the number of individuals living in a household in which one child is not attending school). This means that the table of each country’s educa-tional deprivations presented in the chapter cannot be directly compared to official esti-mates from the United Nations Educational, Scientific and Cultural Organization, which are based on individual-level indicators.
TABLE 4C.3 Individuals in Households Deprived in Each Indicator, 119 Economies, circa 2013
Country Year
Deprivation rate (share of population)
Monetary (%)
Education attainment
(%)
Education enrollment
(%) Electricity
(%) Sanitation
(%)
Drinking water
(%)
Albania 2012 1.06 2.27 6.73 0.50 3.04 0.34Argentina 2014 0.74 1.31 0.98 0.00 0.72 0.05Armenia 2013 2.24 0.09 1.89 0.50 10.64 0.06Austria 2013 0.34 0.00 0.00 0.00 0.96 0.00Bangladesh 2010 19.63 29.14 16.83 43.63 48.32 3.75Belarus 2013 0.00 0.79 0.00 — 10.60 0.00Belgium 2013 0.14 1.41 0.00 0.00 2.10 0.00Benin 2015 49.55 61.61 25.45 69.02 70.67 26.87Bhutan 2012 2.17 49.96 6.53 12.90 33.76 1.73Bolivia 2014 5.80 18.33 4.39 9.60 32.58 7.88Bosnia and Herzegovina 2015 0.20 1.70 30.77 0.04 1.55 8.79Brazil 2014 2.76 19.50 0.94 0.33 24.67 4.13Bulgaria 2013 1.77 0.94 0.00 0.00 20.64 0.00Burundi 2013 71.73 66.34 18.89 93.07 94.31 18.87Cameroon 2014 23.83 24.39 15.94 1.20 38.93 23.20Chad 2011 38.43 67.86 5.87 95.51 92.68 56.05Chile 2013 0.92 4.64 0.39 0.33 0.47 0.91Colombia 2014 5.03 6.71 3.03 2.39 9.70 5.04Congo, Dem. Rep. 2012 77.08 28.73 26.94 85.50 70.08 47.90Congo, Rep. 2011 36.96 13.39 2.25 40.90 47.29 20.23Costa Rica 2014 1.45 4.43 1.01 0.57 1.92 0.39Croatia 2013 0.75 0.26 0.00 0.00 1.93 0.00Cyprus 2013 0.05 1.81 0.00 0.00 1.03 0.00Czech Republic 2013 0.05 0.01 0.00 0.00 0.70 0.00Côte d’Ivoire 2015 28.21 53.15 25.57 37.42 59.47 23.28Denmark 2013 0.31 1.40 0.00 0.00 0.48 0.00Djibouti 2012 18.32 32.98 4.05 45.41 37.33 9.25Dominican Republic 2013 2.37 17.03 1.64 1.37 4.28 27.28Ecuador 2014 2.63 4.74 1.97 0.96 5.57 4.28Egypt, Arab Rep. 2012 2.29 14.15 7.16 0.28 11.43 1.08El Salvador 2014 2.97 28.66 5.54 4.49 2.63 1.30Estonia 2013 0.86 0.07 0.00 0.00 7.21 0.00
(continued)
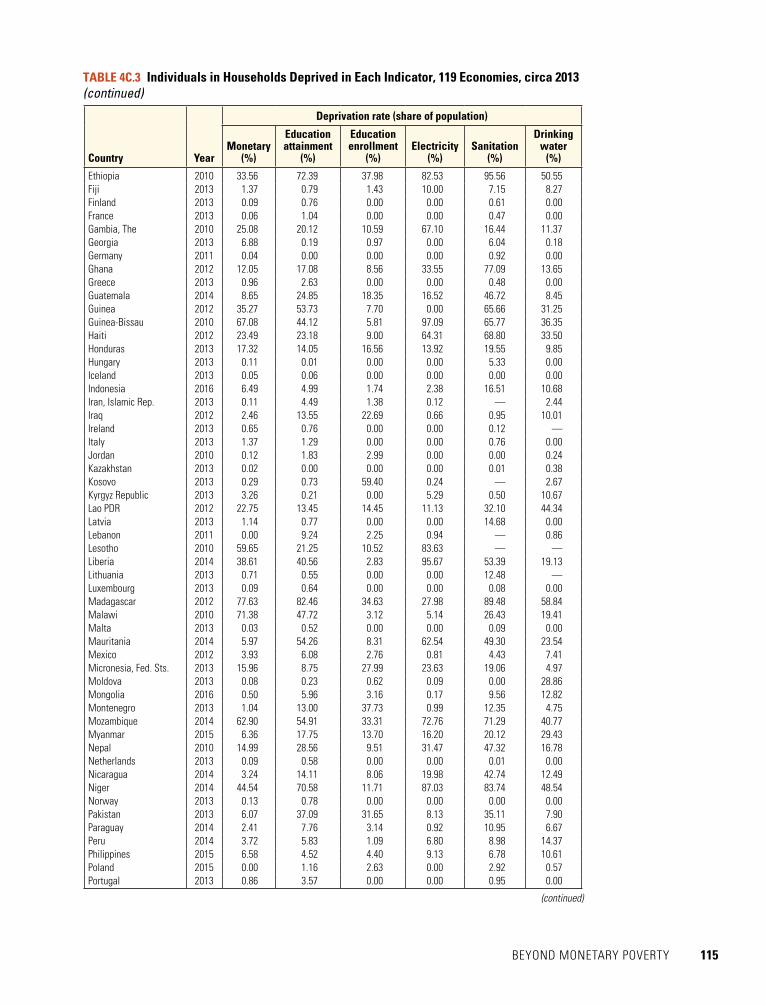
BEYOND MONETARY POVERTY 115
Country Year
Deprivation rate (share of population)
Monetary (%)
Education attainment
(%)
Education enrollment
(%) Electricity
(%) Sanitation
(%)
Drinking water
(%)
Ethiopia 2010 33.56 72.39 37.98 82.53 95.56 50.55Fiji 2013 1.37 0.79 1.43 10.00 7.15 8.27Finland 2013 0.09 0.76 0.00 0.00 0.61 0.00France 2013 0.06 1.04 0.00 0.00 0.47 0.00Gambia, The 2010 25.08 20.12 10.59 67.10 16.44 11.37Georgia 2013 6.88 0.19 0.97 0.00 6.04 0.18Germany 2011 0.04 0.00 0.00 0.00 0.92 0.00Ghana 2012 12.05 17.08 8.56 33.55 77.09 13.65Greece 2013 0.96 2.63 0.00 0.00 0.48 0.00Guatemala 2014 8.65 24.85 18.35 16.52 46.72 8.45Guinea 2012 35.27 53.73 7.70 0.00 65.66 31.25Guinea-Bissau 2010 67.08 44.12 5.81 97.09 65.77 36.35Haiti 2012 23.49 23.18 9.00 64.31 68.80 33.50Honduras 2013 17.32 14.05 16.56 13.92 19.55 9.85Hungary 2013 0.11 0.01 0.00 0.00 5.33 0.00Iceland 2013 0.05 0.06 0.00 0.00 0.00 0.00Indonesia 2016 6.49 4.99 1.74 2.38 16.51 10.68Iran, Islamic Rep. 2013 0.11 4.49 1.38 0.12 — 2.44Iraq 2012 2.46 13.55 22.69 0.66 0.95 10.01Ireland 2013 0.65 0.76 0.00 0.00 0.12 — Italy 2013 1.37 1.29 0.00 0.00 0.76 0.00Jordan 2010 0.12 1.83 2.99 0.00 0.00 0.24Kazakhstan 2013 0.02 0.00 0.00 0.00 0.01 0.38Kosovo 2013 0.29 0.73 59.40 0.24 — 2.67Kyrgyz Republic 2013 3.26 0.21 0.00 5.29 0.50 10.67Lao PDR 2012 22.75 13.45 14.45 11.13 32.10 44.34Latvia 2013 1.14 0.77 0.00 0.00 14.68 0.00Lebanon 2011 0.00 9.24 2.25 0.94 — 0.86Lesotho 2010 59.65 21.25 10.52 83.63 — — Liberia 2014 38.61 40.56 2.83 95.67 53.39 19.13Lithuania 2013 0.71 0.55 0.00 0.00 12.48 — Luxembourg 2013 0.09 0.64 0.00 0.00 0.08 0.00Madagascar 2012 77.63 82.46 34.63 27.98 89.48 58.84Malawi 2010 71.38 47.72 3.12 5.14 26.43 19.41Malta 2013 0.03 0.52 0.00 0.00 0.09 0.00Mauritania 2014 5.97 54.26 8.31 62.54 49.30 23.54Mexico 2012 3.93 6.08 2.76 0.81 4.43 7.41Micronesia, Fed. Sts. 2013 15.96 8.75 27.99 23.63 19.06 4.97Moldova 2013 0.08 0.23 0.62 0.09 0.00 28.86Mongolia 2016 0.50 5.96 3.16 0.17 9.56 12.82Montenegro 2013 1.04 13.00 37.73 0.99 12.35 4.75Mozambique 2014 62.90 54.91 33.31 72.76 71.29 40.77Myanmar 2015 6.36 17.75 13.70 16.20 20.12 29.43Nepal 2010 14.99 28.56 9.51 31.47 47.32 16.78Netherlands 2013 0.09 0.58 0.00 0.00 0.01 0.00Nicaragua 2014 3.24 14.11 8.06 19.98 42.74 12.49Niger 2014 44.54 70.58 11.71 87.03 83.74 48.54Norway 2013 0.13 0.78 0.00 0.00 0.00 0.00Pakistan 2013 6.07 37.09 31.65 8.13 35.11 7.90Paraguay 2014 2.41 7.76 3.14 0.92 10.95 6.67Peru 2014 3.72 5.83 1.09 6.80 8.98 14.37Philippines 2015 6.58 4.52 4.40 9.13 6.78 10.61Poland 2015 0.00 1.16 2.63 0.00 2.92 0.57Portugal 2013 0.86 3.57 0.00 0.00 0.95 0.00
TABLE 4C.3 Individuals in Households Deprived in Each Indicator, 119 Economies, circa 2013 (continued)
(continued)
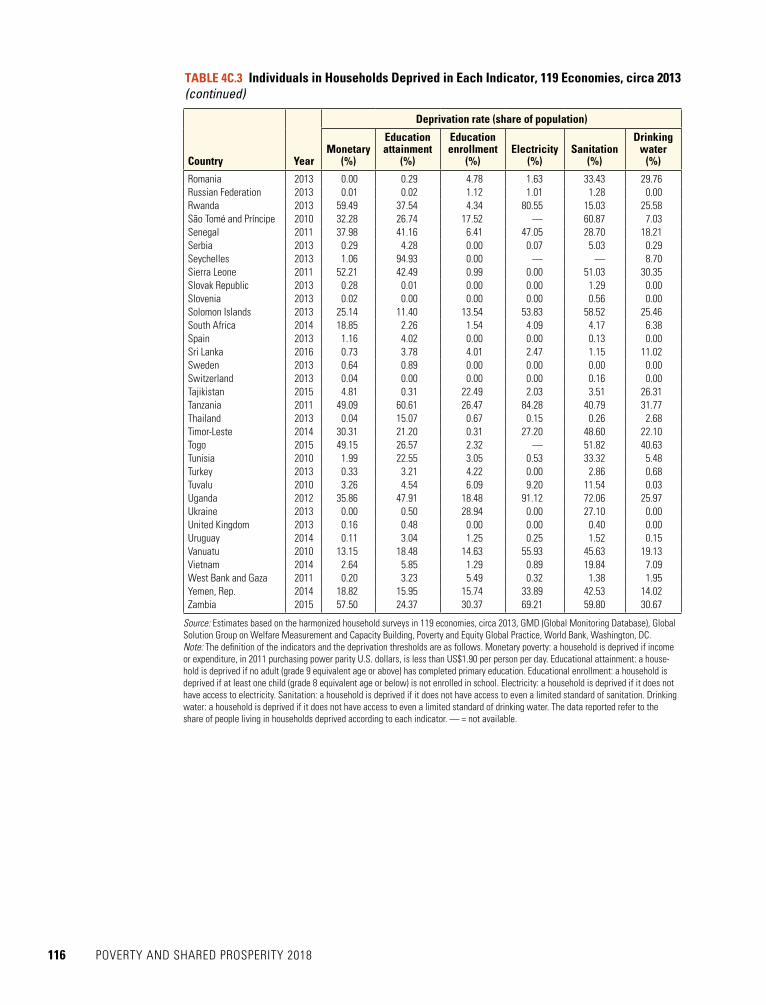
116 POVERTY AND SHARED PROSPERITY 2018
Country Year
Deprivation rate (share of population)
Monetary (%)
Education attainment
(%)
Education enrollment
(%) Electricity
(%) Sanitation
(%)
Drinking water
(%)
Romania 2013 0.00 0.29 4.78 1.63 33.43 29.76Russian Federation 2013 0.01 0.02 1.12 1.01 1.28 0.00Rwanda 2013 59.49 37.54 4.34 80.55 15.03 25.58São Tomé and Príncipe 2010 32.28 26.74 17.52 — 60.87 7.03Senegal 2011 37.98 41.16 6.41 47.05 28.70 18.21Serbia 2013 0.29 4.28 0.00 0.07 5.03 0.29Seychelles 2013 1.06 94.93 0.00 — — 8.70Sierra Leone 2011 52.21 42.49 0.99 0.00 51.03 30.35Slovak Republic 2013 0.28 0.01 0.00 0.00 1.29 0.00Slovenia 2013 0.02 0.00 0.00 0.00 0.56 0.00Solomon Islands 2013 25.14 11.40 13.54 53.83 58.52 25.46South Africa 2014 18.85 2.26 1.54 4.09 4.17 6.38Spain 2013 1.16 4.02 0.00 0.00 0.13 0.00Sri Lanka 2016 0.73 3.78 4.01 2.47 1.15 11.02Sweden 2013 0.64 0.89 0.00 0.00 0.00 0.00Switzerland 2013 0.04 0.00 0.00 0.00 0.16 0.00Tajikistan 2015 4.81 0.31 22.49 2.03 3.51 26.31Tanzania 2011 49.09 60.61 26.47 84.28 40.79 31.77Thailand 2013 0.04 15.07 0.67 0.15 0.26 2.68Timor-Leste 2014 30.31 21.20 0.31 27.20 48.60 22.10Togo 2015 49.15 26.57 2.32 — 51.82 40.63Tunisia 2010 1.99 22.55 3.05 0.53 33.32 5.48Turkey 2013 0.33 3.21 4.22 0.00 2.86 0.68Tuvalu 2010 3.26 4.54 6.09 9.20 11.54 0.03Uganda 2012 35.86 47.91 18.48 91.12 72.06 25.97Ukraine 2013 0.00 0.50 28.94 0.00 27.10 0.00United Kingdom 2013 0.16 0.48 0.00 0.00 0.40 0.00Uruguay 2014 0.11 3.04 1.25 0.25 1.52 0.15Vanuatu 2010 13.15 18.48 14.63 55.93 45.63 19.13Vietnam 2014 2.64 5.85 1.29 0.89 19.84 7.09West Bank and Gaza 2011 0.20 3.23 5.49 0.32 1.38 1.95Yemen, Rep. 2014 18.82 15.95 15.74 33.89 42.53 14.02Zambia 2015 57.50 24.37 30.37 69.21 59.80 30.67
Source: Estimates based on the harmonized household surveys in 119 economies, circa 2013, GMD (Global Monitoring Database), Global Solution Group on Welfare Measurement and Capacity Building, Poverty and Equity Global Practice, World Bank, Washington, DC.Note: The definition of the indicators and the deprivation thresholds are as follows. Monetary poverty: a household is deprived if income or expenditure, in 2011 purchasing power parity U.S. dollars, is less than US$1.90 per person per day. Educational attainment: a house-hold is deprived if no adult (grade 9 equivalent age or above) has completed primary education. Educational enrollment: a household is deprived if at least one child (grade 8 equivalent age or below) is not enrolled in school. Electricity: a household is deprived if it does not have access to electricity. Sanitation: a household is deprived if it does not have access to even a limited standard of sanitation. Drinking water: a household is deprived if it does not have access to even a limited standard of drinking water. The data reported refer to the share of people living in households deprived according to each indicator. — = not available.
TABLE 4C.3 Individuals in Households Deprived in Each Indicator, 119 Economies, circa 2013 (continued)
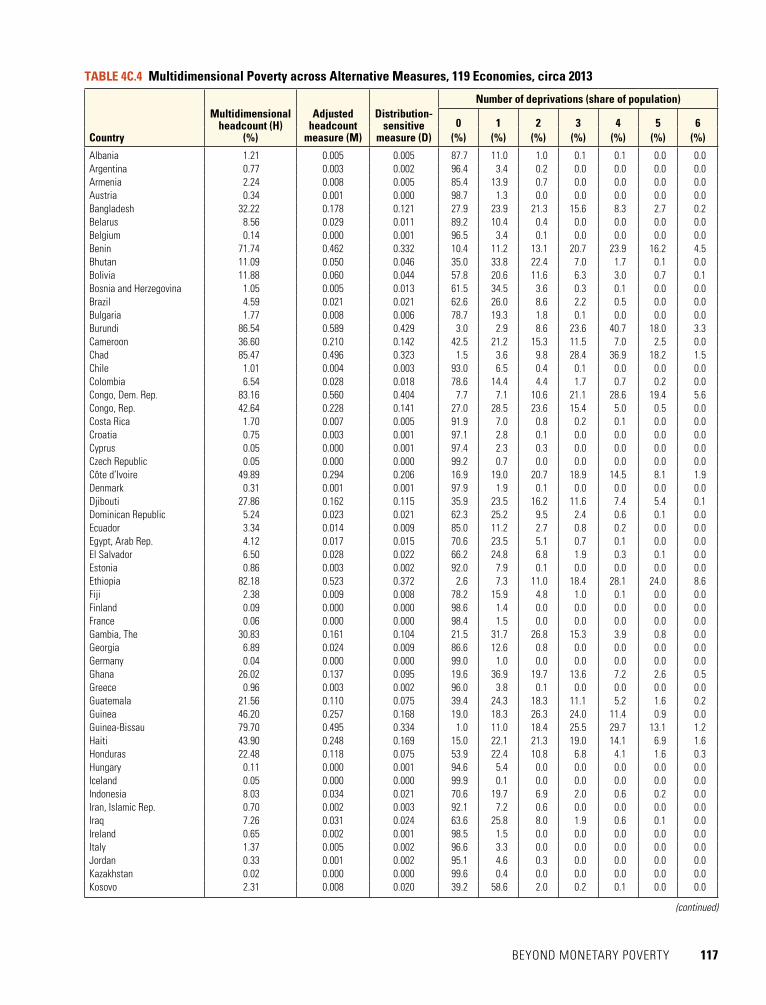
BEYOND MONETARY POVERTY 117
TABLE 4C.4 Multidimensional Poverty across Alternative Measures, 119 Economies, circa 2013
Multidimensional headcount (H)
(%)
Adjusted headcount
measure (M)
Distribution-sensitive
measure (D)
Number of deprivations (share of population)
0(%)
1(%)
2(%)
3(%)
4(%)
5(%)
6(%) Country
Albania 1.21 0.005 0.005 87.7 11.0 1.0 0.1 0.1 0.0 0.0Argentina 0.77 0.003 0.002 96.4 3.4 0.2 0.0 0.0 0.0 0.0Armenia 2.24 0.008 0.005 85.4 13.9 0.7 0.0 0.0 0.0 0.0Austria 0.34 0.001 0.000 98.7 1.3 0.0 0.0 0.0 0.0 0.0Bangladesh 32.22 0.178 0.121 27.9 23.9 21.3 15.6 8.3 2.7 0.2Belarus 8.56 0.029 0.011 89.2 10.4 0.4 0.0 0.0 0.0 0.0Belgium 0.14 0.000 0.001 96.5 3.4 0.1 0.0 0.0 0.0 0.0Benin 71.74 0.462 0.332 10.4 11.2 13.1 20.7 23.9 16.2 4.5Bhutan 11.09 0.050 0.046 35.0 33.8 22.4 7.0 1.7 0.1 0.0Bolivia 11.88 0.060 0.044 57.8 20.6 11.6 6.3 3.0 0.7 0.1Bosnia and Herzegovina 1.05 0.005 0.013 61.5 34.5 3.6 0.3 0.1 0.0 0.0Brazil 4.59 0.021 0.021 62.6 26.0 8.6 2.2 0.5 0.0 0.0Bulgaria 1.77 0.008 0.006 78.7 19.3 1.8 0.1 0.0 0.0 0.0Burundi 86.54 0.589 0.429 3.0 2.9 8.6 23.6 40.7 18.0 3.3Cameroon 36.60 0.210 0.142 42.5 21.2 15.3 11.5 7.0 2.5 0.0Chad 85.47 0.496 0.323 1.5 3.6 9.8 28.4 36.9 18.2 1.5Chile 1.01 0.004 0.003 93.0 6.5 0.4 0.1 0.0 0.0 0.0Colombia 6.54 0.028 0.018 78.6 14.4 4.4 1.7 0.7 0.2 0.0Congo, Dem. Rep. 83.16 0.560 0.404 7.7 7.1 10.6 21.1 28.6 19.4 5.6Congo, Rep. 42.64 0.228 0.141 27.0 28.5 23.6 15.4 5.0 0.5 0.0Costa Rica 1.70 0.007 0.005 91.9 7.0 0.8 0.2 0.1 0.0 0.0Croatia 0.75 0.003 0.001 97.1 2.8 0.1 0.0 0.0 0.0 0.0Cyprus 0.05 0.000 0.001 97.4 2.3 0.3 0.0 0.0 0.0 0.0Czech Republic 0.05 0.000 0.000 99.2 0.7 0.0 0.0 0.0 0.0 0.0Côte d’Ivoire 49.89 0.294 0.206 16.9 19.0 20.7 18.9 14.5 8.1 1.9Denmark 0.31 0.001 0.001 97.9 1.9 0.1 0.0 0.0 0.0 0.0Djibouti 27.86 0.162 0.115 35.9 23.5 16.2 11.6 7.4 5.4 0.1Dominican Republic 5.24 0.023 0.021 62.3 25.2 9.5 2.4 0.6 0.1 0.0Ecuador 3.34 0.014 0.009 85.0 11.2 2.7 0.8 0.2 0.0 0.0Egypt, Arab Rep. 4.12 0.017 0.015 70.6 23.5 5.1 0.7 0.1 0.0 0.0El Salvador 6.50 0.028 0.022 66.2 24.8 6.8 1.9 0.3 0.1 0.0Estonia 0.86 0.003 0.002 92.0 7.9 0.1 0.0 0.0 0.0 0.0Ethiopia 82.18 0.523 0.372 2.6 7.3 11.0 18.4 28.1 24.0 8.6Fiji 2.38 0.009 0.008 78.2 15.9 4.8 1.0 0.1 0.0 0.0Finland 0.09 0.000 0.000 98.6 1.4 0.0 0.0 0.0 0.0 0.0France 0.06 0.000 0.000 98.4 1.5 0.0 0.0 0.0 0.0 0.0Gambia, The 30.83 0.161 0.104 21.5 31.7 26.8 15.3 3.9 0.8 0.0Georgia 6.89 0.024 0.009 86.6 12.6 0.8 0.0 0.0 0.0 0.0Germany 0.04 0.000 0.000 99.0 1.0 0.0 0.0 0.0 0.0 0.0Ghana 26.02 0.137 0.095 19.6 36.9 19.7 13.6 7.2 2.6 0.5Greece 0.96 0.003 0.002 96.0 3.8 0.1 0.0 0.0 0.0 0.0Guatemala 21.56 0.110 0.075 39.4 24.3 18.3 11.1 5.2 1.6 0.2Guinea 46.20 0.257 0.168 19.0 18.3 26.3 24.0 11.4 0.9 0.0Guinea-Bissau 79.70 0.495 0.334 1.0 11.0 18.4 25.5 29.7 13.1 1.2Haiti 43.90 0.248 0.169 15.0 22.1 21.3 19.0 14.1 6.9 1.6Honduras 22.48 0.118 0.075 53.9 22.4 10.8 6.8 4.1 1.6 0.3Hungary 0.11 0.000 0.001 94.6 5.4 0.0 0.0 0.0 0.0 0.0Iceland 0.05 0.000 0.000 99.9 0.1 0.0 0.0 0.0 0.0 0.0Indonesia 8.03 0.034 0.021 70.6 19.7 6.9 2.0 0.6 0.2 0.0Iran, Islamic Rep. 0.70 0.002 0.003 92.1 7.2 0.6 0.0 0.0 0.0 0.0Iraq 7.26 0.031 0.024 63.6 25.8 8.0 1.9 0.6 0.1 0.0Ireland 0.65 0.002 0.001 98.5 1.5 0.0 0.0 0.0 0.0 0.0Italy 1.37 0.005 0.002 96.6 3.3 0.0 0.0 0.0 0.0 0.0Jordan 0.33 0.001 0.002 95.1 4.6 0.3 0.0 0.0 0.0 0.0Kazakhstan 0.02 0.000 0.000 99.6 0.4 0.0 0.0 0.0 0.0 0.0Kosovo 2.31 0.008 0.020 39.2 58.6 2.0 0.2 0.1 0.0 0.0
(continued)

118 POVERTY AND SHARED PROSPERITY 2018
Multidimensional headcount (H)
(%)
Adjusted headcount
measure (M)
Distribution-sensitive
measure (D)
Number of deprivations (share of population)
0(%)
1(%)
2(%)
3(%)
4(%)
5(%)
6(%) Country
Kyrgyz Republic 3.26 0.012 0.007 81.8 16.6 1.6 0.0 0.0 0.0 0.0Lao PDR 28.77 0.151 0.099 24.0 41.4 17.3 10.4 4.4 1.9 0.6Latvia 1.14 0.005 0.004 84.3 14.9 0.8 0.0 0.0 0.0 0.0Lebanon 0.76 0.003 0.004 87.5 11.8 0.8 0.0 0.0 0.0 0.0Lesotho 90.88 0.529 0.342 8.3 28.7 44.9 16.2 2.0 0.0 0.0Liberia 53.24 0.312 0.211 2.6 24.2 25.3 22.9 18.8 6.2 0.1Lithuania 1.06 0.004 0.005 86.8 12.6 0.6 0.0 0.0 0.0 0.0Luxembourg 0.09 0.000 0.000 99.2 0.8 0.0 0.0 0.0 0.0 0.0Madagascar 85.35 0.669 0.560 2.5 7.1 13.3 19.7 31.5 23.5 2.4Malawi 75.07 0.385 0.216 16.4 27.6 32.3 19.2 4.4 0.2 0.0Malta 0.03 0.000 0.000 99.4 0.6 0.0 0.0 0.0 0.0 0.0Mauritania 43.25 0.206 0.119 21.0 18.6 18.8 22.1 16.0 3.3 0.1Mexico 4.59 0.019 0.012 80.6 14.5 3.9 0.7 0.2 0.0 0.0Micronesia, Fed. Sts. 20.84 0.103 0.067 42.4 30.4 16.0 7.3 3.4 0.5 0.0Moldova 0.08 0.000 0.004 70.6 28.8 0.5 0.0 0.0 0.0 0.0Mongolia 1.27 0.005 0.008 75.5 17.6 6.2 0.7 0.0 0.0 0.0Montenegro 9.48 0.041 0.032 51.8 34.5 8.2 3.4 1.4 0.6 0.0Mozambique 76.61 0.543 0.419 12.6 8.6 8.9 14.2 22.3 22.4 10.9Myanmar 15.32 0.078 0.057 44.1 28.2 14.5 8.2 3.3 1.4 0.2Nepal 28.17 0.150 0.102 32.1 24.8 19.3 13.9 6.9 2.4 0.7Netherlands 0.09 0.000 0.000 99.3 0.7 0.0 0.0 0.0 0.0 0.0Nicaragua 15.00 0.071 0.048 45.9 28.9 11.7 7.8 3.5 1.9 0.2Niger 79.16 0.500 0.348 6.2 6.3 9.1 18.6 34.6 23.5 1.7Norway 0.13 0.000 0.000 99.1 0.9 0.0 0.0 0.0 0.0 0.0Pakistan 24.38 0.119 0.079 35.2 28.8 19.1 10.6 4.5 1.6 0.1Paraguay 3.92 0.018 0.014 77.3 15.9 4.9 1.6 0.3 0.1 0.0Peru 6.15 0.027 0.018 74.3 15.2 6.8 2.7 0.8 0.1 0.0Philippines 8.70 0.040 0.025 74.2 15.7 5.8 2.7 1.2 0.3 0.0Poland 0.08 0.000 0.002 93.5 5.9 0.6 0.0 0.0 0.0 0.0Portugal 0.86 0.003 0.002 94.8 5.0 0.2 0.0 0.0 0.0 0.0Romania 3.49 0.013 0.019 62.8 8.3 25.4 3.2 0.3 0.0 0.0Russian Federation 0.99 0.003 0.002 96.6 3.4 0.0 0.0 0.0 0.0 0.0Rwanda 63.13 0.362 0.226 12.9 15.7 27.5 27.0 13.6 3.1 0.2São Tomé and Príncipe 51.11 0.247 0.139 20.2 33.6 30.7 12.5 2.7 0.2 0.0Senegal 46.69 0.268 0.174 31.1 17.2 16.7 16.5 13.3 4.7 0.4Serbia 0.38 0.002 0.003 91.0 8.2 0.7 0.1 0.0 0.0 0.0Seychelles 9.69 0.048 0.048 4.6 86.2 9.2 0.1 0.0 0.0 0.0Sierra Leone 56.91 0.298 0.173 21.5 22.1 24.6 21.8 10.0 0.1 0.0Slovak Republic 0.28 0.001 0.000 98.5 1.5 0.0 0.0 0.0 0.0 0.0Slovenia 0.02 0.000 0.000 99.4 0.6 0.0 0.0 0.0 0.0 0.0Solomon Islands 37.62 0.193 0.124 14.2 24.4 33.0 18.3 7.6 2.3 0.1South Africa 19.21 0.073 0.031 70.6 22.9 5.4 1.0 0.0 0.0 0.0Spain 1.16 0.004 0.003 94.8 5.1 0.1 0.0 0.0 0.0 0.0Sri Lanka 1.12 0.005 0.006 80.1 17.1 2.3 0.4 0.1 0.0 0.0Sweden 0.64 0.002 0.001 98.6 1.3 0.1 0.0 0.0 0.0 0.0Switzerland 0.04 0.000 0.000 99.8 0.2 0.0 0.0 0.0 0.0 0.0Tajikistan 5.43 0.024 0.024 54.2 34.4 9.7 1.5 0.3 0.1 0.0Tanzania 67.19 0.434 0.315 8.2 12.0 18.2 23.9 19.8 13.4 4.4Thailand 0.28 0.001 0.005 82.2 16.9 0.8 0.1 0.0 0.0 0.0Timor-Leste 39.49 0.192 0.111 28.6 25.3 22.6 15.8 6.5 1.1 0.0Togo 60.66 0.343 0.216 26.0 19.8 22.4 22.0 9.8 0.2 0.0Tunisia 4.16 0.020 0.024 52.6 31.0 13.5 2.6 0.3 0.0 0.0Turkey 0.62 0.002 0.004 90.1 8.6 1.0 0.2 0.0 0.0 0.0Tuvalu 3.88 0.015 0.012 70.7 24.4 4.3 0.5 0.0 0.0 0.0Uganda 65.03 0.384 0.261 5.8 9.9 21.3 27.9 22.6 10.8 1.8Ukraine 0.07 0.000 0.015 51.5 40.6 8.0 0.0 0.0 0.0 0.0
TABLE 4C.4 Multidimensional Poverty across Alternative Measures, 119 Economies, circa 2013 (continued)
(continued)

BEYOND MONETARY POVERTY 119
Multidimensional headcount (H)
(%)
Adjusted headcount
measure (M)
Distribution-sensitive
measure (D)
Number of deprivations (share of population)
0(%)
1(%)
2(%)
3(%)
4(%)
5(%)
6(%) Country
United Kingdom 0.16 0.001 0.000 99.0 1.0 0.0 0.0 0.0 0.0 0.0Uruguay 0.19 0.001 0.002 94.1 5.6 0.3 0.1 0.0 0.0 0.0Vanuatu 33.12 0.154 0.095 22.4 25.3 26.5 17.4 6.7 1.6 0.3Vietnam 3.78 0.019 0.016 74.8 16.3 6.3 1.9 0.6 0.1 0.0West Bank and Gaza 0.49 0.002 0.004 88.4 10.6 0.9 0.1 0.0 0.0 0.0Yemen, Rep. 29.98 0.154 0.098 34.0 24.5 18.2 14.6 7.1 1.4 0.1Zambia 63.69 0.432 0.318 19.9 11.4 10.6 17.1 21.5 14.8 4.7
Source: Estimates based on the harmonized household surveys in 119 economies, circa 2013, GMD (Global Monitoring Database), Global Solution Group on Welfare Measure-ment and Capacity Building, Poverty and Equity Global Practice, World Bank, Washington, DC.
TABLE 4C.4 Multidimensional Poverty across Alternative Measures, 119 Economies, circa 2013 (continued)
FIGURE 4C.1 Regional Venn diagrams
Source: Estimates based on the harmonized household surveys in 119 economies, circa 2013, GMD (Global Monitoring Database), Global Solution Group on Welfare Measurement and Capacity Building, Poverty and Equity Global Practice, World Bank, Washington, DC.Note: The diagrams show the fraction of the regional population that is multidimensionally poor, and the dimensions the poor are deprived in.
d. Latin Americaand the Caribbean
1.2Monetary
Education
Basicinfrastructure
b. South Asia
a. Sub-Saharan Africa
2.9Monetary
0.2Education
2.3
Basic infrastructure
1.4
12.417
28.2
2Monetary
c. East Asia and Pacific
Education
0.5
Basic infrastructure
f. Europe and Central Asiae. Middle East and North Africa
0.6Monetary
Monetary
Education Education
Basic infrastructure Basic infrastructure
0.201.4
17
28.2
0.2
0.5
0.7Monetary
3.4
EducationBasic
infrastructure0.4
1.3
2.810.9
7
0.02
0.1 0.20.040.2
0.6

120 POVERTY AND SHARED PROSPERITY 2018
explains how the core SDG drinking water and sanitation indicators focus on a concept of “safely managed,” but there are relatively few datasets available with all necessary criteria (and data sources beyond household surveys are needed for some aspects of safely managed sanitation services). SDG monitoring also uses the less-stringent concepts of “limited” and “basic” access adopted in this report, for which data availability is higher, and because of the strong relevance of the concepts glob-ally. SDG “at least limited” drinking water is drinking water that comes from an improved source (for example, piped, borehole, pro-tected dug well, rainwater, delivered water, and so on). SDG “at least basic” drinking water has an added criterion of being within a roundtrip time of 30 minutes. SDG “at least limited” sanitation means using improved sanitation facilities (for example, flush/pour flush to piped sewer system, septic tank, a composting latrine, and so on). SDG “at least basic” sani-tation has an added criterion of being for the exclusive use of the household (these concepts are reflected in table 4.1). Thus “safely man-aged” is a subset of “at least basic,” which is a subset of “at least limited,” with each addi-tional criterion meaning fewer datasets cur-rently available for analysis. Graphs at the World Bank Atlas http://datatopics.world bank.org/sdgatlas/SDG-06-clean-water-and-sanitation.html make this clearer, and at the website of the WHO/UNICEF JMP, custodian agency for monitoring these indicators glob-ally: https://washdata.org/monitoring
6. The quality of the environment in which the individual resides matters greatly for well-be-ing. Although environmental degradation can be partially offset through market purchases, such as flood insurance, these sorts of goods and services are not widely available and, in any case, often only partly alleviate the phys-ical, mental, and health costs imposed when environmental disasters strike.
7. Not all indicators are applicable to every household. For example, not every household has a child below the school age for grade 8 (necessary for the school enrollment indica-tor). In these cases, the weight for the missing indicator is shifted to other indicators within the dimension so that each dimensional weight is unchanged. The same process occurs if the information on an indicator for a house-hold is missing, even if the indicator is appli-cable. Because of this reweighting process, few households are ignored because of missing
Notes 1. Economists describe this result formally by
saying that utility-maximizing consumers will, in choosing their consumption bundles, end up equating their marginal rates of sub-stitution (a ratio of marginal utilities) to the relative prices. Hence, so long as markets func-tion well, relative prices are natural weights with which to aggregate goods and services. Where markets work less well, the case for adding separate dimensions of well-being is stronger (Ravallion 2011; Ferreira and Lugo 2013). In addition, even when there are prices for some of these dimensions, such as school fees for private schooling, these might not be reflective of the “value of a poorly maintained village school without a regular teacher. The implications of debt owed to a landlord may not be captured by ruling interest rates. The value of health services depends on the cir-cumstances of the individual and household” (World Bank 2017b, 155)
2. See Sustainable Development Knowledge Plat-form (database), Department of Economic and Social Affairs, United Nations, New York, https://sustainabledevelopment.un.org/.
3. So long as markets work reasonably well, prices—the weights for the quantity of goods and services consumed—bear a very close relationship to the marginal contribution of those goods to well-being. In technical terms, the ratio of two prices equals their marginal rate of substitution between the two goods. When externalities or other imperfections distort the market price, then a shadow price can be used in principle to value a good. How-ever, the information required to estimate an accurate shadow price is high, and frequently shadow prices cannot be estimated with much accuracy. Typically, when there is no adequate comparator, or the distortion is too great, one moves to add the good or service in question as a separate dimension.
4. Hentschel and Lanjouw (2000) distinguish three reasons for the price of public utilities to vary across consumers: rationed markets, public subsidies, and increasing marginal tariff rates. The authors present a method to impute the value of consumption of basic utilities irrespective of the source of water, cooking fuel, or electricity to be incorporated into the consumption aggregate. At present, data are not available at a large scale across countries and thus cannot be implemented.
5. “At least limited” and “at least basic” drinking water and sanitation reflect the key concepts of SDG monitoring in this exercise. Box 4.2

BEYOND MONETARY POVERTY 121
data. Indeed, only households on which infor-mation is missing on all the indicators that constitute a dimension are not considered in the analysis.
8. The share of monetary poor differs from the numbers presented in chapter 1. This is primarily because the estimates presented in chapter 4 are from around 2013, and not “lined up” to 2015, as is the case in chapter 1 (see appendix A for details on why the num-bers presented in this chapter differ slightly, and for how survey estimates are lined up to a reference year). The 2015 lined-up headcount ratio for the 119 countries covered here is 11.2 rather than 11.8 percent. This difference mostly reflects that countries had positive growth rates from 2013 to 2015, and hence reduced poverty during that time. For exam-ple, the headcount ratio presented here for the Lao People’s Democratic Republic, which is based on a survey from 2012, is near 23 per-cent, whereas the 2015 lined-up estimate for Lao PDR is 14 percent. Conversely, the recent crisis unfolding in the Republic of Yemen means that the headcount ratio of 19 percent presented in chapter 4, based on a survey from
2014, is lower than the lined-up estimate in 2015 of 41 percent.
9. These figures may not be representative of the entire region because of incomplete popula-tion coverage. The coverage in East Asia and Pacific and South Asia is particularly low (see last column of table 4.4.): China and India are not a part of this exercise because of data availability.
10. See the demographic composition typology proposed in Muñoz Boudet et al. (2018) for the methodology followed.
11. Some studies show that households with chil-dren will likely appear more disadvantaged under a child-specific multidimensional pov-erty measure (Hjelm et al. 2016).
12. The Indonesian survey is not nationally rep-resentative. The sample is representative of about 83 percent of the population and cov-ers 13 of the 27 provinces in the country. The provinces excluded tend to be less developed.
13. The surveys are not necessarily the same sur-veys used for official national poverty esti-mates. The monetary poverty rate cited here may therefore vary somewhat from official estimates.

122 POVERTY AND SHARED PROSPERITY 2018
National Multidimensional Poverty Indexes (MPIs) are increasingly being adopted as official permanent poverty statistics, usually standing alongside and complementing national mone-tary poverty statistics (Alkire and Foster 2011; Alkire et al. 2015; UNECE 2017; OPHI 2018). Updated usually every one to two years, national MPIs are used to shape and energize effective policy actions. They are reported against SDG Indicator 1.2.2.
The Atkinson Commission report Monitoring Global Poverty placed great emphasis on na-tional poverty estimates, both monetary and multidimensional, given their central relevance to national policy and public debate. In the case of poverty measurement, the report advocated jointly reporting the global and national poverty measures in national poverty reports. The report also scrutinized the dimensions and indicators covered by national MPIs, and observed that their data requirements are modest: most require 38–70 questions compared to 450 or more survey questions for monetary poverty measures (World Bank 2017b, 172).
But how do national MPIs differ from the global MPI that the United Nations Develop-ment Programme and Oxford Poverty and Human Development Initiative have published since 2010 (UNDP 2010; Alkire and Santos 2014) or from the ones presented in this chapter? The difference is similar to the difference between the US$1.90 per day measure of extreme poverty globally and national monetary poverty measures. That is, whereas the global poverty measures are computed in a standardized format for every country, national poverty mea-sures are tailored to the contours of poverty and the policy priorities of each context. Also, na-tional measures are computed by national statistical offices, using national survey data. Thus, national MPIs may have different dimensions and indicators; their deprivation cutoffs may reflect the aspirations, context, or national plan of the country; and the weights and poverty cutoff are set so as to identify poverty according to national definitions. Nearly all national MPIs cover health, education, and living standards. The Atkinson report recommended six nonmonetary dimensions for the global MPI including employment, and many national MPIs already include a dimension on work.
National MPIs cannot be compared across countries precisely because the definitions differ. However, the great advantage of national MPIs is that they can be—and indeed are being—used to guide policy in powerfully practical ways. In particular, the following are the main uses to date of national MPIs by the increasing community of countries that use these indexes.
• Complement monetary poverty. The national MPI makes visible a set of nonmonetary deprivations. The value added is seen by exploring mismatches. For example, Chile’s MPI made visible situations of high poverty in Atacama, a low-monetary poverty region in the country. Bhutan (2017) found that the district of Gasa, which had lowest monetary poverty, had the highest MPI because of missing services and infrastructure.
SPOTLIGHT 4.1
National Multidimensional Poverty Indexes
Prepared by Sabina Alkire, Oxford Poverty and Human Development Initiative

BEYOND MONETARY POVERTY 123
• Ease communication. The headcount ratio of monetary poverty, which is widely used, is always compared to the headcount ratio of multidimensional poverty. And the national MPI often accords with participatory work showing how people are poor. El Salvador’s MPI was informed by a study on poverty “as Viewed by Its Protagonists” linking poor people’s voices to each indicator of the MPI (UNDP 2014).
• Monitor trends. In every country, the national MPI tracks the trend of multidimensional poverty over time, nationally and by rural-urban regions, subnational regions, and social groups, providing a rigorous overview of progress.
• Allocate resources. The national MPI is regularly used to shape both sectoral and regional budget allocation across regions and across sectors. For example, Bhutan’s district allocation formula uses the MPI.
• Leave no one behind. The national MPI is disaggregated by population subgroups to see who is the poorest. Changes over time are reported across subgroups, to establish whether the poorest regions are catching up—or whether their progress is slower than less poor re-gions, so that the poorest regions are gradually being left behind. For example, Pakistan’s poorest district, Musakhel, reduced poverty the fastest over the period 2005–15.
• Target households. The national MPI structure is used to identify which poor people are to be recipients of certain benefits. This is usually done using a different data source: a census, partial census, or eligibility applications. For example, Costa Rica targets households ac-cording to their deprivation scores on the national MPI.
• Coordinate policies. The national MPI is used as a management tool to coordinate poli-cies across sectors and across levels of government, and to design and monitor integrated, multisectoral policies that bridge silos. Although practices vary, this measure-to-manage ap-proach is mainly used when data are updated every one to two years. For example, Colombia has a Ministerial Round Table chaired by the President, which meets regularly to accelerate progress in reducing its MPI—which is updated annually.
• Be transparent. Many countries post the computational files required to replicate their of-ficial national MPI online. For example, Mexico’s CONEVAL both launches its MPI and posts online tables two weeks after cleaned data are received. In many cases, methodological notes, data tables, microdata, and presentations are also online, so citizens can easily learn and interact.
Thus, national MPIs provide a headline and high-resolution information panel on subna-tional conditions across population groups and across the joint distribution of deprivations in different dimensions of poverty. Although most cannot be compared cross-nationally,a they do complement official national monetary poverty statistics by providing policy-relevant evi-dence on poverty in other forms and dimensions.
Details of national MPIs and of their policy applications are available on the website of the Multidimensional Poverty Peer Network, a South–South Network that convenes countries using or designing or exploring national MPIs (see www.mppn.org).
a. Nepal adopted the global MPI, with slight adaptation, as its national MPI in 2018, partly in order to avail such comparisons.
