beyond matched pairs - optibriumboyle... · beyond matched pairs ... fragment index collate index...
TRANSCRIPT

Beyond matched pairs Using matched series for activity
prediction
Noel O’Boyle NextMove Software
Optibrium Consultants’ Day Cambridge, Nov 2014
Using Matched Molecular Series as a Predictive Tool To Optimize Biological Activity J. Med. Chem. 2014, 57, 2704.
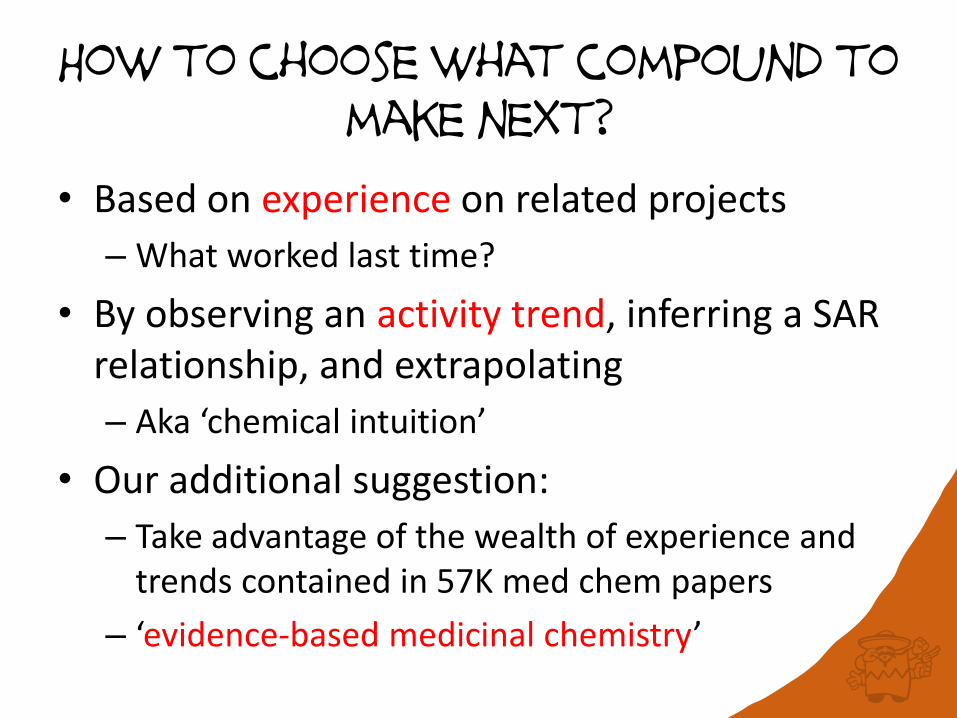
How to choose what compound to make next?
• Based on experience on related projects
– What worked last time?
• By observing an activity trend, inferring a SAR relationship, and extrapolating
– Aka ‘chemical intuition’
• Our additional suggestion:
– Take advantage of the wealth of experience and trends contained in 57K med chem papers
– ‘evidence-based medicinal chemistry’

Matched pairs & series

Matched (Molecular) Pairs
[Cl, F] 1.6
3.5
Coined by Kenny and Sadowski in 2005* Easier to predict differences in the values of a property than it is to predict the value itself
* Chemoinformatics in drug discovery, Wiley, 271–285.

Matched Pair usage
• Successfully used for:
– Predicting physicochemical property changes
– Finding bioisosteres
• Not very successful in improving activity
– Activity changes dependent on binding environment
– Need to use matched pair data only for a particular binding pocket for a particular protein
• Hajduk, Sauer. J. Med. Chem. 2008, 51, 553
– Data from 30 protein targets at Abbott
– Most R group transformations led to potency changes normally distributed around 0

pIC50(CC)-pIC50(CCCC)
matched pairs AND ACTivity

matched pairs AND ACTivity
pIC50(CC)-pIC50(CCCC)
For those cases where: [CCC > CCCC]

matched pairs AND ACTivity
pIC50(CC)-pIC50(CCCC)
For those cases where: [CCC < CCCC]

Matched Series of length 2 = Matched Pair
[Cl, F]
“Matching molecular series” introduced by Wawer and Bajorath, J. Med. Chem. 2011, 54, 2944

Matched Series of length 3
[Cl, F, NH2]

Ordered Matched Series of length 3
3.5
2.1
1.6
pIC50
[Cl > F > NH2]

Matched Series Literature
• “Matching molecular series” introduced by Wawer and Bajorath JMC 2011, 54, 2944
– Subsequent papers use MMS to investigate SAR transfer, bioisosteres, SAR networks, visualisation of series and networks
• Until ours, only a single other paper on MMS
– Mills et al Med Chem Commun 2012, 3, 174

+
+
+
Algorithm to find matched Series
Fragment
Index
Collate
Index (Scaffold)
Matched Series
• Hussain and Rea JCIM 2010, 50, 339
– Fragment molecules at acyclic single bonds
• Single-cut only, scaffold >= 5, R group <= 12, preserve stereochemistry at break point
– Index each fragment based on the other
• A matched series will be indexed together
Matched Series
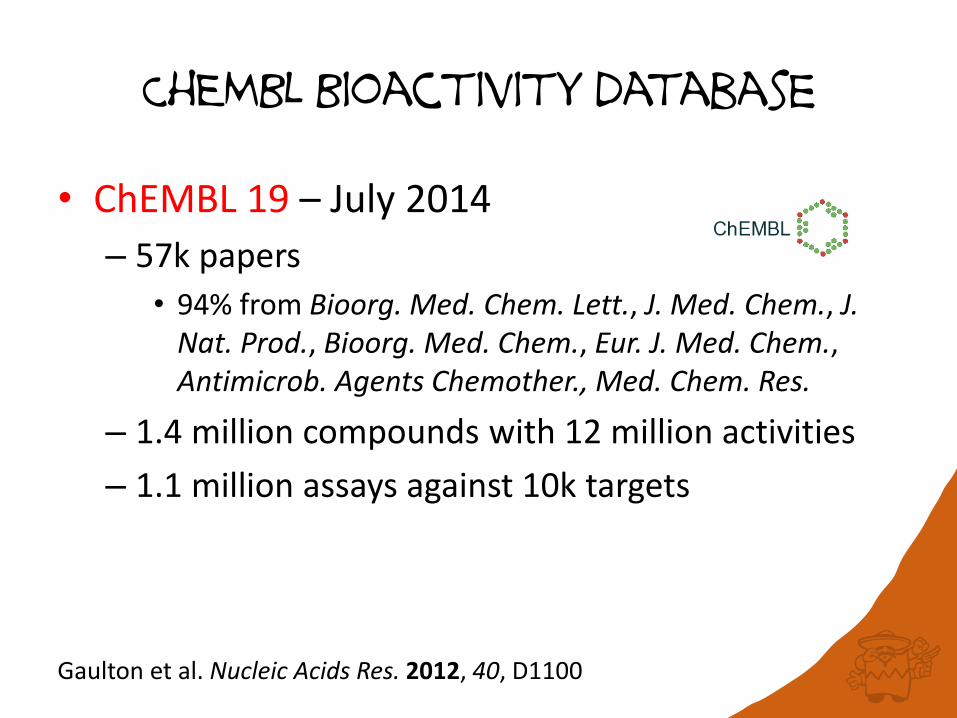
ChEMBL Bioactivity database
• ChEMBL 19 – July 2014
– 57k papers
• 94% from Bioorg. Med. Chem. Lett., J. Med. Chem., J. Nat. Prod., Bioorg. Med. Chem., Eur. J. Med. Chem., Antimicrob. Agents Chemother., Med. Chem. Res.
– 1.4 million compounds with 12 million activities
– 1.1 million assays against 10k targets
Gaulton et al. Nucleic Acids Res. 2012, 40, D1100

1
10
100
1000
10000
100000
1000000
2 4 6 8 10 12 14 16 18 20 22 24 26 28 30 32 34 36 38 40 42 44 46 48 50
Fre
qu
en
cy
Series length
Matched series in ChEMBL19 IC50 binding assays
Length 2: 240,967 212,494 Length 3: 59,753 52,666 Length 4: 27,779 24,306 Length 5: 15,892 13,834 Length 6: 10,619 9,203
ChEMBL16 ChEMBL19

SAR Transfer

CHEMBL768956 COX-2 inhibition
CHEMBL772766 COX-1 inhibition
R Group CHEMBL768956 (pIC50) CHEMBL772766 (pIC50)
SMe ?? 5.92
NH2 ?? 5.88
OMe 6.68 5.59
Me 6.10 4.82
Cl 5.92 4.75
F 5.82 4.59
Et 5.81 4.54
CF3 5.70 <4.00
H 5.62 4.26
COOH 4.23 <3.60
0.93 rank order correlation
Potential SAR transfer
Rank order

50x50 matrix from Pickett et al.
R1
R2
Pickett, Green, Hunt, Pardoe, Hughes. ACS Med. Chem. Lett. 2011, 2, 28.

50x50 matrix from Pickett et al.
R1
R2
Pickett, Green, Hunt, Pardoe, Hughes. ACS Med. Chem. Lett. 2011, 2, 28.

50x50 matrix from Pickett et al.
R1
R2
Pickett, Green, Hunt, Pardoe, Hughes. ACS Med. Chem. Lett. 2011, 2, 28.

It’s a set of matched series
• Each row/col is a matched series
• Choose a row and a col with the fewest missing values
• Order other rows/cols by average difference with respect to chosen row/col
R1
R2

Multi-dimensional scaling
• Consider the whole pairwise similarity matrix
• Similar results to previous but should be more robust in general
R1
R2

Internal SAR Transfer Do an all-against-all comparison of the series

External SAR Transfer Do an all-against-ChEMBL comparison

Strengths and weaknesses
• High confidence in predictions if sufficiently long series with correlated activities (or their rank order)
– Not always able to find such a series
– For short series will typically find 10s/100s/1000s of matching series with low confidence
• Suited to pairwise comparison within focused dataset
– Dense SAR matrix from target with well-explored SAR

Preferred ORDERS in Matched series

Preferred orders: Halides (N=2)
For an ordered matched series (i.e. A>B>C>…), there are N! ways of arranging the R Groups:
Would expect 9223 for each assuming the order is random
– We can calculate enrichment
Series Observations*
F > H 9761
H > F 8685
*Dataset is ChEMBL19 IC50 data for binding assays (transformed to pIC50 values)

Preferred orders: Halides (N=2)
For an ordered matched series (i.e. A>B>C>…), there are N! ways of arranging the R Groups:
Would expect 9223 for each assuming the order is random
– We can calculate enrichment
Series Enrichment Observations
F > H 1.06* 9761
H > F 0.94* 8685
*Significant at 0.05 level according to binomial test after correcting for multiple testing (Bonferroni with N-1)

Preferred orders: Halides (N=3)
Series Enrichment Observations
Cl > F > H 1.90* 1478
H > F > Cl 1.08 838
F > Cl > H 0.86* 673
F > H > Cl 0.78* 607
Cl > H > F 0.76* 589
H > Cl > F 0.63* 490

Preferred orders: Halides (N=4) Series Enrichment Observations
Br > Cl > F > H 5.43* 263
Cl > Br > F > H 3.22* 156
H > F > Cl > Br 1.59* 77
Br > Cl > H > F 1.43 69
F > Cl > Br > H 1.40 68
Cl > Br > H > F 0.85 41
… … …
H > F > Br > Cl 0.76 37
… … …
H > Br > F > Cl 0.50* 24
Cl > H > F > Br 0.48* 23
Cl > F > H > Br 0.45* 22
H > Cl > F > Br 0.43* 21
Br > F > H > Cl 0.41* 20
F > H > Br > Cl 0.41* 20
H > Cl > Br > F 0.41* 20
F > Br > H > Cl 0.35* 17
Br > H > F > Cl 0.23* 11
N=2: Max = 1.06, Min = 0.94 N=3: Max = 1.90, Min = 0.63 N=4: Max = 5.43, Min = 0.232 Longer series exhibit greater preferences If [H>F>Cl] is observed, will Br increase activity further? 149 observations of [H>F>Cl] but only 11 where [Br>H>F>Cl]

Matsy: Prediction using Matched Series
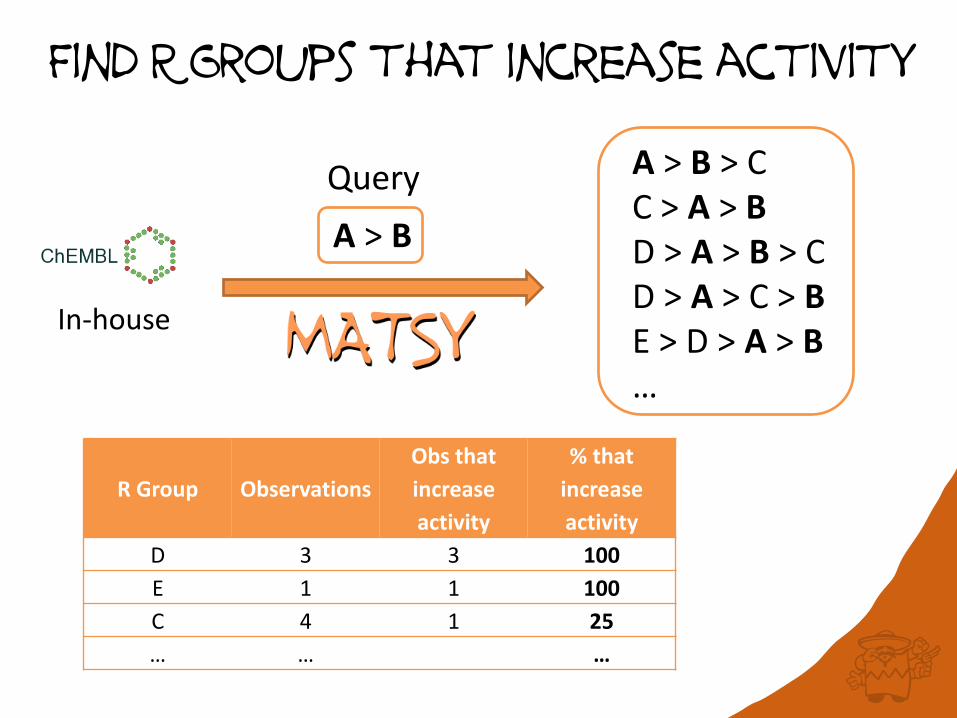
Find R Groups that increase activity
A > B
Query A > B > C C > A > B D > A > B > C D > A > C > B E > D > A > B …
R Group Observations
Obs that
increase
activity
% that
increase
activity
D 3 3 100
E 1 1 100
C 4 1 25
… … …
In-house

Example

Example II

Topliss Decision Tree
Topliss, J. G. Utilization of Operational Schemes for Analog Synthesis in Drug Design. J. Med. Chem. 1972, 15, 1006–1011.

Topliss Decision Tree

Topliss Decision Tree
(11th)

Topliss Decision Tree

Topliss Decision Tree
(1st if lower cutoff)

Topliss Decision Tree

Topliss Decision Tree
(20th)

Matsy Decision Tree (One of Many)

4-Cl > H
Kinases Target-specific
ΔLiPE > 0 Incorporate metrics
Modifying the predictions for

drag-and-drop interface to Matsy

Is it just logP?
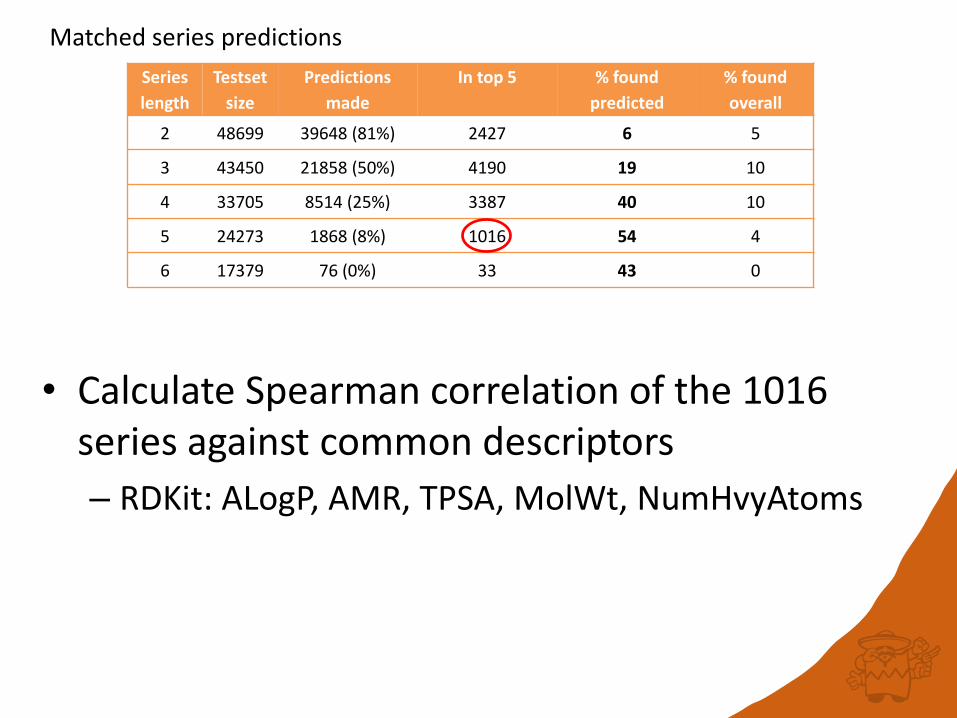
Series
length
Testset
size
Predictions
made
In top 5 % found
predicted
% found
overall
2 48699 39648 (81%) 2427 6 5
3 43450 21858 (50%) 4190 19 10
4 33705 8514 (25%) 3387 40 10
5 24273 1868 (8%) 1016 54 4
6 17379 76 (0%) 33 43 0
Matched series predictions
• Calculate Spearman correlation of the 1016 series against common descriptors
– RDKit: ALogP, AMR, TPSA, MolWt, NumHvyAtoms


In summary
• Longer matched series (N>2) show an increased preference for particular activity orders
• This can be exploited to predict R groups that will increase activity
– Predictions are typically based on data from a range of targets and structures
• Completely knowledge-based
– Can link predictions to particular targets/structures
– Predictions refined based on new results

Beyond Matched Pairs Using matched series for activity prediction
Using Matched Molecular Series as a Predictive Tool To Optimize Biological
Activity J. Med. Chem. 2014, 57, 2704.
Acknowledgements Roger Sayle Jonas Bostrom, AstraZeneca