between imperialism and capitalism. european capital ...users.ox.ac.uk/~econ0243/imperialism.pdf ·...
TRANSCRIPT
Between Imperialism and Capitalism. European Capital
Exports Before 1914
Rui Pedro Esteves∗
Abstract
This paper compares the patterns of foreign investment of two large capital-exporting coun-
tries before 1914 - Great Britain and Germany. An original database of German capital
exports, comparable to Stone’s (1999) data for British capital flows was compiled for the
period 1883-1913. Three classes of variables were tested as determinants of capital flows:
political conditions in recipient countries, long-term prospects of growth, and institutional
characteristics. The empirical analysis supports the view that German capital flows re-
sponded to long-term prospects of growth of recipient countries (“fundamentals”) as much
as British investment. This conclusion is robust after controlling for political affiliation and
suggests that the sharp distinction in the literature between “developmental” and “revenue”
finances is probably a figment of the absence of detailed data on capital exports outside of
Britain.
JEL Codes: F21, F54, N20, N23
Keywords: Capital flows, Imperialism, Britain, Germany, Pre-1913
∗Brasenose College, Oxford; email: [email protected]. I am indebted to Barry Eichengreen for continual guidance,
encouragement, and inspiration. I thank Bradford DeLong, Marc Flandreau, Maurice Obstfeld and the participants at
the 27th meeting of the Canadian Network for Economic History and the Vigo Workshop on International Finance for
very helpul comments. I am also grateful to Michael Clemens, Jeffrey Williamson, Niall Ferguson, and Moritz Schularick
for generously sharing data with me. All remaining errors are mine. I gratefully acknowledge the financial support from
the Fundacao Luso-Americana para o Desenvolvimento (FLAD) and the Fundacao para a Ciencia e Tecnologia (FCT).
The primary research for this chapter was also supported by a pre-dissertation fellowship from the Economic History
Association and a mini-grant from the IBER - UC Berkeley.
1 Introduction
A strong ownership of good foreign securities is an urgent ne-
cessity for us. It is a necessity in peace as in harder times,
and this creditor position of the German nation, which con-
tinually grows, steps up as a powerful support of our political
influence in foreign affairs. When correctly applied, it is also
the means for our trade and industry to conquer new areas.
Rudolf Havenstein, 1909.1
Thus spoke the president of the Reichsbank, not coming down a mountain, but from the rostrum of
the Reichstag on 21 June 1909. These are not exactly surprising words. The historiography of foreign
investment in the four decades before World War I routinely classifies German (and also French) capital
exports as “politicized”, by contrast with the market-oriented flow of funds from London (Feis 1930,
Fishlow 1985). It is undeniable that a measure of political intervention did condition the direction of
foreign investment in this period. Examples of this type of intervention are not hard to remember,
from the Franco-Russian military (and financial) alliance beginning on 1894, to the equivalent German-
Ottoman entente. However, this interpretation does not make much allowance for the fact that almost
all flows involved private capital (the “official” capital market being almost nonexistent in this period).
And private capital seeks a private return, which only by chance coincides with the pursuit of political
objectives by the governments of the main lending countries. Even if we assume, for a moment, that
certain governments could control the way their citizens or banks invested the capital at their disposal,
in the limit, the latter always had the choice of channeling their monies through other financial centers
(read London) where no such intervention was present. In fact, by present standards, domestic capital
markets were hardly regulated, while the spread of the gold standard was associated with the almost
complete absence of capital controls.
A further reason why European investors might want to invest their money in London was the
superior financial technology of this financial center, that could translate into better information about
investment opportunities than otherwise disseminated by other markets. And yet, Paris and Berlin
not only survived the dominant position of London, as they also increased their share of the global
investment market in this period. Likewise, as several recent contributions on the importance of
“Empire effects” have stressed, it is not clear whether the proportions of “imperialism” and “capitalism”
differed so much between British-channeled investments and other markets. The Indian railway network
is a good case in point. Having been built more to suit political and strategic objectives, than to
explore the sub-continent market, Indian railways were among the few foreign British investments with
a lower profit than comparable domestic applications (Davis and Huttenback 1986). Nevertheless, they
absorbed 10% of all British foreign railroad investment between 1865 and 1914.2
As financial globalization progressed until 1914, we are confronted with an increasingly integrated
capital market where ‘financial boundaries’ are harder to recognize. This was true both from the side
of borrowers (who placed their securities in different European markets at the same time), and also for
lenders, who could diversify their portfolio with foreign securities sold abroad.1Cit. in Landsburgh (1909: 821).2According to the data by Stone (1999).
1
This paper tries to bring some new empirical evidence to bear on the overall question of what
were the determinants of European capital exports up to 1913. Political, economic, and institutional
variables are introduced as possible pull factors to foreign investment negotiated in Great Britain and
Germany. A number of reasons justifies the choice of these two countries. First, their significance in
the world capital market. On the eve of World War I these two countries owned more than two thirds
of the world foreign portfolio (Woodruff 1966). Second, they provided domestic and foreign investors
and borrowers with a different institutional setting. In the case of bondholders’ organizations, Britain
was the first market to develop autonomous and ongoing bondholders organizations, whereas German
bondholders relied on the indirect representation of the large issue banks to work out settlements with
impecunious governments (Esteves 2006). Market structure also differed in a significant way between
these two countries. Common measures of concentration imply greater market power in the continental
banking systems, as compared to the more specialized London institutions (Bagehot 1931, Cameron
1967, Flandreau 2003, Lavington 1921).
A third reason for choosing these two countries is data availability. Until recently, the only fully-
detailed database of pre-1914 foreign investment covered British capital exports since 1865 (Stone
1999). In the absence of other comparable databases, the literature has exclusively drawn inferences
from British data, or from the comparison of aggregate stock measures available for a few dates (often
only one, as 1914). Relative to other studies, this paper has the important advantage of adding
a new comprehensive data set of German investment in the period 1883-1913. This allows for a
proper assessment of the patterns of “British” and “German” capital exports, and, hence, to test the
conventional view about the distinctive nature of British investment.
Furthermore, this paper is also relevant to the recent research on the factors that drive FDI or
portfolio investment towards (or divert it from) emergent economies.
The paper is organized as follows. Section 2 peruses some of the most relevant questions raised in the
literature on capital exports, particularly in the pre-World War I period. The next section describes the
nature, and points some caveats, of historical information on long-term capital flows. The same section
details the construction of the new database of German foreign investment. Section 4 is devoted to the
empirical methodology and the list of independent variables used in the estimations. The empirical
results are presented and discussed in the fifth section. A conclusion recapitulates the main results and
provides some qualification. The paper ends with a data appendix.
2 Discussion of Literature
The literature on the financial flows from capital-rich to capital-poor countries has a long history,
reaching back, not surprisingly, to the emergence of the first globalized capital market in the last
quarter of the nineteenth century. The question has been extensively debated from the viewpoint of
both the lending and the borrowing countries. Marxian theory, as adapted by Hobson (1902), Hilferding
(1910), Luxemburg (1913), and Lenin (1996 [1917]), perceives the phenomenon as an extension of the
logic of accumulation of capital. Once core capitalist markets could no longer absorb the output of
these countries, the imperialist drive to secure foreign markets, directly through colonial expansion, or
indirectly by economic domination (sealed by foreign investment), was the inevitable escape from the
threat of over-production and collapse of the rate of profit. This line of analysis was later incorporated
2
in the so-called “dependency theory” (Furtado 1974, Prebisch 1981).
A second, and related, reason for questioning the efficiency of foreign investment is the frequent
association of foreign investment to the projection of political influence by the major European powers
before 1914. During this period there is no dearth of pronouncements about the role of capital exports
in securing markets for domestic industrial exports, sealing diplomatic alliances, and as a general
instrument to further political power abroad. Rudolf Havenstein’s quote at the beginning of the paper
is representative of a widespread current of thought in the Kaiserreich, but similar ideas were being
uttered in Britain or France at the same time. The force of such reading of the facts led Herbert Feis to
conclude, in his classical study of European foreign investment, that “the financial transactions between
western Europe and the other areas were an important element in political affairs . . . Financial force
was often used to buy or build political friendship or alliance, was often lent or withheld in accordance
with political considerations.”3 Nevertheless, one may ask whether such interpretation is not too ready
to accept at face value the contemporaneous political agitation, or the subsequent rationalization of
the role of European governments in bending the levers of financial markets to their preferred ways.
This is an especially pertinent question when crossed with the evidence of increasing internationalized
and integrated capital markets in Europe during the same period. Surely, short of widespread market
regulation and suasion, it is not obvious why European investors would apply their capital in the
enterprises which best suited the political aims of their governments, instead of the return and security
of their investment. In fact, recent historiography has shown that politicians and diplomats often
exaggerated their own significance, while reading bankers’ memoirs also helps to strike a more balanced
view of the facts (Barth 1995). The analysis of the patterns of British foreign investment also revealed
the marked ‘capitalistic’ nature of at least this fraction of European investment abroad (Simon 1968,
Richardson 1972, Clemens and Williamson 2004).
A third and final reason for disagreeing about the virtues of international capital flows has to do with
the many imperfections of the international capital markets. Unlike the seamless world of the concave
neoclassical production function, capital is routinely stopped from flowing to poor countries, either
because the institutional framework is imperfect, or due to omitted “third factors,” which depress the
marginal product of capital in capital-poor countries (Lucas 1990). The majority opinion seems to side
with the idea that the integration of poor countries into the international capital markets promotes
their long-term growth possibilities (Eichengreen 2003, Obstfeld 1998, O’Rourke and Williamson 1999,
Schularick and Steger 2006). However, the costs of international defaults (Reinhart, Rogoff and Savas-
tano 2003), and the incidence of ‘sudden stops’ (Calvo 1998) have led some authors to doubt the net
gain from taping the pool of foreign saving.4
Within such broad framework, this paper has a more modest objective, which is to further our
understanding of what were the factors that pulled international capital flows to the different recipient
countries during the first era of financial globalization (1880s-1913). As indicated by the title of
Feis’s (1930) book, Europe was the powerhouse of international finance before World War I. Moreover,
according to the classical estimates of foreign capital stocks, “Europe” can be almost reduced here
to the three leading capital-exporting countries, viz., Britain, France and Germany. Indeed, by the
eve of World War I, these three countries concentrated about three fourths of the world total foreign3Feis (1930: xxvi).4See also Edison et al. (2002), and Jeanne and Zettelmeyer (2006).
3
investment (see Table 1).
[Table 1 about here.]
Other “stylized facts” of European foreign investment during this period include: the leading position
of British capital, often near to half of the total, the late emergence of German capital, and the different
structural composition of foreign investment by the three main European economies. In this latter
respect, one usually remarks the contrast between the predominant orientation of German and French
investment towards government-sponsored securities in European outlets, and the preference of British
investors for private applications in the New World and Empire (Woodruff 1966).
Fishlow (1985) produced the most accomplished analysis of the structure of European capital exports
to date. The author emphasizes the differences in institutional frameworks and regulatory settings be-
tween European markets to operationalize Feis’s distinction between two models of foreign investment:
“developmental” and “revenue finance.” Investment of a “developmental” kind was mainly (but not
exclusively) the province of British investors, who benefited from a fairly deregulated market setting
and superior financial technology to be able to invest their savings in the most promising outlets
abroad. The nature of the informational asymmetry and of the context of rapid technological progress
in transportation (allowing for the expansion of markets) implied that these opportunities were mainly
concentrated in transportation - especially railroads - and other infrastructure (Bordo, Eichengreen
and Irwin 2000). This led to a win-win outcome, as the “British capital market mediated between the
real social benefits of peripheral infrastructure investment and financial gain to individual investors.”5
On the contrary, “revenue finance,” as practiced by France and Germany, was of an unproductive
nature, because it did not chase after positive “fundamentals” in the emerging economies of the time:
“Borrowing was more often to balance government accounts than to undertake infrastructure develop-
ment.”6 In a certain sense, “Continental” European investors took a gambit by investing into high-yield,
but also high-risk government securities, especially in the European periphery. The governments of
lending countries also helped in steering the market to this outcome:
lending to governments had its institutional counterpart in a regulated capital market.
Private investment decisions, in the absence of favorable real economic prospects, could not
be relied upon to produce the desired outcome . . . Not surprisingly, both the Paris and the
Berlin capital markets provide abundant evidence of the public intervention required for
large-scale revenue lending to flourish.7
In this case, private and public benefits were not complementary. “Borrowers were very much in
a debt trap,” whereas foreign investors were usually able to earn a higher return than in comparable
domestic securities, and banks draw extensive profits from public debt operations.8 A superior financial
technology, complemented with a first-mover advantage, provided Britain with a leading position in
the market for foreign investment. Germany and France, relegated to the margins, were forced to carve5Fishlow (1985: 51).6Fishlow (1985: 54).7Fishlow (1985: 54, 55).8Fishlow (1985: 54). Schaefer (1993) calculates that German investors gained a higher internal rate of return on
foreign securities than on German safe securities (government bonds). As expected, this premium fell from 3.84% in
1873-79 to 1.47% in 1906-12. Also see Muller (1988).
4
out a share of the market to themselves, often through a more politicized approach.9
Analysis of this interpretation deserves a matching test. However, a proper test of Fishlow’s typology
of investment trends requires a detailed database of the European capital flows, which are summarized
in the traditional end-of-period stock estimates of Table 1. Up to recently, the only fully-disaggregated
database of European capital exports available before 1914 was published by Stone (1999), based on
the effective capital calls of foreign securities traded in the British markets. This information has been
used in the literature to characterize the pattern of “British” capital exports. Clemens and Williamson
(2004), in particular, find that the pattern of British foreign investment also exhibited the wealth
bias that characterizes contemporary international finance (Lucas 1990). The authors further conclude
that this bias was mainly explained by economic fundamentals as the levels of schooling, natural
resources, and the demographic structure of the recipient countries. This result fits with Fishlow’s
(1985) characterization of British investment as mainly “developmental.”
Nevertheless, it still remains to verify that German and French investment flows did in fact react
more to political suasion and high promised yields of government securities than to long-term economic
fundamentals. Furthermore, Clemens and Williamson (2004) do not mention that a substantial part
of what was classified as “British” capital calls were actually applications of Continental money that
sought the London market, especially before the rise of Berlin, and recovery of Paris, between the late
1870s and the 1880s, as major competing centers for the international distribution of European capital.
As Hyde Clark, the secretary of the British Council of Foreign Bondholders, put it:
Thus for the last half-century this country has become the chief centre for foreign loans.
This is not on the vulgar faith that John Bull’s enormous wealth enables him to supply
money to all foreigners, but because this has become the great centre for lending the money
of foreigners to foreigners, as Holland formerly was.10
In this sense, it is dubious whether the results actually characterize a “British” pattern of investment, by
contrast to a “Continental” pattern. However, the authors could not replicate their results for German
or French investment abroad, for lack of a database comparable to Stone’s (1999). My paper starts
filling up this gap by providing the first fully-disaggregated database of German foreign investment
between 1883 and 1913.
3 Database of Capital Exports
3.1 General Nature of Data
Before entering into the description of the data sources, a word of caution is in order with respect
to the correspondence between the ideal measure of long-term foreign capital flows and the statistical
pieces available in practice.11
A possible way of approximating the actual flow of capital would be to use current account data.9On this point see Fishlow (1985) again, and also Schaefer (1993).
10Clarke (1878: 303). Other references to this migration of Continental funds to London can be found in Lysis (1908),
Marx (1913), and many others.11Short-term capital movements are virtually impossible to reconstruct, as emphasized by Bloomfield (1963). For an
exception see Flandreau and Gallice (2005).
5
However, historical current account data is widely considered to be unreliable.12 Besides that, even
if current account data were accurate, they do not exactly fit with the purposes of this study. First,
because these are net flows, where income from previous applications is deducted from new capital
investment. Although return considerations naturally affect investment decisions, one would expect
these to be more determined by future, instead of current returns. In this sense, a study of gross flows
is more warranted. Second, bilateral accounts between each net capital exporter and importer are even
harder to come by, while I am interested not only in the total amount but also in the direction of
capital flows.
An alternative approach is to try and reconstruct capital flows from the statistics on the placement
of foreign securities, completed with information on foreign direct investment. This method has the
advantage of retrieving gross flows, but has some problems of its own. Figure 1 illustrates the several
sources of information that have to be pieced together.
[Figure 1 about here.]
The fraction of capital exports most easily recovered from historical sources is portfolio investment,
as foreign securities were usually admitted to trade in stock markets, thereby leaving a trace in market
listings or records of new flotations.13 As today, IPOs were sufficiently publicized in government records
or in the financial press, especially if the securities were admitted to the official segment of the market.
However, with the spread of the practice of banking syndicates, foreign securities were typically placed
in several markets simultaneously. Consequently, information on the actual lots of securities sold in
each country is also necessary. The details of such operations, however, were not always made public
by the financial houses involved for strategic reasons, and may have to be obtained from direct sources
(banking archives) or replaced with contemporary estimates.14 Sometimes, securities of less reputed
foreign debtors would only be floated and traded in the ‘free’ market, which being less regulated than
the official market, makes it harder to reconstruct the actual amounts involved. Other than the initial
placement of new foreign securities, domestic capital could be called up to international applications
through operations in the secondary market after the IPO. That this market was liquid enough to
substantially change initial positions across placement markets is often mentioned in contemporary
literature.15
A final component of capital flows was made up of non-securitized investment in foreign assets.
Because these positions were not traded in open markets (or at least not originally so), it is harder to
estimate their importance. Nevertheless, this information is sometimes available in contemporaneous
compilations, investment handbooks, or financial literature, both in the investing and the receiving
countries.12See Platt (1971) and Jones and Obstfeld (2001).13Beyond the flotations of new securities, another category of issues relevant here is the offer of securities to convert
older issues, whenever the nationality of the owners changed with the conversion.14According to the Deutschen Oekonomist, a German financial newspaper, “the issuing house alone knows the amount
really sold off in Germany during the short period after the emission in consideration here; however, it discloses the same
amount perhaps only if it sold out, from which the message that an oversubscription took place, needs not always be
interpreted the same way” (cit. in Marx 1913: 18).15Contemporaries referred to these operations as “intenational arbitrage.” See Clarke (1878), ANPFVE (1900), and
Marx (1913).
6
3.2 British Data
The database on gross British capital exports compiled by Stone (1999) is based on the data gathered
by Jenks (1927) and Simon (1968). The period covered runs from 1865 to 1914, and the annual flows are
disaggregated by country and sector of destination. The British estimates cover exclusively long term
portfolio investment, as “Direct investment by companies without the issue of securities, investment by
noncorporate ownership and conversion issues not requiring the export of new funds from Great Britain
were excluded.”16 In its final version, the British data include estimates of the British share of IPOs
placed in all British and foreign capital markets, as well as in private placements. They further take
into consideration the capital called for conversions of old securities, when the nationality of the owners
of the securities changed because of the operation (‘export conversions’). Because of the widespread
practice of “successive emissions,” in which the effective payments were spread out over a possibly long
period after the security issue, the British series is dated from the lists of capital calls (and not from
the date of issue) as published in the Investors’ Monthly Manual. Next to this monthly publication,
the compilers of the database made use of other sources, namely stock market yearbooks, government
records and other unpublished material.17
3.3 Sources on German capital exports
There are three main sources from which to reconstruct the flows of German capital to foreign
applications: tax records, stock market regulatory agencies, and the financial press.
As Stone (1999) and his predecessors Leland Jenks and Matthew Simon, I draw extensively on the
financial press of the time, which published at regular intervals the return of foreign securities floated
at German stock exchanges, together with estimates of the effective capital calls. Contrary to the
English press, the German financial newspapers only counted the issues related to new capital calls.18
Furthermore, the German financial sources only usually list the full amounts issued at the original date
of placement of the securities. Nevertheless, in those cases where the schedule of effective payments
was listed, the maximum delay hardly ever went beyond the same civil year as the date of issuance,
which makes it a moot point for an annual series. It was also the opinion of contemporary authors
that Sukzessivgrundungen were much less common in Germany than in Britain (Marx 1913).
The prominent sources of this type are the weekly Deutsche Oekonomist, and the daily Frankfurter
Zeitung. Throughout the period there is a fair amount of disagreement between these two publications,
and their comparative merits were the subject of some discussion in official circles. The report of the
German Stock Exchange Inquiry (Borsen-Enquete), wrote by Gustav v. Schmoller in 1893, praised
the data of the Deutschen Oekonomist.19 The members of the 1908 Bankenquete, on the other hand,
although understanding that both sources were incomplete, considered the figures of the Frankfurter
Zeitung to be closer to the truth.20 In any case, I chose to follow, whenever possible, the Deutschen16Stone (1999: 32n5).17For a description of the sources and method see Simon (1968).18That is, omitting conversions of old securities. Contemporaries usually assumed that ‘export conversions’ had a
negligible weight - see, e.g. Deutschen Oekonomist 28.12.1889 no. 367, p. 705. Differently from the authors of the
British database, I could not check how well this assumption corresponded to reality.19“Generally speaking, the comparison [with other estimates] appears to show that Christians’s estimates are made
with caution and expertise, and therefore will be able to be used for various purposes” (Borsen-Enquete 1893: xx).20US National Monetary Commission (1910a, I: 478-79)
7
Oekonomist over the Frankfurter Zeitung for a number of reasons. First, it is the more continuous
of the two, published every semester since 1883, which may imply that the sources of measurement
error remain relatively constant throughout. Second, Wilhelm Christians, the editor of the Deutschen
Oekonomist aimed at including all foreign securities sold in Germany, whereas the Frankfurter Zeitung
only published estimates on foreign government and mortgage bonds (Pfandbriefe).21 And third, this
series has been used by all modern literature on the history of the German capital market.22
There are further reasons why I decided not to use the information from tax records and regulatory
agencies. The German stamp and securities tax (Effektenstempelsteuer) was levied since 1881, in
principle, on every foreign security sold or held within Germany. Although contemporaries considered
this to be the nearest measure of “the exact amount and the precise time of capital investment” (Marx
1913: 60), as any tax data, we have to take into account the possibility of tax evasion (Schaefer 1993,
Steinmetz 1913). Moreover, only the nominal value of the securities can be recovered from this source,
as the tax was levied on the face value, not the transaction or the current market price. Finally, the
tax returns are only available for a fraction of my research period. Indeed, despite repeated complaints
about the reluctance of the Imperial tax administration in publishing the data on this tax, the statistical
administration only gave in, and started publishing regular returns of the stamp tax, in October 1907.23
For the period before, we can resort to two sources of information on stamp tax returns.
The first was published in 1873, in connection with the outlawing of the sale of foreign lottery bonds
in Germany. The law of June 1871 required that all lottery bonds held in the country be stamped,
as a condition for exempting them from the ban on these securities. This operation returned a total
of 513.5 million Marks (face value), distributed among 94 bonds issued by 12 countries. However, as
the official report acknowledged, this class of securities added “only to a small fraction of the private
property owned in securities, and especially foreign securities.”24
The second source comes from the Borsen-Enquete of 1893, and covers the period 1882-92. Although
this time covering all types of securities, it only registers the securities presented at the tax boards
(Steuerbehorden) of Berlin, Frankfurt and Hamburg for admission to trade in the official market of
the local exchanges. This implies that these figures do not include securities not traded in the stock
market, or only traded in the curb.25 Moreover, every new security was taxed, irrespective of being
associated with an effective capital call, e.g., securities issued for conversion of previous securities or as
counterpart to mergers and acquisitions. Consequently, stamp statistics will overstate the real capital
invested. Finally, this source also only published cumulative values by security. In this sense it is
almost a stock measure, which doesn’t allow to reconstruct the annual flow of German capital exports.
The nominal value of all foreign securities stamped in the three main German exchanges between 1882
and 1892 totalled a little over 5.3 billion Marks (£ 261 million).26
21Marx (1913).22See Hoffmann (1965), Pohl (1977), Schaefer (1993), and Wetzel (1996).23See Eberstadt (1901), or the regular protests on the pages of the Deutschen Oekonomist.24“Die auslandischen Inhaberpapiere mit Pramien im Deutschen Reiche,” Statistik des Deutschen Reiches, 1. Series,
Vol. 2 (1873), p. III.1.25This is also a problem with Stone’s (1999) data for Britain. Hamburg was the only stock exchange to provide the
officials of the Borsen-Enquete with a list of foreign securities floated on the ‘free’ section of its market. These totalled
£10.2 million (nominal), or roughly 60% of the nominal value of stocks and debentures traded in the official market and,
therefore, stamped.26From now on, all values in Marks will be converted to pounds sterling at the central gold parity of 20.4 Marks per
8
Although unhelpful to reconstruct the flow of German capital exports, the data on stamping provide
a useful snapshot of the structure of the German foreign capital market. Because the information
was published by tax board, we can reconstruct the geographical distribution of the German capital
exports. Contrary to Britain and France, the German foreign capital market cannot be reduced to
Berlin. Frankfurt and Hamburg absorbed 11.6% and 6%, respectively, of the total market for foreign
securities (see Table 2).27
[Table 2 about here.]
Moreover, there is a distinct pattern of geographic specialization. Close to two thirds of German
investment in Scandinavia was arranged via Hamburg, whereas Frankfurt dedicated almost half of its
investments to Southern European applications. Finally, almost all overseas investment was negotiated
in Berlin. Given this structure, I will use in what follows the information on the foreign securities traded
in the markets of Berlin, Frankfurt, and Hamburg. Moreover, German capitalists only effectively held
one quarter of the total capital value of these securities, the remaining three quarters having been sold
to other European investors.28
Because of renewed worries about the “drain” of German capital to foreign applications, government
authorities also became interested in the estimation of capital exports, providing some very useful
compilations of securities floated, along with extensive discussions about the reliability of the alternative
statistical compilations available.29 The main official compilations in this context are the already
mentioned Borsen-Enquete of 1893, and the 1908 Bank Inquiry (Bankenquete). One of the outcomes
of the Borsen-Enquete was the creation, for each German exchange, of a government representative
(the Reichskommissar), and of a committee of experts (Zulassungsstelle) responsible for approving the
listing of new securities in the “official market” of each exchange. These two public entities shared
some of the attributes of the present-day SEC, and were responsible for keeping and publishing a full
list of all new securities listed in each year in all German exchanges.30 Despite its comprehensiveness,
this Zulassungsstatistik is only partially helpful. Lake the stamp statistics, it only includes the official
segment of the market, and not the curb (what Germans characteristically called the “free market”).
Secondly, it also lists securities issued for conversion or mergers. Thirdly, new issues were usually listed
for their full amount, without distinguishing the share (if any) actually sold in Germany. The figures
in Table 2 illustrate the degree of potential overestimation of capital flows from using this measure.
Tax rolls, securities listings, and the financial press usually only gathered the value of securities
floated in the official segment of the stock exchange. I also tried to complete the time series of German
capital exports with other sources of information on foreign direct investment. It was often the case
that a direct investment abroad by a German corporation did not give rise to the listing of a security
pound. The German Empire was a member of the gold standard between 1872 and 1914.27Pohl (1977) counts the number of foreign securities introduced in the official segment of the markets between 1900 and
1913. By this measure Frankfurt and Hamburg had 43% and 39% as many listings of new foreign securities as Berlin,
respectively. Naturally, the number of securities is a less informative statistic than the amount of foreign securities
stamped in each tax board. Moreover, many of these securities were simultaneously listed in the three markets.28As mentioned, this is a lower bound estimated, because it ignores foreign bonds held abroad by German investors to
avoid the tax.29For the debate on the capital “drain” see Schaefer (1993).30For a detailed description of these two institutions and of their impact on the German stock markets see Wetzel
(1996).
9

in a German exchange, or then that the security only acquired a listing some time after the original
flow of funds. Likewise, many colonial companies did not issue securities in German exchanges, or only
went public after some time.31 The main sources I used to try and breach this gap were the 1914-
15 edition of the Saling’s Borsen-Papiere -a very detailed investment handbook- two monographies
on the role of big German banks in capital exports (Otto 1911 and Steimetz 1913), and the colonial
investment handbook of Hellmann (1914). To have an idea of the significance of this addition, the
unlisted investment compiled from these three sources represents 5.5% of the total nominal capital
value of the database.32
My disaggregation of German capital exports can be summarized in a few figures. Between 1883
and 1913, 728 foreign securities were placed in German stock markets with a face value of 675.8
million pounds. These securities were effectively placed in Germany, i.e., they were offered at an
IPO, instead of just listed or traded in a German exchange. As mentioned before, many securities
were only listed in German exchanges, or then only partly sold there (if placed through international
underwriting syndicates). In the same period, 5305 foreign securities with a face value of 3.3 billion
pounds were admitted to listing just in Berlin.33 The same 728 securities were sold at an average price
of 93.4%, representing 631.8 million pounds in capital calls invested in 57 foreign countries. Table 3
summarizes this information along with the data on securities of German colonies, and capital flows
not intermediated by the official stock markets. For comparison, the table also lists foreign investment
as estimated by the Deutschen Oekonomist.
[Table 3 about here.]
Although the main source, I deviated in some cases from the Deutschen Oekonomist, namely to
include over 40 million pounds worth of investment in German colonies and securities placed outside
the official markets (unlisted). The remaining 17 million pounds of difference between my total sample
and the one from the Deutschen Oekonomist are due to discrepancies between the newspaper’s estimates
and other sources, in cases where I chose to follow the latter. In particular, I confronted the list of
foreign securities of the Deutschen Oekonomist with the prospectuses of new emissions published in
the Frankfurter Zeitung.34
Figure 2 represents the time path of German foreign capital exports used as the sample for the
empirical study ahead, and compares it with the estimates of the Deutschen Oekonomist. Figure 331Furthermore, colonial securities were listed under ‘domestic’ emissions in the three sources of information: stamp
tax, new listings, and financial press.32This order of magnitude seems to be in agreement with Matthew Simon’s assessment that portfolio investment
“occupied a pre-eminent position in pre-1914 British long-term capital movements” (Simon 1968: 18). Edelstein (1982)
estimates the share of direct investment, without the intermediation of formal capital markets, at 10% before World War
I.33Wetzel (1996), appendix 5. Out of this population of securities, I could not identify the German share, if any, of
only 88 securities, which were left out of the sample.34The German law required that every issue or listing of new foreign securities should be preceded by the publication
in the main local newspapers of a prospectus detailing the aims and particulars of the issue. Foreign governments and
companies only seldom chose the Deutsche Oekonomist, a weekly paper, to publish their prospectuses. Not so with the
Frankfurter Zeitung und Handelsblatt which disputed with the Berliner Borsen-Zeitung the position of leading financial
periodical. An extra advantage of using the Frankfurter Zeitung comes from its reliability. Schaefer (1993) mentions that
the Frankfurter Zeitung refused to publish announces from companies with “dishonest business practices” and brokers
in the “free market” (bucketshops), even before the legal requirement of a prospectus was established in 1896.
10
then decomposes the differences in the two series. Up to the early 1900s this difference is almost
exclusively explained by my addition of colonial securities and unlisted investments. In the later
period the discrepancies are larger, and cannot be reduced solely to these two categories omitted in
Christians’s estimates. Some have origin in obvious mistakes in the tables of the Deutschen Oekonomist.
For instance, the total for 1905 was stated at 100 million Marks (almost 5 million pounds) below the
sum of the partial items, while Christians reports no issues for the second semester of 1912.35 The
causes of the remaining differences are more detailed and cannot be reviewed here.
[Figure 2 about here.]
[Figure 3 about here.]
Table 4 compares the distribution of German foreign investment by region and sector, with the
equivalent data for Britain. Broadly speaking, these figures confirm the well-known differences between
the composition of the stock of “British” and “Continental” foreign investment in 1913.36
[Table 4 about here.]
Whereas British capital was especially attracted by the ‘western offshoots’ in North America, Aus-
tralasia, and in lesser degree Latin America; German capitalists revealed a marked preference for
European applications. If anything, the latter preference might have been underestimated in the usual
stock estimates of the distribution of foreign investment on the eve of World War I. One of the most
used estimates, by Woodruff (1966), places the share of Europe in the German portfolio at 44% in
1914.37 Adding up the capital flows to Europe in my database, one gets a higher share, of almost two
thirds. Admittedly, the two sets of figures are not directly comparable, namely because the original
distribution of investments could easily be reversed after the IPO. Furthermore, stock estimates could
take into account valuation changes.38 In any case, secondary market operations and valuation changes
are particularly complex to estimate, and I see no reason to assume that the margins of error in these
estimates are smaller than in the flow data. The greater relevance of Europe is also confirmed by
another estimate of the German capital stock. In 1916 the German government ordered its citizens to
declare the amount of foreign securities they owned with a view to “boost the exchange rate and to
cover . . . the trade deficit and also the demand for raw materials after the war.”39
The results, in the last column of Table 4 are closer in magnitude to my database of flows than to
the conventional estimates of stocks.
The counterpart of the underestimation of European investments seems to be an excessive estimate35Notice that these are the years with highest discrepancies on Figure 3. Strangely, these errors have been repeated in
recent studies, such as Hoffmann (1965) and Pohl (1977).36See Feis (1930), Fishlow (1985), Maddison (1995), or Woodruff (1966).37Other estimates provide similar, albeit larger, magnitudes; e.g. Maddison (1995) ascribes 53.2% of German invest-
ment to European applications in 1914.38In fact, Woodruff (1966) remars that only private portfolio investment was evaluated at market prices in his estimates.
The larger component of government bonds was taken at its nominal value. Even so, if we follow the same approach,
and calculate the share of government securities in the flow statistics evaluated at nominal prices, we get basically the
same value: 61.7%.39Lenz and Schmidt (1924: 322).
11
for Africa and the Americas.40 British flows and stocks, on the other hand, are closer than in the case
of German estimates, except again for a possible underestimation of Europe in the stock statistics.41
Government debentures attracted more German than British investors, while the latter bought a
higher share of industrial securities.42 Nonetheless, the share of railroad and financial investments (a
part of the “developmental” concept in Fishlow 1985) is very similar in the two cases. The bulk of the
difference in the sectoral composition of investment is therefore explained by a lower share of industrial
applications and public utilities in the German portfolio. Finally, a much smaller share of German
foreign investment was directed to the colonies than was the case in Britain.43 Once more, the stock
estimates apparently overestimate the importance of German colonial investment.
We can still compare the British and German foreign investment from the point of view of its
securities composition. In agreement with the distribution by sectors, debt titles (debentures and notes)
were more predominant in German, than in British applications, with 85% and 71%, respectively. The
remaining fraction was taken by capital stock (shares).
This is a static perspective on a very irregular flow of capital, which means that a lot of information
is lost in the aggregation of Table 4. In the remaining analysis I reintroduce the time dimension, in
the context of cross-country foreign investment panel regressions.
4 Methodology and Samples
In order to explain the patterns of pre-World War I European capital investments, I will run panel
regressions of British and German annual capital flows, by country. I will also contrast the determinants
of private and government investment, and vary the geographic coverage of the sample.
4.1 Data samples
My point of departure is the sample of 33 countries used by Clemens and Williamson (2004), and
which received 92% of British capital investment, between 1870 and 1913, according to Stone’s (1999)
numbers.44 I choose this sample to benefit from the large-scale data set of explanatory variables40We can also make a guess at the possible distribution of the 5.6% assigned to “other” countries. Assume that the
essential of German investments in Africa occurred after 1880 and that, therefore, the cumulated flows are a guidance to
the stock in 1914. In that case, African investment would represent 3.8% out of the 5.6%. Adding the remaining 1.8%
to China and Japan, we get to 5% for Asia (without Turkey). These imputed shares are again closer to the flow than to
the stock estimates.41This should make us pause about Fishlow’s opinion that “Changes in the stock of assets before 1914 approximate
flows of foreign investment” (1985: 41).42This is still true using the full database of British capital flows, 1865-1914. Arguably, the omission of the flows before
1883 and in 1914 should be more relevant in the British case, which already had a liquid market for foreign investments
long before 1883 (Davis and Gallman 2001). The heyday of German capital exports only occurred after that date (Pohl
1977).43Excluding the self-governing parts of the British Empire (Canada, Australia and New Zealand), the share of British
colonial flows still stands at 23.3%, between 1883 and 1913. On the other hand, German investment in colonies of
European powers represented an extra 6% of total flows.44The countries are Argentina, Australia, Austria-Hungary, Brazil, Burma, Canada, Ceylon, Chile, China, Colom-
bia, Cuba, Denmark, Egypt, France, Greece, India, Indonesia, Italy, Japan, Mexico, New Zealand, Norway, Peru, the
Philippines, Portugal, Russia, Serbia, Spain, Sweden, Thailand, Turkey (Ottoman Empire without Egypt and European
territories), the US, and Uruguay. I left out Germany and Britain, both because they are taken here as the capital
exporting countries, and also because the cross capital flows between them were very small. German investment in
12
gathered by these authors. Because data on German capital flows is only available since 1883, I also
reduced the sampling period to 1883-1913. The same countries still absorbed 86% of German foreign
investment, in the same period. In face of this, I will use these countries as a representative sample for
both British and German patterns of investment. The time series of the two capital flows are compared
on Figure 4. I will refer to the empirical results obtained from this sample as ‘base estimates’. The
vertical grid lines stand for the starting dates of the waves of British foreign investment as identified
by Clemens and Williamson (2004). With minor dating differences, German capital exports were fairly
synchronized with British flows, and completed full swings of investment within the same dates.
[Figure 4 about here.]
A second sample adds the four main German colonies (Cameroon, Togo, Namibia, and Tanzania),
which are absent from the sample of Clemens and Williamson’s (2004) that only includes American,
British and Dutch dependencies. To take heed of Flandreau’s (2005) remark about the importance of
the non-sovereign status of European colonies and dependencies for their capacity to attract foreign
investment (a form of ‘home bias’), I also repeat my analysis with a reduced sample of 24 fully indepen-
dent countries. That is, I omit from the sample not only formal colonies, as India and the Philippines,
but also self-governing dependencies, such as Australia, Egypt or Cuba. In Figure 4 the countries
omitted represent a significant share of the base sample only in the case of British investment.
For comparison with Table 4, I present the geographical distribution of the the three samples just
mentioned on Table 5.
[Table 5 about here.]
Interestingly, the samples correspond more closely to the overall pattern of German than of British
investment abroad. In the latter case, the strongest departure from the data on cumulated flows in
Table 4 is the under-representation of Africa, especially in the samples with no German colonies. No
doubt due to data limitations, Clemens and Williamson’s (2004) sample of British capital exports has
a share of investments in Africa significantly below the population. Notwithstanding, because the same
data limitations apply to the present study, I will work with this sample.
4.2 Estimation Method
Panels of capital exports present a problem for the use of conventional methods of panel estimation.
These panels typically have significant data censoring, as capital did not flow uniformly across time,
implying that in many years no flows were recorded between a fairly large number of country pairs.45
Taking the ‘base sample’ as reference, there is left censoring in 19% of the British sample and 70%
of the German. To account for this problem, I will anchor my estimates to unobserved effects Tobit
specifications.46
Britain was only 0.05% of the total, whereas Britain invested in Germany 0.5% of its capital abroad.45In a previous version of their study, Clemens and Williamson (2002) tried addressing this question by aggregating
the time dimension into 6 multi-year periods, separated by local minima in the British capital export series, so as to
correspond to full swings of the cyclical pattern of British foreign investment. This however implied losing a considerable
amount of information on a very volatile flow.46As known, the usual OLS panels estimators are inconsistent under left-censoring. Tobit panels models are in effect
random effects specifications, even though requiring less stringent assumptions than the equivalent linear models (see
Wooldridge 2002).
13

Like Clemens and Williamson (2004), I concentrate on the pull effects on capital flows, abstracting
from possible domestic factors pushing capital abroad, such as local interest rate levels (a proxy for
relative capital abundance), domestic GDP levels, or its correlation with the business cycle in recipient
countries.47 Accordingly, I define the left-hand side variable as the share of each country in the total
capital exports from Britain and Germany in each year.
More than explaining the measured “wealth bias” of European investment abroad, I am interested
here in comparing the statistical relation between the two series of capital flows and the same set of
covariates. If we assume that British investment was indeed “developmental,” we should observe a
stronger reaction of the dependent variable, in the British sample, to measures of long-term economic
fundamentals, as opposed to variables reflecting political considerations, or short-term financial gains.
One may therefore consider this part of the paper as a test of the null that “German” investment shared
the same “developmental” characteristics. In other words, if the pattern of estimates is similar in both
samples, it is harder to conserve the alternative hypothesis that Continental investment followed more
the prospects of government-protected high revenues than long-term market-induced opportunities.
I also further specify this hypothesis, by comparing German investment in government and private
applications.48
The list of covariates is organized into three groups of variables. In the first group I include the
same indicator of initial level of wealth used by Clemens and Williamson (2004) to classify countries as
“more” or “less developed,” and also a measure of size of the recipient economies. For the base sample
and the sample of fully independent countries, I use log GDP for this purpose. Because I am not aware
of any retrospective national accounts for the main German colonies before 1950, I replace population
for GDP in the regressions using the sample extended to these countries. Year fixed effects also proxy
for the deepening of the market for international capital applications.
A second group consists of seven variables related to the long-term economic possibilities of each
country, namely, the growth rate and the qualification of the population (the latter measured by
primary schooling levels), net immigration, natural resource endowment (measured by the exports of
primary products and size of arable land), and urbanization rates. To avoid endogeneity problems, the
immigration, and schooling variables are lagged.49 The seventh variable in this group is an indicator
of the quality of formal political institutions, to control for the long-term impact of institutional
quality on the growth potential, and hence, attractiveness to capital investment.50 Recent studies have
also singled out “institutional quality” as an important determinant of modern capital flows (Alfaro,
Kalemli-Ozcan, and Volosovych 2005). I used the measure of “constraints on the executive,” as coded
in the round IV of the Polity project.
The third set of variables controls for shorter-term factors, which might affect the willingness of
European savers to commit funds to foreign applications, as well as for the distortionary impact of
policies, and other factors that distorted the flow of capital from rich to poor countries. An indicator
variable flags instances of domestic political conflict and foreign military conflict. Tariff levels at
recipient countries and the economic distance from the main capital markets are also introduced as47For a rendering of the diversification motive of British foreign investment see Goetzman and Ukhov (2005).48I cannot do the same for the British capital flows, because I only have the total flows by country of destination.49Immigration and schooling are lagged by 10 and 15 years, respectively.50For a discussion of this topic see Acemoglu, Johnson and Robinson (2005).
14
distorting forces of capital flows.51 In the first case, because high levels of protection, and associated
price distortions (namely of imported goods) may deter foreign investment (DeLong and Summers
1991, Collins and Williamson 2001, Taylor 1998). Economic distance from the main capital markets,
which were also the principal source of foreign technology and an important market for domestic
imports, would have affected negatively the prospects of receiving foreign investment.52 Furthermore,
distance is also a likely proxy for information costs in the late nineteenth century.53 The growth in
the terms of trade of the recipient countries is introduced to test for Cairncross’s (1953) hypothesis
that the complementary between capital flows and the business cycle in the lending countries was also
reflected in the evolution of terms of trade.54 A substantial debate has emerged on the relevance of the
imperial fiat for the access of capital-poor countries to European finance before World War I, namely
in connection with the British empire.55 I therefore include a dummy variable for the colonial status
of recipient countries, to test for their possibly preferential treatment relative to independent nations
in the European markets. Equally animated has been the debate on the value of the “housekeeping
seal of approval” imparted by the membership in the gold standard.56 Another indicator controls for
the adherence of the countries in the sample to this exchange rate regime during the period in study.
The final covariate used in the empirical analysis are the spreads paid by representative bonds issued
by the governments of recipient countries in London and/or Berlin over and above the contemporary
yields served by British and German long-term government debt. This measure of risk premium is in-
troduced here to test for the attraction of non-British investors for high-yield but risky applications in
government securities. These “private investment decisions, in the absence of real economic prospects,”
as Fishlow characterizes them, should reflect in a positive association between capital flows and higher
returns abroad.57 However, there is an obvious endogeneity problem with using spreads as covariates
in a regression of investment flows, as both variables should be simultaneously determined from the
interplay of supply and demand for international capital.58 As identification strategy, I propose two
alternatives: to use lagged spreads, and to instrument spreads with variables related to debtors’ credit-
worthiness, but not to the same measures of economic and policy fundamentals included as regressors
in the main equation. The list of instruments is formed by: the number of sovereign defaults of each re-
cipient country up to each year and the number of years in “good standing” in the international capital51Distance is measured, as in Clemens and Williamson (2004), by the product of geographical distance between each
country and Great Britain or Germany, and an index of transportation cost per mile. See the Data Appendix for details.52On the complementarity of capital and trade flows between main capital importers and exporters see Bairoch (1976)
and Kindleberger (1993).53And also today. In Portes and Rey (2005) study of international equity flows between 1989 and 1996, geographical
distance still proxies for some information costs.54“Normally, a rise in export prices and a favourable movement of the terms of trade made the high investment of the
boom very much easier. The profits of capitalists formed a levy at the expense of other countries . . . and were largely
saved and invested” (Cairncross 1953: 205).55For the most recent, and contrasting, installments on this question see Flandreau (2005) and Ferguson and Schularick
(2006).56Again concentrating in the recent literature see Bordo and Rockoff (1996), Flandreau and Zumer (2004), and Ferguson
and Schularick (2005).57Fishlow (1985: 54).58Clemens and Williamson (2004), although conscious of the problem, consider that bond spreads aptly capture
investment risk, which is not totally explained by economic fundamentals. Furthermore, they argue that the impact of
the latter on capital flows cannot be reduced to their relevance for creditworthiness. It is a somewhat contentious point
whether macro fundamentals determined bond spreads or not. On the positive side see Flandreau and Zumer (2004), on
the negative Ferguson and Schularick (2006), and Mauro, Sussman and Yafeh (2006) for a mixed view.
15
markets since last settlement of a default (if any).59 To obtain asymptotically efficient estimates with
instrumental variables I use the extension of Amemiya’s Generalized Least Squares (AGLS) estimator
of Newey (1987) to panel data by Vella and Verbeek (1999).
5 Empirical Results
5.1 Determinants of foreign investment
Table 6 provides descriptive statistics for the main covariates used in the regressions, as available for
the sample extended to the German colonies (the largest of the three samples). Since not all variables
have a full coverage in the sample period 1883-1913, I had to estimate unbalanced panels. Nevertheless,
almost all the data lacunae are due to the late data collection in the German colonies. Germany only
claimed colonies in the sequence of the 1884-85 Berlin conference, and continuous statistical information
is only available for most variables starting one decade later. In the remaining samples the only variable
with less than full coverage are the bond spreads. The effective samples are therefore determined by
the data on spreads.
[Table 6 about here.]
The first set of results in Table 7 compares the Tobit estimates for three variations of the independent
variable - the share of each receiving country in the total exports of British, German, and German
capital to private applications in each year.60 The first observation to make about these results regards
the LDC dummy. In the sense of Clemens and Williamson (2004), the ‘wealth bias’ of foreign investment
is only explained for Britain, for LDC countries had a share in German investment lower on average
by 3.7% all else equal.61 As will be seen later, part of this result is explained by the colonial relations
of these two European countries. Nevertheless, a question remains on what type of mechanisms may
be behind the remaining aversion of German capital to poor countries. The explanatory power of
economic fundamentals is also less strong than in Clemens and Williamson. Demographic variables
seem to have had a low to ambiguous impact on capital imports from Europe, with the exception of
net migration for British capital, and urbanization for German private applications. On the contrary,
natural resource abundance had a significant pull on foreign investment.
Terms of trade and tariffs, as proxies for real appreciation and price distortion, have the expected neg-
ative signs, although only significant in the case of German foreign investment. Somewhat strangely,
instances of conflict, domestic and foreign, didn’t affect the flow of German capital, whereas they
stimulated British financing. That foreign capital was sometimes attracted to countries in war is not
surprising, given the simultaneous sharp increase in yields (Mauro, Sussman and Yafeh 2006).62 Insti-
tutional quality, as measured by the usual index of ‘constraints on the executive’ is insignificant except59“Good standing” is defined as not being under sovereign default. For countries with no default record, this number
is set at a large value (100, and 1000).60As mentioned, unobserved Tobit panel models are effectively random effects panels.61See the discussion ahead on how to interpret Tobit coefficients and Table 11.62Just think of the Russo-Japanese War. According to data from Stone (1999), the Japanese government raised in
London just in the two years of war close to 25 million pounds, which represented 40% more than the total government
debt placed in London in the previous 33 years. A positive sign is also what was to expect under Clemens and Williamson’s
“unproductive domestic capital” hypothesis. The result here is actually stronger than in their paper.
16
for the sample of German capital, where the coefficient is significant and has the wrong sign. Colonial
status has a positive and significant effect on British capital and negative on German investment. Nev-
ertheless, this result is biased by the fact that no German colony is included in the base sample, as we
will see in the next set of results. The distance variables have the correct sign and are significant. The
same is true of the lagged spreads, particularly in the German case, a clear indication that German
capital avoided countries with high risk premiums, contrary to Fishlow’s (1985) characterization of
“revenue finance.”
[Table 7 about here.]
The results for the second sample, extended to the four main German colonies are listed on Table 8.
The first three columns are equivalent to the Tobit estimates on Table 7, except for using population
as scale variable, instead of log GDP.63 The qualitative pattern of estimates is similar to Table 7, and
the size of coefficients on fundamentals changed in a way consistent with the known characteristics of
the new colonies added to the sample. Urbanization and lagged schooling have a lower coefficient on
German investment and higher on British capital exports, because German African colonies scored lower
on those factors. Interestingly, the negative coefficient on overall colonial affiliation in the regression
for German foreign investment is actually a figment of a composite effect, as shown in the last three
regressions of the Table. British and German investment alike were drawn by political affiliation (own
colonies), whereas colonies of foreign powers received a lower share in the capital exports of these
countries cœteris paribus. This result speaks to the long literature on “Empire effects” in the pre-1914
world capital market. German ‘wealth bias’, although still present, has a lower coefficient than in the
base sample, correcting for the omission of German investment in these poor countries in the first set
of results.
[Table 8 about here.]
To test the second identification strategy, I repeated the last set of regressions instrumenting sovereign
spreads with the two measures of the history of sovereign default, as mentioned before. Results are in
Table 9.
[Table 9 about here.]
The quality of this instrumental variables procedure is summarized by the statistics in the last two
rows - the F statistic of the first-stage regression, and the statistic of Sargan’s overidentification test.
In particular, there doesn’t seem to be a problem of weak instruments. As for the second stage, other
than minor variations in the size and significance of some coefficients, the qualitative nature of the
results on Table 8 carries through.
To control for the element of “political geography,” which at least partly drove the wave of financial
integration during the Belle Epoque (Flandreau 2005), I finally revert to the estimations based on
a sample exclusively composed of fully independent countries. Table 10 lists the results. A first
interesting result in this sample is that political conflict no longer shows up as significant in explaining
British capital exports, which may imply that some of the previous positive relation was driven by
formal political ties. There is also to notice the reduction in the significance of economic distance for63The estimates of the Tobit model for the base sample are very similar using both measures of scale.
17
the direction of investment, especially from Germany. Other than that, the broad pattern of results
carries through from the previous tables. If anything, the negative relation of capital calls to sovereign
spreads is now stronger, but only for the German flows, while this variable becomes insignificant in the
British regression. Such result reinforces, yet again, the point that German investors were also able to
distinguish between high yields and high risk. Once more, gold standard affiliation comes across as an
important determinant of the direction of foreign investment.
[Table 10 about here.]
The results presented here extend a small literature on the determinants of international capital flows
from the 1970s on. Many of the qualitative results in this literature are confirmed by my empirical
analysis. For instance, Edwards (1991) verifies that openness is an important determinant of FDI to
developing countries, whereas Portes and Rey (2005) show that the geography of information (diffusion
and asymmetry) is the main determinant of international equity flows. There are also constrasting
results. While the quality of political institutions has at best a weak influence in my estimates, Alfaro,
Kalemli-Ozcan and Volosovych (2005) find institutional quality to be a causal determinant of foreign
capital flows. Two possible reasons come to mind to explain this contrast. One is the difference
definition of the quality of institutions. Alfaro, Kalemli-Ozcan and Volosovych (2005) use a composite
political safety index, instead of the measure of constraints on the executive used in this study. Likewise,
more than just the formal design of institutions is at stake. In the study of FDI in the 1990s by Wei
and Wu (2002), the level of corruption in recipient countries reduces their access to foreign capital.
The second, and related reason, has to do with the presence of colonial dependencies in my sample.
Because these territories had no sovereignty, the quality of their political institutions would not matter
as much for the safety of the capital of European investors, as in the case of independent nations.
5.2 Further discussion
Because Tobits are nonlinear, the size of the estimated coefficients is not directly interpretable in
terms of the dependent variable. Tables 11 and 12 provide the marginal effects of a unit change in
each independent variable on the expected value of the dependent variable (when censured) and the
probability of non-censoring, respectively. This alternative normalization is based on the estimates for
the base sample (Table 7).
[Table 11 about here.]
[Table 12 about here.]
Units of measurement vary considerably between variables, which makes harder to gauge which
variables were quantitatively more relevant. For that reason, a standardized version of the coefficients
is also provided in the Tables, which can be interpreted as the marginal impact of a one standard
deviation of each independent variable, measured in standard deviations of the expected value of
capital flows and in probability units. For instance, an increase in one percentage point in sovereign
spreads reduced, on average, a country’s share of German capital exports by 0.6 percentage points.
Alternatively, a rise in one standard deviation of spreads reduced the fraction of German capital exports
received by a country by 0.2 standard deviations of the latter. Using this standardization, we can detect
18
some differences in the hierarchy of determinants of British and German capital exports. In the British
case, natural resources, economic distance, and monetary affiliation were the more important factors
influencing investment abroad.64 Although also among the top determinants of German investment,
these factors were superseded by constraints on the executive, for total German, or colonial status, for
private German investment. Furthermore, the most effective influence on German capital flows came
from yield spreads. This confirms, once more, that German investment was not predominantly driven
by a model of “revenue finance.”
Nevertheless, one may still argue that a pattern of “revenue finance” probably drove German appli-
cations in foreign governments’ bonds, which, counting the substantial share of government-guaranteed
railroad securities, certainly represented more than 50% of total capital exports. That is not, however,
what emerges from repeating the estimation with German capital applied in government securities
only.65 On the contrary, the qualitative nature of the estimates is similar to that for private applica-
tions.
Keeping with the alleged political nature of continental European investment, an alternative hypoth-
esis could be that the above results do not control for political pressure from European governments
over the banking sector and capital markets in order to favor the placement of securities of nations
diplomatically close, and to discourage investment in unfriendly or rival countries. This is a complex
hypothesis to test, and it should be noticed that is applies to both countries, Britain and Germany,
even if “pound diplomacy” was led with greater subtlety than the sometimes truculent pronouncements
from no. 76 of the Whilhelmstraße. Furthermore, as shown by Barth (1995), the degree of government
intervention in German foreign investment and its real impact on private decisions have been greatly
exaggerated in the conventional literature. As an imperfect attempt to control for this possibility, I
ran again the regressions excluding the most obvious cases of official support to closer economic ties
- the Austro-Hungarian, Ottoman, and Chinese empires - as well as the most remarkable attempt of
political intervention against investments abroad: Russia.66 The results, which I do not report here,
do not alter significantly the picture above, and that reinforces my line of interpretation.67 The fact
that these were also among the largest beneficiaries of German capital exports shows as well that the
empirical results are robust to the exclusion of more ‘influential’ observations.68
The empirical results include year fixed effects to control for the overall trend of deepening and
integration of international capital markets. To use less of a ‘black-box’ approach, I also checked the64Clemens and Williamson (2004) came to a different ordering of effects, dominated by natural resource endowment and
demographic characteristics of the population. The differences in results between my estimates and these authors’ may
come from a variety of sources, viz., different sampling periods, the inclusion of extra covariates, and the use of a different
database of sovereign spreads, which implied a different set of countries. As kindly confirmed by the authors, they used the
data series available from the Global Financial Database. However, this source has no information for government yields
of Burma, the Dutch East Indies (approximately equivalent to present-day Indonesia), and the Philippines pre-1914.
Consequently, the authors’ regressions do not, in practice, include these three countries.65Estimation results are not reported here.66Although a close partner of German foreign policy during most of the Bismarckian consulate, Russia quickly evolved
into a foe, especially after the Franco-Russian Entente. The German government accordingly tried to create obstacles to
the flotation and trade of Russian securities. In 1887 the Reichsbank forbade all German banks from accepting Russian
securities as collateral for loans (Lombardverbot), thereby affecting their liquidity.67The only remarkable difference is a reduction in the size of the coefficients on population size and qualification, which
is not surprising, as I am excluding from the sample four of the largest countries by population.68The average share of these countries in German capital exports was 46.5%.
19

robustness of the results to the breakdown of the sample by the shorter periods identified in Clemens
and Williamson (2004). Even though results are indeed robust to the breakdown, one finds some
predictable trends in the size of the coefficients. In the case of German capital exports, there is an
attenuation of the importance of political (disturbances, and constraints on the executive) variables, and
of economic distance. The participation in the gold standard is also increasingly less of an advantage,
as the system spread out geographically until 1913. The colonial affiliation, on the other hand, is the
only variable with a rising (negative) coefficient. Nevertheless, when disaggregated between ‘own’ and
‘foreign’ colonies, this tendency is actually originated by a simultaneous decrease (albeit interrupted
in some periods) in the size of the positive coefficient on German colonies and the negative coefficient
on colonies of other powers. The negative impact of spreads does not exhibit a monotonous tendency.
Instead, it grew in size until 1901 (or 1906 for German private investment) and fell thereafter. One
can see here the effect of market memory after the wave of defaults in the 1890s slowly reducing its
influence on capital flows. Some of the British coefficients also have a tendency. Abundance of natural
resources and the level of schooling have an increasing purchase, whereas the colonial status, contrary
to Germany, mattered less through time.
I also repeated the estimations calculating sovereign spreads with relation to German, instead of
British consols, and excluding the three countries for which I had to use lower quality information on
spreads: Burma, Indonesia, and the Philippines.69 Finally, I checked whether the exclusion of the FDI
component in German capital flows (absent from British data) changed the estimation outcome. In all
cases the gist of the results and the order of magnitude of the coefficients do not depart significantly
from the results reported above.
6 Conclusion
This paper has provided new evidence bearing on the question of what factors matter most for at-
tracting (or diverting) international capital from emerging economies in a period of increasing financial
integration. It also offers the first proper test of the long-held beliefs about the different nature of
British and non-British foreign investment, culminating in Albert Fishlow’s (1985) influential piece on
the lessons to be drawn from the past history of global capital markets. The main result of this paper
was to show that German capital flows (both to government and private applications), reacted to long-
term prospects of growth of recipient countries (“fundamentals”) as much as British investment did in
the same period. The identity of the lender mattered not because the “degree of politicization and the
consequent direction of foreign investment differed with its national origin,” but because the hierarchy
of pull factors differed between German and British flows.70 Using standardized coefficients, one finds
that natural resources mattered more than demographic variables to attract European investment.
Next to them, monetary stability also played a prominent role and, in the German case, the quality
of domestic political institutions and the colonial affiliation of recipient countries. The latter result
underscores the conclusion, also reached in studies of contemporary capital flows, that the long-run
economic potential (even when measured by ‘third factors’) is not enough to attract foreign capital, in
the absence of supportive political and economic institutions.69See the Data Appendix for details.70Fishlow (1985: 40).
20
A somewhat surprising result, in the face of recent literature on the “thin film of gold” is the strong
and significant impact of the participation in a stable monetary regime for the attraction of foreign
finance. Other studies have generally concluded that the simple adherence to formal exchange rate
rules did not matter significantly for the markets’ assessment of individual country risk, as measured
by yield spreads (Flandreau and Zumer 2004, Ferguson and Schularick 2005). In a period of overall
reduction of spreads (Mauro, Sussman and Yafeh 2002), the gold standard hardly imparts a “good
housekeeping seal of approval.” However, even if its magnitude decreased over time, as the system
expanded to more countries, membership in the gold standard always affected quantities if not prices.
In reality, these two facts are not contradictory. In a model of international lending with moral hazard
and endogenous risk of default (i.e. dependent on the interest rate), it can be shown that the optimal
strategy of lenders is to distinguish between borrowers by rationing credit, and not by charging a risk
premium (Robinson 1998). Moreover, in an increasingly integrated market, competition among lenders
drove the interest rate to the opportunity cost of funds, hence the overall convergence of spreads.
As yields converged, they still had the expected negative impact on capital imports, especially in the
more “revenue” German finance. It is hardly counter-intuitive to posit that German investors were as
cognisant of the yield-risk trade-off as their British counterparts, and that German capital markets and
German banks tried to compete with their British competitors in placing the most promising issues
of neighboring and exotic securities. In my opinion, the sharp distinction in the literature between
“developmental” and “revenue” finances is due to the want of detailed data on capital flows. In the
absence of this data, authors are led to conclude too much from aggregate stock measures available for
a few dates (often just one). In this limited information set, “European” investments automatically
become “unproductive,” whereas South American or Australasian applications are necessarily “devel-
opmental.” Likewise, even making allowance for government-guaranteed railways, the larger share of
government securities in the French and German portfolio is a sign of the more “speculative” pattern
of foreign investment by these countries. My empirical evidence, on the contrary, shows that Euro-
pean investors (not only “British”) did also see through the veil of the types of securities and formal
borrowers. After all, long-term prospects of growth mattered as much to the decision of financing a
Japanese war, or a Russian strategic railroad, as for the electrification of a South American city or
the build-up of an Australian mine. Over the long run, only buoyant economies avoided impecunious
governments. Moreover, as Gerschenkron (1962) famously demonstrated, government intermediation
in the international capital markets could very well replace for a weak domestic financial structure in
channeling foreign funds to growth-promoting initiatives. To acknowledge this moves us one step ahead
of Fishlow’s own caveat that “The fact that capital flows were channeled from particular countries for
overt political advantage does not necessarily imply that the flows lacked economic basis.”71
Having gained a broader perspective by enlarging the available database, one would like to extend
this exercise even more to strengthen the analysis. This suggests two obvious avenues for further
research. In the first place, the empirical model can be adapted to include not only pull factors, but
also variables reflecting the business cycle or the relative abundance of capital in the capital-exporting
countries. The latter have often proved a significant capacity in explaining the timing and size of
foreign investment in emerging economies (Calvo, Leiderman and Reinhart 1996; Taylor and Sarno
1997). Such extension would be a natural addition to my study of the foreign determinants of the71Fishlow (1985: 62).
21
share of individual borrowing countries in international capital flows. It would also connect with the
debate on the crowding-out of domestic investment by capital exports, which has survived from the
contemporary debates to the writings of economic historians.
Expanding the database further would constitute a second natural addition to this study. By com-
piling a comparable panel of French foreign investment, one would increase the coverage of long-term
gross capital movements from over three quarters to close to the total. More importantly, adding the
second largest capital market of the time would dispense us with the need to use the uncertain labels of
“British” and “German” investment (given the substantial integration of these markets). It would also
provide a check of the estimated distribution of capital calls among financial centers, as the British,
French, and German markets virtually monopolized the issue of foreign securities until 1914.
7 Data Appendix
7.1 Base sample
7.1.1 Political conflict
This variable is defined to include instances of foreign or domestic conflict, as long as affecting the
national territory and economy in a significant way, either because fought within the national borders, or
because representing a major commitment of resources. For instance, I excluded the Spanish-American
war from the US variable, as well as most of British and French colonial conflicts, but included the
Russo-Japanese war for Japan, although fought away from the Japanese islands. Main data sources
are Kohn (1986) and the inter-, extra- and intra-state wars datasets (v3.0) from Sarkees (2000) and
available at http://www.correlatesofwar.org
7.1.2 Quality of political institutions
I followed the practice in many growth studies of using the measure of “constraints on the executive”
for independent nations, from the round IV of the Polity Project. The source file is available at
http://www.cidcm.umd.edu/inscr/polity/polreg.htm. This variable is coded as a discrete index varying
from 1 (‘unlimited authority’ of the executive) to 7, corresponding to ‘executive parity or subordination’
to other sovereign powers, namely, the legislature. I attributed to the colonies the same coding of their
respective colonial powers, under the assumption that European investors would expect the same level
of institutional protection of the colonial power in its colonies. This is consistent with Flandreau’s
(2005) argument on the extension of the legal environment to the colonies.
7.1.3 Economic distance
I followed the procedure of Clemens and Williamson (2004) in coding this variable as the product
of a measure of geographic distance and an index of cost of shipping between the pairs of lending
and borrowing countries. For most countries geographical distance was taken as pre-Panama canal
distances between the main ports of each recipient country and London or Hamburg, as listed in Philip
(1914). The exceptions were Austria-Hungary and Serbia with respect to Germany; the first because
it had a large border with the German Empire, and the second because it was land-locked. For these
two pairs of countries I used instead the length of railroad connections between Berlin and Vienna and
22
Berlin and Belgrade. All lengths were converted to nautical miles (1.682 Km per mile). The sources
for the index of freight also vary with these two sets of countries. For the majority of nations I used
the index of tramp shipping freight charges from Isserlis (1938: 122), with base year 1869 = 100. For
the cases of Austria-Hungary and Serbia with respect to Germany, I used instead Fremdling’s (1980)
index of freight costs in the Prussian railroads. The original series is in Pfennige per ton-kilometer and
I converted it to an index number with the same value as Isserlis’s for 1880.
7.1.4 Spreads
This variable is defined as the difference between the yield of a representative long-term government
bond of each recipient country and the corresponding yield on British consols and Prussian or German
loans. The spreads for almost all countries were compiled by Ferguson and Schularick (2006), based
on the prices of sovereign bonds traded in London. French yields come from Flandreau and Zumer
(2004). The information for Denmark was taken from the relevant file of the Global Financial Data
database available at http://globalfinancialdata.com. Cuban yields were collected from the abstract of
“Highest and Lowest Prices of Securities that are traded in the London Stock Exchange,” an annex to
the Neumann’s Kurs-Tabellen der Berliner Fonds-Borse. The coverage of this series is uneven, as some
countries only started issuing sovereign debt (or the colonial equivalents) after 1883, or did not have
a liquid market for their debt in Europe during certain periods. Information was missing entirely for
three colonial dependencies: Burma, Indonesia, and the Philippines. To keep these three countries in
the sample, which represented an average of 0.6% of British and 0.1% of German foreign investment,
I attributed them a virtual spread equal to the spread of their colonial power, added to the spread of
Singhalese bonds. I chose Ceylon as the closest Asian “non-settlement” colony of an European power.
7.1.5 Other covariates
The definition and sources for all the remaining covariates can be found in the documental appendix
to Clemens and Williamson (2002). This set includes the following variables: the indicator of low
development countries, log GDP, population, schooling levels, net migration, share of
primary products exports, arable land, urbanization rates, lagged terms-of-trade, tariff
levels, and the indicators for colonial status and membership in the gold standard.
7.1.6 Instrumental variables
The number of previous defaults and the time in “good standing” were coded from the database
of sovereign defaults compiled by Suter (1990).
7.2 German colonies
In this part I list the sources of the relevant covariates for the four main German colonies: Cameroon,
Namibia, Tanzania, and Togo.
7.2.1 First group of variables
All four countries were coded as “low developed” in the full sample, according to the assumption
that their per capita GDP did not exceed the 2000 1990-equivalent US dollars criterium proposed by
23
Clemens and Williamson (2004), throughout the sample period. Because there are no retrospective
national accounts for these countries before 1950, I used instead population as scale measure. Data
on colonial population is available, since 1903, from the Statistischen Jahrbuch fur das Deutsche Reich.
For 1913, I also used the more detailed data in Reichs-Kolonialamt (1914). For the years before 1903,
I assumed that the population had been about the same as in 1903.
7.2.2 Second group of variables
Primary schooling levels are defined as the ratio of primary school enrollment to the size of the
cohort aged 14 or less. Information on the latter in 1913 is available from Reichs-Kolonialamt (1914). I
assumed that this ratio applied to the previous years as well. Primary enrollment levels in the colonies
are only available for 1911, 1913 and 1914, from Gann and Duignan (1977), Reichs-Kolonialamt (1914),
and the 1915 edition of the Statistischen Jahrbuch, respectively. I used exponential extrapolation to
extend the tendency implicit in the data to the previous years. In doing so, I also assumed an initial
school enrollment of ten pupils in the first year of German possession of each territory. For lack of more
detailed data, Clemens and Williamson’s (2004) coded the net migration variable as an index ranging
from -3 (strong net emigration) to +3 (strong net immigration). It is well known that the German
colonies only attracted a minimal flow of European immigrants, (Schinzinger 1984). For instance, in
1913, the “non-indigenous” only represented 0.4% of the total colonial population, according to Reichs-
Kolonialamt (1914). I therefore coded this variable as zero for the four colonies in the whole period. The
share of primary product exports was calculated from the annual disaggregation of colonial trade in
the Statistischen Jahrbuch. The main source for the composition of foreign trade of the German colonies
is again the Statistisches Jahrbuch fur das Deutsche Reich. The surface of arable land was established
by multiplying the land area of each colony by the fractions of arable land mentioned in the 2006 edition
of the CIA World Factbook, available at https://www.cia.gov/cia/publications/factbook/index.html.
Total land area was taken from Reichs-Kolonialamt (1914). The only territorial change in my sample
period involved Cameroon, which increased in size by 250 thousand square Kilometers after a colonial
settlement with France in 1911. The urbanization rates, measured as the fraction of population
living in cities with 100,000 or more inhabitants, was set to zero for all colonies. On the eve of World
War I, the two largest urban agglomerations in German African colonies, Douala and Dar-es-Salam,
had a population of just over 22,000. The terms-of-trade of German colonies were calculated as
the ratio between the average price of exports and imports of these territories. The average prices
were obtained by dividing the monetary value of trade flows by their weight (in hundredweights). The
information came from the Statistisches Jahrbuch fur das Deutsche Reich and is only available for
colonial trade with the German customs union. In 1910, the German share of the colonial trade stood
at 52%, soaring to 71% in 1913.
7.2.3 Third group and instrumental variables
The sources of political conflict incidents are the same quoted above. Tariff levels were calculated
by dividing the customs revenue by the value of imports of German colonies. Both series are available
from the Statistischen Jahrbuch fur das Deutsche Reich. I used the same procedure to calculate the
economic distance of the German colonies to Hamburg or London, as described above. However,
24

because Philip (1914) does not quote the distances to the main ports of the German colonies (Dar-
es-Salam, Swakopmund, Douala, and Lome), I used instead the distances between ports listed in
National Imagery and Mapping Agency (2001). I considered that all colonies were not under the gold
standard. Because the German government only started issuing debt earmarked to specific colonies
in the later part of my sample, I used the yields on three colonial government loans for all German
colonies. I doubt much information is lost with this simplification, because markets were probably not
yet rating colonies differently, as the market for colonial securities was still in its infancy. The bonds
used were: the 5% German East African Customs Bonds of 1891 (until 1903), the 3 12% German East
African bonds of 1903 (1904-1908), and the 4% German Colonial Loan of 1908, earmarked for German
East Africa, Togo, and Cameroon, for the remaining years. All loans were long-run, with maturities
above 30 years, and were traded in Berlin. Market prices and details of these bonds came from the
Saling’s Borsen-Papiere and the Neumann’s Kurs-Tabellen. Again for lack of GDP data, I replaced
the correlation between the GDP of pairs of countries with the correlation between exports.
25
References
Acemoglu, Daron, Simon Johson and James Robinson (2005), “Institutions as a Fundamental Cause of
Long-Run Growth,” in Philippe Aghion and Steven N, Durlauf, eds., Handbook of Economic Growth,
Vol. 1A, Amsterdam: North Holland, pp. 385-472.
Alfaro, Laura, Sebnem Kalemli-Ozcan, and Vadym Volosovych (2005), “Capital Flows in a Globalized
World: The Role of Policies and Institutions,”NBER Working Paper no. 11696.
ANPFVE - Association Nationale des Porteurs Francais de Valeurs Etrangeres (1900), Rapport Annuel.
Exercise 1899-1900, Paris.
Bagehot, Walter (1931), Lombard street; a description of the money market, London: Murray.
Bairoch, Paul (1976), Commerce exterieur et developpement economique de l’Europe au XIXe siecle, Paris:
Mouton.
Bankenquete (1910), Materialen zur Frage des Depositenwesens (Punkt VI des Fragebogens), Berlin: Re-
ichsdruckerei.
Barth, Boris (1995), Die deutsche Hochfinanz und die Imperialismen. Banken und Außenpolitik vor 1914,
Stuttgart: Franz Steiner.
Bloomfield, Arthur (1963), Short-Term Capital Movements Under the Pre-1914 Gold Standard, Princeton:
Princeton Studies in International Finance no. 11.
Bordo, M., Barry Eichengreen and D. Irwin (2000), “Is Globalization Today Really Different Than Glob-
alization a Hundred Years Ago? Part II: Financial Integration,” Wirtschaftspolitische-Blatter, 47(2):
121-29.
Bordo, M. and Hugh Rockoff (1996), “The Gold Standard as a “Good Housekeeping Seal of Approval”,”
Journal of Economic History, 56 (2): 389-428.
Borsen-Enquete Kommission (1893), Bericht der Borsen-Enquete-Kommission, Berlin: Reichsdruckerei.
Cairncross, A. K. (1953), Home and Foreign Investment 1870-1913. Studies in Capital Accumulation,
Cambridge: Cambridge University Press.
Calvo, G. (1998), “Capital Flows and Capital-Market Crises: The Simple Economics of Sudden Stops,”
Journal of Applied Economics, 1(1): 35-54.
Calvo, G., Leonardo Leiderman and Carmen Reinhart (1996), “Inflows of Capital to Developing Countries
in the 1990s,” Journal of Economic Perspectives, 10: 123139.
Cameron, Rondo (1967), Banking in the early stages of industrialization; a study in comparative economic
history, Oxford: Oxford University Press.
Clarke, Hyde (1878), “On the Debts of Sovereign and Quasi-Sovereign States, Owing by Foreign Countries,”
Journal of the Statistical Society, XLI: 299-347.
Clemens, Michael A. and Jeffrey G. Williamson (2002), “Wealth Bias in the First Global Capital Market
Boom, 1870-1913,” Mimeo.
Clemens, Michael A. and Jeffrey G. Williamson (2004), “Wealth Bias in the First Global Capital Market
Boom, 1870-1913,” Economic Journal, 114: 304-37.
Collins, W. J. and J. Williamson (2001), “Capital Good Prices and Investment, 1870-1950,” Journal of
Economic History, 61 (2): 59-94.
Davis, Lance and Robert Gallman (2001), Evolving Financial Market and International Capital Flows.
Britain, the Americas, and Australia, 1865-1914, Cambridge: Cambridge University Press.
26

Davis, Lance and Robert Huttenback (1986), Mammon and the Pursuit of Empire. The Political Economy
of British Imperialism, 1860-1912, Cambridge: Cambridge University Press.
DeLong, J. B. and L. Summers (1991), “Equipment Investment and Economic Growth,”Quarterly Journal
of Economics, 106: 445-502.
Eberstadt, Rudolph (1901), Der deutsche Kapitalmarkt, Leipzig: Duncker & Humblot.
Edelstein, Michael (1982), Overseas investment in the age of high imperialism : the United Kingdom,
1850-1914, New York: Columbia University Press.
Edison, Hali J., Ross Levine, Luca Ricci and Torsten Sløk (2002), “International Financial Integration
and Economic Growth,” Journal of International Money and Finance, 21(6): 749-76.
Edwards, Sebastian (1991), “Capital Flows, Foreign Direct Investment, and Debt-Equity Swaps in De-
veloping Countries,” in Horst Siebert, ed., Capital Flows in the World Economy, Tubingen: J.C.B.
Mohr.
Eichengreen, Barry (2003), Capital Flows and Crises, Cambridge, Mass: MIT Press.
Esteves, Rui Pedro (2006), “Quis custodiet quem? Sovereign Debt and Bondholders’ Protection Before
1914,” Mimeo.
Feis, Herbert (1930), Europe, the World’s Banker, 1870-1914. An account of European foreign investment
and the connection of world finance with diplomacy before the War, New Haven: Council on Foreign
Relations.
Ferguson, Niall and Moritz Schularick (2005), ““The Thin Film of Gold”: The Limits of Monetary Com-
mitment in the First Era of Globalization,” Mimeo.
Ferguson, Niall and Moritz Schularick (2006), “The Empire Effect: The Determinants of Country Risk in
the First Age of Globalization, 1880-1913,” Journal of Economic History, 66(2): 283-312.
Fishlow, Albert (1985), “Lessons From the Past: Capital Markets During the 19th Century and the
Interwar Period”, International Organization, 39: 38-93.
Flandreau, Marc (2005), “‘Home Biases’, 19th Century Style,” CEPR Discussion Papers Series no. 5398.
Flandreau, Marc and Francois Gallice (2005), “Paris, London and the International Money Market:
Lessons from Paribas 1885-1913” in Y. Cassis and E. Bussiere, London and Paris as International
Financial Centres in the Twentieth Century, Oxford: Oxford University Press: 78-106.
Flandreau, Marc and Zumer, F. (2004), The making of global finance, 1880-1913, Paris: OECD - Devel-
opment Centre’s monographs.
Fremdling, Rainer (1980), “Freight rates and State budget: the role of the National Prussian Railways
1880-1913,” Journal of European Economic History, 9 (1): 21-39.
Furtado, Celso (1974), O mito do desenvolvimento economico, Rio de Janeiro: Terra e Paz.
Gann, L. H. and Peter Duignan (1977), The German Rulers of German Africa 1884-1914, Stanford:
Stanford University Press.
Gerschenkron, Alexander (1962), Economic Backwardness in Historical Perspective, Cambridge: Harvard
University Press.
Goetzman, William and Andrey Ukhov (2005), “British Investment Overseas 1870-1913: A Modern Port-
folio Theory Approach,” NBER Working Paper no. 11266.
Hellmann, Julius, ed. (1914), Von der Heydt’s Kolonial-Handbuch. Jahrbuch der deutschen Kolonial- und
Ubersee-Unternehmungen, Berlin: Verlag fur Borsen- und Finanzliteratur, 8th. ed.
27
Hilferding, Rudolf (1910), Das Finanzkapital. Eine Studie uber die jungste Entwicklung des Kapitalismus,
Vienna: Brand.
Hobson, J. (1902), Imperialism, a Study, New York: J. Pott & Company.
Hoffmann, Walther (1965), Das Wachstum der deutschen Wirtschaft seit der Mitte des 19. Jahrhunderts,
Berlin: Springer-Verlag.
Isserlis, L. (1938), “Tramp Shipping Cargoes, and Freights,” Journal of the Royal Statistical Society, 101
(1): 53-146.
Jeanne, Olivier and Jeromin Zettelmeyer (2006), “Is Sovereign Debt a Good Thing?,” paper presented at
the meeting of the ASSA, Boston, 6-8 January.
Jenks, L. H. (1927), The Migration of British Capital to 1875, New York: Alfred A. Knopf.
Jones, Matthew T. and Maurice Obstfeld (2001), “Saving, Investment, and Gold: A Reassessment of
Historical Current Account Data” in Guillermo A. Calvo et al. (eds.), Money, Capital Mobility, and
Trade. Essays in Honor of Robert Mundell, Cambridge, MA: MIT Press: 303-63.
Kindleberger, Charles (1993), A Financial History of Western Europe, 2nd ed, Oxford: Oxford University
Press.
Kohn, George C. (1986), Dictionary of Wars, New York: Facts on File Publications.
Landsburgh, A. (1909), “Deutsches Kapital im Auslande,” Die Bank, II: 819-33.
Lavington, Frederick (1921), The British Capital Market, London: Methuen & Co.
Lenin, V. I. (1996), Imperialism: The Highest Stage of Capitalism, London: Pluto Press (1. ed, 1917).
Lenz, Friedrich and Eberhard Schmidt, eds. (1924), Die deutschen Vergeltungsmaßnahmen im Wirtschaft-
skrieg, Bonn.
Lucas, R. (1990), “Why Doesn’t Capital Flow from Rich to Poor Countries?,” American Economic Review,
80(2): 93-96.
Luxemburg, Rosa (1913), Die Akkumulation des Kapitals. Ein Beitrag zur okonomischen Erklarung des
Imperialismus, Berlin: Buchhandlung Vorwarts Paul Singer.
Lysis (1908), Contre l’Oligarchie financiere en France, Paris: Bureaux de “La Revue.”
Maddison, A. (1995), Monitoring the World Economy 1820-1992, Paris: OECD Development Centre.
Marx, Martin (1913), Die Emissionsstatistik in Deutschland und einigen auslandischen Staaten, Altenburg:
Pierersche Hofbuchdruckerei Stephan Geibel
Mauro, Paolo, Nathan Sussman and Yishay Yafeh (2002), “Emerging Market Spreads: Then Versus Now”,
Quarterly Journal of Economics, 117: 695-733.
Mauro, Paolo, Nathan Sussman and Yishay Yafeh (2006), Emerging Markets and Financial Globalization:
Sovereign Bond Spreads in 1870-1913 and Today, Oxford: Oxford University Press.
Muller, Johannes (1988), Der deutsche Rentenmarkt vor dem Ersten Weltkrieg, eine Indexanalyse, Frank-
furt/Main: Knapp.
National Imagery and Mapping Agency (2001), Pub. 151. Distances Between Ports, Washington: Gov-
ernment Printing Office, 11th edition. Also available at http://pollux.nss.nima.mil/pubs/
Neumann’s Kurs-Tabellen der Berliner Fonds-Borse, Berlin: Verlag fur Borsen- und Finanzliteratur (sev-
eral years).
Newey, W. K. (1987), “Efficient Estimation of Limited Dependent Variable Models with Endogenous
Explanatory Variables,” Journal of Econometrics, 36: 231-250.
Obstfeld, Maurice (1998), “The Global Capital Market,” Journal of Economic Perspectives, 12(4): 9-30.
28
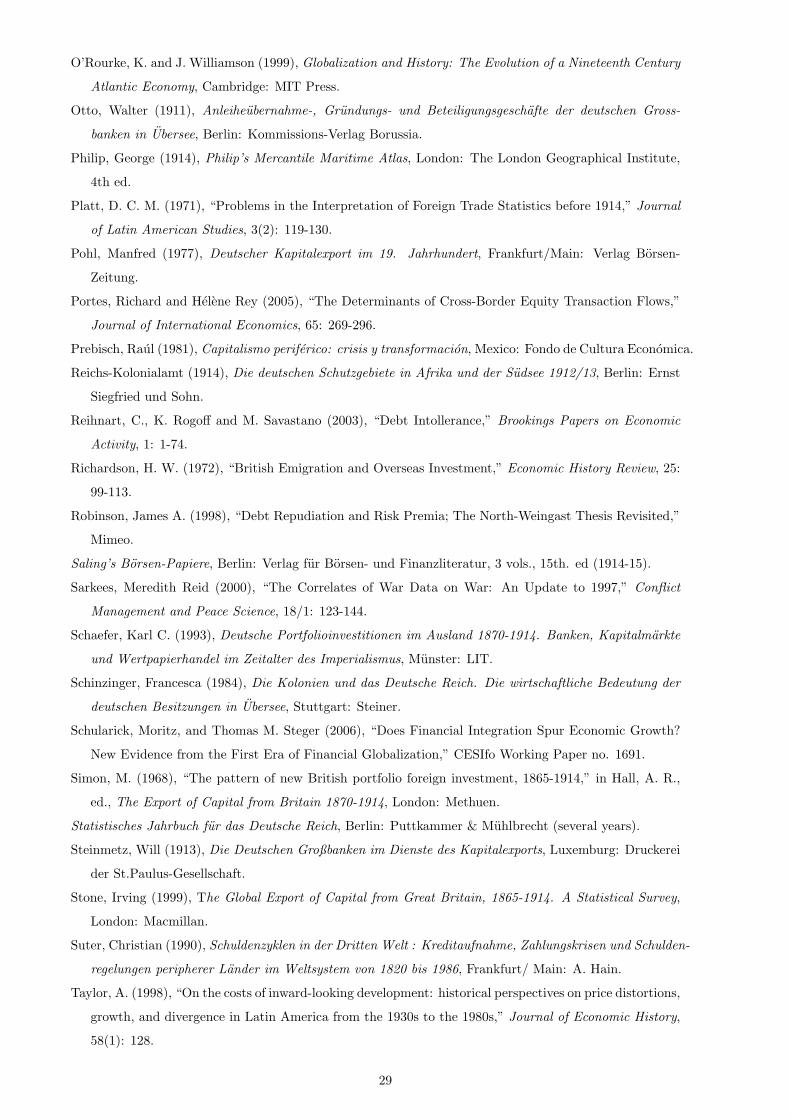
O’Rourke, K. and J. Williamson (1999), Globalization and History: The Evolution of a Nineteenth Century
Atlantic Economy, Cambridge: MIT Press.
Otto, Walter (1911), Anleiheubernahme-, Grundungs- und Beteiligungsgeschafte der deutschen Gross-
banken in Ubersee, Berlin: Kommissions-Verlag Borussia.
Philip, George (1914), Philip’s Mercantile Maritime Atlas, London: The London Geographical Institute,
4th ed.
Platt, D. C. M. (1971), “Problems in the Interpretation of Foreign Trade Statistics before 1914,” Journal
of Latin American Studies, 3(2): 119-130.
Pohl, Manfred (1977), Deutscher Kapitalexport im 19. Jahrhundert, Frankfurt/Main: Verlag Borsen-
Zeitung.
Portes, Richard and Helene Rey (2005), “The Determinants of Cross-Border Equity Transaction Flows,”
Journal of International Economics, 65: 269-296.
Prebisch, Raul (1981), Capitalismo periferico: crisis y transformacion, Mexico: Fondo de Cultura Economica.
Reichs-Kolonialamt (1914), Die deutschen Schutzgebiete in Afrika und der Sudsee 1912/13, Berlin: Ernst
Siegfried und Sohn.
Reihnart, C., K. Rogoff and M. Savastano (2003), “Debt Intollerance,” Brookings Papers on Economic
Activity, 1: 1-74.
Richardson, H. W. (1972), “British Emigration and Overseas Investment,” Economic History Review, 25:
99-113.
Robinson, James A. (1998), “Debt Repudiation and Risk Premia; The North-Weingast Thesis Revisited,”
Mimeo.
Saling’s Borsen-Papiere, Berlin: Verlag fur Borsen- und Finanzliteratur, 3 vols., 15th. ed (1914-15).
Sarkees, Meredith Reid (2000), “The Correlates of War Data on War: An Update to 1997,” Conflict
Management and Peace Science, 18/1: 123-144.
Schaefer, Karl C. (1993), Deutsche Portfolioinvestitionen im Ausland 1870-1914. Banken, Kapitalmarkte
und Wertpapierhandel im Zeitalter des Imperialismus, Munster: LIT.
Schinzinger, Francesca (1984), Die Kolonien und das Deutsche Reich. Die wirtschaftliche Bedeutung der
deutschen Besitzungen in Ubersee, Stuttgart: Steiner.
Schularick, Moritz, and Thomas M. Steger (2006), “Does Financial Integration Spur Economic Growth?
New Evidence from the First Era of Financial Globalization,” CESIfo Working Paper no. 1691.
Simon, M. (1968), “The pattern of new British portfolio foreign investment, 1865-1914,” in Hall, A. R.,
ed., The Export of Capital from Britain 1870-1914, London: Methuen.
Statistisches Jahrbuch fur das Deutsche Reich, Berlin: Puttkammer & Muhlbrecht (several years).
Steinmetz, Will (1913), Die Deutschen Großbanken im Dienste des Kapitalexports, Luxemburg: Druckerei
der St.Paulus-Gesellschaft.
Stone, Irving (1999), The Global Export of Capital from Great Britain, 1865-1914. A Statistical Survey,
London: Macmillan.
Suter, Christian (1990), Schuldenzyklen in der Dritten Welt : Kreditaufnahme, Zahlungskrisen und Schulden-
regelungen peripherer Lander im Weltsystem von 1820 bis 1986, Frankfurt/ Main: A. Hain.
Taylor, A. (1998), “On the costs of inward-looking development: historical perspectives on price distortions,
growth, and divergence in Latin America from the 1930s to the 1980s,” Journal of Economic History,
58(1): 128.
29
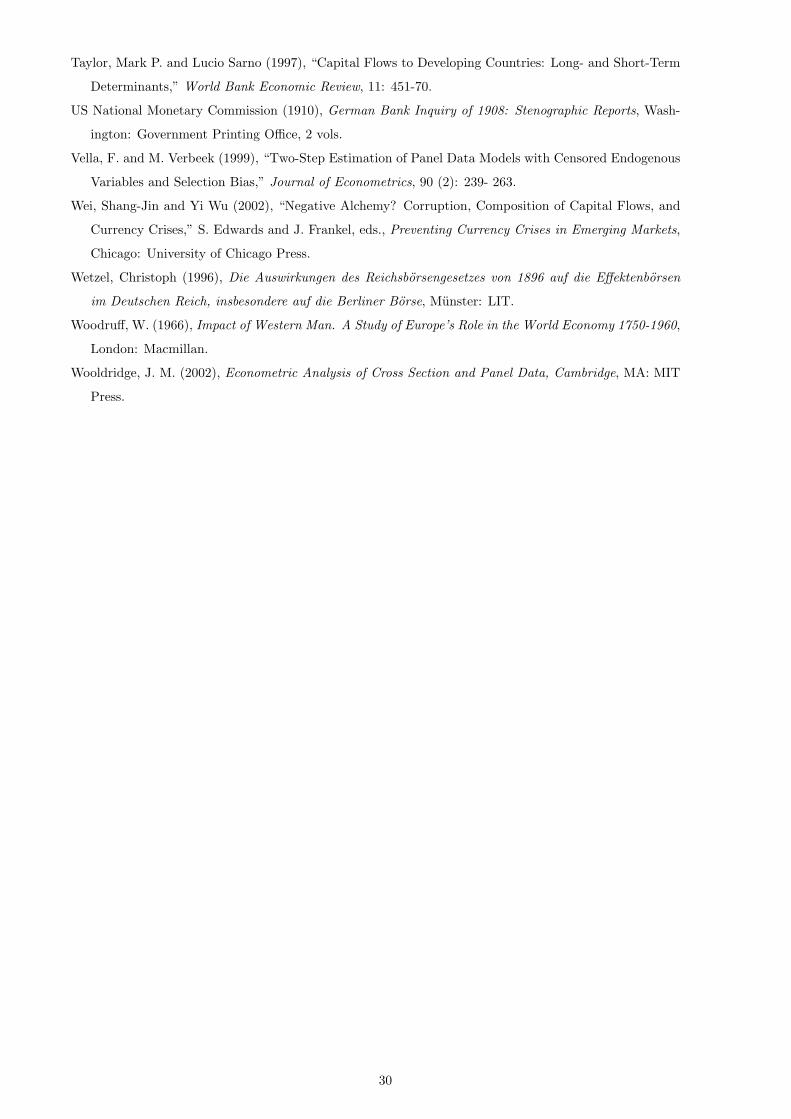
Taylor, Mark P. and Lucio Sarno (1997), “Capital Flows to Developing Countries: Long- and Short-Term
Determinants,” World Bank Economic Review, 11: 451-70.
US National Monetary Commission (1910), German Bank Inquiry of 1908: Stenographic Reports, Wash-
ington: Government Printing Office, 2 vols.
Vella, F. and M. Verbeek (1999), “Two-Step Estimation of Panel Data Models with Censored Endogenous
Variables and Selection Bias,” Journal of Econometrics, 90 (2): 239- 263.
Wei, Shang-Jin and Yi Wu (2002), “Negative Alchemy? Corruption, Composition of Capital Flows, and
Currency Crises,” S. Edwards and J. Frankel, eds., Preventing Currency Crises in Emerging Markets,
Chicago: University of Chicago Press.
Wetzel, Christoph (1996), Die Auswirkungen des Reichsborsengesetzes von 1896 auf die Effektenborsen
im Deutschen Reich, insbesondere auf die Berliner Borse, Munster: LIT.
Woodruff, W. (1966), Impact of Western Man. A Study of Europe’s Role in the World Economy 1750-1960,
London: Macmillan.
Wooldridge, J. M. (2002), Econometric Analysis of Cross Section and Panel Data, Cambridge, MA: MIT
Press.
30
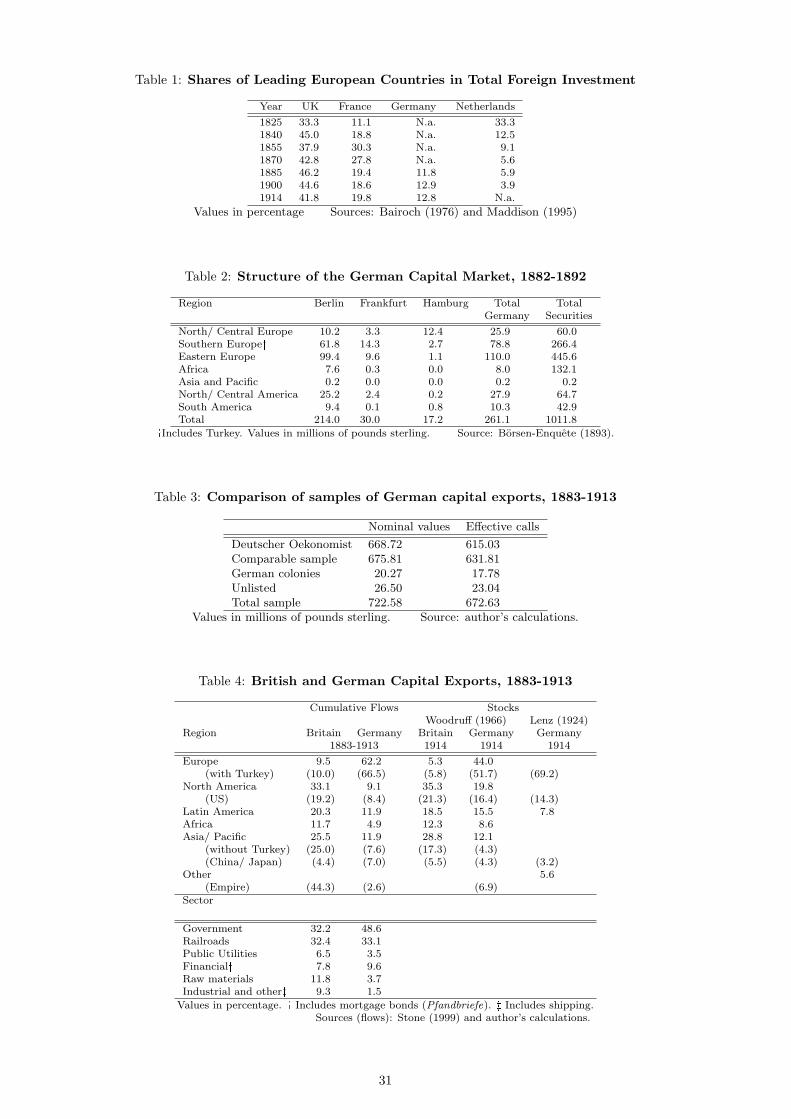
Table 1: Shares of Leading European Countries in Total Foreign Investment
Year UK France Germany Netherlands
1825 33.3 11.1 N.a. 33.31840 45.0 18.8 N.a. 12.51855 37.9 30.3 N.a. 9.11870 42.8 27.8 N.a. 5.61885 46.2 19.4 11.8 5.91900 44.6 18.6 12.9 3.91914 41.8 19.8 12.8 N.a.
Values in percentage Sources: Bairoch (1976) and Maddison (1995)
Table 2: Structure of the German Capital Market, 1882-1892
Region Berlin Frankfurt Hamburg Total TotalGermany Securities
North/ Central Europe 10.2 3.3 12.4 25.9 60.0Southern Europe� 61.8 14.3 2.7 78.8 266.4Eastern Europe 99.4 9.6 1.1 110.0 445.6Africa 7.6 0.3 0.0 8.0 132.1Asia and Pacific 0.2 0.0 0.0 0.2 0.2North/ Central America 25.2 2.4 0.2 27.9 64.7South America 9.4 0.1 0.8 10.3 42.9Total 214.0 30.0 17.2 261.1 1011.8
�Includes Turkey. Values in millions of pounds sterling. Source: Borsen-Enquete (1893).
Table 3: Comparison of samples of German capital exports, 1883-1913
Nominal values Effective calls
Deutscher Oekonomist 668.72 615.03Comparable sample 675.81 631.81German colonies 20.27 17.78Unlisted 26.50 23.04Total sample 722.58 672.63
Values in millions of pounds sterling. Source: author’s calculations.
Table 4: British and German Capital Exports, 1883-1913
Cumulative Flows StocksWoodruff (1966) Lenz (1924)
Region Britain Germany Britain Germany Germany1883-1913 1914 1914 1914
Europe 9.5 62.2 5.3 44.0(with Turkey) (10.0) (66.5) (5.8) (51.7) (69.2)
North America 33.1 9.1 35.3 19.8(US) (19.2) (8.4) (21.3) (16.4) (14.3)
Latin America 20.3 11.9 18.5 15.5 7.8Africa 11.7 4.9 12.3 8.6Asia/ Pacific 25.5 11.9 28.8 12.1
(without Turkey) (25.0) (7.6) (17.3) (4.3)(China/ Japan) (4.4) (7.0) (5.5) (4.3) (3.2)
Other 5.6(Empire) (44.3) (2.6) (6.9)
Sector
Government 32.2 48.6Railroads 32.4 33.1Public Utilities 6.5 3.5Financial� 7.8 9.6Raw materials 11.8 3.7Industrial and other� 9.3 1.5
Values in percentage. � Includes mortgage bonds (Pfandbriefe). � Includes shipping.Sources (flows): Stone (1999) and author’s calculations.
31
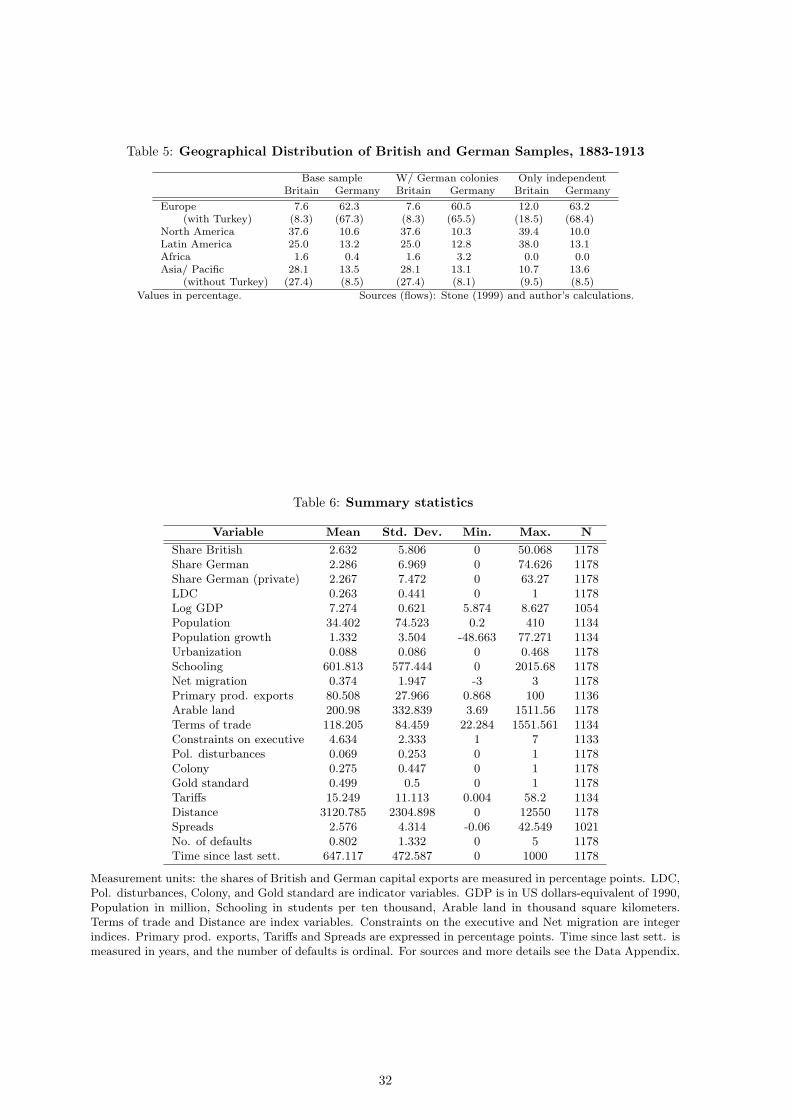
Table 5: Geographical Distribution of British and German Samples, 1883-1913
Base sample W/ German colonies Only independentBritain Germany Britain Germany Britain Germany
Europe 7.6 62.3 7.6 60.5 12.0 63.2(with Turkey) (8.3) (67.3) (8.3) (65.5) (18.5) (68.4)
North America 37.6 10.6 37.6 10.3 39.4 10.0Latin America 25.0 13.2 25.0 12.8 38.0 13.1Africa 1.6 0.4 1.6 3.2 0.0 0.0Asia/ Pacific 28.1 13.5 28.1 13.1 10.7 13.6
(without Turkey) (27.4) (8.5) (27.4) (8.1) (9.5) (8.5)
Values in percentage. Sources (flows): Stone (1999) and author’s calculations.
Table 6: Summary statistics
Variable Mean Std. Dev. Min. Max. N
Share British 2.632 5.806 0 50.068 1178Share German 2.286 6.969 0 74.626 1178Share German (private) 2.267 7.472 0 63.27 1178LDC 0.263 0.441 0 1 1178Log GDP 7.274 0.621 5.874 8.627 1054Population 34.402 74.523 0.2 410 1134Population growth 1.332 3.504 -48.663 77.271 1134Urbanization 0.088 0.086 0 0.468 1178Schooling 601.813 577.444 0 2015.68 1178Net migration 0.374 1.947 -3 3 1178Primary prod. exports 80.508 27.966 0.868 100 1136Arable land 200.98 332.839 3.69 1511.56 1178Terms of trade 118.205 84.459 22.284 1551.561 1134Constraints on executive 4.634 2.333 1 7 1133Pol. disturbances 0.069 0.253 0 1 1178Colony 0.275 0.447 0 1 1178Gold standard 0.499 0.5 0 1 1178Tariffs 15.249 11.113 0.004 58.2 1134Distance 3120.785 2304.898 0 12550 1178Spreads 2.576 4.314 -0.06 42.549 1021No. of defaults 0.802 1.332 0 5 1178Time since last sett. 647.117 472.587 0 1000 1178
Measurement units: the shares of British and German capital exports are measured in percentage points. LDC,Pol. disturbances, Colony, and Gold standard are indicator variables. GDP is in US dollars-equivalent of 1990,Population in million, Schooling in students per ten thousand, Arable land in thousand square kilometers.Terms of trade and Distance are index variables. Constraints on the executive and Net migration are integerindices. Primary prod. exports, Tariffs and Spreads are expressed in percentage points. Time since last sett. ismeasured in years, and the number of defaults is ordinal. For sources and more details see the Data Appendix.
32
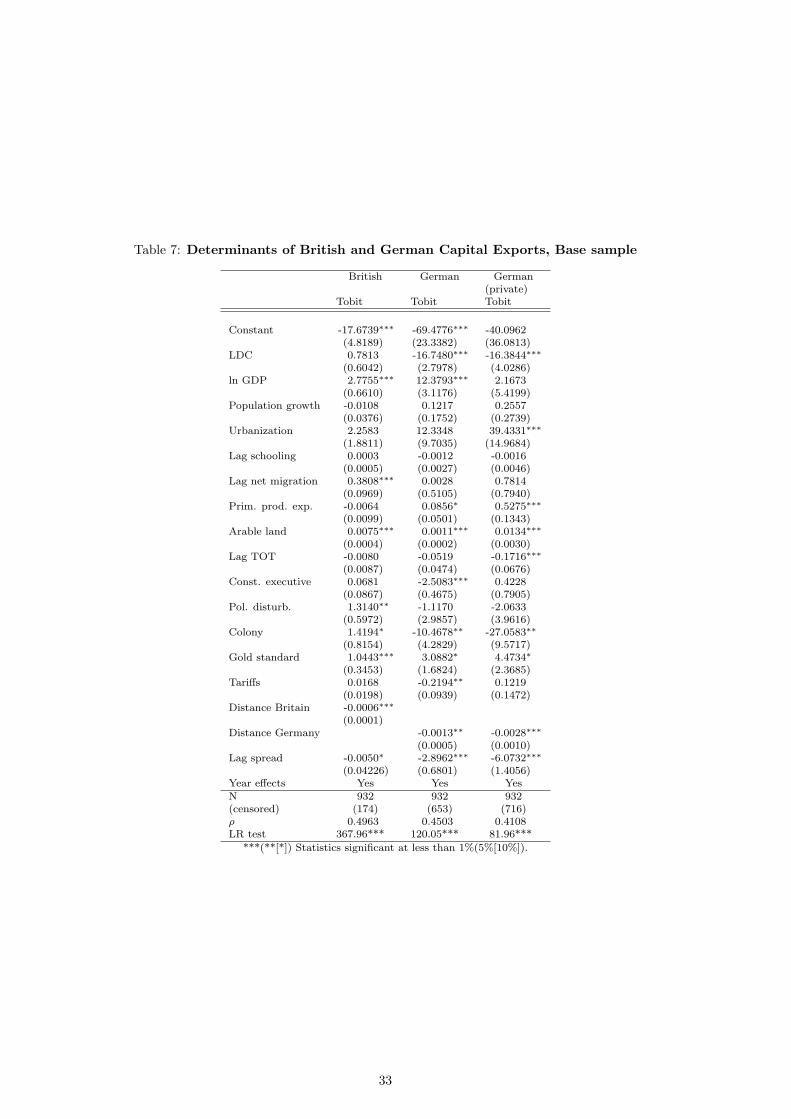
Table 7: Determinants of British and German Capital Exports, Base sample
British German German(private)
Tobit Tobit Tobit
Constant -17.6739∗∗∗ -69.4776∗∗∗ -40.0962(4.8189) (23.3382) (36.0813)
LDC 0.7813 -16.7480∗∗∗ -16.3844∗∗∗(0.6042) (2.7978) (4.0286)
ln GDP 2.7755∗∗∗ 12.3793∗∗∗ 2.1673(0.6610) (3.1176) (5.4199)
Population growth -0.0108 0.1217 0.2557(0.0376) (0.1752) (0.2739)
Urbanization 2.2583 12.3348 39.4331∗∗∗(1.8811) (9.7035) (14.9684)
Lag schooling 0.0003 -0.0012 -0.0016(0.0005) (0.0027) (0.0046)
Lag net migration 0.3808∗∗∗ 0.0028 0.7814(0.0969) (0.5105) (0.7940)
Prim. prod. exp. -0.0064 0.0856∗ 0.5275∗∗∗(0.0099) (0.0501) (0.1343)
Arable land 0.0075∗∗∗ 0.0011∗∗∗ 0.0134∗∗∗(0.0004) (0.0002) (0.0030)
Lag TOT -0.0080 -0.0519 -0.1716∗∗∗(0.0087) (0.0474) (0.0676)
Const. executive 0.0681 -2.5083∗∗∗ 0.4228(0.0867) (0.4675) (0.7905)
Pol. disturb. 1.3140∗∗ -1.1170 -2.0633(0.5972) (2.9857) (3.9616)
Colony 1.4194∗ -10.4678∗∗ -27.0583∗∗(0.8154) (4.2829) (9.5717)
Gold standard 1.0443∗∗∗ 3.0882∗ 4.4734∗(0.3453) (1.6824) (2.3685)
Tariffs 0.0168 -0.2194∗∗ 0.1219(0.0198) (0.0939) (0.1472)
Distance Britain -0.0006∗∗∗(0.0001)
Distance Germany -0.0013∗∗ -0.0028∗∗∗(0.0005) (0.0010)
Lag spread -0.0050∗ -2.8962∗∗∗ -6.0732∗∗∗(0.04226) (0.6801) (1.4056)
Year effects Yes Yes YesN 932 932 932(censored) (174) (653) (716)ρ 0.4963 0.4503 0.4108LR test 367.96*** 120.05*** 81.96***
***(**[*]) Statistics significant at less than 1%(5%[10%]).
33

Table 8: Determinants of British and German Capital Exports, Extended sample
British German German British German German(private) (private)
Tobit Tobit Tobit Tobit Tobit Tobit
Constant -6.2171∗∗∗ -0.9881 26.4728∗∗∗ -5.9358∗∗∗ -28.8894∗∗∗ -36.7683∗∗∗(1.6437) (8.1568) (7.9629) (1.6185) (9.5205) (11.5266)
LDC 0.4525 -6.7301∗∗∗ -4.3324∗ 1.4171∗∗∗ -6.0403∗∗∗ -12.5272∗∗∗(0.5383) (1.8996) (2.5182) (0.5137) (2.1124) (2.9122)
Population 0.0281∗∗∗ 0.0517∗∗∗ 0.0394∗∗∗ 0.0137∗∗∗ 0.0559∗∗∗ 0.0736∗∗∗(0.0025) (0.0111) (0.0148) (0.0024) (0.0116) (0.0171)
Population growth 0.0018 0.1153 0.1936 0.0164 0.1327 0.2268(0.0340) (0.1483) (0.2308) (0.0381) (0.1505) (0.2389)
Urbanization 9.1620∗∗∗ 8.5222 30.8894∗∗ 5.4725∗∗∗ 26.4490∗∗∗ 25.0030∗∗(1.9806) (8.7449) (14.0709) (1.9699) (9.4827) (12.4823)
Lag schooling 0.0021∗∗∗ -0.0018 -0.0138∗∗∗ 0.0012∗∗ -0.0043 -0.0014(0.0006) (0.0027) (0.0038) (0.0006) (0.0031) (0.0038)
Lag net migration 0.5055∗∗∗ 2.2039∗∗∗ 1.5766∗∗ 0.6969∗∗∗ 0.7072 1.3035∗(0.1106) (0.6769) (0.7409) (0.1064) (0.6185) (0.7498)
Prim. prod. exp. 0.0396∗∗∗ -0.0673 -0.2930∗∗∗ 0.0242∗∗ 0.3350∗∗∗ 0.4415∗∗∗(0.0101) (0.0454) (0.0600) (0.0101) (0.0806) (0.0997)
Arable land 0.0047∗∗∗ -0.0002 0.0045 0.0093∗∗∗ 0.0093∗∗∗ 0.0079∗∗(0.0006) (0.0023) (0.0034) (0.0005) (0.0026) (0.0036)
Lag TOT -0.0123 -0.0013 -0.00003 -0.0082 -0.0004 -0.0005(0.0088) (0.0047) (0.00585) (0.0082) (0.0047) (0.0058)
Const. executive 0.1626 0.7685 -0.1437 0.2019∗∗ 0.7140 0.4356(0.1209) (0.4917) (0.6905) (0.0910) (0.5850) (0.6476)
Pol. disturb. 1.1336 -2.5357 -3.6044 1.1227∗ -2.3049 -3.210(0.5842) (2.2903) (3.0618) (0.5853) (2.2646) (3.0550)
Colony 0.7681 -13.9125 -16.2414∗∗∗(0.7724) (3.8475) (6.0530)
Colony-own 1.6697∗∗ 40.7578∗∗∗ 55.2600∗∗∗(0.7074) (8.7101) (10.5684)
Colony-other -3.3770∗∗∗ -22.8674 -31.9154∗∗∗(1.0269) . (7.9443)
Gold standard 1.0303∗∗∗ 4.0469∗∗ 5.2779∗∗ 1.0958∗∗ 3.7165∗∗∗ 3.9624∗(0.3593) (1.7222) (2.1229) (0.3859) (1.6597) (2.0904)
Tariffs 0.0485∗ 0.1235 0.3206∗∗ 0.0263 0.0381 0.1115(0.0282) (0.0940) (0.1441) (0.0231) (0.0956) (0.1370)
Distance Britain -0.0005∗∗∗ -0.0001(0.0001) (0.0001)
Distance Germany -0.0013 -0.0024∗∗ -0.0025∗∗∗ -0.0028∗∗∗(0.0011) (0.0009) (0.0008) (0.0010)
Lag spread -0.0375 -2.5194∗∗∗ -4.5447∗∗∗ -0.0633 -2.9281∗∗∗ -4.8093∗∗∗(0.0506) (0.6061) (1.1685) (0.0471) (0.6615) (1.1618)
Year effects Yes Yes Yes Yes Yes YesN 1000 1000 1000 1000 1000 1000(censored) (242) (662) (725) (242) (662) (725)ρ 0.3645 0.5301 0.4356 0.3376 0.3836 0.3963LR test 311.90*** 164.67*** 163.38*** 308.38*** 138.74*** 124.27***
***(**[*]) Statistics significant at less than 1%(5%[10%]).
34
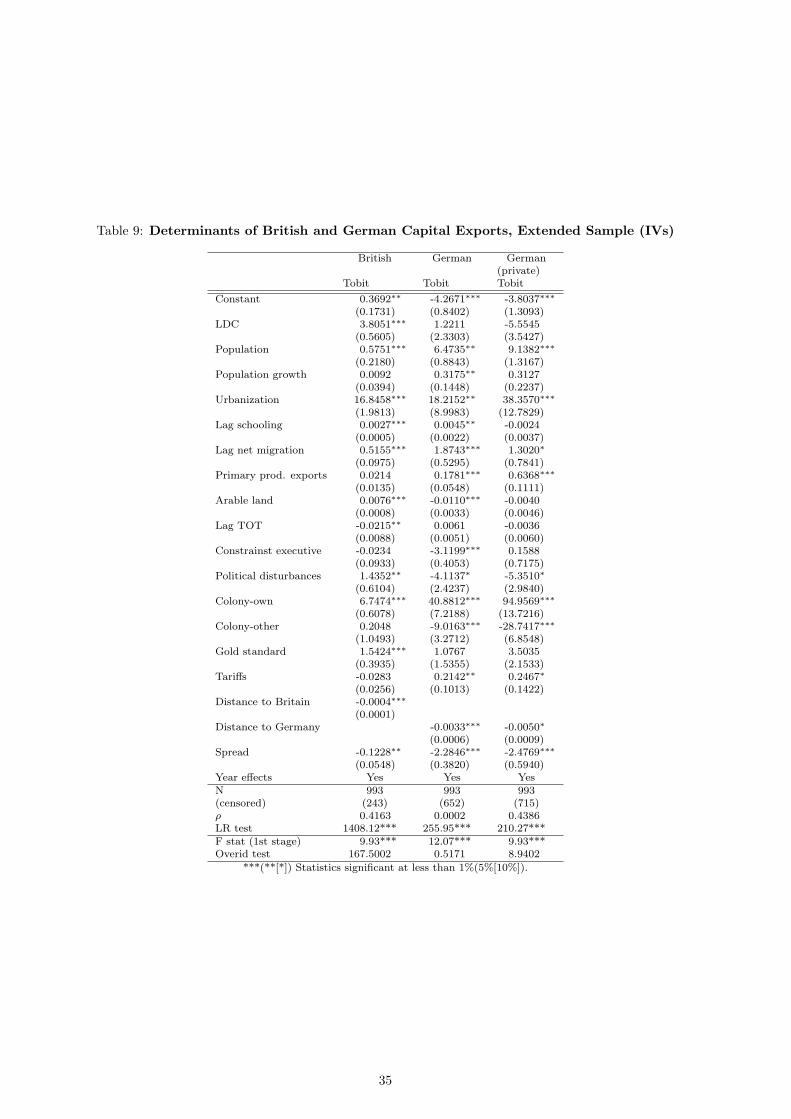
Table 9: Determinants of British and German Capital Exports, Extended Sample (IVs)
British German German(private)
Tobit Tobit Tobit
Constant 0.3692∗∗ -4.2671∗∗∗ -3.8037∗∗∗(0.1731) (0.8402) (1.3093)
LDC 3.8051∗∗∗ 1.2211 -5.5545(0.5605) (2.3303) (3.5427)
Population 0.5751∗∗∗ 6.4735∗∗ 9.1382∗∗∗(0.2180) (0.8843) (1.3167)
Population growth 0.0092 0.3175∗∗ 0.3127(0.0394) (0.1448) (0.2237)
Urbanization 16.8458∗∗∗ 18.2152∗∗ 38.3570∗∗∗(1.9813) (8.9983) (12.7829)
Lag schooling 0.0027∗∗∗ 0.0045∗∗ -0.0024(0.0005) (0.0022) (0.0037)
Lag net migration 0.5155∗∗∗ 1.8743∗∗∗ 1.3020∗(0.0975) (0.5295) (0.7841)
Primary prod. exports 0.0214 0.1781∗∗∗ 0.6368∗∗∗(0.0135) (0.0548) (0.1111)
Arable land 0.0076∗∗∗ -0.0110∗∗∗ -0.0040(0.0008) (0.0033) (0.0046)
Lag TOT -0.0215∗∗ 0.0061 -0.0036(0.0088) (0.0051) (0.0060)
Constrainst executive -0.0234 -3.1199∗∗∗ 0.1588(0.0933) (0.4053) (0.7175)
Political disturbances 1.4352∗∗ -4.1137∗ -5.3510∗(0.6104) (2.4237) (2.9840)
Colony-own 6.7474∗∗∗ 40.8812∗∗∗ 94.9569∗∗∗(0.6078) (7.2188) (13.7216)
Colony-other 0.2048 -9.0163∗∗∗ -28.7417∗∗∗(1.0493) (3.2712) (6.8548)
Gold standard 1.5424∗∗∗ 1.0767 3.5035(0.3935) (1.5355) (2.1533)
Tariffs -0.0283 0.2142∗∗ 0.2467∗(0.0256) (0.1013) (0.1422)
Distance to Britain -0.0004∗∗∗(0.0001)
Distance to Germany -0.0033∗∗∗ -0.0050∗(0.0006) (0.0009)
Spread -0.1228∗∗ -2.2846∗∗∗ -2.4769∗∗∗(0.0548) (0.3820) (0.5940)
Year effects Yes Yes YesN 993 993 993(censored) (243) (652) (715)ρ 0.4163 0.0002 0.4386LR test 1408.12*** 255.95*** 210.27***F stat (1st stage) 9.93*** 12.07*** 9.93***Overid test 167.5002 0.5171 8.9402
***(**[*]) Statistics significant at less than 1%(5%[10%]).
35
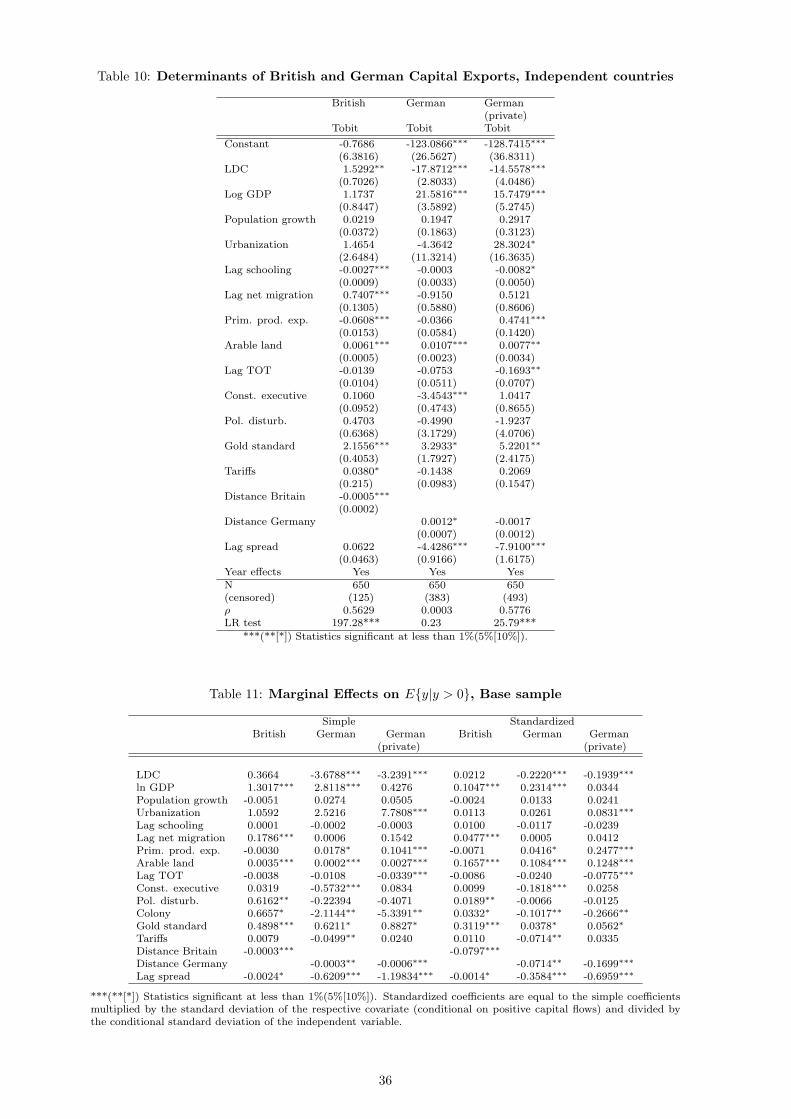
Table 10: Determinants of British and German Capital Exports, Independent countries
British German German(private)
Tobit Tobit Tobit
Constant -0.7686 -123.0866∗∗∗ -128.7415∗∗∗(6.3816) (26.5627) (36.8311)
LDC 1.5292∗∗ -17.8712∗∗∗ -14.5578∗∗∗(0.7026) (2.8033) (4.0486)
Log GDP 1.1737 21.5816∗∗∗ 15.7479∗∗∗(0.8447) (3.5892) (5.2745)
Population growth 0.0219 0.1947 0.2917(0.0372) (0.1863) (0.3123)
Urbanization 1.4654 -4.3642 28.3024∗(2.6484) (11.3214) (16.3635)
Lag schooling -0.0027∗∗∗ -0.0003 -0.0082∗(0.0009) (0.0033) (0.0050)
Lag net migration 0.7407∗∗∗ -0.9150 0.5121(0.1305) (0.5880) (0.8606)
Prim. prod. exp. -0.0608∗∗∗ -0.0366 0.4741∗∗∗(0.0153) (0.0584) (0.1420)
Arable land 0.0061∗∗∗ 0.0107∗∗∗ 0.0077∗∗(0.0005) (0.0023) (0.0034)
Lag TOT -0.0139 -0.0753 -0.1693∗∗(0.0104) (0.0511) (0.0707)
Const. executive 0.1060 -3.4543∗∗∗ 1.0417(0.0952) (0.4743) (0.8655)
Pol. disturb. 0.4703 -0.4990 -1.9237(0.6368) (3.1729) (4.0706)
Gold standard 2.1556∗∗∗ 3.2933∗ 5.2201∗∗(0.4053) (1.7927) (2.4175)
Tariffs 0.0380∗ -0.1438 0.2069(0.215) (0.0983) (0.1547)
Distance Britain -0.0005∗∗∗(0.0002)
Distance Germany 0.0012∗ -0.0017(0.0007) (0.0012)
Lag spread 0.0622 -4.4286∗∗∗ -7.9100∗∗∗(0.0463) (0.9166) (1.6175)
Year effects Yes Yes YesN 650 650 650(censored) (125) (383) (493)ρ 0.5629 0.0003 0.5776LR test 197.28*** 0.23 25.79***
***(**[*]) Statistics significant at less than 1%(5%[10%]).
Table 11: Marginal Effects on E{y|y > 0}, Base sample
Simple StandardizedBritish German German British German German
(private) (private)
LDC 0.3664 -3.6788∗∗∗ -3.2391∗∗∗ 0.0212 -0.2220∗∗∗ -0.1939∗∗∗ln GDP 1.3017∗∗∗ 2.8118∗∗∗ 0.4276 0.1047∗∗∗ 0.2314∗∗∗ 0.0344Population growth -0.0051 0.0274 0.0505 -0.0024 0.0133 0.0241Urbanization 1.0592 2.5216 7.7808∗∗∗ 0.0113 0.0261 0.0831∗∗∗Lag schooling 0.0001 -0.0002 -0.0003 0.0100 -0.0117 -0.0239Lag net migration 0.1786∗∗∗ 0.0006 0.1542 0.0477∗∗∗ 0.0005 0.0412Prim. prod. exp. -0.0030 0.0178∗ 0.1041∗∗∗ -0.0071 0.0416∗ 0.2477∗∗∗Arable land 0.0035∗∗∗ 0.0002∗∗∗ 0.0027∗∗∗ 0.1657∗∗∗ 0.1084∗∗∗ 0.1248∗∗∗Lag TOT -0.0038 -0.0108 -0.0339∗∗∗ -0.0086 -0.0240 -0.0775∗∗∗Const. executive 0.0319 -0.5732∗∗∗ 0.0834 0.0099 -0.1818∗∗∗ 0.0258Pol. disturb. 0.6162∗∗ -0.22394 -0.4071 0.0189∗∗ -0.0066 -0.0125Colony 0.6657∗ -2.1144∗∗ -5.3391∗∗ 0.0332∗ -0.1017∗∗ -0.2666∗∗Gold standard 0.4898∗∗∗ 0.6211∗ 0.8827∗ 0.3119∗∗∗ 0.0378∗ 0.0562∗Tariffs 0.0079 -0.0499∗∗ 0.0240 0.0110 -0.0714∗∗ 0.0335Distance Britain -0.0003∗∗∗ -0.0797∗∗∗Distance Germany -0.0003∗∗ -0.0006∗∗∗ -0.0714∗∗ -0.1699∗∗∗Lag spread -0.0024∗ -0.6209∗∗∗ -1.19834∗∗∗ -0.0014∗ -0.3584∗∗∗ -0.6959∗∗∗
***(**[*]) Statistics significant at less than 1%(5%[10%]). Standardized coefficients are equal to the simple coefficientsmultiplied by the standard deviation of the respective covariate (conditional on positive capital flows) and divided bythe conditional standard deviation of the independent variable.
36
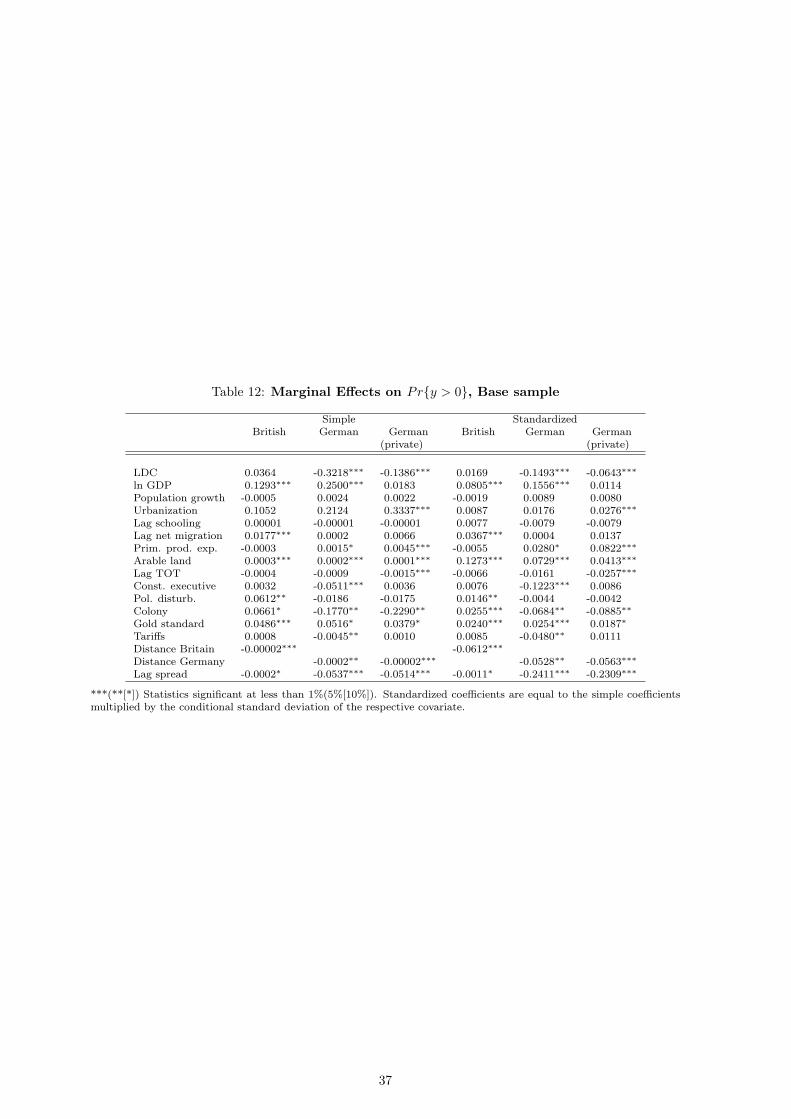
Table 12: Marginal Effects on Pr{y > 0}, Base sample
Simple StandardizedBritish German German British German German
(private) (private)
LDC 0.0364 -0.3218∗∗∗ -0.1386∗∗∗ 0.0169 -0.1493∗∗∗ -0.0643∗∗∗ln GDP 0.1293∗∗∗ 0.2500∗∗∗ 0.0183 0.0805∗∗∗ 0.1556∗∗∗ 0.0114Population growth -0.0005 0.0024 0.0022 -0.0019 0.0089 0.0080Urbanization 0.1052 0.2124 0.3337∗∗∗ 0.0087 0.0176 0.0276∗∗∗Lag schooling 0.00001 -0.00001 -0.00001 0.0077 -0.0079 -0.0079Lag net migration 0.0177∗∗∗ 0.0002 0.0066 0.0367∗∗∗ 0.0004 0.0137Prim. prod. exp. -0.0003 0.0015∗ 0.0045∗∗∗ -0.0055 0.0280∗ 0.0822∗∗∗Arable land 0.0003∗∗∗ 0.0002∗∗∗ 0.0001∗∗∗ 0.1273∗∗∗ 0.0729∗∗∗ 0.0413∗∗∗Lag TOT -0.0004 -0.0009 -0.0015∗∗∗ -0.0066 -0.0161 -0.0257∗∗∗Const. executive 0.0032 -0.0511∗∗∗ 0.0036 0.0076 -0.1223∗∗∗ 0.0086Pol. disturb. 0.0612∗∗ -0.0186 -0.0175 0.0146∗∗ -0.0044 -0.0042Colony 0.0661∗ -0.1770∗∗ -0.2290∗∗ 0.0255∗∗∗ -0.0684∗∗ -0.0885∗∗Gold standard 0.0486∗∗∗ 0.0516∗ 0.0379∗ 0.0240∗∗∗ 0.0254∗∗∗ 0.0187∗Tariffs 0.0008 -0.0045∗∗ 0.0010 0.0085 -0.0480∗∗ 0.0111Distance Britain -0.00002∗∗∗ -0.0612∗∗∗Distance Germany -0.0002∗∗ -0.00002∗∗∗ -0.0528∗∗ -0.0563∗∗∗Lag spread -0.0002∗ -0.0537∗∗∗ -0.0514∗∗∗ -0.0011∗ -0.2411∗∗∗ -0.2309∗∗∗
***(**[*]) Statistics significant at less than 1%(5%[10%]). Standardized coefficients are equal to the simple coefficientsmultiplied by the conditional standard deviation of the respective covariate.
37
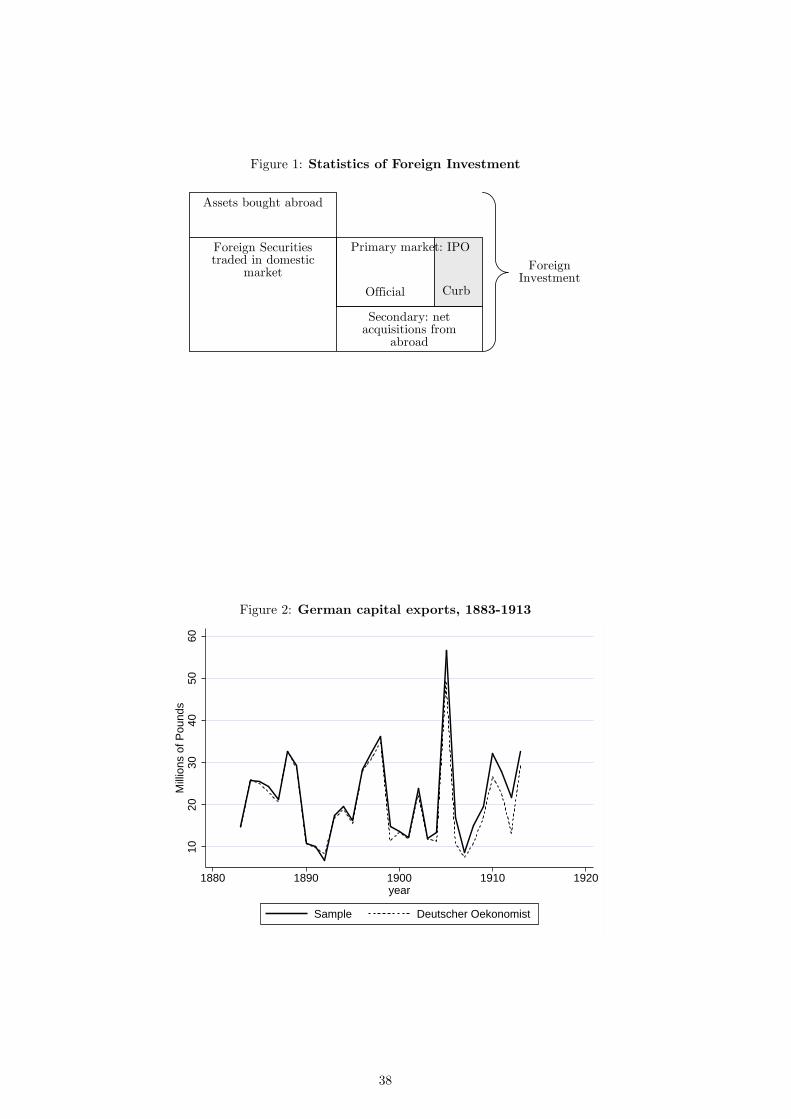
Figure 1: Statistics of Foreign Investment
Curb
Primary market: IPO
Official
Foreign Investment
Foreign Securities traded in domestic
market
Assets bought abroad
Secondary: net acquisitions from
abroad
Figure 2: German capital exports, 1883-1913
1020
3040
5060
Mill
ions
of P
ound
s
1880 1890 1900 1910 1920year
Sample Deutscher Oekonomist
38
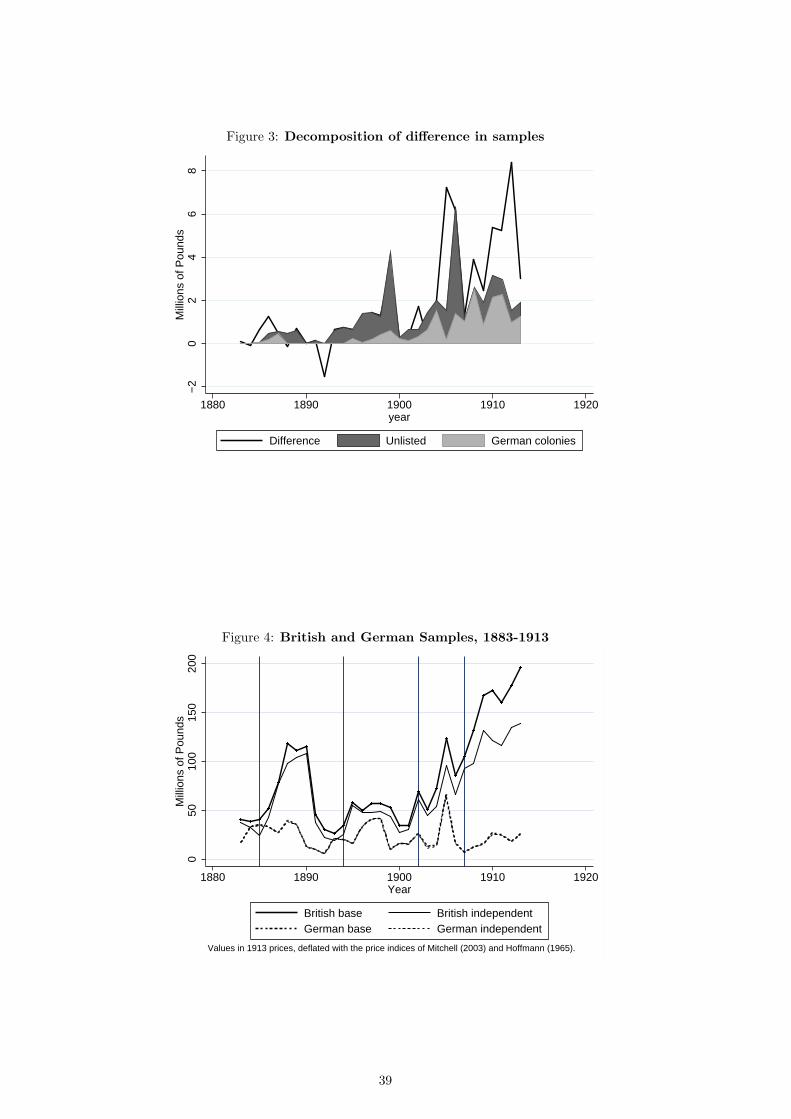
Figure 3: Decomposition of difference in samples
−2
02
46
8M
illio
ns o
f Pou
nds
1880 1890 1900 1910 1920year
Difference Unlisted German colonies
Figure 4: British and German Samples, 1883-1913
050
100
150
200
Mill
ions
of P
ound
s
1880 1890 1900 1910 1920Year
British base British independentGerman base German independent
Values in 1913 prices, deflated with the price indices of Mitchell (2003) and Hoffmann (1965).
39