best’s special report u.s. property/casualty special report u.s. property/casualty a note to...
TRANSCRIPT

Copyright © 2014 by A.M. Best Company, Inc. ALL RIGHTS RESERVED. No part of this report or document may be distributed in any electronic form or by any means, or stored in a database or retrieval system, without the prior written permission of the A.M. Best Company. For additional details, refer to our Terms of Use available at the A.M. Best Company website: www.ambest.com/terms.
BEST’S SPECIAL REPORTOur Insight, Your Advantage.
Analytical ContactJennifer Marshall, Oldwick+1 (908) 439-2200, Ext. [email protected]
Editorial ManagementAl Slavin
U.S. Property/Casualty
P/C industry surplus hit a record level in 2013.
Review & Preview February 4, 2014 P/C Segment’s Net Income Estimated
to Be Up Nearly 60% in 2013A relatively subdued year for catastrophes helped clear a path for the U.S. property/casualty industry to achieve an underwriting profit for the first time in four years. Underwriting results reached their best level since 2007, with the industry producing an expected combined ratio of 97.6 for the year. Profitability for 2013 was further bolstered by considerable investment gains achieved in strengthened U.S. equity markets.
Additional highlights from last year’s performance include a 4.8% increase in net premiums written (NPW) and a nearly 60% increase in net income to $63.2 billion, which helped drive an estimated record year-end surplus of $666.3 billion. The surplus level is particularly noteworthy given the head-winds that are anticipated in 2014.
It should also be noted that the drop in catastrophe losses chipped 4.3 points from the industry’s expected combined ratio in 2013. A significant factor that contributed to this improvement was that – unlike the costly presence of Superstorm Sandy in 2012 – not a single major storm made landfall in the United States last year. A.M. Best is estimating a more normal level of catastrophe losses in the coming year.
In looking ahead to 2014, A.M. Best expects premiums to con-tinue growing through price increases, but the pace of these rate changes should slow and temper growth in premium. Although core accident-year underwriting results should improve slightly on the rate level achieved in recent years, less favorable development of prior years’ loss reserves is anticipated. In addition, the industry will continue to be challenged by the relatively low investment yields that are expected to persist through 2014, and the slow recovery from the recession of 2007-2009.
A.M. Best believes the industry is well-capitalized overall to meet these challenges. But 2013 ended with several companies needing to strengthen prior years’ loss reserves, and the importance of main-taining pricing and reserving discipline amid soft market conditions is becoming increasingly clear.
A.M. Best is maintaining its stable outlooks for the personal lines and reinsurance segments. The personal lines segment has been bolstered by the ongoing stability of the automobile line, which comprises more than 60% of the segment’s NPW. Yet concentrated property writers may face ratings pressure that will depend on their ability to address volatility and show stable performance despite any changing weather patterns.
The reinsurance segment continues to benefit from strong risk-adjusted capital, discerning enterprise risk management and a slow improvement in the global economic environment underpinned by the United States.
A.M. Best is maintaining the negative outlook for the commercial segment, a view that was first initi-ated in 2011. Despite the positive signs that were evident in 2013 results, the commercial segment’s performance is heavily influenced by a small number of groups. A.M. Best believes that competitive pricing, low (albeit improving) investment yields and the potential for future adverse develop-ment of loss reserves will be more strongly felt by the remainder of the sector.
OutlookPersonal Lines: StableCommercial Lines: NegativeReinsurance: Stable

2
Special Report U.S. Property/Casualty
A Note to ReadersWelcome to A.M. Best Co.’s 2014 Review & Preview report for the insurance industry. This re-port reflects A.M. Best’s official view, based on a review of data and industry trends, as well as interaction with management teams of insurance companies and other authoritative sources.
The U.S. and global economies continue to recover, although natural hazards, political crises and economic uncertainty remain poised to reset the field on a moment’s notice. We continue to observe the growing impact of regulation throughout the global insurance industry. We remain concerned about the challenges regulators face in striking a balance between en-couraging prudent management and overburdening organizations with conflicting rules and requirements.
The three sector-specific editions of this report allow a more thorough examination of the U.S. insurance industry:
• The property/casualty industry remains strongly capitalized. Given the relative decrease in catastrophe activity, capital continues to accumulate, bringing its own issues. Reinsurers are competing directly with capital markets; investors continue to find fresh appetites for the potential returns of the risk industry. That appetite may be tested in the event of shock losses. The outlook for global reinsurers remains stable. The personal lines sector continues to generate dependable returns; A.M. Best maintains its stable rating outlook for the sector. The rating outlook remains negative for commercial lines insurers.
• Life insurers have benefitted from the easing of economic turmoil. Among a host of factors, life insurers have improved their balance sheets and derisked their investment portfolios. A.M. Best’s rating outlook was reaffirmed at stable.
• Health insurers have invested time and resources in preparation for the new era of health care reform. The problems with the rollout of the Patient Protection and Affordable Care Act so far have not drawn in insurers, but the full measure is yet to be felt. The rating outlook for health insurers remains stable.
A.M. Best continues to raise its commitment to open communication about methodology, cri-teria and procedures. In 2013 we issued even more briefings, special reports, market presen-tations and public announcements. Our global reach continues to expand, with a new office set for Mexico and an expanding presence in Southeast Asia. We have quickened the pace of our briefings and special reports on key industry issues, with an eye to responding to signifi-cant developments in a timely manner. We continue to review our methodologies, processes, models and procedures to refine our ratings. Our reports on vitally important sectors such as global reinsurance, captive insurance, excess and surplus lines, and other significant market sectors continue to grow in depth and detail.
We hope you find this year’s Review & Preview publication to be a useful tool in assessing the issues you find important. Never hesitate to share your thoughts and concerns with me or our staff; we value our communication with the insurance industry and its constituents.
– Matthew C. Mosher, Senior Vice President - Rating Operations
3
Special Report U.S. Property/Casualty
Financial OutlookIndustry Posts Strong 2013 Results; 2014 Expected to Be Solid Year OverallFavorable weather patterns that reduced losses, solid price improvements in primary mar-kets and modestly better macroeconomic conditions in 2013 led the U.S. property/casualty industry to its first profitable underwriting year since 2009. The industry’s underwriting profit for 2013 is projected to be $8.5 billion. While still short of the levels achieved in the mid-2000s, solid underwriting profitability is needed to maintain acceptable returns in the current investment environment.
Despite a prolonged low interest rate environment, the industry produced solid levels of net investment income, and realized gains were up sharply from 2012 on the strong perfor-mance of U.S. equity markets. While income tax payments are projected to double on the improved profitability, the industry is expected to report net income of $63.2 billion for the year, a nearly 60% increase from 2012.
Catastrophe-related losses dropped to 3.2 points on the combined ratio from 7.5 points in 2012, and combined with declines in both loss-adjustment and underwriting expenses to produce an estimated combined ratio of 97.6 for the industry in 2013 (see Exhibit 1). In looking ahead to 2014, A.M. Best has estimated catastrophe losses at a more normal level. The combined ratio improved 4.6 points from 102.2 in 2012. Much as in 2012, rate increases were achieved in most lines, with NPW growing 4.8%. NPW also benefitted from improve-ments in exposures driven by modestly improving macroeconomic conditions. The in-dustry also benefitted from significantly higher capital gains and an increased level of net investment income.
The industry ended 2013 with an estimated $666.3 billion in surplus, driven by the year’s strong net income. This new record surplus for the industry represents a 10.4% increase over year-end 2012. Consequently, after-tax return on surplus is expected to improve to 9.5%, from 6.6% in 2012.
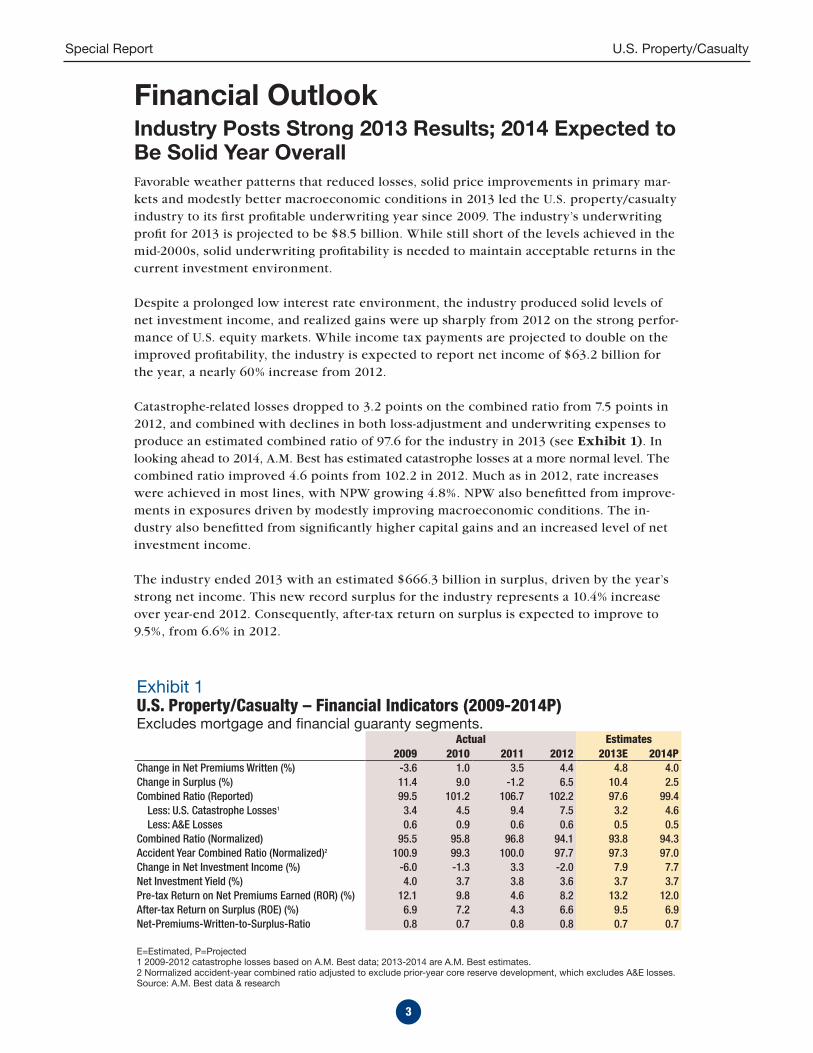
Exhibit 1U.S. Property/Casualty – Financial Indicators (2009-2014P)Excludes mortgage and financial guaranty segments.
Actual Estimates2009 2010 2011 2012 2013E 2014P
Change in Net Premiums Written (%) -3.6 1.0 3.5 4.4 4.8 4.0Change in Surplus (%) 11.4 9.0 -1.2 6.5 10.4 2.5Combined Ratio (Reported) 99.5 101.2 106.7 102.2 97.6 99.4 Less: U.S. Catastrophe Losses1 3.4 4.5 9.4 7.5 3.2 4.6 Less: A&E Losses 0.6 0.9 0.6 0.6 0.5 0.5Combined Ratio (Normalized) 95.5 95.8 96.8 94.1 93.8 94.3Accident Year Combined Ratio (Normalized)2 100.9 99.3 100.0 97.7 97.3 97.0Change in Net Investment Income (%) -6.0 -1.3 3.3 -2.0 7.9 7.7Net Investment Yield (%) 4.0 3.7 3.8 3.6 3.7 3.7Pre-tax Return on Net Premiums Earned (ROR) (%) 12.1 9.8 4.6 8.2 13.2 12.0After-tax Return on Surplus (ROE) (%) 6.9 7.2 4.3 6.6 9.5 6.9Net-Premiums-Written-to-Surplus-Ratio 0.8 0.7 0.8 0.8 0.7 0.7
E=Estimated, P=Projected1 2009-2012 catastrophe losses based on A.M. Best data; 2013-2014 are A.M. Best estimates.2 Normalized accident-year combined ratio adjusted to exclude prior-year core reserve development, which excludes A&E losses.Source: A.M. Best data & research
4
Special Report U.S. Property/Casualty
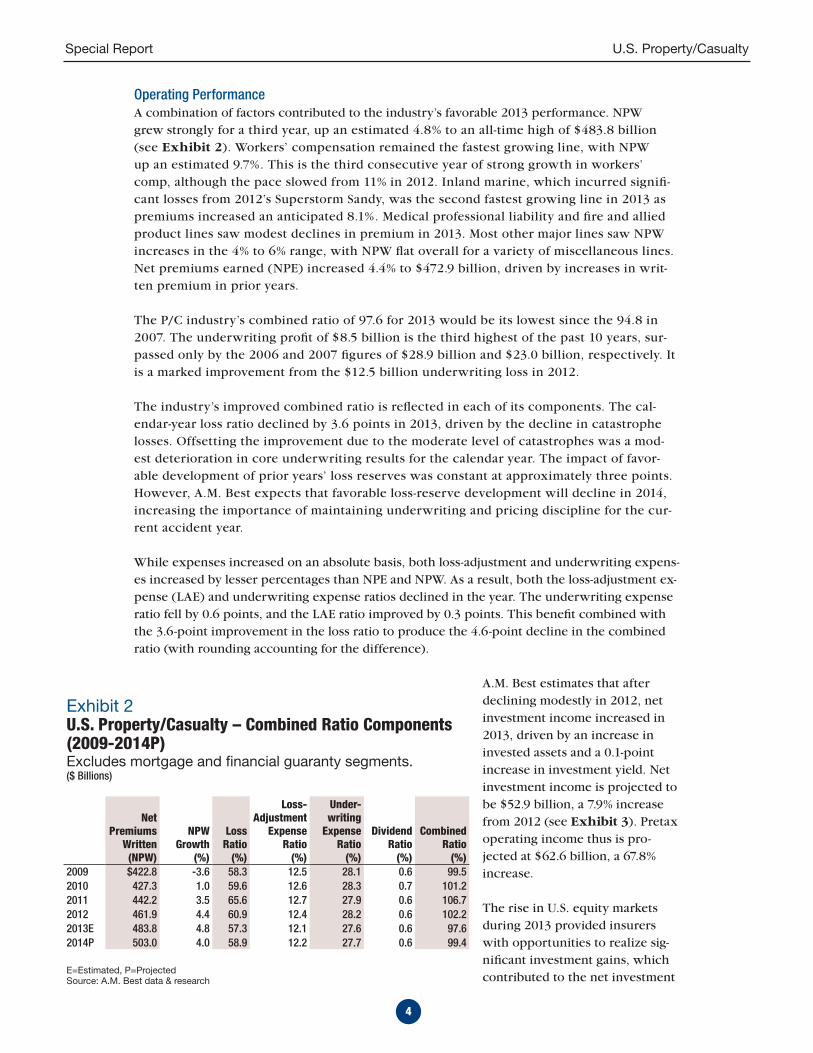
Operating PerformanceA combination of factors contributed to the industry’s favorable 2013 performance. NPW grew strongly for a third year, up an estimated 4.8% to an all-time high of $483.8 billion (see Exhibit 2). Workers’ compensation remained the fastest growing line, with NPW up an estimated 9.7%. This is the third consecutive year of strong growth in workers’ comp, although the pace slowed from 11% in 2012. Inland marine, which incurred signifi-cant losses from 2012’s Superstorm Sandy, was the second fastest growing line in 2013 as premiums increased an anticipated 8.1%. Medical professional liability and fire and allied product lines saw modest declines in premium in 2013. Most other major lines saw NPW increases in the 4% to 6% range, with NPW flat overall for a variety of miscellaneous lines. Net premiums earned (NPE) increased 4.4% to $472.9 billion, driven by increases in writ-ten premium in prior years.
The P/C industry’s combined ratio of 97.6 for 2013 would be its lowest since the 94.8 in 2007. The underwriting profit of $8.5 billion is the third highest of the past 10 years, sur-passed only by the 2006 and 2007 figures of $28.9 billion and $23.0 billion, respectively. It is a marked improvement from the $12.5 billion underwriting loss in 2012.
The industry’s improved combined ratio is reflected in each of its components. The cal-endar-year loss ratio declined by 3.6 points in 2013, driven by the decline in catastrophe losses. Offsetting the improvement due to the moderate level of catastrophes was a mod-est deterioration in core underwriting results for the calendar year. The impact of favor-able development of prior years’ loss reserves was constant at approximately three points. However, A.M. Best expects that favorable loss-reserve development will decline in 2014, increasing the importance of maintaining underwriting and pricing discipline for the cur-rent accident year.
While expenses increased on an absolute basis, both loss-adjustment and underwriting expens-es increased by lesser percentages than NPE and NPW. As a result, both the loss-adjustment ex-pense (LAE) and underwriting expense ratios declined in the year. The underwriting expense ratio fell by 0.6 points, and the LAE ratio improved by 0.3 points. This benefit combined with the 3.6-point improvement in the loss ratio to produce the 4.6-point decline in the combined ratio (with rounding accounting for the difference).
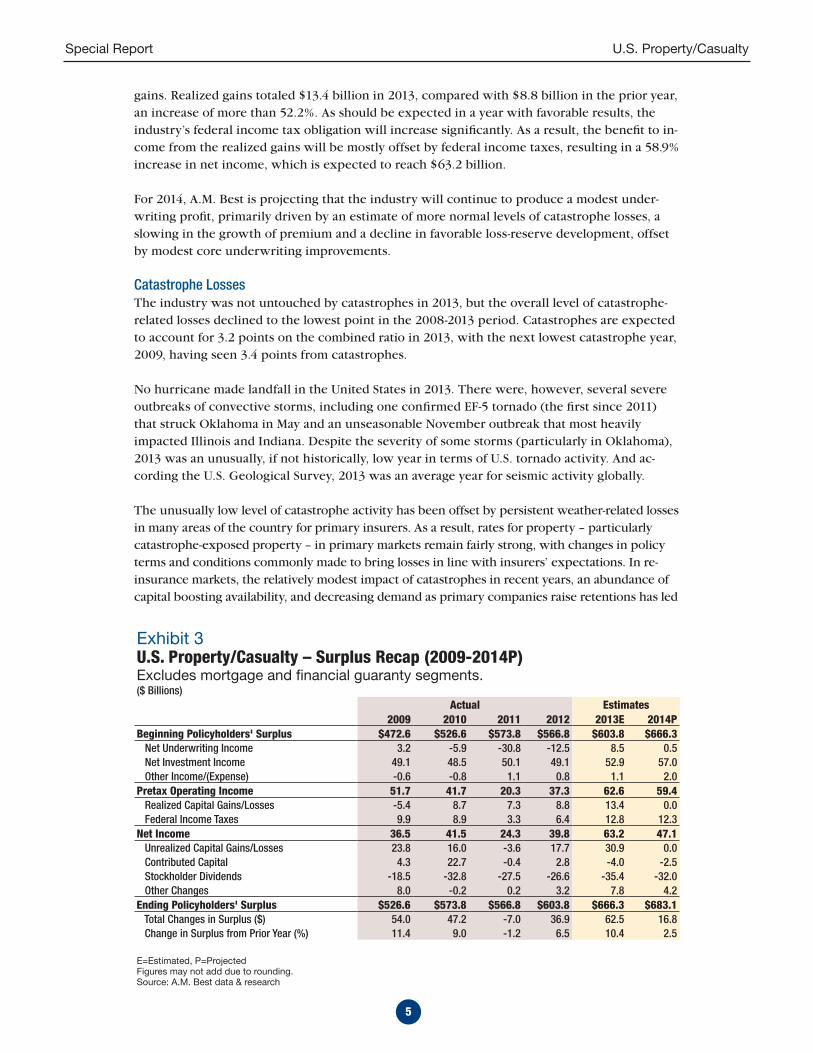
A.M. Best estimates that after declining modestly in 2012, net investment income increased in 2013, driven by an increase in invested assets and a 0.1-point increase in investment yield. Net investment income is projected to be $52.9 billion, a 7.9% increase from 2012 (see Exhibit 3). Pretax operating income thus is pro-jected at $62.6 billion, a 67.8% increase.
The rise in U.S. equity markets during 2013 provided insurers with opportunities to realize sig-nificant investment gains, which contributed to the net investment
Exhibit 2U.S. Property/Casualty – Combined Ratio Components (2009-2014P)Excludes mortgage and financial guaranty segments.($ Billions)
Net Premiums
Written (NPW)
NPW Growth
(%)
Loss Ratio
(%)
Loss-Adjustment
Expense Ratio
(%)
Under-writing
Expense Ratio
(%)
Dividend Ratio
(%)
Combined Ratio
(%) 2009 $422.8 -3.6 58.3 12.5 28.1 0.6 99.52010 427.3 1.0 59.6 12.6 28.3 0.7 101.22011 442.2 3.5 65.6 12.7 27.9 0.6 106.72012 461.9 4.4 60.9 12.4 28.2 0.6 102.22013E 483.8 4.8 57.3 12.1 27.6 0.6 97.62014P 503.0 4.0 58.9 12.2 27.7 0.6 99.4
E=Estimated, P=ProjectedSource: A.M. Best data & research
5
Special Report U.S. Property/Casualty
gains. Realized gains totaled $13.4 billion in 2013, compared with $8.8 billion in the prior year, an increase of more than 52.2%. As should be expected in a year with favorable results, the industry’s federal income tax obligation will increase significantly. As a result, the benefit to in-come from the realized gains will be mostly offset by federal income taxes, resulting in a 58.9% increase in net income, which is expected to reach $63.2 billion.
For 2014, A.M. Best is projecting that the industry will continue to produce a modest under-writing profit, primarily driven by an estimate of more normal levels of catastrophe losses, a slowing in the growth of premium and a decline in favorable loss-reserve development, offset by modest core underwriting improvements.
Catastrophe LossesThe industry was not untouched by catastrophes in 2013, but the overall level of catastrophe-related losses declined to the lowest point in the 2008-2013 period. Catastrophes are expected to account for 3.2 points on the combined ratio in 2013, with the next lowest catastrophe year, 2009, having seen 3.4 points from catastrophes.
No hurricane made landfall in the United States in 2013. There were, however, several severe outbreaks of convective storms, including one confirmed EF-5 tornado (the first since 2011) that struck Oklahoma in May and an unseasonable November outbreak that most heavily impacted Illinois and Indiana. Despite the severity of some storms (particularly in Oklahoma), 2013 was an unusually, if not historically, low year in terms of U.S. tornado activity. And ac-cording the U.S. Geological Survey, 2013 was an average year for seismic activity globally.
The unusually low level of catastrophe activity has been offset by persistent weather-related losses in many areas of the country for primary insurers. As a result, rates for property – particularly catastrophe-exposed property – in primary markets remain fairly strong, with changes in policy terms and conditions commonly made to bring losses in line with insurers’ expectations. In re-insurance markets, the relatively modest impact of catastrophes in recent years, an abundance of capital boosting availability, and decreasing demand as primary companies raise retentions has led
Exhibit 3U.S. Property/Casualty – Surplus Recap (2009-2014P)Excludes mortgage and financial guaranty segments.($ Billions)
Actual Estimates2009 2010 2011 2012 2013E 2014P
Beginning Policyholders' Surplus $472.6 $526.6 $573.8 $566.8 $603.8 $666.3 Net Underwriting Income 3.2 -5.9 -30.8 -12.5 8.5 0.5 Net Investment Income 49.1 48.5 50.1 49.1 52.9 57.0 Other Income/(Expense) -0.6 -0.8 1.1 0.8 1.1 2.0Pretax Operating Income 51.7 41.7 20.3 37.3 62.6 59.4 Realized Capital Gains/Losses -5.4 8.7 7.3 8.8 13.4 0.0 Federal Income Taxes 9.9 8.9 3.3 6.4 12.8 12.3Net Income 36.5 41.5 24.3 39.8 63.2 47.1 Unrealized Capital Gains/Losses 23.8 16.0 -3.6 17.7 30.9 0.0 Contributed Capital 4.3 22.7 -0.4 2.8 -4.0 -2.5 Stockholder Dividends -18.5 -32.8 -27.5 -26.6 -35.4 -32.0 Other Changes 8.0 -0.2 0.2 3.2 7.8 4.2Ending Policyholders' Surplus $526.6 $573.8 $566.8 $603.8 $666.3 $683.1 Total Changes in Surplus ($) 54.0 47.2 -7.0 36.9 62.5 16.8 Change in Surplus from Prior Year (%) 11.4 9.0 -1.2 6.5 10.4 2.5
E=Estimated, P=ProjectedFigures may not add due to rounding.Source: A.M. Best data & research

6
Special Report U.S. Property/Casualty
to an increasingly competitive environment for property catastrophe coverage.
A.M. Best has estimated a return to more normal levels of losses from catastrophes in 2014, with the projected combined ratio reflecting 4.6 points of catastrophe losses for the industry overall.
Loss-Reserve DevelopmentAfter declining for several years, favorable development of prior years’ loss reserves is expected to hold steady, with net reserve development of 3.0 combined ratio points. This includes 0.5 points of adverse development of reserves for asbestos and environmental (A&E) claims, offsetting 3.5 points of favorable development of core loss reserves. The industry is expected to post approximately $16.5 billion in favorable development of core reserves, with adverse development of $2.6 billion of A&E reserves, resulting in a total of $13.9 billion of overall favorable development. This compares with $13.6 billion of overall favorable reserve development in 2012.
In late 2013, several midsize commercial insurance groups announced significant charges to in-crease prior years’ loss reserves. As a result, one of those companies is in the process of being acquired, while other ratings have been downgraded. More commercial lines companies were downgraded in 2013 for loss-reserve issues than for any other reason.
Increasing rates should make pricing more adequate for more recent years’ business, yet A.M. Best remains concerned that core, undiscounted reserves remain insufficient to meet the ultimate losses for their respective accident years. While increased prices in recent years are expected to provide most insurers with an opportunity to increase reserves and avoid overall deficiencies, others will be challenged to achieve sufficient reserves and adequate prices, as was demonstrated by the events in late 2013.
A.M. Best expects more companies – particularly in commercial lines – to ultimately increase reserves to reflect inadequate pricing and overly optimistic assumptions used in establishing reserves, particularly for the 2008 through 2010 accident years. Overall, A.M. Best maintains that the insurers that will best profit under improved market conditions are those that have consistently maintained a conservative reserve philosophy.
Policyholders’ Surplus
Exhibit 4U.S. Property/Casualty – Segment Indicators (2012-2014P)Excludes mortgage and financial guaranty segments.
Personal Lines SegmentCommercial Lines
SegmentU.S. Reinsurance
Segment2012 2013E 2014P 2012 2013E 2014P 2012 2013E 2014P
Change in NPW (%) 3.7 4.4 4.0 5.0 4.8 4.1 7.4 7.5 3.0Change in Policyholders' Surplus (PHS) (%) 5.7 15.2 5.6 5.2 6.3 0.7 10.8 10.7 0.9Combined Ratio (Reported) 101.3 98.2 99.2 104.4 98.3 99.9 94.2 86.5 96.8 Less: Catastrophe Losses 7.4 3.9 5.0 7.4 2.5 4.0 9.4 1.8 5.0 Less: A&E Losses 0.1 0.1 0.1 1.2 1.0 1.0 0.7 1.2 1.2Combined Ratio (Normalized) 93.9 94.3 94.2 95.8 94.8 94.9 84.0 83.5 90.6Accident Year Combined Ratio (Normalized)1 96.4 97.0 96.9 100.3 98.3 97.8 90.2 93.3 91.8Change in Net Investment Income (%) 0.2 12.2 14.4 -4.2 7.1 3.6 1.2 3.7 8.8Investment Yield (%) 3.2 3.3 3.4 3.7 3.7 3.7 4.1 3.9 4.0After-Tax Return on Surplus (ROE) (%) 5.6 7.8 6.2 7.4 11.9 7.8 6.7 7.6 6.2NPW/PHS (Reported) 1.1 1.0 1.0 0.7 0.7 0.8 0.2 0.2 0.2
E=Estimated, P=Projected1 Normalized accident-year combined ratio adjusted to exclude prior-year core reserve development, which excludes A&E losses.Source: A.M. Best data & research

7
Special Report U.S. Property/Casualty
Policyholders’ surplus (PHS) reached an estimated record level of $666.3 billion in 2013, up 10.9% from its year-end 2012 level of $603.8 billion, driven by the industry’s improved operating performance. After declining in 2012, stockholder dividends rebounded strongly in 2013 and are estimated to reach $35.4 billion, up from $26.6 billion in 2012. This will offset the surplus benefit of $30.9 billion in unrealized capital gains posted in 2013, driven primarily by the rise in U.S. equity markets. Nevertheless, 2013’s strong level of net income drove the first double-digit growth in surplus since 2009 and is expected to send after-tax return on surplus to 9.5%, the highest in several years.
Given the strong growth in surplus, underwriting leverage measures declined slightly in 2013, reflecting the extent to which surplus grew faster than premiums. The NPW-to-PHS ratio de-clined to 0.7x from 0.8X, indicating strengthening of the industry’s balance sheet.
While the relatively low level of catastrophe losses aided 2013 results, the industry appears to be maintaining focus on underwriting profitability as it faces continuing challenges from the investment environment. With continued underwriting profits, the industry is expected to achieve a new record level of surplus in 2014.
Personal LinesA.M. Best continues to maintain a stable outlook for the personal lines segment. The improve-ment in the segment that began in 2012 gained further momentum in 2013. As a result, the personal lines segment is expected to report increased PHS, improved net income and higher premium volume, as well as lower combined and loss ratios.
The favorable results in 2013 were driven primarily by stable results in the automobile line and a decrease in weather-related events, which resulted in significant improvement in the homeowners line. In terms of hurricanes, 2013 was the mildest year in the past 48. However, a number of severe tornado events impacted this line, which continues to face challenges from frequent and severe weather-related events, despite the modest impact of these events in 2013.
The personal lines segment continues to maintain generally robust risk-adjusted capitalization, driven by relatively modest underwriting leverage and consistent, albeit modest, overall net
Exhibit 5U.S. Property/Casualty – Product Line Underwriting Trends (2009-2014P)
Net Premiums Written Combined Ratios2013E Actual Estimates
Product Line1 Share Growth 2009 2010 2011 2012 2013E 2014PPrivate Passenger Auto 37.6% 4.2% 101.3 101.0 102.0 102.1 100.8 100.5 Homeowners & Farmowners Multi Peril 16.1 4.4 105.7 106.9 122.1 103.9 94.0 97.5 Workers Compensation 10.0 9.7 108.3 116.5 118.6 111.2 105.0 104.5 Other & Products Liability2 8.7 6.1 107.0 110.8 99.6 103.2 97.6 97.6 Commercial Multi Peril 7.1 5.6 96.9 100.1 113.2 105.1 92.1 98.6 Commercial Auto 5.8 5.7 99.1 97.8 103.4 106.8 104.1 102.6 Fire & Allied Lines3 5.4 -1.5 79.8 82.3 102.3 102.3 82.2 92.2 Inland Marine 2.2 8.1 89.3 86.2 97.1 96.1 86.2 89.9 Medical Professional Liability 1.7 -2.0 85.0 82.0 87.9 93.3 95.5 98.9 All Other Lines4 5.4 0.0 98.1 106.1 112.7 99.4 105.1 104.1 Total All Lines5 100.0% 4.8% 99.5 101.2 106.7 102.2 97.6 99.4
E=Estimated, P=Projected1 Source: Best’s Statement File Supplement - Insurance Expense Exhibit (IEE) - P/C, US (2009-2012)2 Other Liability includes professional liability, D&O, excess casualty/umbrella, environmental/pollution, general liability, and EPLI.3 Fire & Allied Lines includes earthquake, multiple peril crop, and federal flood.4 All Other Lines includes accident & health lines, mortgage guaranty, financial guaranty, ocean marine, aircraft, fidelity, surety, burglary & theft, boiler & machinery, credit, international, excess of loss reinsurance and miscellaneous.5 Source: A.M. Best data & research

8
Special Report U.S. Property/Casualty
income. Further, the segment and the industry as a whole benefitted from the sharp increase in U.S. equity markets in 2013.
As evidenced recently, year-to-year results always vary to some extent based on weather-related events. However, two main, overarching themes continue to impact the segment. The first is continued development of more sophisticated pricing across both the auto and homeowners lines. The second is the changing landscape of distribution and interaction with customers.
AutomobileOn the auto line, pricing sophistication continues to evolve, particularly regarding the development of usage-based insurance and the granularity that can be achieved in pricing by understanding the unique driving charac-teristics of each insured. Companies that continue to effectively use this technology are expected to build and maintain a considerable competitive advantage in personal auto insurance.
In addition, multichannel distribution remains an ongoing trend in the personal auto space. The ability to interact with potential and existing customers across a wide spec-trum of channels remains a key differentiator. Customers expect to interact with carriers whenever, however and wherever they want. Sometimes, this interaction is the self-service method, while at other times customers may seek varying levels of assistance. Importantly, customers continue to expect the ability to change the type of interaction (from self-service to full service and back), depending on circumstances. Carriers continue to seek ways to address consumers’ evolving expectations through strategic alternatives and technological investments.
Underlying these evolutionary trends in pricing and distribution is the stable year-over-year performance of personal auto. Loss-cost trends remain generally moderate, although there has been some pressure from medical and auto-repair costs. In addition, managing expenses remains important, particularly when considering the additional operational investments.
Operating expenses continue to reflect investment in automation and enhanced risk man-agement. These necessary expenses provide companies with more streamlined processes, improved risk management capabilities and the ability to react to the fast-paced market environment and satisfy an ever-changing customer base. These components are essential to remaining relevant in the market and potentially gaining a unique competitive advantage.
HomeownersIn 2013, the homeowners line received a much-needed reprieve from the catastrophe-related events of recent years, particularly 2011. Weather’s impact varies from year to year. In some years, frequency is the greatest challenge, while severity may create issues in other years. In the worst years, both present challenges. While there is considerable debate about the causes of the erratic and volatile weather patterns over the past few years, they are expected to persist.
Although weather-related losses were much improved in 2013, the year was not without mate-rial weather events. This allowed companies to analyze the effectiveness of corrective actions implemented in prior years. These actions include mandatory wind/hail deductibles, increased peril deductibles, minimum percentage hurricane deductibles and roof limitations based on
Exhibit 6U.S. Property/Casualty – Personal Lines Segment Key Figures (2012–2014P)($ Billions) 2012 2013E 2014PNet Premiums Written $237.6 $248.0 $257.9 Underwriting Gain/(Loss) -4.2 2.9 0.6Net Income 11.8 18.8 15.9Policyholders' Surplus 209.7 241.6 255.0After-Tax Return on Surplus (%) 5.6 7.8 6.2
E=Estimated, P=ProjectedSource: A.M. Best data & research

9
Special Report U.S. Property/Casualty
the roof’s age and condition. In addition, while the pace of rate increases has slowed, they continued through 2013. The adoption of more formal and comprehensive risk management initiatives has in part offset the continued frequency and severity in this line. Additionally, overall losses have been mitigated in part by improved geo-coding, a greater understanding of risk concentrations and adherence to stricter underwriting guidelines.
Most important, segmented pricing through the development of by-peril pricing algorithms and greater granularity has become more established. As a result, homeowners carriers in many cases appear to have moved from risk avoidance to a better understanding of risk and pricing. Although granular pricing is inherently more difficult than in personal auto, given the less homogenous nature of the homeowners line, increased efforts to reduce volatility via implementation of these programs continue.
Rating TrendsIn recent years, most negative rating actions in the per-sonal lines segment were taken on geographically concen-trated carriers writing predominantly homeowners’ and nonstandard auto. In the personal lines segment, there were 24 downgrades and 15 upgrades in 2013 (see Exhib-it 7). On a year-over-year basis, downgrades fell sharply from 39 in 2012, while upgrades slightly increased (from 12 in 2012). Companies upgraded in 2013 were predomi-nantly homeowners writers that demonstrated improved risk management and consistently favorable long-term operating results. Also, corrective ac-tions implemented in prior years by homeowners carriers continue to gain traction, and rate increases continue to be earned.
The reduction in downgrades is due to the continued improvement in risk management and milder weather conditions. In 2013, a number of downgrades were of small auto carriers, particularly in the nonstandard segment. The auto line continues to be profitable, but scale and managing expenses are becoming increasingly important. In addition, the nonstandard auto niche saw a particularly negative impact from the overall economic environment.
Exhibit 7U.S. Personal Lines Segment – Financial Strength Rating Changes (2013)
Rating Action Rating Units1
Upgrades 15Downgrades 24
1 Totals are for U.S. personal lines insurers rated by A.M. Best.Source: A.M. Best data & research
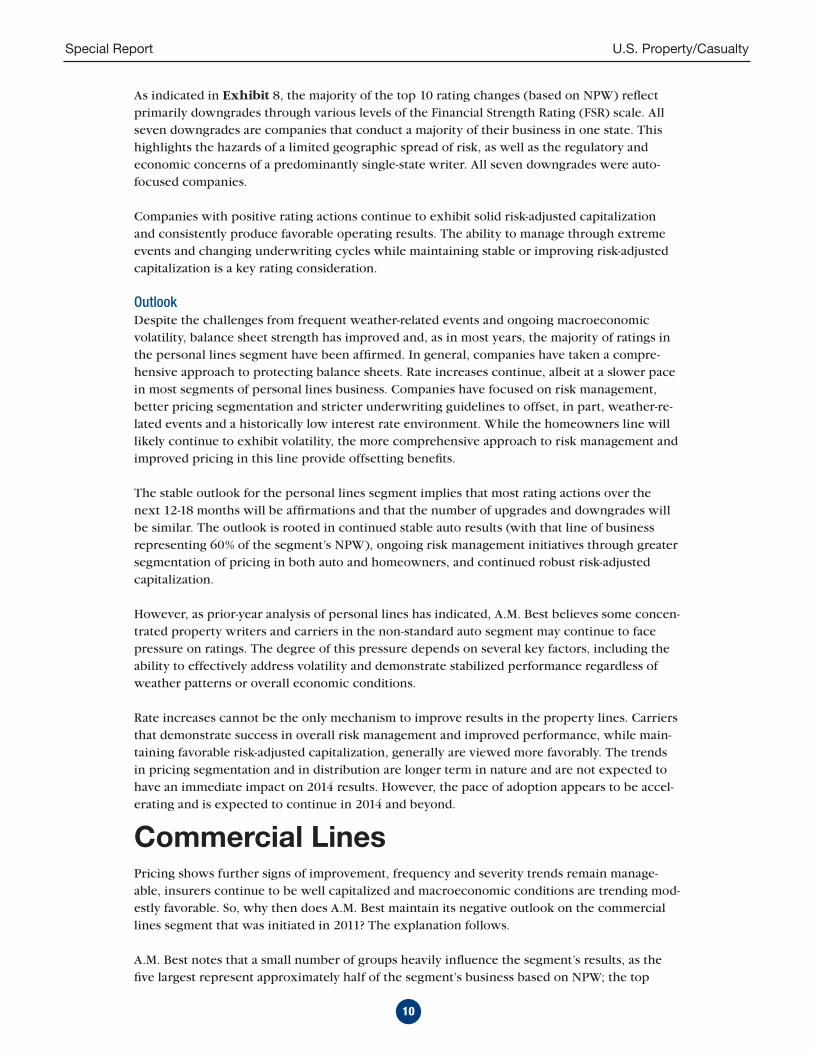
Exhibit 8U.S. Personal Lines – Rating Changes (2013)Ten largest writers upgraded or downgraded, ranked by 2012 net premiums written.($ Thousands)
Rating Change1 Company
2012 Net Premiums Written
Best’s Financial Strength Rating2 Previous Rating
- Auto Club Group3 $1,748,306 A- A + State Farm Florida Ins Co 597,257 B+ B- - Palisades Group3 587,411 B+ B++ - United Farm Bureau of IN Group3 521,158 B++ A- - Hastings Mutual Insurance Co 328,710 A A+ - Virginia Farm Bureau Group3 237,336 B++ A- - Affirmative Insurance Group3,4 170,540 C- C + Mississippi Farm Bureau Casualty 151,337 A- B++ + Nodak Mutual Group3 118,578 A A- - Founders Insurance Group3 87,669 B++ A-
1 (+) Rating upgrade; (-) Rating downgrade2 For Best's Rating criteria and definitions, visit www.ambest.com. Ratings as of Jan. 29, 2014.3 The rating indicated is assigned to operating companies within the group.4 Concurrent with the April 26, 2013 downgrade, the rating was withdrawn. The rating was NR as of that date.Source: A.M. Best data & research
10
Special Report U.S. Property/Casualty
As indicated in Exhibit 8, the majority of the top 10 rating changes (based on NPW) reflect primarily downgrades through various levels of the Financial Strength Rating (FSR) scale. All seven downgrades are companies that conduct a majority of their business in one state. This highlights the hazards of a limited geographic spread of risk, as well as the regulatory and economic concerns of a predominantly single-state writer. All seven downgrades were auto-focused companies.
Companies with positive rating actions continue to exhibit solid risk-adjusted capitalization and consistently produce favorable operating results. The ability to manage through extreme events and changing underwriting cycles while maintaining stable or improving risk-adjusted capitalization is a key rating consideration.
OutlookDespite the challenges from frequent weather-related events and ongoing macroeconomic volatility, balance sheet strength has improved and, as in most years, the majority of ratings in the personal lines segment have been affirmed. In general, companies have taken a compre-hensive approach to protecting balance sheets. Rate increases continue, albeit at a slower pace in most segments of personal lines business. Companies have focused on risk management, better pricing segmentation and stricter underwriting guidelines to offset, in part, weather-re-lated events and a historically low interest rate environment. While the homeowners line will likely continue to exhibit volatility, the more comprehensive approach to risk management and improved pricing in this line provide offsetting benefits.
The stable outlook for the personal lines segment implies that most rating actions over the next 12-18 months will be affirmations and that the number of upgrades and downgrades will be similar. The outlook is rooted in continued stable auto results (with that line of business representing 60% of the segment’s NPW), ongoing risk management initiatives through greater segmentation of pricing in both auto and homeowners, and continued robust risk-adjusted capitalization.
However, as prior-year analysis of personal lines has indicated, A.M. Best believes some concen-trated property writers and carriers in the non-standard auto segment may continue to face pressure on ratings. The degree of this pressure depends on several key factors, including the ability to effectively address volatility and demonstrate stabilized performance regardless of weather patterns or overall economic conditions.
Rate increases cannot be the only mechanism to improve results in the property lines. Carriers that demonstrate success in overall risk management and improved performance, while main-taining favorable risk-adjusted capitalization, generally are viewed more favorably. The trends in pricing segmentation and in distribution are longer term in nature and are not expected to have an immediate impact on 2014 results. However, the pace of adoption appears to be accel-erating and is expected to continue in 2014 and beyond.
Commercial LinesPricing shows further signs of improvement, frequency and severity trends remain manage-able, insurers continue to be well capitalized and macroeconomic conditions are trending mod-estly favorable. So, why then does A.M. Best maintain its negative outlook on the commercial lines segment that was initiated in 2011? The explanation follows.
A.M. Best notes that a small number of groups heavily influence the segment’s results, as the five largest represent approximately half of the segment’s business based on NPW; the top
11
Special Report U.S. Property/Casualty
20 groups account for more than 70%. The remainder of the sector is expected to feel most strongly the effects of the ongoing competitive environment, still low but improving invest-ment yields and the potential for future adverse development of loss reserves, given prior-year soft market conditions. The negative outlook indicates that while the majority of ratings are expected to be affirmed over the next 12-18 months, downgrades will outnumber upgrades for the more than 400 rating units that comprise the commercial lines segment.
While market conditions have improved in recent years, A.M. Best believes the improvement in underwriting results will not be sufficient to surmount the current return dynamics in fixed-income markets. Furthermore, insurers’ calendar-year results have not recognized the loss-reserve shortfalls that A.M. Best estimates a number of companies accrued during the soft market period. While the segment’s current accident-year results are expected to show im-provement in 2013 and 2014 as a result of rate and exposure growth in those years, the benefi-cial effect of favorable development of prior years’ loss reserves will diminish.
A.M. Best believes the majority of commercial lines companies’ balance sheets are strong. How-ever, reserve shortfalls may be too significant for some companies to maintain their ratings. The potential for underfunding loss reserves and its effect on insurers’ ratings remain a critical issue for A.M. Best. The continuation of the negative outlook largely reflects this challenge.
During 2013, commercial lines’ NPW increased, in large part driven by gains in exposure and pricing realized on workers’ comp and other liability, the segment’s two largest lines. Surplus kept pace with premium growth as investment results improved, reflecting realized and unre-alized gains generated primarily by the rally in U.S. equity markets. Loss-reserve development was favorable overall, although down from 2012.
During 2014, growth in surplus is expected to remain flat, as A.M. Best does not project changes in capital gains, which were a significant contributor to the surplus increase in 2013. And, notwithstanding the minimal reduction in quantitative easing, interest rates are expected to remain low relative to historical levels. Insurers will need to adopt a long-term approach to their business that addresses inadequate reserves and compensates for depressed invest-ment returns. These business plans should have improved focus on usage of data and a clearly defined risk tolerance.
Given low interest rates and the potential need to bolster loss reserves for older accident years, the need for profitable underwriting is paramount. Better risk determination, aided by the use of predictive modeling, likely will drive improved underwriting performance. The industry appears to be adopting predictive modeling in a similar fashion to enterprise risk manage-ment programs, with larger commercial lines insurers that can access more data and leverage technology being among the early adopters. As the benefits became clearer and more robust technology became more readily available, other companies – particularly those with niches in relatively homogenous lines – also have adopted them. In some lines, the use of predictive modeling has reached a point where insurers not using these products will be vulnerable in the marketplace.
Successful insurers will be those that leverage data, technology and talent in ways that opti-mize profits and that differentiate themselves through innovative products and better risk man-agement, pricing metrics, speed and efficiency. Establishing appropriate reserves, maintaining conservative portfolio allocations and consistently applying underwriting guidelines, pricing and policy terms and conditions will remain hallmarks of the most successful commercial lines insurers.

12
Special Report U.S. Property/Casualty
PricingMarket conditions gradually improved beginning in mid-2011, as companies benefitted from better pricing and an increase in exposures, particularly as the recovering economy bolstered
construction and other businesses initially hit hard by the recession. In late 2012 and through 2013, the pace of rate increases improved, causing NPW to grow an estimated 4.8% in 2013 (see Exhibit 9). In 2014, A.M. Best expects prices to continue improving for select markets; however, the pace of rate increases generally is expected to be slower in 2014 than in 2013. For some lines, particularly non-catastrophe exposed property, rates may decline. This reflects the segment’s robust capital levels and the potential re-emergence of competitive pressure on pric-ing. As the standard market improves, A.M. Best also expects “fringe” classes of business that were priced in the admitted market during the most recent soft market – particularly certain general liability and property classes
– to return to the excess and surplus lines market at substantially higher prices and tighter terms and conditions.
CatastrophesCatastrophe experience in 2013 was relatively low, although losses from spring convective storms in the Midwest were substantial. The industry benefitted from the reduced level of losses, especially when compared with 2011’s record level of losses from both U.S. and international exposures and 2012’s Superstorm Sandy, which ranks among the largest single loss events in the industry’s history.
For the commercial lines segment, catastrophe losses in 2013 totaled $5.0 billion and ac-counted for 2.5 points on the combined ratio. For 2014, A.M. Best has estimated an “aver-age” level of catastrophe activity, amounting to 4.0 points on the combined ratio.
Loss ReservesLoss reserves are a critical component of the commercial lines segment’s returns, as they account for about twice the segment’s earned premium compared with personal lines, for which loss reserves are about 60% of earned premium. Additionally, the largest risk factor on a commercial lines balance sheet is typically loss-reserve adequacy.
In 2013, commercial lines writers recorded favorable reserve development (including adverse development of reserves for asbestos and environmental losses) equating to 2.5 points on the segment’s combined ratio, compared with 3.3 points in 2012. A.M. Best believes the favorable development recognized will continue to decline and may reach a point at which the segment will not, in total, be able to further reduce prior-year loss reserves. However, A.M. Best expects commercial insurers to continue posting reserve releases in 2014, despite A.M. Best’s position that reserves are currently deficient.
As A.M. Best has advised, the competitive operating environment, coupled with lower levels of re-dundancies on older accident years, has led to lower levels of reserve development on average. A.M. Best believes insurers that have maintained conservative reserve levels will have a competitive ad-vantage, as the recognition of development will not weaken surplus and underwriting performance.
Mergers and AcquisitionsThe level of merger and acquisition activity in recent years has been lower than might be expected, given the segment’s capital position. Reaching agreed-upon valuations is cited
Exhibit 9U.S. Property/Casualty – Commercial Lines Segment Key Figures (2012–2014P)($ Billions) 2012 2013E 2014PNet Premiums Written 196.8 206.3 214.7 Underwriting Gain/(Loss) -9.7 2.1 -1.0Net Income 19.4 33.2 22.0Policyholders' Surplus 263.0 279.6 281.7After-Tax Return on Surplus (%) 7.4 11.9 7.8
E=Estimated, P=ProjectedSource: A.M. Best data & research

13
Special Report U.S. Property/Casualty
as an issue, with sellers unable to obtain prices they believe are fair. Given concerns over potential adverse reserve development, buyers are uneasy about paying for “someone else’s problems.” As a result, many public companies have opted to manage their capital posi-tions through share buyback programs. However, the opportunity for strategic acquisitions may increase as prior-year loss-reserve issues begin to impact some companies’ balance sheets and those management teams exhaust all other avenues to improve their business.
Rating TrendsDespite challenges from low investment yields and ongoing macroeconomic factors, the majority of commercial lines insurers had their ratings affirmed in 2013. These rating ac-tions primarily reflected the commercial lines insurers’ strong risk-adjusted capital posi-tions, supported by improved underwriting and operating profitability.
Upgrades outpaced downgrades over the past 12 months (see Exhibit 10); however, when those companies that were upgraded follow-ing an acquisition are removed from consideration, there were more downgrades than upgrades. Favorable operating results and improved risk-adjusted capital were the most common reasons for upgrades unre-lated to acquisitions.
The most common reason cited for the downgrades in 2013 was adverse development of loss reserves; the second most common reason was reductions in risk-adjusted capital, caused in some cir-cumstances by reserve changes. This further supports A.M. Best’s continued concern regarding the effect of loss-reserve development on ratings in the com-mercial lines segment.
CapitalizationDespite the negative outlook, A.M. Best recognizes commercial insurers’ strong capitaliza-tion, even after considering loss-reserve adequacy. For many commercial lines insurers, A.M. Best expects balance sheets will continue to be right-sized in 2014 as insurers con-tinue to return capital to stockholders through dividends and share repurchases.
Exhibit 10U.S. Commercial Lines – Financial Strength Rating Changes (2013)Rating Action Rating Units1
Upgrades 24Downgrades 18
1 Totals are for U.S. commercial lines insurers rated by A.M. Best.Source: A.M. Best data & research
Exhibit 11U.S. Commercial Lines – Rating Changes (2013)Ten largest writers upgraded or downgraded, ranked by 2012 net premiums written.($ Thousands)
Rating Change 1 Company
2012 Net Premiums Written
Best's Financial Strength Rating2 Previous Rating
+ EMC Insurance Companies3 $1,350,369 A A- - Meadowbrook Insurance Group3 797,502 B++ A- + Safety National Group3 550,810 A+ A + FCCI Insurance Group3 492,207 A A- + ProAssurance Group3 438,085 A+ A + ISMIE Mutual Group3 242,192 A- B++ - SeaBright Insurance Company 226,657 B++ A- u+ North American Casualty Group3 170,246 A+ A + First of Hawaii Group3 148,667 A+ A + Mid-Continent Group3 138,100 A+ A
1 (+) Rating upgrade; (-) Rating downgrade2 For Best’s Rating criteria and definitions, visit www.ambest.com. Ratings as of Jan. 29, 2014.3 The rating indicated is assigned to operating companies within the group.Source: A.M. Best data & research
14
Special Report U.S. Property/Casualty
This view of capitalization also considers A.M. Best’s view of loss-reserve adequacy in the sec-tor. While the balance sheets of commercial insurers appear able to absorb shortfalls in prior-year reserves, adverse loss-reserve development for some insurers may be problematic. This should not be an issue for the vast majority of commercial lines insurers.
U.S. & Bermuda ReinsuranceThe global reinsurance sector, which includes the United States and Bermuda markets, has been broadly characterized as overcapitalized. It is true that risk-adjusted capital is very strong, but the focus on fundamentals has led to this level. Executive management teams have main-tained prudent underwriting and pricing, expecting to be paid adequately for the risks they take. Appropriate reserving also has contributed to the market’s strength, with many reinsur-ance companies taking advantage of redundant reserves to augment earnings through a period of diminishing underwriting and investment opportunities.
Traditional reinsurance companies generally have maintained conservative overall investment allocations, keeping a large percentage of investments in highly rated, fixed-income securi-ties. However, there are subtle shifts, with cautious migration toward alternative investments, hedge funds and equities as reinsurers continue searching for adequate investment returns. Fine-tuning investment allocations is a challenge as yields linger at historic lows, which ap-pears likely to continue for the next few years.
Below the surface, potentially seismic shifts are taking place in the reinsurance industry, with property catastrophe focused reinsurers most affected. These niche companies are feeling the first effects and experiencing the greatest shift.
Traditional reinsurers are flush with capital as a result of successfully managing exposures in recent years. A.M. Best views this as a positive from the perspective of policyholder protec-tion. However, too much capital chasing the same opportunities puts pressure on pricing. This has been exacerbated by an increased flow of capital from third-party investors (such as hedge funds and pension funds) in the form of alternative capacity, thus putting further pressure on pricing in the overall reinsurance segment. Third-party capital tends to look for opportunities in the higher layers of catastrophe programs, which typically are breached only in the most extreme circumstances.
While the supply of available capital has increased, demand for reinsurance has decreased, with primary companies retaining more risk every year. This decreases the pool of risk avail-able to reinsurers. It also tends to concentrate increasingly “risky” business in that pool.
With third-party capital taking the higher layer exposures and primary companies increasing their retentions, reinsurance compa-nies seem stuck in the middle. Most industry observers seem to agree that the reinsurance market may be at an inflection point.
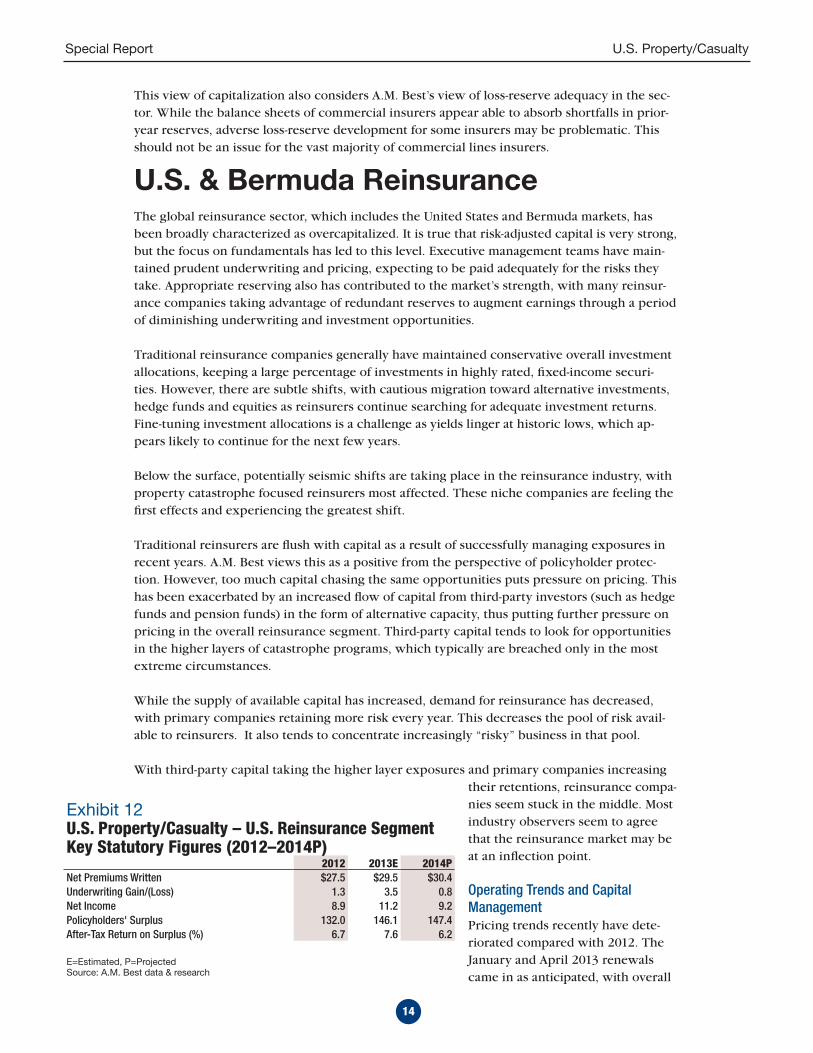
Operating Trends and Capital ManagementPricing trends recently have dete-riorated compared with 2012. The January and April 2013 renewals came in as anticipated, with overall
Exhibit 12U.S. Property/Casualty – U.S. Reinsurance Segment Key Statutory Figures (2012–2014P) 2012 2013E 2014PNet Premiums Written $27.5 $29.5 $30.4 Underwriting Gain/(Loss) 1.3 3.5 0.8Net Income 8.9 11.2 9.2Policyholders' Surplus 132.0 146.1 147.4After-Tax Return on Surplus (%) 6.7 7.6 6.2
E=Estimated, P=ProjectedSource: A.M. Best data & research

15
Special Report U.S. Property/Casualty
rates remaining stable. However, the June and July renewals experienced some pressure from excess capacity in the market and declining demand for reinsurance. Pricing for property contracts during the January 2014 renewals was off another 10% to 15%. While other classes are flat to down, concessions on contract terms and conditions, including greater ceding commissions, have reduced the net premiums that will flow to reinsurers.
Excess capacity and the lack of significant catastrophe losses have negatively impacted pricing; however, reinsurers are still able to find opportunities in certain classes of business despite intense competition as supply outweighs demand. Barring any market-changing event, traditional reinsur-ance companies will have to remain vigilant in their underwriting and capital management strate-gies to compete effectively over the long term. Capital management today involves managing both on-balance-sheet and off-balance-sheet capital. For on-balance-sheet capital, companies in recent years have been lowering their cost of capital by refinancing debt and rightsizing their capital bases, mostly through share repurchases given market opportunities.
A.M. Best expects share repurchases to run between 50% and 75% of net income for the global reinsurance segment, depending on the level of catastrophe activity and share valua-tion. A relatively low level of catastrophes in 2013 helped drive earnings during the year. Share repurchase programs increased after hurricane season, during which reinsurers tend to hold more cash against potential loss payments. With share valuations near book value, reinsurers’ management teams continue to see value in repurchasing shares.
Managing off-balance-sheet capital is pressuring companies to think about the future and per-haps make some tactical shifts in their medium- to long-term strategies as management teams recognize the potential for seismic shifts.
For 2013, the U.S. & Bermuda composite is expected to post a solid return on equity of ap-proximately 12%. However, roughly 30% of pretax operating income is related to net favor-able reserve development, reinforcing the extent to which reinsurers’ current-year results are influenced substantially by the good times of the past. But while underwriting income reflects the segment’s price and form discipline, the sector’s net investment income has trended lower over the recent five-year period as low yields grind away at this source of earnings. While this industrywide trend has placed upward pressure on underlying casualty rates, reinsurers have not shared this benefit, as casualty reinsurance terms and conditions have remained intensely competitive. As a result, those organizations that have primary distribution capability have al-located more capacity to those platforms as reinsurance opportunities have waned.
Exhibit 13U.S. & Bermuda Reinsurance – Key GAAP Financial Indicators (2009-2014P)Based on a composite of interactively rated public insurance/reinsurance companies in the U.S. & Bermuda market.*
2009 2010 2011 2012 2013E 2014PNPW Growth (% Change) -2.4 4.5 4.6 3.1 9.7 2.5Loss & LAE Ratio 56.1 61.8 77.3 63.4 57.9 64.5Underwriting Expense Ratio 29.7 30.9 30.0 29.8 30.0 30.3Combined Ratio 85.8 92.7 107.3 93.1 87.9 94.8 Less: Favorable Loss Reserve Development -6.1 -6.2 -6.0 -5.8 -6.3 -4.0Accident Year Combined Ratio (Normalized) 91.9 98.9 113.4 98.9 94.2 98.8Change in Equity (%) 30.8 8.8 -2.5 8.5 -2.0 4.1Return on Equity (%) 16.0 11.9 1.0 10.6 11.3 8.1
E=Estimated, P=Projected* Excludes Berkshire Hathaway, Inc.Source: A.M. Best data & research

16
Special Report U.S. Property/Casualty
As the Federal Reserve continues to keep rates near historic lows to stimulate the economy, U.S. equity markets have continued to move higher. Despite this, reinsurance companies generally have not moved into the equity markets in a sizable manner. While some companies have made cautious forays into alternative investments, there is no significant shift in this direction, either. Instead, traditional reinsurance companies continue to maintain a disciplined and prudent invest-ment strategy. Despite reinsurance companies not participating as investors in the equity markets’ epic run-up in 2013, many of the publicly traded reinsurers have benefitted from improved price-to-book valuations as their own shares have increased in value.
The market is challenging, but global reinsurers, including U.S. & Bermuda, appear poised to post solid results for 2013, primarily due to the lack of large catastrophe losses. Conditions will remain competitive, as primary companies are expected to look to retain more business or receive higher ceding commissions for sharing their profitable business. Margins also will continue to compress as third-party capital seeks a larger piece of the pie. As a result, A.M. Best is forecasting underwriting performance to produce an average combined ratio of 94.8 and an average ROE of 8.1% in 2014, representing a continuation of difficult trading conditions, lack-luster investment returns and a normal level of catastrophe activity.
OutlookThe rating outlook for the global reinsurance segment remains stable, indicating that over the next 12 to 18 months, A.M. Best believes the majority of rating actions within the segment will be affirmations, with only a limited number of upgrades or downgrades.
The stable outlook is predicated on strong risk-adjusted capital, discerning enterprise risk man-agement and a slow improvement in the global economic environment underpinned by the United States, which represents the world’s largest insurance market.
Reinsurance companies continue to be disciplined on both the underwriting and investing sides, and net favorable loss-reserve development has cushioned deterioration in underwrit-ing margins and weakness in investment earnings. Risk-adjusted capital for global reinsurers remains excellent, and companies have the wherewithal to endure significant losses from a combination of events, including natural and man-made catastrophes and volatile financial market risks.
P/C Industry Loss & LAE Reserve Position Stabilizing, but Varies by LineLoss and loss-adjustment expense (LAE) reserves are typically the largest liability on a P/C insurer’s balance sheet. Underestimation of those liabilities can result in a material negative impact on the insurer’s reported surplus, potentially resulting in adverse rating action. Reserve changes not only affect the balance sheet, but can negatively impact A.M. Best’s view of an in-surer’s operating performance, management team and enterprise risk management capabilities.
Adverse reserve development is one of the leading causes of insurer insolvency, and reserve adequacy remains a critical rating issue for A.M. Best. Companies that have demonstrated a history of conservative reserving throughout the underwriting cycle should not be materi-ally affected in the analysis of their capital strength. However, companies that have a volatile history of reserve adequacy, or emphasized market share over rate adequacy in recent years, may have accumulated significant reserve deficiencies, and a charge for that deficiency will be incorporated into A.M. Best’s assessment of risk-adjusted capitalization using Best’s Capi-tal Adequacy Ratio (BCAR). Accordingly, A.M. Best’s view of an insurer’s reserve position can have a material impact on the assessment of an insurer’s capital strength.

17
Special Report U.S. Property/Casualty
Exhibit 14 shows a history of the industry’s reported adverse/(favorable) reserve develop-ment from prior accident years through 2012. A.M. Best expects the industry to report its eighth consecutive year of favorable reserve development for calendar year 2013. Based on A.M. Best’s internal reserve review of the industry, the industry reserve position strength-ened over the period 2002-2007. Since then, industry reserves have been weakening and are expected to continue doing so, although at a much lower rate. The industry reserves as of year-end 2013 are estimated to be only $2 billion weaker than those reported as of year-end 2012. The commercial lines segment is predicted to be the source of the weaken-ing reserve position at year-end 2013. The greatest changes are anticipated for the workers’ comp, other/products liability, and medical professional liability (MPL) lines.
For year-end 2013, A.M. Best estimates that the P/C total net loss and LAE reserve defi-ciency was $45 billion, consisting of a $34 billion deficiency on core reserves and an $11
Exhibit 14 U.S. Property/Casualty - Incurred Loss & Defense Cost Containment Development (2003-2012)One-year development for calendar years, accident years as of Dec. 31, 2012.Excludes mortgage and financial guaranty segments.($ Billions)
One-Year Reserve Development *Total AY
DevelopmentThrough 2012
AccidentYear (AY) 2003 2004 2005 2006 2007 2008 2009 2010 2011 2012Prior 14.6 21.6 26.4 11.4 9.7 4.4 6.6 6.1 1.9 3.0 $105.5 2003 (10.1) (3.4) (1.4) (0.8) (0.3) (0.3) (0.2) (0.2) (0.4) ($17.2)2004 (12.9) (4.6) (3.9) (2.6) (2.2) (1.0) (0.5) (0.6) ($28.3)2005 (9.4) (5.2) (3.9) (3.4) (2.0) (1.0) (0.7) ($25.7)2006 (8.4) (4.8) (3.7) (2.6) (2.0) (1.2) ($22.7)2007 (6.2) (4.5) (2.1) (2.4) (1.5) ($16.7)2008 (4.1) (2.6) (3.0) (1.4) ($11.2)2009 (5.6) (2.7) (1.5) ($9.8)2010 (3.5) (2.1) ($5.6)2011 (4.7) ($4.7)
2003 2004 2005 2006 2007 2008 2009 2010 2011 2012Total in Calendar Year 14.6 11.5 10.0 (4.1) (8.6) (13.4) (11.6) (10.0) (13.6) (11.0)* Positive values indicate adverse development; negative values are favorable.
(40)
(30)
(20)
(10)
0
10
20
30
2001 2002 2003 2004 2005 2006 2007 2008 2009 2010 2011 2012
$ B
illio
ns
Calendar Year Accident Year
Source: A.M. Best data & research
18
Special Report U.S. Property/Casualty
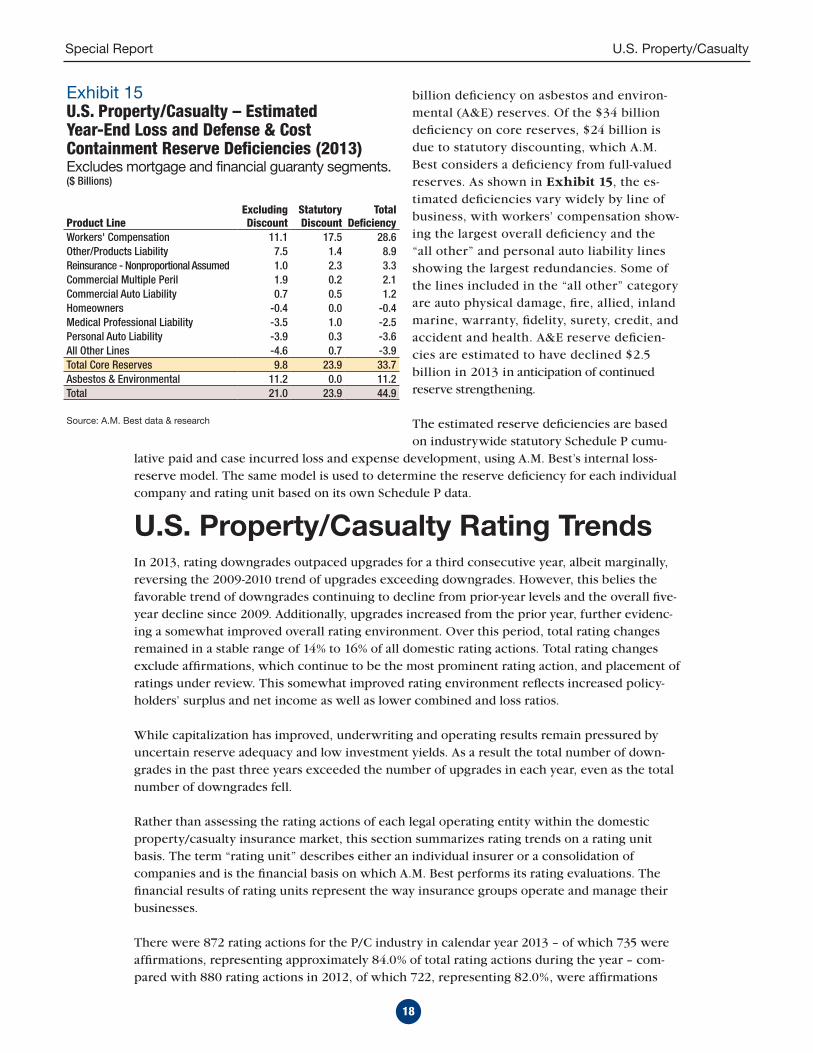
billion deficiency on asbestos and environ-mental (A&E) reserves. Of the $34 billion deficiency on core reserves, $24 billion is due to statutory discounting, which A.M. Best considers a deficiency from full-valued reserves. As shown in Exhibit 15, the es-timated deficiencies vary widely by line of business, with workers’ compensation show-ing the largest overall deficiency and the “all other” and personal auto liability lines showing the largest redundancies. Some of the lines included in the “all other” category are auto physical damage, fire, allied, inland marine, warranty, fidelity, surety, credit, and accident and health. A&E reserve deficien-cies are estimated to have declined $2.5 billion in 2013 in anticipation of continued reserve strengthening.
The estimated reserve deficiencies are based on industrywide statutory Schedule P cumu-
lative paid and case incurred loss and expense development, using A.M. Best’s internal loss-reserve model. The same model is used to determine the reserve deficiency for each individual company and rating unit based on its own Schedule P data.
U.S. Property/Casualty Rating TrendsIn 2013, rating downgrades outpaced upgrades for a third consecutive year, albeit marginally, reversing the 2009-2010 trend of upgrades exceeding downgrades. However, this belies the favorable trend of downgrades continuing to decline from prior-year levels and the overall five-year decline since 2009. Additionally, upgrades increased from the prior year, further evidenc-ing a somewhat improved overall rating environment. Over this period, total rating changes remained in a stable range of 14% to 16% of all domestic rating actions. Total rating changes exclude affirmations, which continue to be the most prominent rating action, and placement of ratings under review. This somewhat improved rating environment reflects increased policy-holders’ surplus and net income as well as lower combined and loss ratios.
While capitalization has improved, underwriting and operating results remain pressured by uncertain reserve adequacy and low investment yields. As a result the total number of down-grades in the past three years exceeded the number of upgrades in each year, even as the total number of downgrades fell.
Rather than assessing the rating actions of each legal operating entity within the domestic property/casualty insurance market, this section summarizes rating trends on a rating unit basis. The term “rating unit” describes either an individual insurer or a consolidation of companies and is the financial basis on which A.M. Best performs its rating evaluations. The financial results of rating units represent the way insurance groups operate and manage their businesses.
There were 872 rating actions for the P/C industry in calendar year 2013 – of which 735 were affirmations, representing approximately 84.0% of total rating actions during the year – com-pared with 880 rating actions in 2012, of which 722, representing 82.0%, were affirmations
Exhibit 15U.S. Property/Casualty – Estimated Year-End Loss and Defense & Cost Containment Reserve Deficiencies (2013)Excludes mortgage and financial guaranty segments.($ Billions)
Product LineExcluding Discount
Statutory Discount
Total Deficiency
Workers' Compensation 11.1 17.5 28.6Other/Products Liability 7.5 1.4 8.9Reinsurance - Nonproportional Assumed 1.0 2.3 3.3Commercial Multiple Peril 1.9 0.2 2.1Commercial Auto Liability 0.7 0.5 1.2Homeowners -0.4 0.0 -0.4Medical Professional Liability -3.5 1.0 -2.5Personal Auto Liability -3.9 0.3 -3.6All Other Lines -4.6 0.7 -3.9Total Core Reserves 9.8 23.9 33.7Asbestos & Environmental 11.2 0.0 11.2Total 21.0 23.9 44.9
Source: A.M. Best data & research
19
Special Report U.S. Property/Casualty
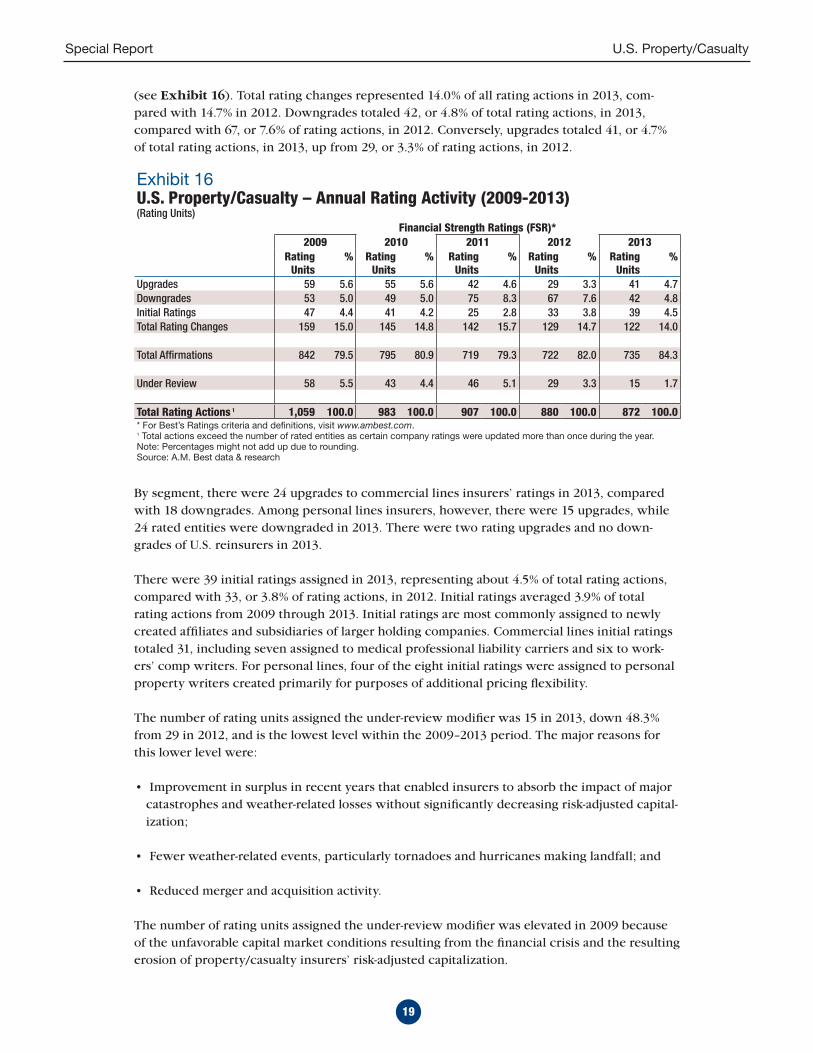
(see Exhibit 16). Total rating changes represented 14.0% of all rating actions in 2013, com-pared with 14.7% in 2012. Downgrades totaled 42, or 4.8% of total rating actions, in 2013, compared with 67, or 7.6% of rating actions, in 2012. Conversely, upgrades totaled 41, or 4.7% of total rating actions, in 2013, up from 29, or 3.3% of rating actions, in 2012.
By segment, there were 24 upgrades to commercial lines insurers’ ratings in 2013, compared with 18 downgrades. Among personal lines insurers, however, there were 15 upgrades, while 24 rated entities were downgraded in 2013. There were two rating upgrades and no down-grades of U.S. reinsurers in 2013.
There were 39 initial ratings assigned in 2013, representing about 4.5% of total rating actions, compared with 33, or 3.8% of rating actions, in 2012. Initial ratings averaged 3.9% of total rating actions from 2009 through 2013. Initial ratings are most commonly assigned to newly created affiliates and subsidiaries of larger holding companies. Commercial lines initial ratings totaled 31, including seven assigned to medical professional liability carriers and six to work-ers’ comp writers. For personal lines, four of the eight initial ratings were assigned to personal property writers created primarily for purposes of additional pricing flexibility.
The number of rating units assigned the under-review modifier was 15 in 2013, down 48.3% from 29 in 2012, and is the lowest level within the 2009–2013 period. The major reasons for this lower level were:
• Improvement in surplus in recent years that enabled insurers to absorb the impact of major catastrophes and weather-related losses without significantly decreasing risk-adjusted capital-ization;
• Fewer weather-related events, particularly tornadoes and hurricanes making landfall; and
• Reduced merger and acquisition activity.
The number of rating units assigned the under-review modifier was elevated in 2009 because of the unfavorable capital market conditions resulting from the financial crisis and the resulting erosion of property/casualty insurers’ risk-adjusted capitalization.
Exhibit 16U.S. Property/Casualty – Annual Rating Activity (2009-2013)(Rating Units)
Financial Strength Ratings (FSR)*2009 2010 2011 2012 2013
Rating Units
% Rating Units
% Rating Units
% Rating Units
% Rating Units
%
Upgrades 59 5.6 55 5.6 42 4.6 29 3.3 41 4.7Downgrades 53 5.0 49 5.0 75 8.3 67 7.6 42 4.8Initial Ratings 47 4.4 41 4.2 25 2.8 33 3.8 39 4.5Total Rating Changes 159 15.0 145 14.8 142 15.7 129 14.7 122 14.0
Total Affirmations 842 79.5 795 80.9 719 79.3 722 82.0 735 84.3
Under Review 58 5.5 43 4.4 46 5.1 29 3.3 15 1.7
Total Rating Actions 1 1,059 100.0 983 100.0 907 100.0 880 100.0 872 100.0* For Best’s Ratings criteria and definitions, visit www.ambest.com.1 Total actions exceed the number of rated entities as certain company ratings were updated more than once during the year. Note: Percentages might not add up due to rounding.Source: A.M. Best data & research

20
Special Report U.S. Property/Casualty
The under-review rating modifier typically is assigned after a material event, such as a merger or acquisition, or an abrupt change in financial condition from events such as recognition of re-serve charges, shock losses or capital infusions. The under-review modifier may have positive, negative or developing rating implications, depending on the nature of the event and its po-tential effect on the rated entity. After placing a rating under review, A.M. Best interacts with management to fully review the impact of the event before determining the ultimate effect on the rating. Generally, ratings remain under review for less than six months.
Rating actions on Issuer Credit Ratings (ICR), introduced for all rating units in 2007, are equal, in total, to the Financial Strength Rating (FSR) exhibit; however; there are differences in the numbers of upgrades and downgrades. An FSR may not change as a result of an upgrade or downgrade of an ICR because of the greater number of rating levels in the ICR Scale.
Rating DistributionThere were 859 property/casualty rating units that had letter rating assignments at year-end 2013, compared with 861 in 2012 (see Exhibit 18). The rating distribution based on rating units is the most accurate gauge of A.M. Best’s overall opinion of the financial health of the universe of rated P/C insurance companies.
A.M. Best’s FSR is an independent opinion of an insurer’s financial strength and ability to meet its ongoing insurance policy and contract obligations. The FSR scale is composed of 16 individ-ual ratings, grouped into 10 categories: three Secure categories of “Superior,” “Excellent” and “Good,” and seven Vulnerable categories of “Fair,” “Marginal,” “Weak,” “Poor,” “Under Regula-tory Supervision,” “In Liquidation” and “Suspended.”
The percentage of rated units considered secure was 91.4% at year-end 2013, slightly improved from 90.8% at year-end 2012 (see Exhibit 18). Both the number and percentage of secure ratings has trended downward over the past five years, driven primarily by the weakened macroeconomic environment and low investment yields that resulted from the 2008 financial crisis.
In addition to the fallout from the financial crisis, there were fewer secure ratings because of chal-lenging market conditions and elevated catastrophe-related losses, which resulted in operating earnings and risk-adjusted capitalization deteriorating for a number of companies. However, there is
Exhibit 17U.S. Property/Casualty – Annual Rating Activity (2009-2013)(Rating Units)
Issuer Credit Ratings (ICR)*2009 2010 2011 2012 2013
Rating Units
% Rating Units
% Rating Units
% Rating Units
% Rating Units
%
Upgrades 76 7.2 76 7.7 65 7.2 47 5.3 50 5.7Downgrades 57 5.4 52 5.3 78 8.6 82 9.3 49 5.6Initial Ratings1 47 4.4 41 4.2 25 2.8 33 3.8 39 4.5Total Rating Changes 180 17.0 169 17.2 168 18.5 162 18.4 138 15.8
Total Affirmations 821 77.5 771 78.4 693 76.4 689 78.3 719 82.5
Under Review 58 5.5 43 4.4 46 5.1 29 3.3 15 1.7
Total Rating Actions2 1,059 100.0 983 100.0 907 100.0 880 100.0 872 96.1* For Best’s Ratings criteria and definitions, visit www.ambest.com.1 2008 reflects formal roll-out by A.M. Best of Issuer Credit Ratings. 2 Total actions exceed the number of rated entities as certain company ratings were updated more than once a year.Note: Percentages might not add up due to rounding.Source: A.M. Best data & research

21
Special Report U.S. Property/Casualty
a noticeable decrease in the number of ratings in the Regulatory Supervision/Liquidation category, as they represent only 1.0% of all rating units, or nine, down from 3.8%, or 34 entities, in 2011.
These same trends have driven a 9.8% decline in the number of rated entities with superior FSRs (A++ or A+). In 2013, 83 rating units, or 9.7% of rated entities, had superior ratings, com-pared with 92 rating units, or 10.5%, in 2009.
The majority of rating units remained in the “A” and “A-” (Excellent) category at year-end 2013. These two rating levels represented 532, or 61.9%, of the total ratings at year-end, down from 62.4% of ratings at year-end 2012.
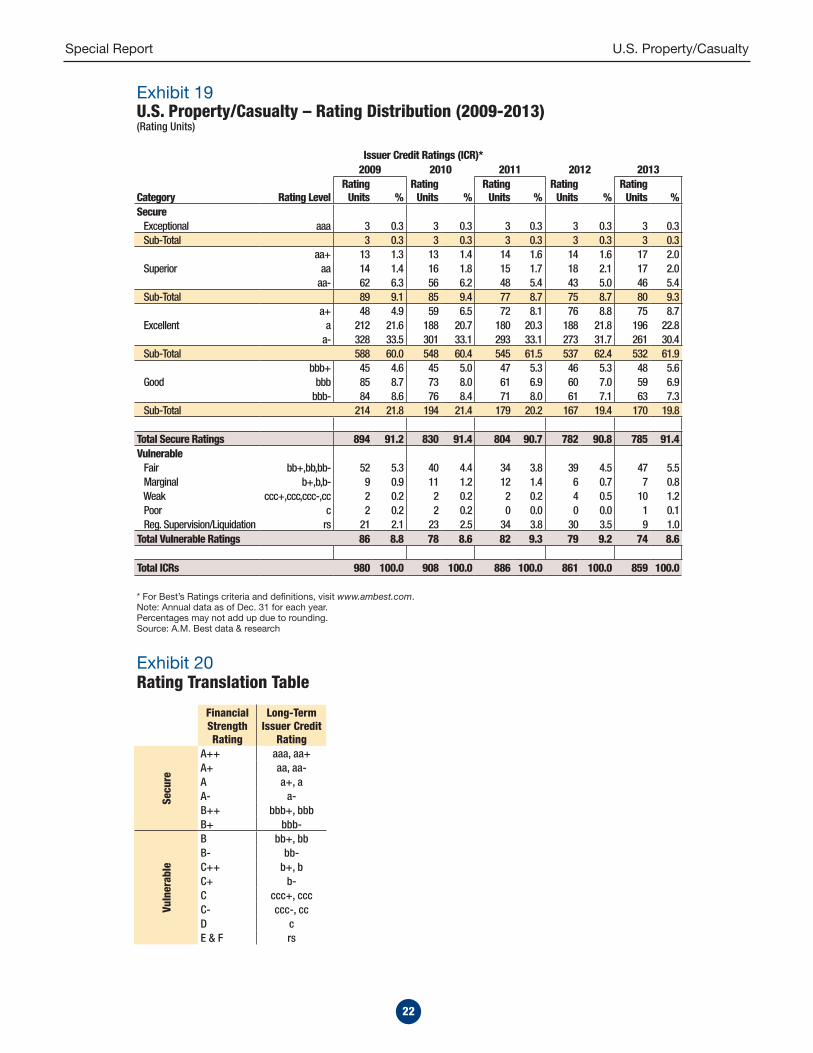
A.M. Best also assigns ICRs to all rated insurance companies. The ICR is an independent opin-ion of an issuer/entity’s ability to meet its ongoing senior financial obligations. The total num-ber of ICR ratings will equal the total FSR ratings; however, there will be greater detail repre-senting the upper and lower ranges of certain FSR categories. For example, at the “A++” FSR rating level, there are two ICR levels, “aaa” and “aa+.” Over the recent five-year period, only three entities have been rated “aaa” – Government Employees Insurance Co. (GEICO), National Indemnity Group and United States Automobile Association (USAA). Berkshire Hathaway Inc. owns both GEICO and National Indemnity.
Exhibit 18U.S. Property/Casualty – Rating Distribution (2009-2013)(Rating Units)
Financial Strength Ratings (FSR)* 2009 2010 2011 2012 2013
CategoryRating
LevelRating
Units %Rating
Units %Rating
Units %Rating
Units %Rating
Units %Secure Superior A++ 16 1.7 16 1.7 17 1.9 17 2.0 20 2.3
A+ 76 8.8 72 8.0 63 7.1 61 7.1 63 7.3 Sub-Total 92 10.5 88 9.7 80 9.0 78 9.1 83 9.7
Excellent A 260 26.3 247 27.3 252 28.4 264 30.7 258 30.0A- 328 33.7 301 32.1 293 33.1 273 31.7 274 31.9
Sub-Total 588 59.9 548 59.4 545 61.5 537 62.4 532 61.9
Good B++ 130 12.9 118 13.4 108 12.2 106 12.3 107 12.5B+ 84 8.8 76 8.8 71 8.0 61 7.1 63 7.3
Sub-Total 214 21.7 194 22.2 179 20.2 167 19.4 170 19.8
Total Secure Ratings 894 92.1 830 91.3 804 90.7 782 90.8 785 91.4Vulnerable Fair B, B- 52 4.9 40 4.6 34 3.8 39 4.5 47 5.5 Marginal C++, C+ 9 1.0 11 1.2 12 1.4 6 0.7 7 0.8 Weak C, C- 2 0.2 2 0.2 2 0.2 4 0.5 10 1.2 Poor D 2 0.2 2 0.2 0 0.0 0 0.0 1 0.1 Reg. Supervision/Liquida-tion
E / F 21 1.6 23 2.5 34 3.8 30 3.5 9 1.0
Total Vulnerable Ratings 86 7.9 78 8.7 82 9.3 79 9.2 74 8.6
Total Letter Ratings 980 100.0 908 100.0 886 100.0 861 100.0 859 100.0* For Best’s Ratings criteria and definitions, visit www.ambest.com.Note: Annual data as of Dec. 31 for each year. Percentages may not add up due to rounding.Source: A.M. Best Co. data & research
22
Special Report U.S. Property/Casualty
Exhibit 19U.S. Property/Casualty – Rating Distribution (2009-2013)(Rating Units)
Issuer Credit Ratings (ICR)* 2009 2010 2011 2012 2013
Category Rating LevelRating
Units %Rating
Units %Rating
Units %Rating
Units %Rating
Units %Secure Exceptional aaa 3 0.3 3 0.3 3 0.3 3 0.3 3 0.3 Sub-Total 3 0.3 3 0.3 3 0.3 3 0.3 3 0.3
aa+ 13 1.3 13 1.4 14 1.6 14 1.6 17 2.0 Superior aa 14 1.4 16 1.8 15 1.7 18 2.1 17 2.0
aa- 62 6.3 56 6.2 48 5.4 43 5.0 46 5.4 Sub-Total 89 9.1 85 9.4 77 8.7 75 8.7 80 9.3
a+ 48 4.9 59 6.5 72 8.1 76 8.8 75 8.7 Excellent a 212 21.6 188 20.7 180 20.3 188 21.8 196 22.8
a- 328 33.5 301 33.1 293 33.1 273 31.7 261 30.4 Sub-Total 588 60.0 548 60.4 545 61.5 537 62.4 532 61.9 bbb+ 45 4.6 45 5.0 47 5.3 46 5.3 48 5.6 Good bbb 85 8.7 73 8.0 61 6.9 60 7.0 59 6.9
bbb- 84 8.6 76 8.4 71 8.0 61 7.1 63 7.3 Sub-Total 214 21.8 194 21.4 179 20.2 167 19.4 170 19.8
Total Secure Ratings 894 91.2 830 91.4 804 90.7 782 90.8 785 91.4Vulnerable Fair bb+,bb,bb- 52 5.3 40 4.4 34 3.8 39 4.5 47 5.5 Marginal b+,b,b- 9 0.9 11 1.2 12 1.4 6 0.7 7 0.8 Weak ccc+,ccc,ccc-,cc 2 0.2 2 0.2 2 0.2 4 0.5 10 1.2 Poor c 2 0.2 2 0.2 0 0.0 0 0.0 1 0.1 Reg. Supervision/Liquidation rs 21 2.1 23 2.5 34 3.8 30 3.5 9 1.0Total Vulnerable Ratings 86 8.8 78 8.6 82 9.3 79 9.2 74 8.6
Total ICRs 980 100.0 908 100.0 886 100.0 861 100.0 859 100.0
* For Best’s Ratings criteria and definitions, visit www.ambest.com.Note: Annual data as of Dec. 31 for each year. Percentages may not add up due to rounding.Source: A.M. Best data & research
Exhibit 20Rating Translation Table
Financial Strength Rating
Long-Term Issuer Credit
Rating
Secu
re
A++ aaa, aa+A+ aa, aa-A a+, aA- a-B++ bbb+, bbbB+ bbb-
Vuln
erab
le
B bb+, bbB- bb-C++ b+, bC+ b-C ccc+, cccC- ccc-, ccD cE & F rs

Special Report U.S. Property/Casualty
Published by A.M. Best Company
Special ReportChairman & President Arthur Snyder III
exeCutive viCe President Larry G. Mayewski
exeCutive viCe President Paul C. Tinnirello
senior viCe Presidents Manfred Nowacki, Matthew Mosher, Rita L. Tedesco, Karen B. Heine
A.M. BeST CoMPANyWoRLd HeAdquARTeRS
ambest road, oldwick, nJ 08858 Phone: +1 (908) 439-2200
WASHINGToN oFFICe830 national Press Building
529 14th street n.W., Washington, dC 20045 Phone: +1 (202) 347-3090
MIAMI oFFICesuite 949, 1221 Brickell Center
miami, FL 33131Phone: +1 (305) 347-5188
A.M. BeST euRoPe RATING SeRvICeS LTd.A.M. BeST euRoPe INFoRMATIoN SeRvICeS LTd.
12 arthur street, 6th Floor, London, uK eC4r 9aB Phone: +44 (0)20 7626-6264
A.M. BeST ASIA-PACIFIC LTd.unit 4004 Central Plaza, 18 harbour road, Wanchai, hong Kong
Phone: +852 2827-3400
A.M. BeST MeNA, SouTH & CeNTRAL ASIA office 102, tower 2
Currency house, diFCPo Box 506617, dubai, uae
Phone: +971 43 752 780
Copyright © 2014 by A.M. Best Company, Inc., Ambest Road, Oldwick, New Jersey 08858. ALL RIGHTS RESERVED. No part of this report or document may be distributed in any electronic form or by any means, or stored in a database or retrieval system, without the prior written permission of the A.M. Best Company. For additional detai ls, see Terms of Use available at the A.M. Best Company Web site www.ambest.com.
Any and all ratings, opinions and information contained herein are provided “as is,” without any expressed or implied warranty. A rating may be changed, suspended or withdrawn at any time for any reason at the sole discretion of A.M. Best.
A Best’s Financial Strength Rating is an independent opinion of an insurer’s financial strength and ability to meet its ongoing insurance policy and contract obligations. It is based on a com-prehensive quantitative and qualitative evaluation of a company’s balance sheet strength, oper-ating performance and business profile. The Financial Strength Rating opinion addresses the relative ability of an insurer to meet its ongoing insurance policy and contract obligations. These ratings are not a warranty of an insurer’s current or future ability to meet contractual obligations. The rating is not assigned to specific insurance policies or contracts and does not address any other risk, including, but not limited to, an insurer’s claims-payment policies or procedures; the ability of the insurer to dispute or deny claims payment on grounds of misrepresentation or fraud; or any specific liability contractually borne by the policy or contract holder. A Financial Strength Rating is not a recommendation to purchase, hold or terminate any insurance policy, contract or any other financial obligation issued by an insurer, nor does it address the suitability of any particular policy or contract for a specific purpose or purchaser.
A Best’s Debt/Issuer Credit Rating is an opinion regarding the relative future credit risk of an entity, a credit commitment or a debt or debt-like security. It is based on a comprehensive quantita-tive and qualitative evaluation of a company’s balance sheet strength, operating performance and business profile and, where appropriate, the specific nature and details of a rated debt security.Credit risk is the risk that an entity may not meet its contractual, financial obligations as they come due. These credit ratings do not address any other risk, including but not limited to liquidity risk, market value risk or price volatility of rated securities. The rating is not a recommendation to buy, sell or hold any securities, insurance policies, contracts or any other financial obligations, nor does it address the suitability of any particular financial obligation for a specific purpose or purchaser.
In arriving at a rating decision, A.M. Best relies on third-party audited financial data and/or other information provided to it. While this information is believed to be reliable, A.M. Best does not independently verify the accuracy or reliability of the information.
A.M. Best does not offer consulting or advisory services. A.M. Best is not an Investment Adviser and does not offer investment advice of any kind, nor does the company or its Rating Analysts offer any form of structuring or financial advice. A.M. Best does not sell securities. A.M. Best is compensated for its interactive rating services. These rating fees can vary from US$ 5,000 to US$ 500,000. In addition, A.M. Best may receive compensation from rated entities for non-rating related services or products offered.
A.M. Best’s Special Reports and any associated spreadsheet data are available, free of charge, to all BestWeek subscribers. Nonsubscribers can purchase the full report and spreadsheet data. Special Reports are available through our Web site at www.ambest.com/research or by calling Customer Service at (908) 439-2200, ext. 5742. Briefings and some Special Reports are offered to the general public at no cost. For press inquiries or to contact the authors, please contact James Peavy at (908) 439-2200, ext. 5644.
SR-2014-005
Contributors Richard Attanasio, OldwickJoseph Burtone, OldwickAndrew Colannino, OldwickMatthew Coppola, OldwickRobert DeRose, Oldwick
Kevin Dorsey, OldwickThomas Mount, OldwickGreg Reisner, OldwickDarian Ryan, CPA, Oldwick