bestpractices in hypertension - amga.org in hypertension 2 3 4 1. 2006 amga hypertension compendium...
TRANSCRIPT

Care. The software and some IT support were free; no dol-lars were attached to this. Mercy estimates that it wouldhave cost approximately $25,000 to purchase and install asimilar product.
$5,000 Pfizer Health Literacy Initiative Visiting Lecturergrant
$20,000 Health Research and Educational Trust (HERT)/Robert Wood Johnson Foundation Pilot collaborative onSelf-Management Support (SMS)
MCI also received two grants from the WellmarkFoundation. The first, for $60,000, was to facilitate dataentry into the diabetes registry for the first year. The sec-ond, for $65,000, was to support part of the salary of thefirst four full-time Health Coaches for the first year.
EXECUTIVE SUMMARY
MCI physician leadership made quality improvement a strategicpriority. MCI has a highly engaged Quality Committee primari-ly made up of physicians. These physicians recognized that thecurrent care delivery system was poorly designed to care forpatients with chronic diseases, such as hypertension. MCI devel-oped a plan to proactively ensure that all recommended care isbeing delivered and goals are being met.
In June 2002, the Quality Committee initiated a hypertensionquality improvement initiative. A review of the literaturerevealed many excellent reasons to address hypertension. It isextremely prevalent and is the most common diagnosis used inthe family practice setting. Multiple recent studies have shown astrong, continuous, graded increase in cardiovascular events asso-ciated with elevated blood pressure (BP). The same studies alsorevealed that the association is stronger for systolic BP than for
MEDICAL GROUP PROFILE
• Multispecialty medical group
• Twenty-nine clinics across the greater Des Moines area, including 14 family practice, five pediatric, three internal medicine, two neurology, two rheumatology, one surgery, one otolaryngology, and one geriatrics.
• The Mercy Clinics, Inc. (MCI) employs 130 physicians who are paid using a home-grown virtual private practice (VPP) system that tracks all revenue and expenses to the physician level and pays them the difference. Reimbursement is 100% fee-for-service.
• Payer mix is 30% Wellmark, 24% Medicare, 6% Medicaid
and approximately 40% other commercial insurers.
• MCI is owned by Mercy Hospital Medical Center (MHMC)
in Des Moines, IA. MHMC is owned by Catholic Health
Initiatives of Denver, CO.
• During 2006’s fiscal year, there were 759,225 patient visits.
FUNDING/BUDGET
MCI obtained approximately $150,000 in grant funding tohelp offset its quality improvement efforts to improve the man-agement of hypertension. It is estimated that these grants cov-ered about 50% of the total program cost; however, the real-ized financial gains that are discussed later under theIntervention section have clearly illustrated the project will payfor itself over time.
SECAT (STEPS Electronic Collection and Analysis tool)grant funding received from Iowa Foundation for Medical
Best Practices in Hypertension CareMercy Clinics Inc.Des Moines, IA
1hypertension care
Best Practices in Hypertension
2
3
4
1

2006 amga hypertension compendium
diastolic BP. National data indicate that only 27% of patientsdiagnosed with hypertension are controlled.
MCI quality staff conducted an audit of first- and second-quar-ter 2002 data from patients with hypertension, and found 46%of the patients had their hypertension under control as definedby HEDIS criteria of less than 140/90 mmHg.
MCI’s data compared favorably to national data; however, thecommittee agreed there was room for improvement and the goalshould be to strive for the next tier of excellence. The QualityCommittee set forth an initial goal of having 70% of patientscontrolled to less than 140/90 mmHg. This goal was establishedwith Wellmark, given it was to be used as the measure to calcu-late pay for performance (P4P) incentives for a new pilot pro-gram. MCI felt this goal was higher than previously publishedbenchmarks, but was still doable.
PROJECT PLAN/TIMELINE
The plan was to improve chronic disease care by implementingall aspects of the Wagner Chronic Care Model. MCI wanted tostart small and slowly expand, looking for the easiest opportuni-ties to improve along the way. MCI began with diabetes andthen expanded to hypertension. MCI used the “learn by doing”rapid Plan–Do–Study–Act (PDSA) cycle approach. In retro-spect, MCI can show the following timeline:
The specific projects and outcomes along the timeline are asfollows:
First HgA1c Database:
• The database included all the HgA1c results from all of the MCI clinics.
• Adopted diabetes guideline.• Saw a steady decline in average HgA1c values.• Obtained Diabetes Physician Recognition Program (DPRP)
status for the entire clinic system.
Began Institute for Healthcare Improvement (IHI)
IMPACT (a membership network of organizations committed to building a better future for health care and founded on the simple belief that it is exponentially easier to improve together than alone). • Introduced to the Institute of Medicines (IOM) Six
Dimensions of Quality.• Introduced to Wagner’s Chronic Care Model.• Started a disease registry – paper at first and then electronic.• Learned to call back patients overdue for an appointment.• Developed the office visit form.• Introduced standing orders for diabetes.• Hired part-time (10 hrs. per week) Chronic Care
Coordinators (CCC), who are now titled Health Coaches.• Developed the lab result reporting protocol.
Health Research and Educational Trust/Robert Wood
Johnson Foundation – Self-Management Support Pilot
Collaborative:
• Adopted 5As approach and developed forms.• Introduced group visits for diabetes.• Developed low-literacy handouts.
Began disease registry in three clinics:
• Entered four data points on all patients with diabetes.• Created performance reports at doctor and clinic levels.• Created list of patients overdue for visits.
Began Recognizing and Rewarding Best Practices (RRBP)
in four clinics:
• Expanded the disease registry to four clinics, entering all patients.
• Started a hypertension disease registry.• Started monthly meetings of the RRBP Leadership Commit-
tee consisting of Medical Directors of participating clinics.• Started every-two-week meetings of the RRBP Implemen-
tation Committee, consisting of office managers and key staff of participating clinics.
2
Timeline
First HgA1c database (All clinics)
Begin IHI IMPACT (2 clinics)
HERT SMS pilot (2 clinics)
Begin disease registry (3 clinics)
Begin RRBP P4P (4 clinics)
Full-time health coaches (4 clinics)
Expand disease registry to all clinics
1998 - 2002
Oct 2002
Oct 2003
Jan 2004
Sep 2004
Jun 2005
Jan 2006
1
2
3
4
5

3hypertension care
Hired full-time Health Coaches in four clinics:
• Job description written and position posted.• Training program for Health Coaches developed.• Fifth clinic brought in to use the disease registry for all
patients.
Expanded disease registry to additional nine clinics.
The Future
Three more clinics committed to using the registry and are in theprocess of training. This will bring registry use to 14 of the 17 (11family practice and three internal medicine) primary care clinics.The only clinics that are not using the registry were recently pur-chased and MCI is focusing efforts on integrating other systems.
Fourteen clinics are participating in the RRBP pilot. The projectyear will finish on Sept. 30, 2006. MCI is negotiating the detailsfor 2007. Wellmark is going to take the P4P statewide but MCIwill have to go backwards to join their standard product; theyappear willing to set separate terms for MCI.
MCI is expanding to other chronic conditions and already haslarge parts of the asthma and immunizations programs ready togo. However, MCI is holding back to avoid losing focus on thecore goals. MCI has just received another grant from theWellmark Foundation. The grant is for $76,000 to be used toscreen all of MCI’s diabetes patients for depression and to set upa registry to follow patients with diabetes. MCI has outgrownits current registry and cannot add more diseases (depression willbe tracked in Excel for now) until a new one is implemented.MCI is planning to pilot iRegistry from the Iowa Foundationfor Medical Care (IFMC).
INTERVENTION
Developing Practice Guidelines
The first step for MCI was the development of a hypertensionpractice guideline. The recommendations were based upon theSixth Report of the Joint National Committee on Prevention,Detection, Evaluation, and Treatment of High Blood Pressure,published in 1997 by the National Institutes of Health (JNC 6).The practice guideline emphasized:
• Standardizing BP measurement.
• Setting a clear goal with patients.
• Lifestyle modifications.
• Adding pharmacologic therapy when needed.
• Evaluating for co-existing risk factors such as diabetes
and hyperlipidemia.
The Quality Committee approved the original practice guidelinein August 2002. The guideline was updated in August 2004 toreflect JNC 7 recommendations (see Appendix 1).
Once the practice guideline was completed, a local cardiologistprovided academic detailing to many of the MCI family practiceand internal medicine clinics, emphasizing the main points of thenew MCI practice guideline. In addition, a nurse educator fromhis clinic attended each session and engaged clinical staff in anin-service on standardized BP measurement. This served as anexcellent reminder to the staff of the importance of accurate BPmeasurement. Many providers commented that in retrospect,the academic detailing influenced behavior change in caring forpatients with hypertension.
An audit of fourth-quarter 2002 data did reveal a slight decreasein BP, both controlled to <140/90 and <140/90. However, academic detailing and full guideline dissemination had not yetbeen completed at the time of this audit.
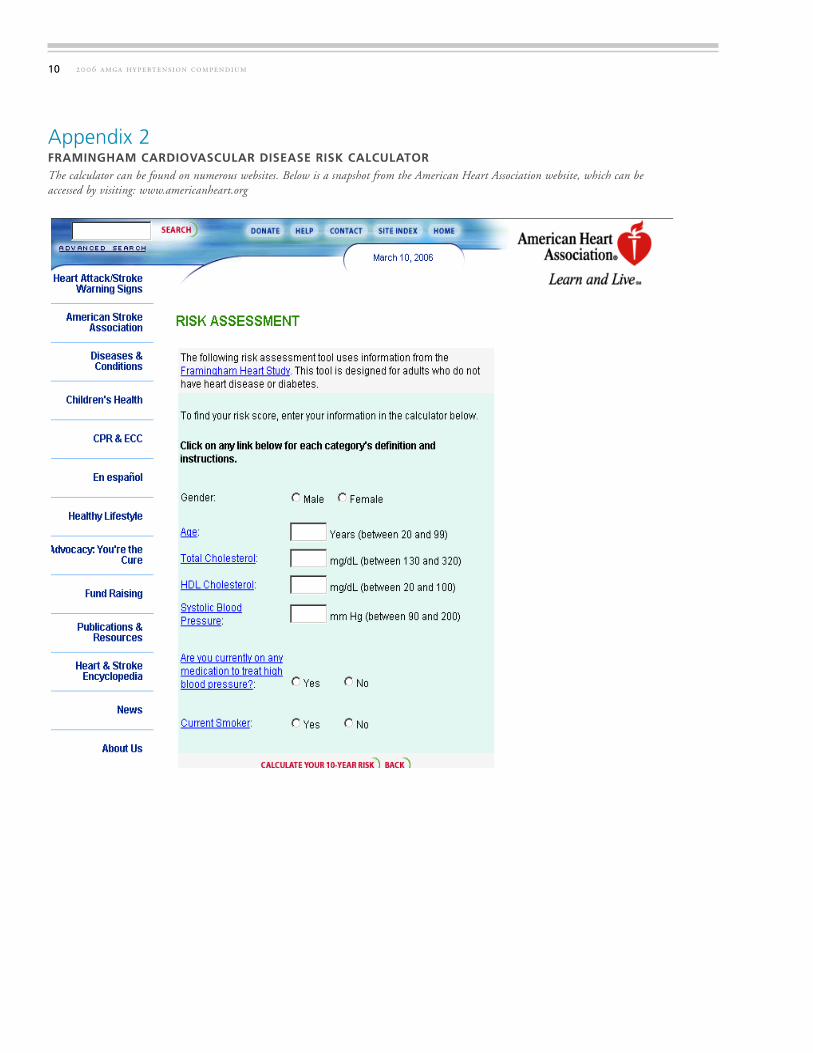
In early 2004, an audit of fourth-quarter 2003 data revealedimprovement in both criteria categories. Within one year, BPcontrol to <140/90 went from 38% to 47%. Also within thatsame time frame, BP control to <140/90 went from 50% to60%. It was during this same timeframe that QualityCommittee members were learning more about metabolic syn-drome and the Framingham Cardiovascular Disease (CVD) riskcalculator (see Appendix 2). Additional data points were auditedat this time to determine Framingham CVD risk scores forpatients with hypertension. Overall, 40% of patients with hyper-tension audited were noted to have a greater than 10% risk of afuture cardiovascular event within the next 10 years. The samplesize, however, was reduced due to a lack of lipid data required tocalculate the risk. More than 20% of the charts did not have thisinformation available. By May 2004, the Quality Committeedeveloped a Metabolic Syndrome practice guideline to comple-ment the hypertension guideline (see Appendix 3).
In January 2004, the MCI system applied for and received grantfunding to implement SECAT. SECAT is a Microsoft Access-basedregistry tool for tracking preventive services and diabetes indicators.SECAT was developed by The Iowa Foundation for Medical Careand The Illinois Foundation for Quality Health Care.
Beginning in January 2004 MCI manually entered data for alldiabetes patients in four clinics. MCI initially chose to focus on
6
7
8

2006 amga hypertension compendium
only four data points: HgA1c, lipids, BP, and microalbumin.The quality committee felt improvement of these four items wasunder the control of physicians and had the best evidence basethat it would lead to better patient outcomes. In September2004, the four clinics began participating in a pay-for-perform-ance pilot, which included not only diabetes quality parameters,but also hypertension quality parameters. MCI continued withthe same thought process as it expanded from diabetes to includehypertension. The four data points selected for hypertensionwere: BP, lipids, glucose, and microalbumin.
Identifying Target Populations and Tracking Information
In January 2004, the SECAT database was implemented in four clinics:
Campus – a family practice clinic with five doctors and one mid-level;
Capital – an internal medicine clinic with four doctors;
South – a family practice clinic with six doctors and two mid-levels; and
West – a family practice clinic with seven doctors and one mid-level.
The target hypertension patient population was 100% of theadult (>18 years) patients in the clinics with hypertension andWellmark as their insurance carrier. Wellmark is an insurancecarrier with which MCI is participating in a pay-for-performancepilot. As of July 31, 2006 MCI had 4,583 Wellmark memberswith hypertension in the database.
A CCC was identified in each clinic to spend 10 hours a weekworking on the database. Initially, the focus was on manuallyentering 12 months of retrospective data based upon the patientlist provided by the insurance carrier. MCI chose to begin in this way to allow the database to be useful immediately.Patients with an overdue visit or who had not met goals wereimmediately identified.
After the initial data entry, SECAT was then continuously updat-ed as patients were seen in the office. See Appendix 4 for theminimum data elements required to populate SECAT.
In September 2004, each office assembled an internal qualityimprovement team composed of a physician, office manager,office supervisor, nurse, CMA, receptionist, and medical recordsstaff to design its own process for collecting the data and manual-
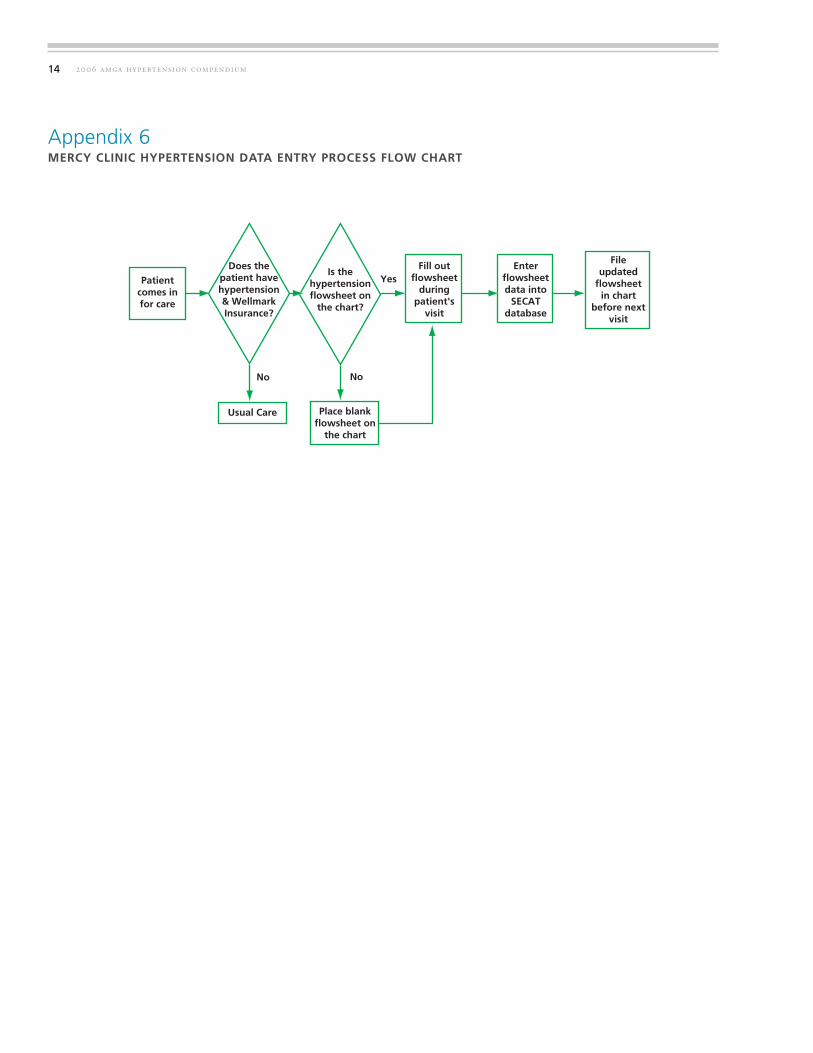
ly entering it into the database. Team leaders, people who didthe day-to-day work and two or three people from each clinic(manager or supervisor and a nurse or CMA) met with QualityImprovement staff every two weeks. Initially, barriers to officeredesign were articulated using a fishbone diagram technique (seeAppendix 5). Ultimately, the team created a standardized dataentry process (see Appendix 6). At the same time, team memberswere able to share successes, failures, and best practices achievedat the individual clinics. The data-entry process is triggeredwhenever a patient with hypertension comes to the office or isscheduled for a visit. The CCC attempts to review charts prior tothe office visit. If the patient’s primary insurance is withWellmark, a hypertension adherence flowsheet (see Appendix 7)is placed on the chart and any needed testing is highlightedaccording to the standing orders (see Appendix 8) developed bythe team. The flowsheet is filled out during the patient’s visitand then forwarded to the CCC for data entry into the SECAThypertension database. An updated flowsheet is then placed inthe chart before the next visit. The charts of all patients in thedatabase are prominently marked for easy identification duringpatient visits.
To ensure that no hypertension visits are missed, lists of patientsoverdue for a BP are generated out of the clinic’s information sys-tem (see Appendix 9) and used to update the data if needed or tocall the patient in if they are overdue for a visit. Whenever thecharts are pulled they are reviewed using the hypertension adher-ence flowsheet (see Appendix 7) to ensure that all of the stan-dards are being met and any missed labs are ordered.
The disease registry was set up on the hospital’s network, thusallowing for a single database for all of the clinics to utilize.Monthly performance reports were generated containing popu-lation-based processes (i.e., was a BP done?) and outcomes (i.e., was the systolic BP <140). These are reported at both the clinic and physician level and are distributed unblindedthroughout the organization (see Appendix 10a, 10b ). Thisapproach worked well to lower BP values and increase microal-bumin testing.
SECAT is also used to create:
Lists of patients overdue for visits;
Lists of patients not meeting outcomes goals;
Individual patient flowsheets; and
Physician performance reports.
4
1
2
3
4
1
2
3
4
5hypertension care
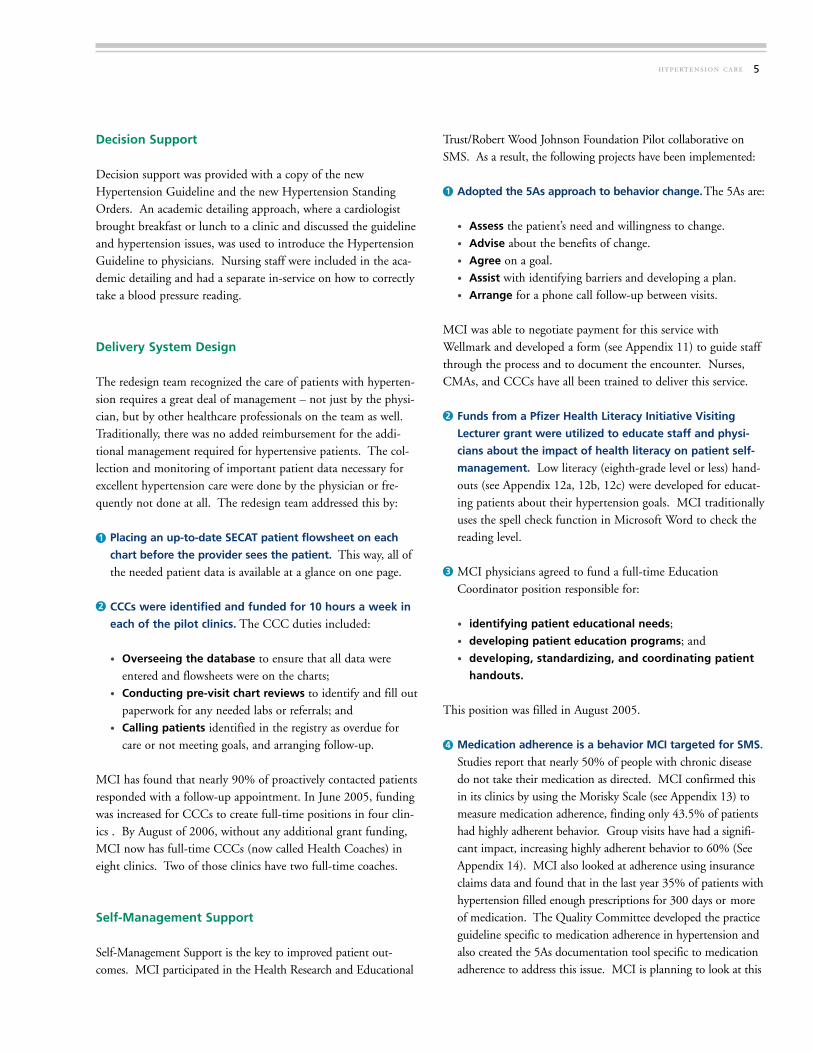
Decision Support
Decision support was provided with a copy of the newHypertension Guideline and the new Hypertension StandingOrders. An academic detailing approach, where a cardiologistbrought breakfast or lunch to a clinic and discussed the guidelineand hypertension issues, was used to introduce the HypertensionGuideline to physicians. Nursing staff were included in the aca-demic detailing and had a separate in-service on how to correctlytake a blood pressure reading.
Delivery System Design
The redesign team recognized the care of patients with hyperten-sion requires a great deal of management – not just by the physi-cian, but by other healthcare professionals on the team as well.Traditionally, there was no added reimbursement for the addi-tional management required for hypertensive patients. The col-lection and monitoring of important patient data necessary forexcellent hypertension care were done by the physician or fre-quently not done at all. The redesign team addressed this by:
Placing an up-to-date SECAT patient flowsheet on each
chart before the provider sees the patient. This way, all of the needed patient data is available at a glance on one page.
CCCs were identified and funded for 10 hours a week in
each of the pilot clinics. The CCC duties included:
• Overseeing the database to ensure that all data were entered and flowsheets were on the charts;
• Conducting pre-visit chart reviews to identify and fill outpaperwork for any needed labs or referrals; and
• Calling patients identified in the registry as overdue for care or not meeting goals, and arranging follow-up.
MCI has found that nearly 90% of proactively contacted patientsresponded with a follow-up appointment. In June 2005, fundingwas increased for CCCs to create full-time positions in four clin-ics . By August of 2006, without any additional grant funding,MCI now has full-time CCCs (now called Health Coaches) ineight clinics. Two of those clinics have two full-time coaches.
Self-Management Support
Self-Management Support is the key to improved patient out-comes. MCI participated in the Health Research and Educational
Trust/Robert Wood Johnson Foundation Pilot collaborative onSMS. As a result, the following projects have been implemented:
Adopted the 5As approach to behavior change.The 5As are:
• Assess the patient’s need and willingness to change.• Advise about the benefits of change.• Agree on a goal.• Assist with identifying barriers and developing a plan.• Arrange for a phone call follow-up between visits.
MCI was able to negotiate payment for this service withWellmark and developed a form (see Appendix 11) to guide staffthrough the process and to document the encounter. Nurses,CMAs, and CCCs have all been trained to deliver this service.
Funds from a Pfizer Health Literacy Initiative Visiting
Lecturer grant were utilized to educate staff and physi-
cians about the impact of health literacy on patient self-
management. Low literacy (eighth-grade level or less) hand-outs (see Appendix 12a, 12b, 12c) were developed for educat-ing patients about their hypertension goals. MCI traditionallyuses the spell check function in Microsoft Word to check the reading level.
MCI physicians agreed to fund a full-time Education Coordinator position responsible for:
• identifying patient educational needs;• developing patient education programs; and• developing, standardizing, and coordinating patient
handouts.
This position was filled in August 2005.
Medication adherence is a behavior MCI targeted for SMS.
Studies report that nearly 50% of people with chronic disease do not take their medication as directed. MCI confirmed this in its clinics by using the Morisky Scale (see Appendix 13) to measure medication adherence, finding only 43.5% of patients had highly adherent behavior. Group visits have had a signifi-cant impact, increasing highly adherent behavior to 60% (See Appendix 14). MCI also looked at adherence using insurance claims data and found that in the last year 35% of patients withhypertension filled enough prescriptions for 300 days or more of medication. The Quality Committee developed the practice guideline specific to medication adherence in hypertension and also created the 5As documentation tool specific to medication adherence to address this issue. MCI is planning to look at this
1
2
1
2
3
4

Local insurance payer. Wellmark BC/BS provided educa-tional support for the SMS initiatives.
Health Research and Educational Trust. MCI participated in the pilot collaborative on SMS.
LEADERSHIP
MCI was fortunate to have significant leadership support from itsparent corporation, Mercy Hospital Medical Center, and itsBoard of Directors. Catholic Initiatives and MHMC each paid50% of the cost for MCIs participation in the IHI IMPACTproject, which jump-started the chronic disease improvementefforts. MCI’s local Board of Directors supported the project byfunding administrative quality improvement staff. MCI has ahalf-time physician position and full-time nurse position devotedto quality improvement. The Quality Committee, made up ofphysicians from throughout the system, meets monthly to giveadvice on and oversee all quality improvement efforts.
The Medical Directors of the MCI pilot clinics made the tough-est decisions. They committed significant clinical resources andthe energy to make many process changes, without knowing theultimate return. It was only after MCI was well into the projectthat they were able to show a positive financial return and negoti-ate pay-for-performance packages. Without the vision and sup-port of the early adopters, who shepherded this project at theirclinics because it was the right thing to do for their patients,MCI could not have achieved its successes.
FINANCIAL CASE FOR CHRONIC DISEASE CARE
Since all of the expenses for the improvement efforts were paidfor by MCI’s physicians via a reduction in salary, it was veryimportant to make the case for a positive financial return.
Receiving outside funding sources such as grants and pay-for-per-formance packages was important, but MCI felt it needed todesign a sustainable plan that generated a positive financial returnunder the current reimbursement system. MCI analyzed severalof the services it provided and found that these efforts haveshown a positive return including:
Higher billing of EM services for diabetes visits: Becauseof the preliminary work done by CCCs and the efficiency ofthe diabetes office visit form, physicians were able to bill for ahigher level of service without increasing the time spent on
2006 amga hypertension compendium
data quarterly to identify poorly adherent patients for 5As inter-ventions. In addition, MCI has increased physician and staff awareness of the issue and are training staff to ask patients not meeting BP goals about their medication compliance.
Health Care Organization
MCI has negotiated a pay-for-performance project calledRecognizing and Rewarding Best Practices (RRBP) withWellmark (its largest insurer, covering about 30% of patients).This one-year pilot program, which started in September 2004,was designed to pay physicians up to $15,000 each for meetingaggressive quality and pharmacy targets (see Appendix 15). Allproviders met all the goals and received the maximum payout.The total paid was $354,000. RRBP has served to energize andfocus of physicians and staff. (See Appendix 16 for run charts ofall hypertension targets).
MCI is currently working with several other local organizationsto develop a Medicare Health Care Quality DemonstrationProgram (MMA Section 646) that, if successful, will provide fur-ther incentives for physicians to improve the care for patientswith chronic diseases.
MCI is discussing the pay-for-performance concepts with otherinsurers, employers, and state agencies with the hope of expand-ing the incentives to improve preventive and chronic disease care.
Community Resources and Policies
Partnering with outside organizations has been critical to MCI’ssuccess in improving chronic disease care. These organizationsinclude:
CMS QIO provided the disease registry database, SECAT, at no charge.
Pharmaceutical companies, particularly Pfizer, provided financial and technical expertise.
Institute for Healthcare Improvement. MCI participated with IMPACT in the Improving Care in Office Practices and Outpatient Setting domain.
Local and state medical organizations. Iowa Medical Society, Iowa Healthcare Collaborative, and Iowa Foundation for Medical Care lent credibility to the project.
6
1
2
3
4
5
6
1

7hypertension care
each visit. In the first quarter of 2003, MCI did a study oftwo physicians as it introduced the diabetes office visit formand found that their 99214 EM charges for diabetes visitswent from 40% to 80% of the visits. This netted an extra$10.92 per average diabetes office visit or, based on six visitsper week, about an extra $3,400 per physician per year.
Increased total number of diabetes visits: Using the registryto call in patients overdue for a visit is expected to increase thetotal number of visits, but this has not yet been quantified. It isalso anticipated that, as word about the diabetes program getsout through the Diabetes Physician Recognition Program andspecial mention in insurance provider manuals, MCI will attracta greater number of diabetes patients.
Increased lab revenue: Microalbumin testing went from100 tests per quarter to 1,300 tests. With a profit of $8.00per test this yielded an extra $38,400 per year. MCI did notmeasure other lab tests but believes it is reasonable to assumethey also are increasing in number, although not nearly asmuch as microalbumin testing. MCI is now up to over 3,000tests per quarter, yielding at least $100,000 profit at CMSpayment rates.
Group visits: MCI calculated that group visits yield chargesof $1,070 per 90 minutes of physician time, making themmore profitable per hour than most other primary care servic-es. MCI is currently providing group visits for patients withdiabetes in three clinics, with plans to expand to hypertensionpatients and to additional clinics.
Office process redesign: As part of the office flow redesign,MCI looked at the process of returning lab results to patients.Initially MCI had no process and relied on the patient to callin for results. This was very inefficient. Therefore, a newprocess of calling all lab results to the patients the next morn-ing, before the patient could call the office, was designed (seeAppendix 17). The new process was developed in the SouthClinic where it reduced incoming calls requesting lab resultsfrom 442 to 124 a week. This freed up staff time to work onother interventions as well as increasing patient, staff, andphysician satisfaction. This process took nearly a year to per-fect and has been extended to all MCI clinic sites. This proj-ect reduced phone calls for lab results by 40 calls per providerper week. At a very conservative estimate of $3.00 per callsaved, this yielded $6,240 per provider per year.
Pay-for-Quality: MCI’s Recognizing and Rewarding BestPractices program had the potential to yield $15,000 per
participating physician. Initial payouts – calculated inSeptember 2005 totaled $354,000.
Grants: Because MCI was working on process changes thathave rarely been done in a private practice, fee-for-service setting, it was able to attract grant funding in excess of$130,000 to support new programs. This funding is now inexcess of $200,000.
Improved patient outcomes: MCI believes its data demon-strates superior outcomes when compared to those of othersimilar private practices. The physicians are very proud of this,and it is a significant motivating factor for them.
IOM SIX DIMENSIONS OF QUALITY
Once the four Health Coaches are oriented to their new job,MCI will gradually expand its outcome measurements to morecomprehensively reflect the IOM Six Dimensions of Quality.Planned measurements are as follows:
Equity – Comparison of BP monitoring rates within the last 12 months for Medicare vs. non-Medicare patients. MCIis able to track age but not sex or race in the SECAT database.
Timeliness – 3rd next available appointment per provider.MCI tracks this sporadically now and would like to do it atregular intervals (see Appendix 18).
Effective – Percentage of patients meeting outcomes goals. Thisis already reflected in MCI’s performance reports and run charts.
Patient-centeredness – Increase the frequency of patient sat-isfaction surveys from two times a year to quarterly (seeAppendix 19).
Efficiency – Office cycle times (time from patient check-in topatient check-out) per provider. This measurement was cho-sen because waiting time was the lowest score on MCI’s satis-faction surveys. At the South Clinic, check-in and check-outtimes are entered into the billing system, and they have theability to generate weekly reports. This has also recently beenstarted at the Campus Clinic.
Safety – Number of lab callbacks per month not completedin a timely manner. All of our lab results are now logged withthe time the results were reported to the patient. A review ofthis log can easily create a report.
2
3
4
5
6
7
8
1
2
3
4
5
6

2006 amga hypertension compendium
KEYS TO SUCCESS
• Allocation of paid staff to the project. Moving a project like this forward effectively and efficiently is not something someone does on the side. It requires full-time paid staff to keep the focus of the organization on the project.
• Obtaining grant funding. Implementing a chronic care modelrequires up-front expenditures, but a return is in the future and uncertain. Physicians are understandably reluctant to be the first to commit their funds to such a project. MCI found that byobtaining grant funding to cover 50% of the first year’s start-up costs, it was able to persuade doctors to commit to the project.
• Obtaining free information technology. MCI was able to get the SECAT software free from the CMS QIO, as well as IT support from Mercy Hospital Medical Center. This reduced the risk to physicians and made it easier to get their support.
• Not overextending its focus. In the beginning MCI limitedthe number of clinics, the number of data points in the registry, and the number of diseases in the projects. By not overextending, MCI was able to find success on a small scale and then disseminate proven interventions.
GREATEST CHALLENGES
• Achieving physician buy-in and willingness to take finan-
cial risk for the project. MCI accomplished this by having aclear vision of the desired future, obtaining financial support from grants, and finding early successes such as the reduction of HgA1c with the first database.
• Process and flow redesign. MCI initially thought that the biggest obstacle was going to be financial, but soon found thatoffice processes and flows are so ingrained that even with very adequate financial rewards it could not easily change them. MCI arranged a payment of $54 for delivering a 5As interven-tion, which could be done by a medical assistant in less than 10 minutes, but the CMAs did not do them simply because they did not have the time. To overcome this, MCI began hiring full-time CCCs to be available for these interventions.
LESSONS LEARNED
• A disease registry and a chronic disease model can have
a positive financial impact even without grants and
pay-for-performance incentives.
• Clinical measurement and feedback to providers lead to
improvement as shown in MCI’s HgA1c, SBP and microal-
bumin data.
• Data open the doors to involvement with other groups.
Organizations are more willing to partner with you
if you have the data to show the impact of your
interventions.
• Patients will respond if contacted proactively. MCI found
that nearly 90% of its patients will schedule an appoint-
ment when mailed a reminder or called.
ADVICE TO OTHERS
Commit to a goal and allocate the resources to achieve that
goal then Start, Start, Start instead of Plan, Plan, Plan.
FOR ADDITIONAL INFORMATION
Contact
David Swieskowski, MD, MBAVice President for QualityMercy Clinics, Inc.207 Crocker St., Suite 200Des Moines, IA 50309Phone: 515-643-7150E-mail: [email protected]
8
9hypertension care
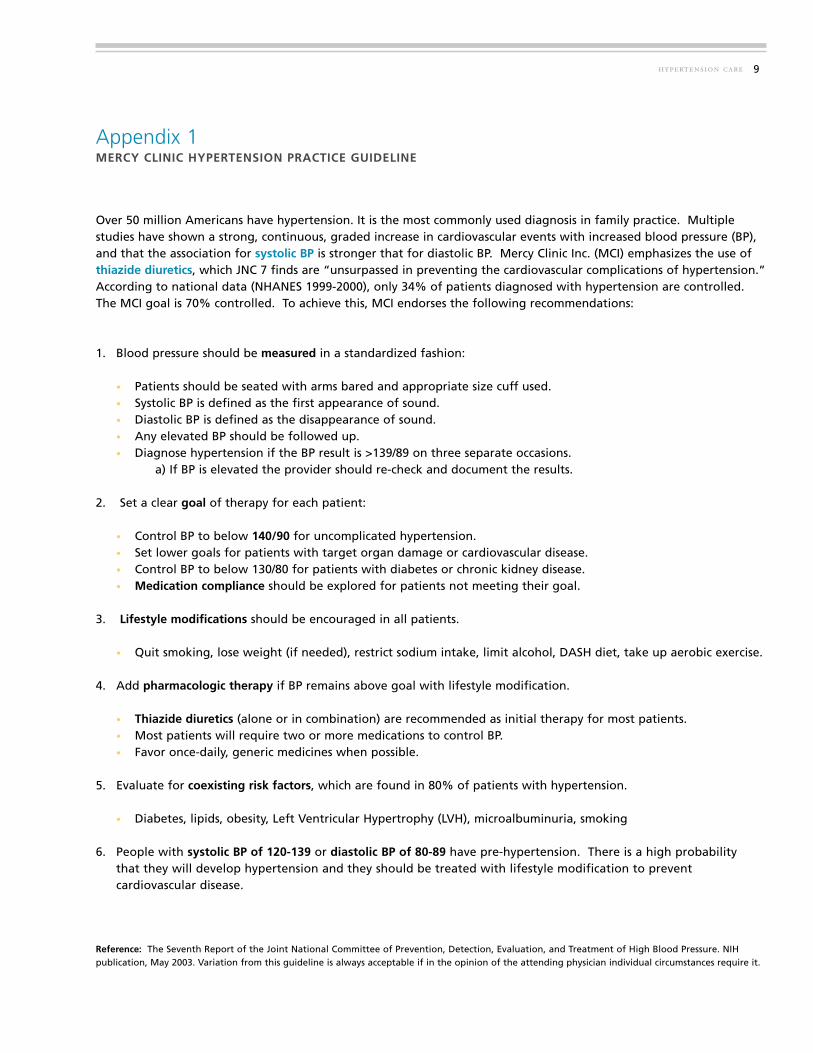
Appendix 1MERCY CLINIC HYPERTENSION PRACTICE GUIDELINE
Over 50 million Americans have hypertension. It is the most commonly used diagnosis in family practice. Multiple studies have shown a strong, continuous, graded increase in cardiovascular events with increased blood pressure (BP),and that the association for systolic BP is stronger that for diastolic BP. Mercy Clinic Inc. (MCI) emphasizes the use ofthiazide diuretics, which JNC 7 finds are “unsurpassed in preventing the cardiovascular complications of hypertension.”According to national data (NHANES 1999-2000), only 34% of patients diagnosed with hypertension are controlled.The MCI goal is 70% controlled. To achieve this, MCI endorses the following recommendations:
1. Blood pressure should be measured in a standardized fashion:
• Patients should be seated with arms bared and appropriate size cuff used.• Systolic BP is defined as the first appearance of sound.• Diastolic BP is defined as the disappearance of sound.• Any elevated BP should be followed up.• Diagnose hypertension if the BP result is >139/89 on three separate occasions.
a) If BP is elevated the provider should re-check and document the results.
2. Set a clear goal of therapy for each patient:
• Control BP to below 140/90 for uncomplicated hypertension.• Set lower goals for patients with target organ damage or cardiovascular disease.• Control BP to below 130/80 for patients with diabetes or chronic kidney disease.• Medication compliance should be explored for patients not meeting their goal.
3. Lifestyle modifications should be encouraged in all patients.
• Quit smoking, lose weight (if needed), restrict sodium intake, limit alcohol, DASH diet, take up aerobic exercise.
4. Add pharmacologic therapy if BP remains above goal with lifestyle modification.
• Thiazide diuretics (alone or in combination) are recommended as initial therapy for most patients.• Most patients will require two or more medications to control BP.• Favor once-daily, generic medicines when possible.
5. Evaluate for coexisting risk factors, which are found in 80% of patients with hypertension.
• Diabetes, lipids, obesity, Left Ventricular Hypertrophy (LVH), microalbuminuria, smoking
6. People with systolic BP of 120-139 or diastolic BP of 80-89 have pre-hypertension. There is a high probability that they will develop hypertension and they should be treated with lifestyle modification to prevent cardiovascular disease.
Reference: The Seventh Report of the Joint National Committee of Prevention, Detection, Evaluation, and Treatment of High Blood Pressure. NIH publication, May 2003. Variation from this guideline is always acceptable if in the opinion of the attending physician individual circumstances require it.
2006 amga hypertension compendium
Appendix 2FRAMINGHAM CARDIOVASCULAR DISEASE RISK CALCULATORThe calculator can be found on numerous websites. Below is a snapshot from the American Heart Association website, which can beaccessed by visiting: www.americanheart.org
10

11hypertension care
Appendix 3MERCY CLINIC METABOLIC SYNDROME PRACTICE GUIDELINE
Metabolic Syndrome may occur in as many as 25% of American adults or 50 million people. People with MetabolicSyndrome are four times more likely to die of a heart attack and six times more likely to develop diabetes. MercyClinic, Inc. (MCI) is committed to identifying and treating Metabolic Syndrome before the development of diabetes orcardiovascular disease.
1. MCI endorses the ATP III definition of Metabolic Syndrome. BMI has been substituted for waist circumference because it is easier to measure in the clinic setting.
ATP III Clinical Identification of the Metabolic Syndrome (modified for BMI)The presence of three or more risk factors indicates Metabolic Syndrome
Risk Factor Defining Level
Abdominal Obesity* BMI ≥ 30Triglycerides ≥ 150HDL Cholesterol Men ≤ 40, Women ≤ 50Blood Pressure ≥ 130/85Fasting Glucose ≥ 110
>
>
< <
>
>
*BMI substituted for waist circumference > 40 in. in men or > 35 in. in women
2. BMI (Body Mass Index) should be recorded yearly on all patients age six to 60.
3. All patients with a BMI 30 should have a lipid profile, glucose test, and blood pressure reading documented within the last 24 months.
4. Education should be given to all patients with Metabolic Syndrome.
5. Treatment options:
• Lifestyle Modificationa) Dietb) Exercisec) Weight lossd) Smoking cessation (if applicable)
• Treat metabolic risk factors according to current treatment guidelines.a) Hyperlipidemiab) Hypertensionc) Diabetes
>

2006 amga hypertension compendium
Appendix 4MERCY CLINIC SECAT HYPERTENSION DATABASE MINIMUM DATA ELEMENTS
The SECAT hypertension database is set up to capture the data elements listed in the table below alongwith six optional fields. The six optional fields are utilized by individual clinics at their discretion.
The minimum data elements collected on all patients are:
12
Field Name Data Elements Source
Patient Last Name
Patient First Name
Patient Birthdate
The first three fields combine to become the
unique patient identifier
Clinic ID ID # assigned byregistry
Clinic
Clinic name Clinic
Provider Last Name Last name Chart
Provider First Name First name Chart
Provider Unique Physician Identification
Number (UPIN)
UPIN Registry
Systolic Blood Pressure (SBP) Date Date Lab Report
Systolic Blood Pressure (SBP) Result Value Lab Result
Diastolic Blood Pressure (DBP) Date Date Lab Report
Diastolic Blood Pressure (DBP) Result Value Lab Report
Total Cholesterol Date Date Lab Report
Total Cholesterol Result Value Lab Result
Triglycerides Date Date Lab Report
Triglyceride Result Value Lab Result
High-Density Lipoproteins (HDL)
Cholesterol Date
Date Lab Report
High-Density Lipoproteins (HDL)
Cholesterol Result
Value Lab Result
Low-Density Lipoproteins (LDL)
Cholesterol Date
Date Lab Report
Low-Density Lipoproteins (LDL)
Cholesterol Value
Value Lab Result
Microalbumin Date Date Lab Report
Microalbumin Value Value Lab Result
Glucose Date Date Chart
Some of the indicators being tracked in the ‘optional fields’ by some clinics are:
Self-Management Support Date, Category Chart
Weight Value Chart
Medication Adherence Date, Yes/No Chart
Tobacco Counseling Date, Yes/No Chart
Field Name Date Elements Source

13hypertension care
Appendix 5MERCY CLINIC FISHBONE DIAGRAM OF DATA ENTRY
Accountability Staff Training Using Data Computers
Enter HTN Data
ID PatientsFlowsheetsBuy-In Time
Doctor
Staff
Color
Name
Flowsheet org.
Correct Datase
List from Wellmark
Who does ID on when patient arrives
Staffing issues
Unexpected demand
Who in the office
Resources used
Who
Pts. not meeting goals
Pts. Overdue for visits
Create lists
No hardware
Software access
What is a Fishbone diagram?
Dr. Kaoru Ishikawa, a Japanese quality control statistician, invented the fishbone diagram. Therefore, it may be referred to as theIshikawa diagram. The fishbone diagram is an analysis tool that provides a systematic way of looking at effects and the causes thatcreate or contribute to those effects. Because of the function of the fishbone diagram, it may be referred to as a cause-and-effectdiagram. The design of the diagram looks much like the skeleton of a fish. Therefore, it is often referred to as the fishbone diagram.
Whatever name you choose, remember that the value of the fishbone diagram is to assist teams in categorizing the many potentialcauses of problems or issues in an orderly way and in identifying root causes.
When should a fishbone diagram be used?
Does the team... • Need to study a problem/issue to determine the root cause? • Want to study all the possible reasons why a process is beginning to have difficulties, problems, or breakdowns? • Need to identify areas for data collection? • Want to study why a process is not performing properly or producing the desired results?
How is a fishbone diagram constructed?
Basic Steps:• Draw the fishbone diagram.... • List the problem/issue to be studied in the "head of the fish". • Label each ""bone" of the "fish". The major categories typically utilized are:
1) The 4 M’s: Methods, Machines, Materials, Manpower 2) The 4 P’s: Place, Procedure, People, Policies 3) The 4 S’s: Surroundings, Suppliers, Systems, Skills
NOTE: You may use one of the four categories suggested, combine them in any fashion or make up your own. The categories are to help you organize your ideas.
• Use an idea-generating technique (e.g., brainstorming) to identify the factors within each category that may be affecting the problem/issue and/or effect being studied. The team should ask... "What are the machine issues affecting/causing..."
• Repeat this procedure with each factor under the category to produce sub-factors. Continue asking, "Why is this happening?" and put additional segments each factor and subsequently under each sub-factor.
• Continue until you no longer get useful information as you ask, "Why is that happening?"• Analyze the results of the fishbone after team members agree that an adequate amount of detail has been provided under each
major category. Do this by looking for those items that appear in more than one category. These become the “most likely causes.”• For those items identified as the "most likely causes,” the team should reach consensus on listing those items in priority order
with the first item being “the most probable" cause.
SOURCE: North Carolina Department of Environment and Natural Resources website http://quality.enr.state.nc.us/tools/fishbone.htm
2006 amga hypertension compendium
Appendix 6MERCY CLINIC HYPERTENSION DATA ENTRY PROCESS FLOW CHART
14
Patient comes in for care
Does the patient have hypertension & Wellmark Insurance?
Usual Care
Is the hypertension flowsheet on
the chart?
Place blank flowsheet on
the chart
Fill out flowsheet
during patient's
visit
Enter flowsheet data into
SECAT database
File updated
flowsheet in chart
before next visit
No No
Yes

15hypertension care
Appendix 7MERCY CLINIC HYPERTENSION ADHERENCE FLOWSHEET DEVELOPED FOR PATIENTS WITH
WELLMARK AS THEIR PRIMARY INSURER
BP 140/90
Change in plan
Follow-up in
1 month
Counseling and
call back
Patient adherent
Routine follow-up
3-6 months
BP up for 3 months
Change Plan
Recheck BP in 1 month
<Yes
No
Yes No No
YesNo
No

2006 amga hypertension compendium
Appendix 8MERCY CLINIC HYPERTENSION STANDING ORDERS
16
TEST CONDITIONS
Office Visit 6 months If BP controlled to <140/90
1 month If BP >140/90
Lipid Profile 1 year
Basic Metabolic Profile 1 year
Urine Alb/Creat. Ratio 1 year Patients with no Hx of Abn UACR
6 months If UACR was ever >30
Complete these labs on all my patients with hypertension whenever the Standing Orders are due.
Signature Date
INTERVAL

17hypertension care
Appendix 9MERCY CLINIC SAMPLE REPORT OF PATIENTS OVERDUE FOR TESTS USED TO UPDATE
THE DATA OR TO CALL THE PATIENT IN.

2006 amga hypertension compendium
Appendix 10aMERCY CLINIC INDIVIDUAL CLINIC LEVEL PERFORMANCE REPORT
18
Hypertension Measures from July 2005 to July 2006
0%
20%
40%
60%
80%
100%
Systolic BP last12mo.
Lipids last 12mo. Glucose last 12mo Microalb last 12 mo. % SBP <140 % SBP <130
Campus (n=359) Capitol IM (n=166) South (n=365) West (n=617)
Mercy Clinic Hypertension Measures for July 2005 to July 2006
Systolic BPlast 12 mo.
Lipidslast 12 mo.
Glucoselast 12 mo.
Microalblast 12 mo.
%SBP <140 % SBP <130

19hypertension care
Appendix 10bMERCY CLINIC, CLINIC BY PROVIDER PERFORMANCE REPORT
SECAT Provider Performance Reports
Campus Clinic
HTN Data: 7/1/05-6/30/06Provider Provider 1 Provider 2 Provider 3 Provider 4 Clinic GoalTotal Patients 64 76 84 94 359SBP last 12 mo. 97% 75% 81% 69% 81% 85%Lipids last 12 mo. 70% 59% 75% 62% 65% 85%Glucose last 12 mo. 86% 63% 76% 67% 71% 85%Microalb last 12 mo. 70% 54% 56% 63% 59% 70%% SBP < 140 76% 77% 70% 83% 77% 70%% SBP < 130 45% 42% 44% 53% 47%
SECAT Provider Performance Reports
Capitol IM Clinic
HTN Data: 7/1/05-6/30/06Provider Provider 1 Provider 2 Provider 3 Provider 4 Clinic GoalTotal Patients 33 54 21 57 166SBP last 12 mo. 94% 96% 95% 96% 96% 85%Lipids last 12 mo. 82% 69% 71% 91% 80% 85%Glucose last 12 mo. 94% 96% 95% 96% 96% 85%Microalb last 12 mo. 70% 65% 48% 77% 68% 70%% SBP < 140 80% 86% 90% 91% 87% 70%% SBP < 130 35% 65% 60% 58% 56%
SECAT Provider Performance Reports
West Clinic
HTN Data: 7/1/05-6/30/06Provider Provider 1 Provider 2 Provider 3 Provider 4 Provider 5 Provider 6 Provider 7 Provider 8 Clinic GoalTotal Patients 100 69 90 130 68 68 59 33 617SBP last 12 mo. 94% 90% 88% 55% 46% 81% 81% 70% 76% 85%Lipids last 12 mo. 80% 74% 73% 67% 54% 76% 76% 88% 73% 85%Glucose last 12 mo. 88% 78% 79% 72% 57% 81% 83% 79% 78% 85%Microalb last 12 mo. 85% 59% 71% 58% 47% 71% 81% 70% 68% 70%% SBP < 140 86% 79% 75% 93% 74% 92% 92% 96% 85% 70%
% SBP < 130 66% 63% 51% 72% 48% 67% 77% 70% 64%
SECAT Provider Performance Reports
South Clinic
HTN Data: July 1, 2005-June 30, 2006
Provider Provider 1 Provider 2 Provider 3 Provider 4 Provider 5 Provider 6 Provider 7 Provider 8 Provider 9 Clinic GoalTotal Patients 48 66 43 63 51 0 48 15 20 365SBP last 12 mo. 96% 95% 95% 98% 92% 100% 100% 95% 94% 85%Lipids last 12 mo. 88% 94% 95% 95% 90% 85% 100% 95% 90% 85%Glucose last 12 mo. 90% 86% 86% 84% 86% 85% 100% 85% 85% 85%Microalb last 12 mo. 83% 82% 74% 89% 80% 85% 87% 85% 81% 70%% SBP < 140 74% 68% 90% 93% 87% 0% 88% 80% 100% 84% 70%
% SBP < 130 52% 43% 51% 61% 68% 0% 65% 41% 68% 57%
Provider 1 Provider 2 Provider 3 Provider 4 Clinic Goal

2006 amga hypertension compendium
Appendix 11MERCY CLINIC 5AS ENCOUNTER FORM – SELF-MANAGEMENT EDUCATION
20
Assess patient’s knowledge, beliefs, behaviors, and clinical data.Does patient have the desire to change behavior? Yes No
Advise about health risks and benefits of change – consider health literacy.Topics Discussed: Diet Exercise Smoking Other
Agree on a goal based on patient priorities.
*Patient Goal:
Assist to develop a personal action plan.
1. Specific behavior changes
2. Identified barriers (i.e., depression)
3. Options to address barriers
4. Follow-up plan – When: How: Phone Other
Educator Signature:
Arrange to contact the patient between visits.
* Follow-up Contact: Completed on – Date: ___________________
1. Results of behavior changes
2. Barriers encountered
3. Options to address barriers
Follow-up plan – When: How: Phone Other
Follow-up Signature:
*Required to bill insurance company (Individual visit – S9445)

21hypertension care
Appendix 12aMERCY CLINIC DIABETES EDUCATION – BLOOD SUGAR GOALS
Keep your blood sugar under control to prevent damage to many parts of the body,such as the heart, blood vessels, eyes, and kidneys
For most people, good blood sugar levels are
What should myblood sugarnumbers be ?
How can I find out what my average blood sugar is?
The hemoglobin A-1-c (HE-moh-glow-bin A-1-c) blood test shows the averageamount of sugar in your blood during the past three months. Have this test done atleast twice a year.
A test result of more than 7% is too high. At more than 7% you need a change inyour diabetes plan. Your doctor can help you decide what part of your plan tochange. You may need to change your meal plan, your diabetes medicines, or yourexercise plan.
Keep your hemoglobin A-1-c below 7%
On waking (before breakfast) 80 to 120Before meals 80 to 1202 hours after meals 180 or lessAt bedtime 100 to 140
Mark yourhemoglobin A-1-c on this
Diabetes Education --- Blood Sugar Goals

2006 amga hypertension compendium
Appendix 12bMERCY CLINIC DIABETES EDUCATION – HIGH BLOOD PRESSURE
22
Diabetes and high bloodpressure often go hand-in-hand.If you have heart, eye, orkidney problems from diabetes,high blood pressure can makethem worse.
You will see your bloodpressure written with twonumbers separated by a slash.
For example: 120/70Keep your first number below130 and your second number High Pressure can damage your heart,below 85. eyes, kidneys, and brain.
To lower my blood pressure I will:
q Lose weightq Eat more fruits and vegetablesq Eat less salt and high-sodium foods such as:
o canned soupso luncheon meatso salty snack foodso fast foods
q Drink less alcoholq Walk for one-half hour on most days
Keep your blood pressure below 130/85
You may need to take blood pressuremedicine. An ACE inhibitor is the besttype because it can slow down kidneydamage by keeping the kidneys fromlosing too much protein. Take yourmedicine every day unless your doctortells you to stop.
Name RemovedDiabetes Education --- High Blood Pressure

23hypertension care
Appendix 12cMERCY CLINIC DIABETES EDUCATION – CHOLESTEROL
Too much cholesterol can clog your blood vessels. This can cause heart attacks andstrokes. You should check your cholesterol at least once a year.
A Cholesterol bloodtest has four parts: Your number should be1. Total Cholesterol: Less than 200
2. LDL Cholesterol: Less than 100 (Bad cholesterol)
3. Triglycerides:
Less than 200(like bacon grease)
4. HDL Cholesterol:
More than 45(Good cholesterol)
For healthy blood vessels Keep your LDL less than 100
To lower my Cholesterol I will:
1. Lose weight2. Walk for 20 minutes on most days3. Eat a low-fat diet4. Eat more fruits and vegetables5. Avoid fried foods, desserts, and oils6. Read labe ls and don’t eat foods with more
than 20 grams of fat per serving7. Take medic ine if I can’t get my LDL to less
than 100
Medicines to lower cholesterol:
1. Statin drugs (Lipitor, Zocor,Pravachol, Lescol) are used to lowercholesterol
2. Take these in the evening at supperor bedtime
3. These can make your muscles ache4. Do cholesterol blood tests every
four months if you take thesemedicines
My LDL is:

2006 amga hypertension compendium
Appendix 13MORISKY SCALE USED TO MEASURE MEDICATION ADHERENCE
24
The Morisky Scale is a validated scale designed to estimate the risk of medication non-adherence. It has been cited in more than 70 articles since its publication in 1986. It’s used for many different diseases such as hypertension, hyperlipidemia, asthma, and HIV. Scores are based on patient responses to four Yes or No questions.
Morisky Scale Questions
1. Do you ever forget to take your medicine?2. Are you careless at times about taking your medicine?3. When you feel better do you sometimes stop taking your medicine?4. Sometimes if you feel worse when you take the medicine, do you stop taking it?
Scoring the Morisky Scale
Yes = 0 and No = 1
• Zero is the lowest level of medication adherence• 4 is the highest level of medication adherence• Patients scoring 0 or 1 would benefit most from pharmacist intervention• Goal: screen for those in which your pharmacist time should be spent on enhancing adherence
Source: Morisky DE, Green LW, Levine DW. Concurrent and predictive validity of a self-reported measure of medication adherence. Medical Care 1986; 24: 67-74.
25hypertension care
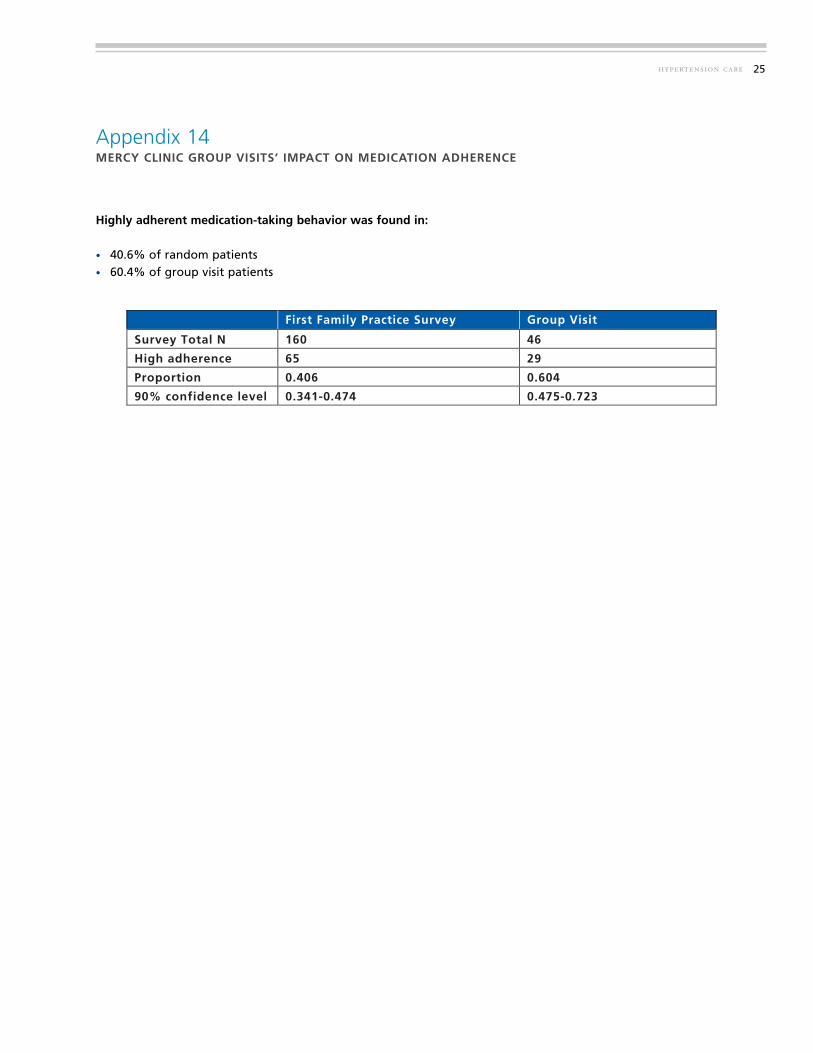
Appendix 14MERCY CLINIC GROUP VISITS’ IMPACT ON MEDICATION ADHERENCE
First Family Practice Survey Group Visit
Survey Total N 160 46
High adherence 65 29
Proportion 0.406 0.604
90% confidence level 0.341-0.474 0.475-0.723
Highly adherent medication-taking behavior was found in:
• 40.6% of random patients • 60.4% of group visit patients

Diabetes Quality ParametersProcessGoal *
OutcomeGoal*
Diabetes overall** 80% 70%Proportion with HgA1c < 8.0 or 1% improvement over the last year (i.e. 8.6 to7.6) 85% 70%Proportion with LDL <= 130 85% 70%Proportion with BP <= 140/90 85% 70%Nephrology screening or evidence of disease 70%
Documentation of diabetes education or patient refusalEstablishBaseline
Hypertension Quality overall** 80% 70%Proportion with BP <= 140/90 85% 70%Lipids checked in last 30 months 85%Glucose checked in last 30 months 85%Proportion with microalbumin documented in the last year 70%
Patient education documentedEstablishBaseline
Quality Incentive Payment $5,000 $2,500
Pharmacy Targets***ProcessGoal *
IncentivePayment
Per member per month cost: % < Insurer Average 4.00% $5,000Per member per month cost: % < Insurer Average 6.00% $2,500
* If a parameter is not within goal, eveidence of action to achieve the goal will meet criteria.** Overall goal is the average of all the goals in the disease suite.*** This is a group goal paid to all or none.
Definitions:
Outcome Goals reflect clinical measurement described in the left hand column.
Process Goals are whether or not a test was done within the last year (unloess otherwise stated) andcan be determined by billing data.
2006 amga hypertension compendium
Appendix 15MERCY CLINIC RECOGNIZING AND REWARDING BEST PRACTICES (RRBP) QUALITY AND PHARMACY TARGETS
26
<130<140/90
<140/90
unless otherwise stated) and
lefthand column.