best-value based on performance - lrrb
TRANSCRIPT

Take the steps...
Transportation Research
Research...Knowledge...Innovative Solutions!
Best-Value Based on Performance
2008-40

Technical Report Documentation Page 1. Report No. 2. 3. Recipients Accession No. MN/RC 2008-40 4. Title and Subtitle 5. Report Date
September 2008 6.
Best-Value Based on Performance
7. Author(s) 8. Performing Organization Report No. Magdy Abdelrahman, Ph.D., Ahmed El-Yamany, and Scott Schram
9. Performing Organization Name and Address 10. Project/Task/Work Unit No. 11. Contract (C) or Grant (G) No.
Department of Civil Engineering North Dakota State University CIE 201 Fargo, North Dakota 58105
(c) 88127
12. Sponsoring Organization Name and Address 13. Type of Report and Period Covered Final Report 14. Sponsoring Agency Code
Minnesota Department of Transportation 395 John Ireland Boulevard, Mail Stop 330 St. Paul, Minnesota 55155 15. Supplementary Notes http://www.lrrb.org/PDF/200840.pdf 16. Abstract (Limit: 200 words) The Best-Value procurement strategy is gaining interest from federal and state agencies. The strategy increases the value added to the project for each dollar added. This report discusses a new concept of Best-Value, that is; a rational and flexible model based on expected performance. The model flexibility is obvious in the selection of parameters, to be included in the contractor selection process, and in the determination of the parameter’s weights. The model rationality will be achieved through relating all awarded score to the agency’s expected performance. The establishment of the Best-Value model calls the past record of the contractor work for the agency as an indicator of qualification trend. Contractor Best-Value will be the base in selecting the most appropriate contractor that has the best qualifications for a given project. Data are collected from groups of experts in the Minnesota Department of Transportation and processed through the analytic hierarchy process (AHP) to establish the parameter weights. While this research assists DOTs in selecting the best contractor, the shared results are relevant to both academics and practitioners. A computer software “MnCAST” has been developed to help implementing the developed Best-Value system.
17. Document Analysis/Descriptors 18. Availability Statement Best-Value, Contractor Selection Process, Expected Performance, Parameter Score, Analytical Hierarchy Process, Project Specific Model
No restrictions. Document available from: National Technical Information Services, Springfield, Virginia 22161
19. Security Class (this report) 20. Security Class (this page) 21. No. of Pages 113
22. Price Unclassified Unclassified

Best-Value Based on Performance
Final Report
Prepared by:
Magdy Abelrahman, Ph.D. Ahmed Elyamany
Scott Schram
Department of Civil Engineering North Dakota State University
September 2008
Published by:
Minnesota Department of Transportation Research Services Section
395 John Ireland Boulevard, MS 330 St. Paul, Minnesota 55155-1899
This report represents the results of research conducted by the authors and does not necessarily represent the views or policies of the Minnesota Department of Transportation and/or the Center for Transportation Studies. This report does not contain a standard or specified technique.

ACKNOWLEDGEMENTS
The author would like to acknowledge the support of Mn/DOT for the funding of this research. Thanks for Jay Heitpas and Mike Leegard from Mn/DOT contract office for steering the research work. Recognition is also for J.T. Anderson for providing the data used in this research and the involvement in the discussion about selecting the model parameters. Appreciation is also to Mn/DOT officials who enrich the research team knowledge with their field experience. Naming a few, are, Tom Ravn, Joel Williams, Paul Stembler, Dan Kuhn, and Jeff Perkins. Special acknowledgement is to Mr Gary Thompson for his technical support during his time with Mn/DOT.

TABLE OF CONTENTS
1. INTRODUCTION..................................................................................................................... 1
1.1 BACKGROUND........................................................................................................................ 1 1.2 OBJECTIVES ........................................................................................................................... 1 1.3 SYSTEM FLEXIBILITY ............................................................................................................. 1 1.4 IMPLEMENTATION .................................................................................................................. 2 1.5 REPORT ORGANIZATION......................................................................................................... 2
2. CURRENT PRACTICE OF BEST-VALUE.......................................................................... 3
2.1 OVERVIEW ............................................................................................................................ 3 2.2 THE BEST-VALUE SYSTEM..................................................................................................... 4
2.2.1 Definition ....................................................................................................................... 4 2.2.2 Best-Value Concept 1 (Parameters) .............................................................................. 7 2.2.3 Best-Value Concept 2 (Evaluation Criteria).................................................................. 8 2.2.4 Best-Value Concept 3 (Evaluation Rating System)...................................................... 10 2.2.5 Best-Value Concept 4 (Award Algorithm) ................................................................... 10
3. DATA COLLECTION ........................................................................................................... 12
3.1 DATA SOURCES.................................................................................................................... 12 3.2 BEST-VALUE REPORTS......................................................................................................... 12 3.3 MN/DOT DATA ................................................................................................................... 12
3.3.1 Innovative Contracting Methods.................................................................................. 12 3.3.2 Mn/DOT Questionnaire ............................................................................................... 14 3.3.3 Questionnaire Summary............................................................................................... 14 3.3.4 Mn/DOT Engineers Meeting........................................................................................ 15
3.4 OTHER BEST-VALUE SOURCES ............................................................................................ 15
4. MODEL DEVELOPMENT ................................................................................................... 16
4.1 MODEL CONCEPTS ............................................................................................................... 16 4.1.1 Contractor Parameter Scores...................................................................................... 16 4.1.2 Parameter Weights ...................................................................................................... 16 4.1.3 Model Parameters ....................................................................................................... 16
4.2 MODEL EVALUATION........................................................................................................... 17 4.2.1 TH-113 Project ............................................................................................................ 17 4.2.2 TH-494 Project ............................................................................................................ 17 4.2.3 Model Implementation Methodology ........................................................................... 17 4.2.4 Calculations of Model Weight (Wi).............................................................................. 20 4.2.5 Calculations of Best-Value Model ............................................................................... 21 4.2.6 Analysis of Results ....................................................................................................... 23

5. SOFTWARE DEVELOPMENT ........................................................................................... 25
5.1 INTRODUCTION .................................................................................................................... 25 5.2 BEST-VALUE EQUATION ...................................................................................................... 25
5.2.1 Best-Value Parameters’ Equations ............................................................................. 25 5.2.2 Calculating Parameter Scale....................................................................................... 26 5.2.3 Calculating Parameters Weight: ................................................................................. 27
5.3 THE MNCAST SOFTWARE................................................................................................... 27 5.3.1 Best-Value Example ..................................................................................................... 27 5.3.2 Example Solution:........................................................................................................ 29
6. MODEL VALIDATION ........................................................................................................ 35
6.1 INTRODUCTION..................................................................................................................... 35 6.2 BEST-VALUE BASED ON EXPECTED PERFORMANCE............................................................. 35 6.3 PART-1 OF SENSITIVITY ANALYSIS ...................................................................................... 36
6.3.1 The Best-Value Model.................................................................................................. 37 6.3.2 Parameters Weight (Wi) .............................................................................................. 38 6.3.3 Best-Value Parameters ................................................................................................ 39 6.3.4 Best-Value Determination............................................................................................ 39 6.3.5 Modeling Best-Value Parameters ................................................................................ 40 6.3.6 Parameters Score (Si) .................................................................................................. 40 6.3.7 Data Collection and Case Studies ............................................................................... 43 6.3.8 Model Implementation ................................................................................................. 43 6.3.9 Sensitivity of the Best-Value Index............................................................................... 45
6.4 PART-2 OF SENSITIVITY ANALYSIS ...................................................................................... 48 6.4.1 Effect of Changing the Number of Data Record on Best-Value .................................. 52 6.4.2 Effect of Changing the Included Work Types on Best-Value....................................... 53 6.4.3 Effect of Changing the Included Districts on Best-Value............................................ 54 6.4.4 Effect of Changing Bid Price/Performance Parameters Weight Ratio on Best-Value.....................................................................................................................55 6.4.5 Effect of Changing the 0 References Point for Bid Price on Best-Value..................... 56 6.4.6 Effect of Changing the 0 References Point for Performance Parameters on Best-Value.................................................................................................................... 57
7. SUMMARY AND CONCLUSIONS ..................................................................................... 59
7.1 SUMMARY............................................................................................................................ 59 7.2 SUMMARY OF PART-1 .......................................................................................................... 59 7.3 SUMMARY OF PART-2 .......................................................................................................... 60
8. REFERENCES........................................................................................................................ 61
APPENDIX A MN/DOT RESIDENT ENGINEER QUESTIONNAIRE
APPENDIX B MN/DOT QUESTIONNAIRE

APPENDIX C MNCAST MANUAL
APPENDIX D SOFTWARE TRAINING PRESENTATION

LIST OF TABLES
Table 2.1 Evaluation Criteria [1] .................................................................................................... 6 Table 3.1 Total Collected Best-Value Parameters ........................................................................ 13 Table 3.2 Initially Selected Parameters for Best-Value Model .................................................... 15 Table 4.1 Row Values of Model Parameters for Both Pilot Projects ........................................... 20 Table 4.2 Relative Weight Calculations for Project TH-113........................................................ 22 Table 4.3 Relative Weights for Projects TH-113 and TH-494 ..................................................... 22 Table 4.4 Best-Value Calculation for Project TH-113 ................................................................. 22 Table 4.5 Best-Value for Projects TH-113 and TH-494 within the Two Cases ........................... 23 Table 4.6 Trade-off Analyses for Projects TH-113 and TH-494 within the Two Cases.............. 24 Table 6.1 Parameters of Best-Value and Their URL and LRL..................................................... 38 Table 6.2 Weights of Parameters Corresponding to Various Bid Price Weights (TH-494)......... 44 Table 6.3 Samples of Sensitivity Analysis Results for Selected Cases ........................................ 46 Table 6.4 Sensitivity Analysis for Decision Selection.................................................................. 48 Table 6.5 MNCAST Inputs* for Different Contractors................................................................ 49 Table 6.6 Matrix of MNCAST Settings........................................................................................ 50 Table 6.7 Sensitivity Analysis Cases ............................................................................................ 51 Table 6.8 Results of Sensitivity Analysis Cases........................................................................... 52 Table B-1 Percentage Engineers Satisfaction for Question one ................................................. B-1 Table B-2 Percentage Engineers Satisfaction for Question Two................................................ B-1 Table B-3 Percentage Engineers Satisfaction for Contractor Qualification Parameters ............ B-2 Table B-4 Percentage Engineers Satisfaction for Contractor Experience Parameters ............... B-2 Table B-5 Percentage Engineers Satisfaction for Project Performance Parameters................... B-2 Table B-6 Percentage Engineers Satisfaction for Project Quality Parameters ........................... B-2 Table B-7 Percentage Engineers Satisfaction for Financial Situation Parameters..................... B-2 Table B-8 Percentage Engineers Satisfaction for Subcontractor Parameters............................. B-3 Table B-9 Data Sources as Suggested by Resident Engineers................................................... B-3

LIST OF FIGURES
Figure 2.1 Best-Value Procurement Process [1]............................................................................. 5 Figure 2.2 Best-Value Evaluation Rating Systems [1] ................................................................... 6 Figure 2.3 Best-Value Award Algorithms [1] ................................................................................ 7 Figure 4.1 Relation between Rough Values of Parameter and Parameter Score.......................... 19 Figure 4.2 Part-2 of Mn/DOT Questionnaire................................................................................ 19 Figure 4.3 Part-1 of Mn/DOT Questionnaire Evaluation Parameters Importance
Questionnaire .................................................................................................................... 21 Figure 5.1 Calculating Parameter Scale for Corresponding Parameter’s Value........................... 26 Figure 5.2 Procedures Used in Best-Value Calculation................................................................ 28 Figure 5.3 Entering Project Information....................................................................................... 29 Figure 5.4 Setting the Direction for Project Parameter................................................................. 30 Figure 5.5 Selecting Quality Tests Used in the Current Project................................................... 30 Figure 5.6 Selecting form Output Options.................................................................................... 31 Figure 5.7 Setting the Comparison Option for the Project ........................................................... 31 Figure 5.8 Selecting Bidding Contractors and Entering Corresponding Offers ........................... 32 Figure 5.9 Selecting Project Parameters ....................................................................................... 33 Figure 5.10 Display of Results...................................................................................................... 34 Figure 6.1 Research Methodologies ............................................................................................. 42 Figure 6.2 Score of Normalized Scale for Various Parameters; (a) Descending slope and
(b) Ascending slope ......................................................................................................... 43 Figure 6.3 Lower reference limit (LRL) values; (a) LRL = 50% for all parameters,
(b) LRL = 70% for all parameters, and (c) LRL = 90% for all parameters. ......................47 Figure 6.4 The Effect of Changing Data Record on Best-Value Results ..................................... 53 Figure 6.5 The Effect of Changing the Included Work Types on Best-Value Results................. 54 Figure 6.6 The Effect of Changing the Included Districts on Best-Value Results ....................... 55 Figure 6.7 The Effect of Changing Bid Price/Performance Parameters Weight Ratio on
Best-Value Results............................................................................................................ 56 Figure 6.8 The Effect of Changing 0 References Point for Bid Price on Best-Value Results...... 57 Figure 6.9 The Effect of Changing 0 References Point for Performance Parameters on
Best-Value Results............................................................................................................ 58 Figure C-1 Project Information Window.................................................................................... C-4 Figure C-2 Edit Types Window.................................................................................................. C-5 Figure C-3 Edit Location Window ............................................................................................. C-5 Figure C-4 Parameter Settings in Options Window ................................................................... C-6 Figure C-5 Project Location Code Settings in Option Window ................................................. C-7 Figure C-6 Project Type Code Settings in Option Window ....................................................... C-7 Figure C-7 Quality Settings in Option Window ......................................................................... C-8 Figure C-8 Output Settings in Option Window .......................................................................... C-8 Figure C-9 Comparison Options Window .................................................................................. C-9 Figure C-10 Select Contractors Window.................................................................................. C-11 Figure C-11 New Contractor Window...................................................................................... C-11 Figure C-12 Select Parameters Window................................................................................... C-12 Figure C-13 New Parameter Window....................................................................................... C-13 Figure C-14 Summary of Results in Best-Value Results Window........................................... C-14

Figure C-15 Details of Results in Best-Value Results Window............................................... C-15 Figure C-16 Input Data in Best-Value Results Window .......................................................... C-16

EXECUTIVE SUMMARY
Introduction The term Best-Value has many competing definitions in the industry. One of the suggested broad definitions of Best-Value is “A procurement process where price and other key factors are considered in the evaluation and selection process to enhance the long-term performance and value of construction” [1]. The Best-Value (BV) procurement allows contracting agencies to evaluate offers based on total costs, technical solutions, completion dates, and other criteria to enhance the long term performance of projects. The Best-Value system is viewed as a balance between Fixed-Price Sealed Bidding and Sole Source Selection, or between price and qualification considerations. A key concept in Best-Value procurements is the focus on selecting the contractor with the offer ‘‘most advantageous to the government where price and other factors are considered.’’ The factors other than price can vary, but they typically include technical and managerial merits, financial health, and past performance [5, 6, 7, and 8]. Another key element in the success of innovative contracting techniques, including Best-Value, is the communication between owners and contractors in two main areas: (i) the rationality in ranking the contractor qualification and (ii) defining the owner expectations. Owners must think carefully of what is ‘‘valuable’’ in the product and not just ‘‘important’’ or ‘‘required’’ in the selection process. Using technical, managerial, or performance elements that are of indeterminate value, while important or required, simply clouds the decision. Owners should only base the Best-Value selection criteria on project elements that add measurable value to the project [9]. It is also important that owners set standards for the procurement process. Owners must carefully define what is expected and communicate that with contractors. An earlier research [10] shows agencies pre-qualify contractors using subjective values that may not follow a rational approach. A group of evaluators rate the contractor expected performance on several key areas such as staff, experience, project approach, schedule, and innovation. Using subjective equations or rules introduces a different form of bias to the procurement process. Research indicates that most agencies do not define the expected level of contractor performance in low-bid procurement systems. The contractor is only required to secure the necessary bonds before submitting a bid. The pre-qualification process is different because the contractor past performance has nothing to do with getting the next job, unless debarred. Even if a contractor fails miserably on an area, such as quality on one project, the contractor is able to bid the next project [11].
Study Objectives The objective of this report is to develop a procurement system using the Best-Value concept. Best-Value system is driven by the expected performance of the contractor. To be practical, the procurement system is flexible in choosing the selection criteria for each project according to its needs. The Best-Value system allows the engineers to set the priorities of the selection criteria by using the Analytical Hierarchy Process.
Study Significance The presented research improves the bid selection process in Minnesota. Mn/DOT will be in a better position to make the decision of moving from contractor selection solely based on minimum qualifications and low bids to a new system; “Best-Value Based on Performance.” The new system will reward contractors for quality of their work, for public safety, for compliance with the contract requirements, the business and employment requirements and the environmental requirements and for coordination with other elements of the construction

process. Rewarding contractors for their quality work will eventually improve the quality of pavement facilities. The benefits of this research are expected in addressing issues related to the pre-qualification mechanism and the contractor rating systems of Mn/DOT.
Best-Value Model The parameters and evaluation criteria of Best-Value are first determined from the literature, survey, case studies, and meetings [12]. Based on previous application of Best-Value model within DOTs, it is suggested that evaluation criteria should be less in number and easy to obtain from project records. The research team discussed the possibility and validity of each evaluation criteria, included in the initial list, to be considered in the conceptual model. This process ends with a list of the evaluation criteria and suggested measurement factors. Two facts are kept in mind: the less evaluation criteria a Best-Value model has, the easier it is to deal with, and the probable lack of familiarity of DOT officials and contractors with Best-Value environment requires the need to get involved in the new concept slowly.
The first parameter selected to be included in the model is bid price (BP). This parameter was the most important parameter in selecting contractors using the traditional procurement system. For public agencies, lowest bid selection is enforced by law even if there is no need. Contract time (CT) is used as a competitive parameter in contracts that require a fast track. This parameter represents the “B” part in the A+B bidding process which yield from contract time multiplied by road-user-cost. The next parameter is Lane Rental (LR) which reflects the impact of construction activities on the road users’ time and money. Lane Rental (LR) is equal to the percentage of lane closure cost divided by the total bid amount. Past quality (PQ) parameter shows the quality of final product where it is evaluated by the percentage of rejected test specimens divided by the total test specimens.
The general equation for the Best-Value is shown below:
∑=
×=n
iiij WCPSBV
1
Where; BVj= Best-Value for contractor j, n = number of parameters included in the Best-Value equation, CPSi = Contractor Parameter i Score, Wi= Relative weight of parameter i
The parameters used to evaluate contractors are scored relatively to each other. The contractor with the best parameter value will be the reference for others with worst values. Parameter weights (summed to 1.0) capture the relative importance of each parameter in the selection process according to the owner’s priorities. The weights are assigned to the parameters with the use of the engineering opinion about the importance of the parameters relative to each others.
The MNCAST Software The software named “MNCAST” was developed as part of this research to facilitate the implementation of the proposed system in real life situations. The contractor past performance will be used in the software to derive a score for each contractor based on his expected performance. The engineers’ input to the software determines the weights of the selection criteria through a questionnaire. This research presents a tool to select the performing contractor rather than selecting based solely on the lowest bid. The proposed system was implemented on two pilot projects form Mn/DOT. The MNCAST software consists of three parts: the input (input

menus), the engine, and the output (output menus). The input includes but is not limited to; project name, type, location, years to be considered from past contractor history, contractor data, parameter’s score, and weight. The output includes contractor scores and Best-Value details.
Study Findings Previous attempts to implement Best-Value contracting did not consider the unique characteristics of each construction project. The current Best-Value model, unlike previous models, considers each project as unique. The aim was to establish a flexible model capable of being tailored to certain project needs. The inclusion and exclusion of parameters and different weights give owners flexibility. Historical records of contractor performance act as inputs to the Best-Value system. These records are an indication of the contractor’s qualification trend. The model rationality is achieved through relating all awarded scores to the agency’s expected performance. The establishment of the Best-Value model uses the past record of the contractor work for the agency as an indicator of the contractor’s qualification trend. This research incorporates pre-qualification as a first level screening technique in selecting top contractor bids in Best-Value procurement and then applies a rational scoring system in the final selection. Data are collected from groups of experts in the Minnesota Department of Transportation and processed through the analytic hierarchy process (AHP) to establish the parameter weights. A sensitivity analysis is conducted to verify the model scale and calculation methods. The analysis shows reasonable differences in the parameter scores reflecting the differences in the contractor qualifications.
The sensitivity analysis clearly shows that a better selection would be more reliable and significant if the following condition occurs:
• More data records are used for the contractors such as data record for work done in other districts.
• The implementation of the Best-value system would start with a higher weight assigned to bid price, between 80-90% of the total weight, at which the selection will depend on the lowest bidder and considering other performance parameters. The opposite case would be for the weight of bid price ranges between 20-30% of the total weight leaving a higher weight value of 70-80% for the performance parameters at which the selection will be based heavily on the contractor with better performance. Reliable documentation of the contractor performance is necessary in this case.
• “0-reference limit” for bid price set as equal to max. Bid. Part-1 of this report discusses an alternative of setting a lower-reference-limit and the use of prescreening steps.
• The use of “0-reference limit” for performance parameters as equal to a specific percentile, the 60th to the 75th percentile of the contractor’s population in this case, is arbitrary and depends on available records to support the selected value.

1
1. INTRODUCTION
1.1 Background The Best-Value procurement strategy is gaining interest from federal and state agencies. The term Best-Value has many competing definitions in the industry. One of the suggested broad definitions of Best-Value is “A procurement process where price and other key factors are considered in the evaluation and selection process to enhance the long-term performance and value of construction” (1). This definition was disaggregated into four primary concepts: parameters, evaluation criteria, rating systems, and award algorithms. Based on the analysis of the literature, meetings, and case studies, it is determined that a Best-Value procurement, which is simple to implement and flexible in the selection of parameters and award algorithms, is the most effective approach in the context of a traditional bidding system.
The Best-Value procurement allows contracting agencies to evaluate offers based on total costs, technical solutions, completion dates, and other criteria to enhance the long term performance of projects. When used correctly, the strategy obtains the optimum combination of price and technical solution for the public and rewards those who propose innovative concepts that enhance product quality or lower the price of quality. The inclusion of key parameters or evaluation factors, such as construction quality record, that match specific needs of a project guarantees the selection of the best contractor for a specific project. Merely, this happens when the agency adopting the system realizes the need, in each project, to use the Best-Value system as a unique case. The Best-Value system is viewed as a balance between Fixed-Price Sealed Bidding and Sole Source Selection, or between price and qualification considerations. The findings of NCHRP 10-61 research study show a trend in the construction public sector towards the increased use of various Best-Value procurement methods and a long-standing concern expressed by public owners [1]. However, low-bid procurement system, while promoting competition and a fair playing field, may not result in the Best-Value for dollars expended or the best performance during construction.
1.2 Objectives This report outlines the basic aspects related to the implementation of Best-Value procurement with an emphasis on required data elements in the Department of Transportation (Mn/DOT). The main objective is to develop a system that is driven by the “Best-Value based on performance” concept and considering flexible set of bid selection criteria to evaluate the current contracting procedures by Mn/DOT. The presented information outlines data collection activities from Mn/DOT records required for the completion of this project.
1.3 System Flexibility This research demonstrates few possibilities with the implementation of the proposed Best-Value system. The system incorporates pre-qualification as a first level screening technique in selecting top contractor bids in Best-Value procurement and then applies a rational scoring system in the final selection. Data are collected from groups of experts in the Minnesota Department of Transportation and processed through the analytic hierarchy process (AHP) to establish the parameter weights. A sensitivity analysis is conducted to verify the model scale and calculation methods. The analysis shows reasonable differences in the parameter scores reflecting the differences in the contractor qualifications.

2
1.4 Implementation The presented research improves the bid selection process in Minnesota. Mn/DOT will be in a better position to make the decision of moving from contractor selection solely based on minimum qualifications and low bids to a new system; “Best-Value Based on Performance.” The new system will reward contractors for quality of their work, for public safety, for compliance with the contract requirements, the business and employment requirements and the environmental requirements and for coordination with other elements of the construction process. Rewarding contractors for their quality work will eventually improve the quality of pavement facilities. The benefits of this research are expected in addressing issues related to the pre-qualification mechanism and the contractor rating systems of Mn/DOT. Pilot projects are used during model implementation to clarify the impact of the Best-Value system in the contractor selection process. Results of model implementation shows the significant turnover from the lowest bid strategy to the choice of the best contractor based on past contractor performance. The maximum value of Best-Value for pilot projects has gone to a contractor other than the lowest bidder. This happens as an impact of including parameters more than just the lowest bid.
1.5 Report Organization Chapter 2 presents an overview of the literature review, with primary emphasis placed on the concept of Best-Value and its components.
Chapter 3 discusses the sources that have been used to collect the data for the model development.
Chapter 4 presents the model development steps and the analysis of results of two pilot projects. The pilot project highlights the effectiveness of the model in solving the problem under investigation.
Chapter 5 presents the development of MNCAST Software with some discussion of how the software could be used in selecting the best contractor.
Chapter 6 includes the sensitivity analysis of the model parameter and the sensitivity analysis of the results obtained from MNCAST.
Chapter 7 summarizes the report and highlights the findings of the report.

3
2. CURRENT PRACTICE OF BEST-VALUE
2.1 Overview Literature indicates that low-bid procurement system encourages contractors to implement cost-cutting measures instead of quality enhancing measures and therefore makes it less likely that contracts will be awarded to the best-performing contractors who will deliver the highest quality projects [1]. However, State and Federal Sectors, have moved aggressively towards the use of Best-Value procurement, have attempted to measure its relative success, and are convinced that it achieves better results than low-bid due to the following reasons: (i) the low-bid method fails to serve the public interest because the lowest offer may not result in the lowest overall cost to the public, (ii) the Best-Value procurement provides a reduction in cost growth from 5.7% to 2.5% and a reduction in claims and litigation by 86%, (iii) a 1997 National Science Foundation study concluded that design-build contracts procured using the two-step Best-Value procurement procedure had the best cost and schedule growth performance, albeit representing a very small average improvement over the other procurement methods and (iv) the Best-Value procurement was emerging as a viable alternative to traditional low-bid method in the public sector construction [1, 2, 3 and 4].
A key concept in Best-Value procurements is the focus on selecting the contractor with the offer ‘‘most advantageous to the government where price and other factors are considered.’’ The factors other than price can vary, but they typically include technical and managerial merits, financial health, and past performance [5, 6, 7, and 8]. Another key element in the success of innovative contracting techniques, including Best-Value, is the communication between owners and contractors in two main areas: (i) the rationality in ranking the contractor qualification and (ii) defining the owner expectations. Owners must think carefully of what is ‘‘valuable’’ in the product and not just ‘‘important’’ or ‘‘required’’ in the selection process. Using technical, managerial, or performance elements that are of indeterminate value, while important or required, simply clouds the decision. Owners should only base the Best-Value selection criteria on project elements that add measurable value to the project [9]. It is also important that owners set standards for the procurement process. Owners must carefully define what is expected and communicate that with contractors. An earlier research [10] shows agencies pre-qualify contractors using subjective values that may not follow a rational approach. A group of evaluators rate the contractor expected performance on several key areas such as staff, experience, project approach, schedule, and innovation. Using subjective equations or rules introduces a different form of bias to the procurement process. Research indicates that most agencies do not define the expected level of contractor performance in low-bid procurement systems. The contractor is only required to secure the necessary bonds before submitting a bid. The pre-qualification process is different because the contractor past performance has nothing to do with getting the next job, unless debarred. Even if a contractor fails miserably on an area, such as quality on one project, the contractor is able to bid the next project [11].
Legislation at the federal, state, and local levels is moving towards allowing the use of Best-Value procurement strategies, which include price and other factors deemed to be in the best interest of the agency. Best-Value procurement offers:
• Reduction in cost growth • Lower life-cycle-cost

4
• Time-savings • Innovation • Higher quality construction • Reduced procurement risk
Viewed as a balance between Fixed-Price Sealed Bidding and Sole Source Selection, Best-Value systems mold qualifications into the decision making process. Literature on the Best-Value focuses on three main aspects: industry trends, procurement methods, and implementation.
Traditional industry practice includes negotiated procurements in the private sector, contracting by negotiation, and the ABA model, which considers objective, measurable criteria such as life-cycle-cost. Today, Best-Value is a topic of interest in various legislative sessions [1]. Colorado recently revised statutes that allow “competitive sealed best-value bidding”, while the Minnesota DOT sponsored a case study of Best-Value (State Project 2735-172). In the case of the Mn/DOT study, proposals were neither scored nor ranked, but evaluated for responsiveness to technical criteria. Interest in Best-Value even extends as far as California, where a Los Angeles City Charter provision allowed Best-Value to be included into the selection process. Federal agencies such as the Army and Navy also recognize the benefits of the Best-Value system. The Federal Acquisitions Regulation (FAR) includes commentary regarding the shortcoming of the low-bid method in serving the public interest [2]. A Navy study shows reduced claims and cost growth as advantages of Best-Value procurement over traditional methods [3]. A 1997 National Science Foundation study concluded that design-build projects using the Best-Value system had superior cost and schedule performance compared to other methods. For many years the Federal Highway Administration (FHWA) allowed alternative procurements using Best-Value concepts embedded in trial or experimental contracting methods for selected highway projects. NCHRP 10-61 reports 27 US transportation agencies had experience with Best-Value procurement. The study recommends basic implementation strategies that address legislative guidelines, model specifications, industry collaboration, and pilot projects [1].
2.2 The Best-Value System NCHRP 10-61 [1] evaluated over 50 case studies from all sectors of construction to identify and categorize best-value concepts used in the public sector construction industry. Agencies included the US Army Corps of Engineers, US Air Force, National Aeronautics and Space Association, Spanish Road Administration, Swedish Highway Administration, US Forest Service, and a number of US Departments of Transportation. While the majority of these case studies involved design-bid-build projects, some included design-build projects.
2.2.1 Definition Best-Value can be defined as a procurement process that considers price and other key factors in the evaluation and selection process to enhance the long-term performance and value of construction.
The following is an appropriate equation for the Best-Value [1]:
Best-Value* = A.x + B.x + P.x + Q.x + D.x (2.1)
Where:

5
x = weight
A = Cost
B = Time
P = Performance & Qualifications
Q = Quality Management
D = Design Alternates
The Best-Value definition can be dissected into four primary components used to describe its nature. These primary concepts are as follows:
• Parameters • Evaluation criteria • Rating systems • Award algorithms
The system is graphically depicted as shown below.
Figure 2.1 Best-Value Procurement Process [1]
Table 2.1 and Figures 2.2 and 2.3 present the components of the Best-Value procurement. More details are presented later in the report.

6
Table 2.1 Evaluation Criteria [1]
Figure 2.2 Best-Value Evaluation Rating Systems [1]

7
Figure 2.3 Best-Value Award Algorithms [1]
2.2.2 Best-Value Concept 1 (Parameters) Literature shows selection strategy, selection criteria, model form, parameter weights, and other technical factors varied significantly. The common consensus among case studies, surveys, and interview results, shows Best-Value procurement as a flexible, multi-parameter system where project priorities drive parameter selection. Best-Value parameters are presented:
2.2.2.1 Cost Best-Value cost parameters generally fall into two categories:
• A.0= Initial capital costs of construction
• A.1= Life-Cycle Costs incurred after construction is complete. Life-cycle cost has the main advantage of permitting the owner to compare the long-term advantages of competing proposals using an engineering economic analysis.
2.2.2.2 Time Including time in the Best-Value model allows the contractor to establish a schedule that compliments the construction plan.
• B.0= Time
• B.1= Lane Rental
• B.2= Traffic Control
In this case, both lane rental and traffic control systems permit the owner to communicate the need to minimize a project’s impact on the traveling public during construction. These parameters create an incentive toward innovative management of congestion in work zones reducing detour time by rewarding proposals that minimize construction impacts on traffic.

8
2.2.2.3 Performance & Qualifications Qualification parameters allow the owner to obtain some of the benefits from the historically accepted practice of the Brooks Act; Qualifications-Based Selection (QBS) used for procurement of design profession contracts.
• P.0= Prequalification • P.1= Past Project Performance • P.2= Personnel Experience • P.3= Subcontractors Information • P.4= Project Management Plans
2.2.2.4 Quality Management The ability to review a contractor’s quality management plan before the contract is awarded is a primary advantage of quality parameters. Doing so has the potential to change the whole dynamic of quality management from an adversarial, compliance-based system to a competitive, award-to-the-best-plan system. Coupled with some form of warranty or performance-based acceptance indicator, these parameters create a system aimed toward delivering quality. Some case studies showed the use of an extended warranty pay item in the bid form, thus creating an environment that communicates the owner’s willingness to pay for the desired level of quality.
• Q.0= Warranty
• Q.1= Warranty Credit
• Q.2= Quality Parameter measured with % in limits
• Q.3= Quality Parameter using performance indicator
• Q.4= Quality Management Plans
2.2.2.5 Design Alternates Design criteria are components of many best-value procurements, particularly when highway agencies are soliciting bid alternates under design-bid-build or design-build delivery methods. Design alternates have advantages and disadvantages, depending on the delivery method.
Highway agencies have experimented with alternate bids for specific materials, construction items, or pavement types with some success, and evaluated the value received in terms of life-cycle cost.
• D.0= Design with bid alternate
• D.1= Performance specifications
2.2.3 Best-Value Concept 2 (Evaluation Criteria) The Best-Value system requires the parameters be assigned evaluation criteria. The literature review identified four categories of such criteria [1].
2.2.3.1 Management The success of a best-value project arguably depends on the people and organizations selected to execute it.

9
Three general varieties of management criteria are as follows:
1. Qualifications of the individual personnel 2. Past performance of the organizations on the best-value team 3. Plans to execute the project
2.2.3.2 Schedule Developing schedule evaluation criteria for the best-value selection is more than just setting a contract completion date. All foreseen material impacts on the scheduled completion date must be disclosed in the solicitation.
Schedule criteria can be categorized in four general forms:
1. Completion criteria 2. Intermediate milestone criteria 3. Restrictive criteria 4. Descriptive criteria
2.2.3.3 Cost Properly written submittal requirements give the owner an opportunity to obtain cost information from bidders. Doing so allows owners to develop an understanding of the contractor’s thought process in developing the proposal and to obtain a competitive breakdown of project costs to use later in change order negotiations.
Three types of cost information requirements and associated evaluation were found:
1. Typical cost limitation criteria set by the owner:
• Maximum price
• Target price
• Funds available
• Public project statutory limits
• Type of funding
• Multiple fund sources • Fiscal year funding
2. Cost break-downs 3. Life-cycle costs 4. Design Alternate
While the bidding of design alternates for highway construction projects is not a new concept, it is not common practice in the United States. Nevertheless, traditional highway construction projects often contain limited requirements for design alternate components, for example contractor-furnished/DOT-approved asphalt and concrete mix. Such projects can be reviewed to determine how to factor design alternates into the Best-Value procurement.

10
2.2.4 Best-Value Concept 3 (Evaluation Rating System) Calculating Best-Values requires assigning rating systems to the evaluation criteria. Satisficing (commonly referred to as go/no-go), modified satisficing, adjectival, and direct scoring systems are presented. All evaluation (scoring or rating) systems can be categorized into the following four general types of systems [1]:
1. Satisficing 2. Modified Satisficing. 3. Adjectival Rating 4. Direct Point Score
2.2.4.1 Satisficing The simplest and easiest to understand for both evaluators and proposers, satisficing requires establishing standards for each criterion. Doing so creates a baseline for comparing proposals.
2.2.4.2 Modified Satisficing Modified Satisficing considers the degrees of responsiveness to any given criteria. As a result, the range of possible ratings is expanded to allow an evaluator to rate a given category across a variety of degrees. Thus, a proposal that is less responsive can be rated accordingly and remain in the competition.
2.2.4.3 Adjectival Rating An extension of modified satisficing and adjectival rating systems utilize a specific set of adjectives to describe the conformance of a criterion to the project’s requirements.
2.2.4.4 Direct Point Scoring Under a direct point scoring system, evaluators assign points to each criterion based upon some predetermined scale or the evaluator’s preference. The greatest strength of this system is the scale’s flexibility. It allows more rating levels thus giving precise distinctions of merit.
Once the owner has determined which parameters are most appropriate for a given project, the remaining details of the best-value procurement can be determined.
2.2.5 Best-Value Concept 4 (Award Algorithm) Best-Value award algorithms define the steps owners take to combine the parameters, evaluation criteria, and evaluation rating systems into a final award recommendation.
Seven best-value award algorithms identified in the literature review, case studies, and project procurements documents are considered [1]:
• Meets Technical Criteria—Low-Bid • Adjusted Bid • Adjusted Score • Weighted Criteria • Quantitative Cost—Technical Tradeoff • Qualitative Cost—Technical Tradeoff • Fixed Price—Best Proposal

11
In addition, Best-Value award algorithms were also identified through a comprehensive review of procurement documents for water/wastewater, building, industrial, and highway projects. These algorithms include:
• Meets Technical Criteria—Low-Bid • Adjusted Bid • Adjusted Score • Weighted Criteria • Cost-Technical Tradeoff • Fixed Price—Best Design
12
3. DATA COLLECTION
3.1 Data Sources This chapter discusses and summarizes the effort of analyzing Mn/DOT records and data availability related to the Best-Value topic. Two questionnaires were designed to draw feedback from Mn/DOT engineers, is included in Appendix A and B. Data are collected from four different sources:
1. Best-Value Reports 2. Mn/DOT date records 3. Mn/DOT questionnaire 4. Other Best-Value sources
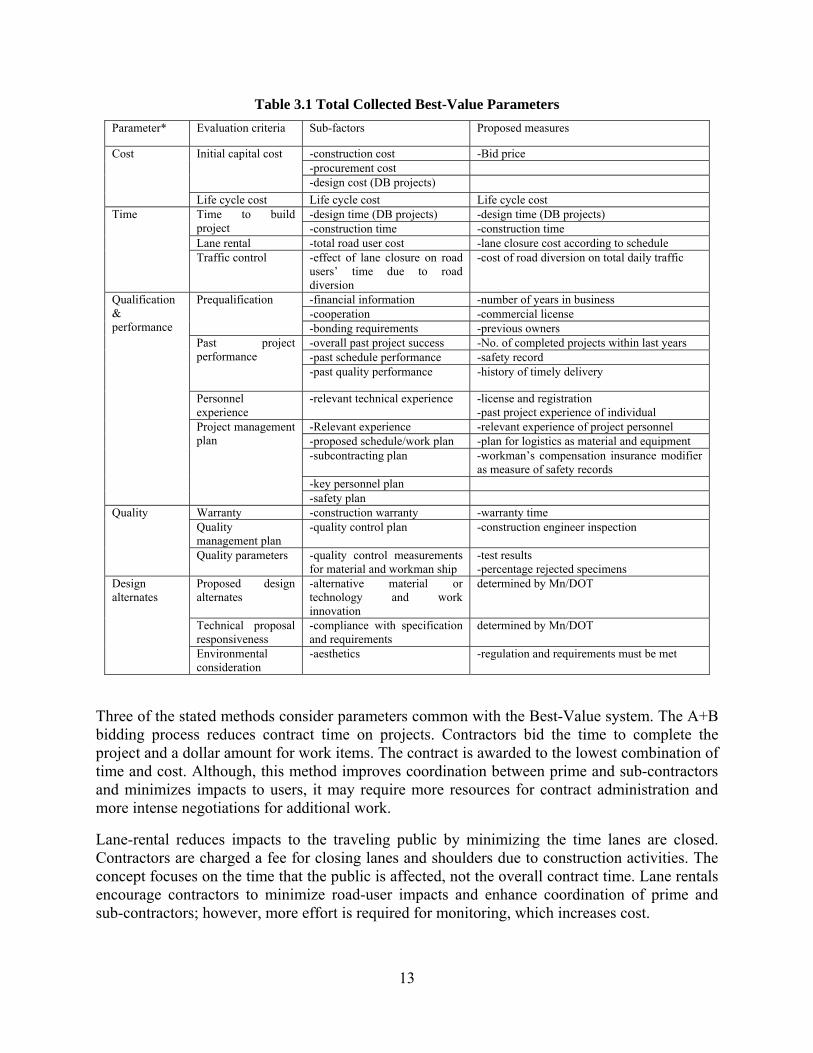
3.2 Best-Value Reports Case studies published in NCHRP reports (10-61 and 10-54) provided Best-Value parameters and evaluation criteria as shown in Table 3.1.
3.3 Mn/DOT Data The data collection phase required answering the following items:
- What data elements exist in Mn/DOT records? - How does Mn/DOT record Data? - How are data records used in contracting applications?
These questions were addressed during task meetings with Mn/DOT engineers, in which it was concluded that a data base exists which can provide a foundation for Best-Value implementation. The research team collected a considerable amount of data that helped in the initial implementation of the proposed model. Through the data collection process and Mn/DOT feedback, the most suitable parameters to be included in the model were established.
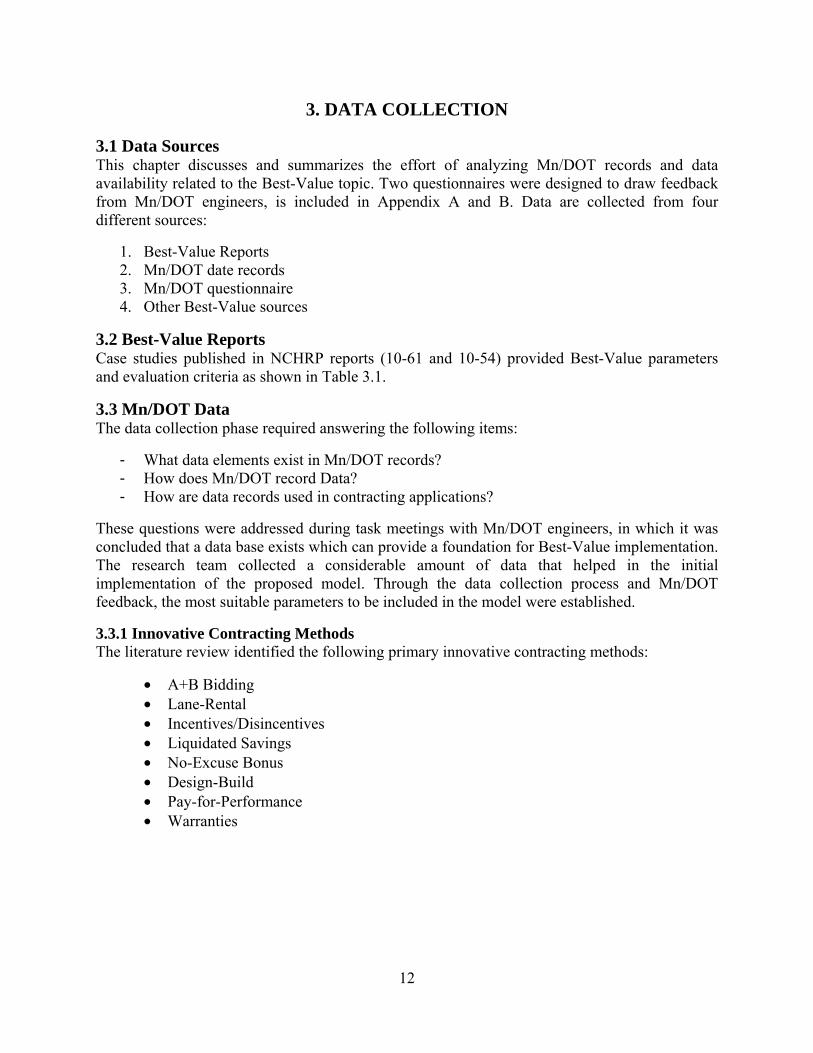
3.3.1 Innovative Contracting Methods The literature review identified the following primary innovative contracting methods:
• A+B Bidding • Lane-Rental • Incentives/Disincentives • Liquidated Savings • No-Excuse Bonus • Design-Build • Pay-for-Performance • Warranties
13
Table 3.1 Total Collected Best-Value Parameters Parameter* Evaluation criteria Sub-factors Proposed measures
-construction cost -Bid price -procurement cost
Initial capital cost
-design cost (DB projects)
Cost Life cycle cost Life cycle cost Life cycle cost
-design time (DB projects) -design time (DB projects) Time to build project -construction time -construction time Lane rental -total road user cost -lane closure cost according to schedule
Time Traffic control -effect of lane closure on road
users’ time due to road diversion
-cost of road diversion on total daily traffic
-financial information -number of years in business -cooperation -commercial license
Prequalification -bonding requirements -previous owners
-overall past project success -No. of completed projects within last years -past schedule performance -safety record
Past project performance
-past quality performance -history of timely delivery
Personnel experience
-relevant technical experience -license and registration -past project experience of individual
-Relevant experience -relevant experience of project personnel -proposed schedule/work plan -plan for logistics as material and equipment -subcontracting plan -workman’s compensation insurance modifier
as measure of safety records -key personnel plan
Qualification & performance
Project management plan -safety plan Warranty -construction warranty -warranty time Quality management plan
-quality control plan -construction engineer inspection Quality
Quality parameters -quality control measurements for material and workman ship
-test results -percentage rejected specimens
Proposed design alternates
-alternative material or technology and work innovation
determined by Mn/DOT
Technical proposal responsiveness
-compliance with specification and requirements
determined by Mn/DOT
Design alternates
Environmental consideration
-aesthetics
-regulation and requirements must be met
Three of the stated methods consider parameters common with the Best-Value system. The A+B bidding process reduces contract time on projects. Contractors bid the time to complete the project and a dollar amount for work items. The contract is awarded to the lowest combination of time and cost. Although, this method improves coordination between prime and sub-contractors and minimizes impacts to users, it may require more resources for contract administration and more intense negotiations for additional work.
Lane-rental reduces impacts to the traveling public by minimizing the time lanes are closed. Contractors are charged a fee for closing lanes and shoulders due to construction activities. The concept focuses on the time that the public is affected, not the overall contract time. Lane rentals encourage contractors to minimize road-user impacts and enhance coordination of prime and sub-contractors; however, more effort is required for monitoring, which increases cost.

14
Warranty requires contractors to guarantee all or portions of a construction project to be free of defects in materials and workmanship for a defined period. The contractor is required to correct deficiencies that occur during the warranty period. The length of the warranty period can vary from project to project, typically 2-3 years for transportation projects. Warranty could have the potential to guaranty high quality and durability of selected work items for a specific time, which alleviates inspection efforts while allowing the state to allocate resources elsewhere. Owners must ensure that warranty guidelines are reasonable and enforceable.
3.3.2 Mn/DOT Questionnaire Finalizing the list of evaluation parameters required the experience of Mn/DOT engineers. A questionnaire was distributed to the resident engineers during a monthly meeting held on April 17, 2006. This questionnaire facilitated feedback on Best-Value as a procurement process where price and other key factors were considered in the selection process to enhance the long-term performance and value of construction. Project officials expressed the following concerns taken from the meeting minutes:
• Will both environmental and safety be considered in one category • How are sub contractors considered when evaluating the performance of the prime
Comment about the benefits of using BV system to include other parameters rather than the lowest bid
• Question about the level of details that is required Comment about the necessity of gathering data in the future in case of conducting the new approach
• Comment about the need to move to the project level to best answer the questionnaire questions
• Clarification of the fact that the new approach will deal with each project as unique, showing the system’s flexibility The need to distribute the questionnaire to more people rather than resident engineers to avoid personal judgment
This questionnaire is shown in Appendix A. There were 14 respondents.
3.3.3 Questionnaire Summary The questionnaire sought the following information on whether Mn/DOT engineers were:
• Above average satisfied with the lowest bid system • Below average satisfied with including factors related to quality in bid awarding
process • Below average satisfied with using incentive/ disincentive to enhance quality • Above average satisfied with the overall contractor performance in the state • Average satisfied with commercial license to be a BV parameter for contractor
qualification • Above average satisfied with qualification in other state to be a BV parameter for
contractor experience • Average satisfied with number of project completed in the last year to be a BV
parameter for project performance • Average satisfied with compliance with EEO as a BV parameter for project quality • Average satisfied with financial ratios as a BV parameter for financial situation • Average satisfied with receiving credit for work by subcontractor as a BV parameter

15
3.3.4 Mn/DOT Engineers Meeting The research team held a meeting with a group of Mn/DOT’s Engineers on the NDSU campus on Jun.30, 2006 to discuss the importance of collecting data from Mn/DOT records. The availability and viability of all potential parameters were discussed and a final set of parameters and corresponding data elements were established.
3.4 Other Best-Value Sources Additional review of Best-Value systems provided a foundation for this research. Issues regarding implementation, legality, rating systems, and award algorithms were investigated from the experiences of other state agencies.
After collecting data from the mentioned sources, an initial list of the most appropriate parameters and corresponding measurements for Mn/DOT is provided in Table 3.2.
Table 3.2 Initially Selected Parameters for Best-Value Model
Contractor Parameter Definition
BP=Bid Price Bid amount for the current project as finally agreed with the owner
CT=Contract Time Contract time for the current project CT = Number of Days Bid * Daily User Cost
WR=Warranty Warranty years guaranteed for the current project as offered by the contractor
UT=Unauthorized Time Average recorded unauthorized delay time for past contractor performance:
)%DurationProject Total
TimeDelay edUnauthoriz(∑=UT or
)%Amount Bid $ Total
Amount Damage Liquidated(∑=UT
CL=Rejected Claims Average recorded rejected claims for past contractor performance )%
BidsMillion $ TotalClaims Rejected ofNumber (∑=CL
PQ=Quality Average recorded quality for past contractor performance %
specimens testedtotalspecimens test Rejected=PQ
LR=Lane Rental Cost Average recorded lane rental cost bid hours rate rental lane ×=∑LR
TC=Traffic Control Average recorded traffic control compliance for past contractor performance
)%BidsMillion $ Total
compliance-nonfor amount $(∑=TC
EM=EEO & DBE adherence
Average adherence to EEO and DBE requirements for past contractor performance

16
4. MODEL DEVELOPMENT
4.1 Model Concepts Best-Value has many competing definitions in the industry. One of the broad definitions of Best-Value suggested is “A procurement process where price and other key factors are considered in the evaluation and selection process to enhance the long-term performance and value of construction” [1]. As discussed earlier, this definition was disaggregated into four primary concepts; parameters, evaluation criteria, rating systems, and award algorithms. Based on the analysis of the literature, meetings, and case studies, it was determined that a Best-Value procurement system is the most effective approach when compared to the traditional bidding system. The flexibility of the model parameters and the simplicity of implementation provides clear advantages. The general equation for Best-Value is shown in (4.1):
∑=
×=n
iiiA WCPSBV
1 (4.1)
Where;
BVA= Best-Value for contractor A
n = number of parameters included in the Best-Value equation
CPSi = Contractor Parameter i Score
Wi= Relative weight of parameter i
The Best-Value Model consists of two primary components:
1. Contractor Parameter Scores 2. Parameter Weights
4.1.1 Contractor Parameter Scores The parameters used to evaluate contractors are scored. Among the parameters are bid price, time, quality, traffic control, etc.
4.1.2 Parameter Weights Parameter weights (summed to 1.0) capture the relative importance of each parameter in the selection process according to the owner’s priorities.
4.1.3 Model Parameters The parameters and evaluation criteria of Best-Value are first determined from the literature, survey, case studies, and meetings. A preliminary list of evaluation criteria, as shown in Table 3.1, is prepared and the proposed measurements of each evaluation criteria are suggested. Past DOT experience suggests the number of evaluation criteria be minimized and easily extracted from project records. The research team discussed the viability of each parameter included in the initial list (shown in Table 3.2). Discussions yielded a revised list of the parameters and suggested measurement factors. The foundation of this research recognizes that simplifying evaluation criteria (in quantity and measurement) will also simplify implementation.

17
Implementation planning should also recognize the lack of familiarity of the system’s participants and introduce the new concept slowly.
Other suggested contractor parameters such as Safety Records (SR) and Compliance with Environmental permits (EN) may be added to the model at a later time during the model implementation process. Parameter equations will be defined in the section on developing software. The flexibility to include or exclude parameters provides a system that is sensitive to project needs.
4.1.3.1 Factor Importance Bid Price (BP) is the most important selection parameter in the traditional procurement system. In public agencies, Lowest Bid selection is enforced by law even if it is not a need. Contract time (CT) is used as a competitive parameter for fast track projects. This parameter represents the “B” component of the A+B bidding process and is the product of contract time and road-user-cost. Warranty (WR), the number of years guaranteed by the contractor, addresses the amount of risk the contractor assumes. Lane Rental (LR) reflects the impact of construction activities on the user in terms of time and cost. Lane rental (LR) is equal to the percentage of lane closure cost divided by the total bid price. The Past Quality (PQ) parameter considers the quality of the final product evaluated with the percentage of rejected test specimens. The Employees (EM) parameter is evaluated through the degree of compliance to EEO and DBE requirements, while Claims (CL) shows the contractor cooperation with the owner. This parameter is measured by the percentage of rejected claims divided by the total bid price. Table 3.2 depicts the final selected parameters and the definition formulas used to obtain them.
4.2 Model Evaluation The model was tested with two pilot projects. Both projects differ in traffic volume, location, scope, preferences, and work type.
4.2.1 TH-113 Project The primary purpose of this project was to reclaim TH 113 from the Jct. of TH 32 to the Norman/Mahnomen County line providing an increase of 12 to 15 years of life. District 4 out of Detroit Lakes added a 1.5” overlay from Norman/Mahnomen County line to Waupun. The project also included extending centerline RCP culverts to improve safety. This project was detoured with 35 working days assigned for contract completion. This contract was let in January 2006 with an engineering estimate of $2,084,814.87 and a bid price of $2,155,015.29.
4.2.2 TH-494 Project This project located on TH 494 from 0.70 mile south of CSAH 16 to 0.43 miles north of CSAH 16. The project included grading, concrete and bituminous surfacing, and signal installation. This project was detoured with 145 working days assigned for contract completion. This contract was let in April 2006 with an engineering estimate of $9,058,490.84 and a bid price of $ 9,932,277.34.
4.2.3 Model Implementation Methodology For both pilot projects, calculations are made for the lowest three bidders
1. Calculations of Contractor Parameters Scores 2. Calculations of Parameters Relative Weights 3. Calculations of Best-Value Model

18
4.2.3.1 Calculations of Contractor Parameter Score (CPSi) The parameters of each project are first calculated for the three lowest bids. Row Values of the parameters included in the model for chosen pilot projects is shown in Table 4.1. Next, these values are normalized on a scale of 0 to 100 using the following steps: (consider quality parameter for TH-113)
1. For Contractor A, calculate the row value of the quality parameter using the following equation
%SpecimensTest total
Specimens test Rejected=PQ (4.2)
Which yield PQA= 15%
Using the same equation; PQ will be 12% and 0% for Contractor B and Contractor C respectively.
2. Determine the best and the worst values for each parameter from among the available contractor values.
For this case the best is PQA= 0% and the worst is PQC= 15%
3. Assign a Contractor Parameter Score (CPS) ranging from 0 to 100 for each contractor parameter value using the following equation
%parameter contractor of Value
parameterbest theof Value=CPS (4.3)
This score is determined relative to established reference scores. Reference scores are established from what is considered perfect (100%) and failing (0%), see question #2 in the Mn/DOT questionnaire in Figure 4.2.
4. Assuming that 1% and 15% represent 100% and 0% satisfaction of quality parameter respectively, the calculated CPS will be 6.67, 8.33, and 100 for Contractor A, B, and C respectively
5. In the case that the best parameter value equal zero, replace that value with a small value to avoid violating the domain.
Note: A linear relationship between the row parameter and parameter score is assumed as shown in Figure 4.1. A larger population is needed for actual representation of such relation.

19
Quality
0.00
20.00
40.00
60.00
80.00
100.00
120.00
0.00 5.00 10.00 15.00 20.00
Row
Scal
e
Figure 4.1 Relation between Rough Values of Parameter and Parameter Score
Figure 4.2 Part-2 of Mn/DOT Questionnaire
100% Satisfaction
2. For your project, Use the provided sketch to assign the appropriate values of both maximum satisfaction, minimum accepted values and bonus rates for the following Contractor Parameters
Contractor Parameter A B Bonus Rate = % CPS added /1 contractor parameter point exceeds 100% satisfaction
BP=Bid Price CT=Contract Time WR=Warranty UT=Unauthorized Time RC=Rejected Claims PQ=Quality LR=Lane Rental Cost TC=Traffic Control EM=EEO&DBE Adherence
Contractor Parameter Score
Calculated Contractor
100 A B 0
0% Satisfaction

20
Table 4.1 Row Values of Model Parameters for Both Pilot Projects TH-494 TH-113 Parameter Units Bidder A
Bidder B
Bidder C
Bidder A
Bidder B
Bidder C
BP=Bid Price (Millions) 9.9 10.12 10.19 2.15 2.26 2.36 CT=Contract Time (Millions) 1 0.9 1.35 N/A N/A N/A WR=Warranty (Years) N/A N/A N/A N/A N/A N/A UT=Unauthorized Time % 0.01 0.02 0 6 7 0 RC=Rejected Claims % 20 26 15 0 25 40 PQ=Quality % 2 3 1 15 12 0 LR=Lane Rental Cost % 2.9 2.5 3.6 N/A N/A N/A TC=Traffic Control % 0.05 0.08 0.04 0.1 .05 0 EM=Employees % 3 3 5 4 2 3
4.2.4 Calculations of Model Weight (Wi) This step is required to obtain the relevant weights for each parameter included in the Best-Value model. Weights are assigned to parameters through one of the following cases:
A. One or all parameters are fixed at a specific weight depending on the owner experience and/or needs.
B. One or more parameters are fixed at a specific weight while the other included parameters share the remaining weight.
C. All the parameters are obtained from a questionnaire whereby engineers are asked to evaluate the importance of each parameter. Rating is considered only for the parameters that are applicable for the project under consideration. Rating is converted to a relative weight
The following steps summarize the method used to establish parameter weights using the questionnaire rating results.
1. Questionnaires, as presented in Figure 4.3, were completed by assigning a rating (1 to 5) for each parameter. Where
1= Maximum Significance 2= High Significance 3= Low Significance 4= Minimum Significance 5= Not significant at all
2. Weights are inverted and projected to a scale of 100 to 0 using the following equation:
)%1-5
1-Rate-(1ScaleWeight = (4.4)
Ratings of 2, 3, and 4 yield weights equal to 75, 50, and 25 respectively. 3. Assign weight scales to BV parameters that are applicable for the current project 4. Calculate the summation of weights for BV parameter included 5. Divide the weight of each parameter by the summation for all parameters to get
parameter relative weight (Wi) ranging from 0 to 1 (summation must equal 1).

21
Figure 4.3 Part-1 of Mn/DOT Questionnaire Evaluation Parameters Importance Questionnaire
Calculations of relative weight are shown in Table 4.2. Relative weights for both projects are shown in Table 4.3.
4.2.5 Calculations of Best-Value Model The Best-Value for each contractor is calculated using the equation (4.1) described earlier as
∑=
×=n
iiij WCPSBV
1
Calculations differed on how relative weights were assigned to each parameter in the model. The following 2 cases are possible:
CASE 1: Weights assigned via questionnaire
Determine the importance of the following factors in the selection of the most suitable contractor for your project:
(Assign 1= maximum importance, 2= high importance, 3= low importance, 4= minimum importance, 5= not important at all)
1. Winning bid to be the lowest bid: ○1 ○2 ○3 ○4 ○5
2. Completing the project as soon as possible: ○1 ○2 ○3 ○4 ○5
3. Increasing the warranty years of the project: ○1 ○2 ○3 ○4 ○5
4. Final product to be of high quality: ○1 ○2 ○3 ○4 ○5
5. Contractor adherence to EEO and DBE requirements : ○1 ○2 ○3 ○4 ○5
6. Reducing number of claims: ○1 ○2 ○3 ○4 ○5
7. Reducing the project impact on public: ○1 ○2 ○3 ○4 ○5
8. Reducing the lane closure and road diversion times: ○1 ○2 ○3 ○4 ○5
9. Adherence to safety and environmental considerations: ○1 ○2 ○3 ○4 ○5
10. Increasing the number of competing contractors:

22
Table 4.2 Relative Weight Calculations for Project TH-113
Parameter Rating Rating Scale Relative Weight BP=Bid Price 3 50 0.125 CT=Contract Time 1 - - WR=Warranty 4 - - UT=Unauthorized Time 1 100 0.250 RC=Rejected Claims 3 50 0.125 PQ=Quality 1 100 0.250 LR=Lane Rental Cost 2 - - TC=Traffic Control 2 75 0.188 EM=EEO&DBE Adherence 4 25 0.063 400 1
Table 4.3 Relative Weights for Projects TH-113 and TH-494
parameter TH-113 TH-494
BP=Bid Price 0.125 0.174 CT=Contract Time - 0.174 WR=Warranty - - UT=Unauthorized Time 0.250 0.174 RC=Rejected Claims 0.125 0.087 PQ=Quality 0.250 0.130 LR=Lane Rental Cost - 0.130 TC=Traffic Control 0.188 0.087 EM=EEO&DBE Adherence 0.063 0.043
CASE 2: Bid price receives a fixed weight of 80%, while remaining 20% is distributed among the other parameters according to ratings from the questionnaire.
A sample calculation for Contractor A (Project TH-113) is shown in Table 4.4.
Table 4.4 Best-Value Calculations for Project TH-113
parameter Weight parameter Score best-Value
BP=Bid Price 0.125 100 12.5 CT=Contract Time - - - WR=Warranty - - - UT=Unauthorized Time 0.250 1.667 0.417 RC=Rejected Claims 0.125 100 12.5 PQ=Quality 0.250 6.667 1.667 LR=Lane Rental Cost - - - TC=Traffic Control 0.187 10 1.88 EM=EEO&DBE Adherence 0.063 50 3.15 1.000 32.98

23
The results from model implementation on both pilot projects for CASE1 and CASE2 are summarized in Table 4.5.
Table 4.5 Best-Value for Projects TH-113 and TH-494 within the Two Cases
CASE1 Contractor A Contractor B Contractor C TH-113 32.9833 25.1277 84.8757 TH-494 77.4569 69.9061 87.8773 CASE2 Contractor A Contractor B Contractor C TH-113 84.4762 79.064 89.5552 TH-494 94.5118 91.0544 94.9338
4.2.6 Analysis of Results In the case of Project TH-494, district engineers assigned weights to Bid Price, Contract Time, Unauthorized Time, Rejected Claims, Quality, Employees, and Traffic Control. Warranty was not applicable for this project. Results show Contractor C received the maximum value (100) for four parameters, Contractor B received the maximum value for three parameters, and contractor A received the maximum value for two parameters. In traditional low bid systems, Contractor A would have been awarded the contract; however, the Best-Value analysis produced Contractor C as the best option (Total Score =87).
Project TH-113 considered six parameters out of the nine studied. Contract Time (CT), Warranty (WR), and Lane Rental Cost (LR) were not considered applicable for this project. Bid Price was given a weight equal 0.13 while both Unauthorized Time (UT) and Quality (PQ) were given a weight of 0.25. The Employee parameter (EM) was assigned a weight of 0.06. Contractor C received the maximum value (100) for the three highest weighted parameters. As a result, Contractor C is awarded the contract with a maximum score of 84. A Low Bid system would have awarded Contractor A the job.
The main advantage of Best-Value procurement is realized in these two projects. In both cases, the contractor with the lowest bid was not the appropriate option considering the projects’ priorities. Moreover, the owner, if legislatively approved, could select a contractor with higher bid that has an advantage to construct the project. A trade-off analysis is shown in Table 4.6.

24
Table 4.6 Trade-off Analyses for Projects TH-113 and TH-494 within the Two Cases
Case 1 Project TH-113 Project TH-494 Project TH-113 Lowest Bid Contractor A
Chosen Contractor C
% difference
Lowest Bid Contractor A
Chosen Contractor C
% difference
Price parameter 13.000 11.843 -8.898 17.000 16.516 -2.846 Other parameter (Technical)
19.983 73.033 265.467 60.457 71.361 18.036
Best-Value 32.983 25.128 -23.817 77.457 87.877 13.453 Case 2
Project TH-113 Project TH-494 Project TH-113 Lowest Bid Contractor A
Chosen Contractor C
% difference
Lowest Bid Contractor A
Chosen Contractor C
% difference
Price parameter 80.000 72.881 -8.898 80.000 77.723 -2.846 Other parameter (Technical)
4.476 16.674 272.520 14.512 17.211 18.598
Best-Value 84.476 89.555 6.012 94.512 94.934 0.446

25
5. SOFTWARE DEVELOPMENT
5.1 Introduction This chapter focuses on developing a research tool for Mn/DOT personnel to test and experience different alternatives and criteria in selecting the best contractor for a specific project. The software deals with the fact that some of the adopted parameters encompass a quantitative nature; however, others encompass a qualitative nature. To acquire the weights of these qualitative parameters, the analytical Hierarchy Process AHP is used. The software is able to facilitate the process of evaluating bids from DOT’s perspectives. The software is flexible enough to change inputs and parameters and modify their weights based on the user’s preferences. The software interacts with the current Mn/DOT contracting system.
5.2 Best-Value Equation The general equation for Best-Value is shown in the following equation:
∑=
×=n
iiij WCPSBV
1 (5.8)
Where; BVA= Best-Value for contractor j, n = number of parameters included in the Best-Value equation, CPSi = Contractor Parameter i Score, Wi= Relative weight of parameter i
5.2.1 Best-Value Parameters’ Equations
5.2.1.1 Contract Time: CT = $(Number of Days Bid * Daily User Cost) (5.1)
5.2.1.2 Unauthorized Time: ∑= %
durationproject Totaldelay time edUnauthorizUT (5.2)
Or ∑= %
amount bid Totalamount damage LiquidatedUT (5.3)
5.2.1.3 Rejected Claims: ∑= %
bids$million TotalClaims rejected ofNumber CL (5.4)
5.2.1.4 Quality: %
SpecimensTest totalSpecimens test Rejected=PQ (5.5)
5.2.1.5 Lane Rental Cost: %
Bidsion Total$Millbid Hours Rental Lane∑ ×=LR (5.6)

26
5.2.1.6 Traffic Control: %
bids$Million Totalncenoncompliafor Amount ∑=TC (5.7)
5.2.2 Calculating Parameter Scale Two methods are available in the calculation of the Parameter score: (1) comparing the contractor to other contractors in the same project, (2) comparing each contractor with a population of similar projects. Each option requires the upper and the lower reference limits for each parameter. Figure 5.1 shows how parameters are scaled. As an example, consider Bid Price. Here, bids less than $3.6 million are given a scaled score of 100 (or > 100 if the bonus option is selected). Likewise, bids greater than $4 million are given a scaled score of 0. Bids falling in between these two reference points will receive a proportional scaled score.
Figure 5.1 Calculating Parameter Scale for Corresponding Parameter’s Value
The comparison options menu can be used to set these reference points. Simply select the parameter you wish to set the limit for, select the 0 option button within select scale reference point, update the user-defined limit text box with the desired value, or update the calculated limit with a selected value from drop down list.
5.2.2.1 Comparing Contractor with other Contractors Bidding on this Project This option uses only the data from the bidding contractors to find the reference points. Following the same example of bid price, the “100 Reference Point” is taken as the minimum bid among contractors. The maximum bid is automatically given a scaled score of 50. The “0 Reference Point” is then extrapolated using the 50 & 100 reference points.
5.2.2.2 Comparing Each Contractor with the Population This option uses all loaded data to calculate the user-defined percentile for each parameter. The default is the 90th percentile for the “100 Reference Point” and the 10th percentile for the “0 Reference Point”. This option only applies to random parameters (i.e. all parameters in the input files). Consider IRI, for example. If this option is selected and the 90th percentile is chosen as the “100 Reference Point”, the software will find the point (% Rejected) at which only 10% were

27
better. To calculate this value, all projects matching the given work type and location from all contractors loaded into the software are used.
Individual parameter reference points can be changed by double clicking the parameter and clicking the update button with the appropriate value.
5.2.3 Calculating Parameters Weight A parameter weight (Wi) represents the decision maker’s opinion about the importance of the parameter in distinguishing among contractors. In other words, the parameter scheme represents the decision maker’s priorities for a specific project. The total summation of weights should be equal to 100.
5.3 The MNCAST Software The MNCAST software consists of three parts: the input (input menus), the engine, and the output (output menus). The input includes but is not limited to; project name, type, location, years to be considered from past contractor history, contractor data, parameter’s score, and weight. The output includes contractor scores and Best-Value details. The engine is used to calculate the Best-Value. Figure 5.2 contains the procedure through which Best-Value is calculated.
5.3.1 Best-Value Example XDOT announced a new PCC pavement project in district 1. According to the project importance, XDOT chooses Bid Price, Lane Rental, and Quality as the selection criteria. Based on XDOT experience, they assign 60%, 30%, and 10% of parameter weights to Bid Price, Lane rental, and Quality respectively. Four contractors submit their proposal to build the project. CONTRACTOR A, CONTRACTOR B, CONTRACTOR C, and CONTRACTOR D submit offers of $42 Million, $43.7 Million, $44.1 Million, and $45 Million respectively. Total Lane rental costs offered by contractors for this project are $20,000, $22,000, $21,000, and $20,000 for contractor A, B, C, and D respectively. Based on the available records for the four contractors, an owner wishes to assign the project to contractor offering the Best-Value for the money spent on this project.

28
Figure 5.2 Procedures Used in Best-Value Calculation
Add the New Contractor
Add New Parameter
Start MNCAST Software
Open File Manager
Contractor Score is calculated
Enter Values for Non-Performance Based Parameter (i.e. Bid Price)
Enter Project Information (Name, Type, Location,..)
Load Contractor Data to the Engine
Assign Weights for selection Criteria
Best-Value Calculated Output Sheet
All Contractor Files Loaded in the System
All Selection Criteria Appears within Parameter List
No
Yes
Yes
No

29
5.3.2 Example Solution 1. To start a new project, click File > New.
Click Input > Project Information.
In “Project Information” window (Figure 5.3), enter project name, date.
Select project type as PCC pavement
Select project location as all districts
Click OK
Click Tools > Settings to
Set the codes for project types and location if needed.
Set the parameter direction (Figure 5.4)
Choose which quality sub parameters are considered in the project (Figure 5.5)
Check outputs (Figure 5.6)
Click Tools > Comparison Options to select a method to compare contractors and parameter reference limit (Figure 5.7)
Figure 5.3 Entering Project Information

30
Figure 5.4 Setting the Direction for Project Parameter
Figure 5.5 Selecting Quality Tests used in the Current Project

31
Figure 5.6 Selecting form Output Options
Figure 5.7 Setting the Comparison Option for the Project

32
2. To enter contractor information:
Input > Contractor Information
Select CONTRACTOR A from left hand list as shown in Figure 5.8
Enter Bid amount of 42 in “Bid” text box.
Click >>
Repeat the same process for CONTRACTOR B, C, and D using their bid prices.
Click OK
Figure 5.8 Selecting Bidding Contractors and Entering Corresponding Offers
3. To enter Parameters information:
Input > Parameter Information
Select Bid from left hand list as shown in Figure 5.9
Enter 60 in “Weight” text box
Click >>
Enter 30 and 10 for Lane rental and Quality parameters respectively.
Click OK

33
Figure 5.9 Selecting Project Parameters
4. To display Best-Value results:
Output > Best-Value
Select Summary of Results from left hand side list as shown in Figure 5.10.
Click on the Best-Value column head to rank contractors in order of their Best-Value.
Results show that CONTRATOR A offers the Best-Value (BV = 99.55) for money spent on project.

34
Figure 5.10 Display of Results
To display the details of the calculation results for CONTRACTOR A, select “Details of Results” tab.
To display record data for CONTRACTOR A, select “Input Data.

35
6. MODEL VALIDATION
6.1 Introduction The main objective of this Chapter is to validate the developed Best-Value system. This is fulfilled through demonstrating the model flexibility by adapting to the project specific conditions and to the agency-specific evaluation criteria. The validation process will test whether the developed model including the software helps the decision maker through ranking the submitted bids in the selection process. Also, the validation should develop recommendations to improve current specifications and bid offerings based on the analysis of available record.
Part 1 of this chapter demonstrates the model flexibility by introducing a new concept of Best-Value, that is, a rational and flexible model based on expected performance. The model flexibility is obvious in the selection of parameters, to be included in the contractor selection process, and in the determination of the parameter’s weights. The model rationality will be achieved through relating all awarded scores to the agency’s expected performance. The establishment of the Best-Value model calls the past record of the contractor’s work for the agency as an indicator of qualification trend. This research incorporates pre-qualification as a first level screening technique in selecting top contractor bids in the Best-Value procurement and then applies a rational scoring system in the final selection. Contractor Best-Value will be the basis for selecting the most appropriate contractor that has the best qualifications for a given project. Sections from the earlier chapters are repeated in this chapter to illustrate the details of the model validation process. Part 2 of this chapter demonstrates the ability of “MNCAST” to demonstrate the effects of changing different parameters on the developed model, which helps understanding the use of model parameters, settings and inputs.
6.2 Best-Value Based on Expected Performance State and Federal Sectors, have moved aggressively towards the use of Best-Value procurement, have attempted to measure its relative success, and are convinced that it achieves better results than low-bid due to the following reasons: (i) the low-bid method fails to serve the public interest because the lowest offer may not result in the lowest overall cost to the public, (ii) the Best-Value procurement provides a reduction in cost growth from 5.7% to 2.5% and a reduction in claims and litigation by 86%, (iii) a 1997 National Science Foundation study concluded that design-build contracts procured using the two-step Best-Value procurement procedure had the best cost and schedule growth performance, albeit representing a very small average improvement over the other procurement methods and (iv) the Best-Value procurement was emerging as a viable alternative to traditional low-bid method in the public sector construction [1, 2, 3 and 4].
A key concept in Best-Value procurements is the focus on selecting the contractor with the offer ‘‘most advantageous to the government where price and other factors are considered.’’ The factors other than price can vary, but they typically include technical and managerial merits, financial health, and past performance [5, 6, 7, and 8]. Another key element in the success of innovative contracting techniques, including Best-Value, is the communication between owners and contractors in two main areas: (i) the rationality in ranking the contractor qualification and (ii) defining the owner expectations. Owners must think carefully of what is ‘‘valuable’’ in the product and not just ‘‘important’’ or ‘‘required’’ in the selection process. Using technical, managerial, or performance elements that are of indeterminate value, while important or

36
required, simply clouds the decision. Owners should only base the Best-Value selection criteria on project elements that add measurable value to the project [9]. It is also important that owners set standards for the procurement process. Owners must carefully define what is expected and communicate that with contractors. An earlier research [10] shows agencies pre-qualify contractors using subjective values that may not follow a rational approach. A group of evaluators rate the contractor expected performance on several key areas such as staff, experience, project approach, schedule, and innovation. Using subjective equations or rules introduces a different form of bias to the procurement process. Research indicates that most agencies do not define the expected level of contractor performance in low-bid procurement systems. The contractor is only required to secure the necessary bonds before submitting a bid. The pre-qualification process is different because the contractor past performance has nothing to do with getting the next job, unless debarred. Even if a contractor fails miserably on an area, such as quality on one project, the contractor is able to bid the next project [11].
The number of agencies adopting innovation procurement techniques, such as A+B and Design-Build contracts, is increasing. In such cases, contractors submit both technical and price proposals. The technical proposal is based on announced expected levels of contractor performance such as project time or lane-rental requirements [11]. Currently, many innovative procurement practices include an evaluation process that is conducted based on subjective criteria. In low-bid procurement system, as in subjective criteria procurement systems, owners may introduce inappropriate biases into the selection process or add cost to the procurement. It is necessary for an agency implementing Best-Value to adopt a rational ranking system for contractor qualifications that is based on the agency’s expected level of performance. The NCHRP 10-61 research study recommends a few basic strategies to implement in the area of Best-Value procurement from legislative guidelines and model specifications to the industry collaboration and pilot projects. A research shortage is noticed in relating project characteristics including evaluation criteria and parameter scores, which should be a base in the contractor selection process. There is a need for a rational system to represent the contractor performance in each of the selected Best-Value parameters. A rational scoring system requires the definition of the contractor’s expected performance.
6.3 Part-1 of Sensitivity Analysis The main objective of this part of the study is to establish a rational and flexible scoring model to be used in the Best-Value system. The model will be capable of being tailored to the specific project need. This flexibility will be obvious in the selection of parameters, to be included in the contractor selection process, and in the determination of their weights. The model rationality will be achieved through relating all awarded scores to the agency’s expected performance. The establishment of the Best-Value model uses the past record of the contractors work for the agency as an indicator of their qualification trend. This research incorporates pre-qualification as a first level screening technique in selecting top contractor bids in the Best-Value procurement and then applies a rational scoring system in the final selection. Pilot projects, with three lowest bidders for each project, are used to show the resultant of model application and to clarify the impact of Best-Value system in the contractor selection process. There will be an evaluation for the model significance as a selection tool against the lowest bid system.

37
6.3.1 The Best-Value Model The parameters and evaluation criteria of Best-Value are first determined from the literature, survey, case studies, and meetings [12]. Based on previous application of Best-Value model within DOTs, it is suggested that evaluation criteria should be less in number and easy to obtain from project records. The research team discussed the possibility and validity of each evaluation criteria, included in the initial list, to be considered in the conceptual model. This process ends with a list of the evaluation criteria and suggested measurement factors. Table 3.1 shows the final list of the evaluation criteria and their suggested measurements. Two facts are kept in mind: the less evaluation criteria a Best-Value model has, the easier it is to deal with, and the probable lack of familiarity of DOT officials and contractors with Best-Value environment requires the need to get involved in the new concept slowly. A preliminary long list of evaluation criteria is prepared and the proposed measurements of each evaluation criteria are suggested. Based on previous application of Best-Value model within DOT’s, it is suggested that evaluation criteria should be less in number and easy to obtain from project records. The research team discussed the possibility and validity of each evaluation criterion, included in the initial list, to be considered in a conceptual model. This process results in a second list of the evaluation criteria and suggested measurement factors as shown in Table 6.1.
The first parameter selected to be included in the model is bid price (BP). This parameter was the most important parameter in selecting contractors using the traditional procurement system. For public agencies, lowest bid selection is enforced by law even if there is no need. Contract time (CT) is used as a competitive parameter in contracts that require a fast track. This parameter represents the “B” part in the A+B bidding process which yield from contract time multiplied by road-user-cost. The next parameter is Lane Rental (LR) which reflects the impact of construction activities on the road users’ time and money. Lane Rental (LR) is equal to the percentage of lane closure cost divided by the total bid amount. Past quality (PQ) parameter shows the quality of final product where it is evaluated by the percentage of rejected test specimens divided by the total test specimens.
Table 6.1 also shows examples of the expected performance (EP) of each parameter based on actual records. The EP can be defined in terms of engineering/design estimate or based upon recoded data for similar projects. The EP is used as the baseline for comparing contractor’s performance in the Best-Value parameters. If no records are available, expected performance is estimated as the best submitted parameter values. In addition, the upper and lower limits (URL and LRL) of each parameter’s Best-Values are shown in Table 6.1. The details of the Best-Value parameters are listed in equations 4 to 9 and are discussed later in the paper.
The general equation for the Best-Value is shown in Equation (6.1) as follows:
∑=
×=n
iiij WCPSBV
1 (6.1)
Where; BVj= Best-Value for contractor j, n = number of parameters included in the Best-Value equation, CPSi = Contractor Parameter i Score, Wi= Relative weight of parameter i

38
Table 6.1 Parameters of Best-Value and Their URL and LRL
Upper and Lower Limits** Evaluation Parameters Definitions Examples Expected
Performance (EP)* URL LRL BP = Bid Price Bid amount as finally
agreed upon with the owner
$9.9 Millions Expected price or lowest bid
Highest bid
CT = Contract Time
Cost of contract time for current project $0.9 Millions
Expected or lowest contract time * Daily User Cost
Highest contract time * Daily User Cost
UT = Unauthorized Time
Average unauthorized delay time that is recorded for past contractor performance
0.0 %
Lowest percent delay in records
Highest percent delay in records
CL = Rejected Claims
Average rejected claims that is recorded for past contractor performance
15 % Lowest percent rejected claims
Highest percent rejected claims
PQ = Quality Average quality that is recorded for past contractor performance
1 % Lowest percent rejected testing
Highest percent rejected testing
LR = Lane Rental Cost
Average recorded lane rental cost 2.5 % Lowest percent lane
rental Highest percent lane rental
TC = Traffic Control
Average recorded traffic control compliance for past contractor performance
0.04 %
Lowest percent non-compliance of traffic control
Highest percent non-compliance of traffic control
* EP is estimated as the best submitted values of parameters of contractors’ bids ** These limits are set after the first screening or pre-qualification of contractors.
6.3.2 Parameters Weight (Wi) The first step is to obtain the relative weights (Wi) for each included parameter in the Best-Value model. The total summation of the parameters’ weight should equal 1. These weights are determined based on the opinion of DOT experts. Because most of the aforementioned parameters are subjective in nature, the Analytic Hierarchy Process (AHP) technique is used to quantify the weight of these parameters. The AHP, which is an easy, mature technique that attempts to simulate human decision process [13], allows decision-makers to incorporate both qualitative and quantitative considerations of human thought and intuition. Using expert inputs in Best-Value modeling allows better consideration of the project specific conditions and fulfills the agency requirements. Subjective inputs are just the starting point in Best-Value modeling and will be improved later on in the future implementation of the model. Several steps are required to model a problem using AHP method as follows [13, 14]:
1. A set of factors that contribute to problem solving should be identified. Then, these identified factors will be categorized within a hierarchy of various levels. In the Best-Value problem, the factors are listed in Table 6.1.
2. Thus, the relative weights of these factors are obtained using pair-wise comparison matrices. These matrices are collected from District Engineers in which they grasp the engineers’ opinion regarding the abovementioned factors (Table 6.1). Using mathematical processes (Eigen value and vector), factors’ weights can be determined. Each factor weight represents the relative importance of this factor among the others.

39
In order to consider the resulted weights from a pair-wise comparison matrix, the logical consistency of weights has to be verified based on the matrix consistency ratio (C.R.). If the C.R. is more than 10%, then the results are inconsistent. Hence, the assigned priority values should be modified until the C.R. value is verified. The C.R. value can be determined using equations 2 and 3 as follows [13, 14 and 15]:
1max
−−
=m
mCI λ (6.2)
RICIRC =.. (6.3)
Where:
CI = the matrix consistency index.
m = matrix size.
λ max = the maximum Eigen value.
RI = random index (it has a value related to the matrix size [14])
C.R. = Consistency Ratio.
6.3.3 Best-Value Parameters The parameters used in the developed Best-Value system are defined as follows:
Contract Time: CT = $(Number of Days Bid * Daily User Cost) (6.4)
Unauthorized Time: ∑= %durationproject Totaldelay time edUnauthorizUT (6.5)
Or ∑= %amountbidTotal
amount damage LiquidatedUT (6.6)
Quality: %SpecimensTest total
Specimens test Rejected=PQ (6.7)
Lane Rental Cost: %Bidsion Total$Mill
bid Hours Rental Lane∑ ×=LR (6.8)
Traffic Control: %bids$Million Total
ncenoncompliafor Amount ∑=TC (6.9)
6.3.4 Best-Value Determination After determining the value of parameters weight (Wi) and score (Si), both values are multiplied in order to determine the Best-Value for each parameter. Then equation (1.1) will be implemented where the Best-Values of parameters are added to constitute the final score, Best-Value, for each contractor. Contractors will be sorted based on the Best-Value in which the contractor of highest Best-Value score is the winner.
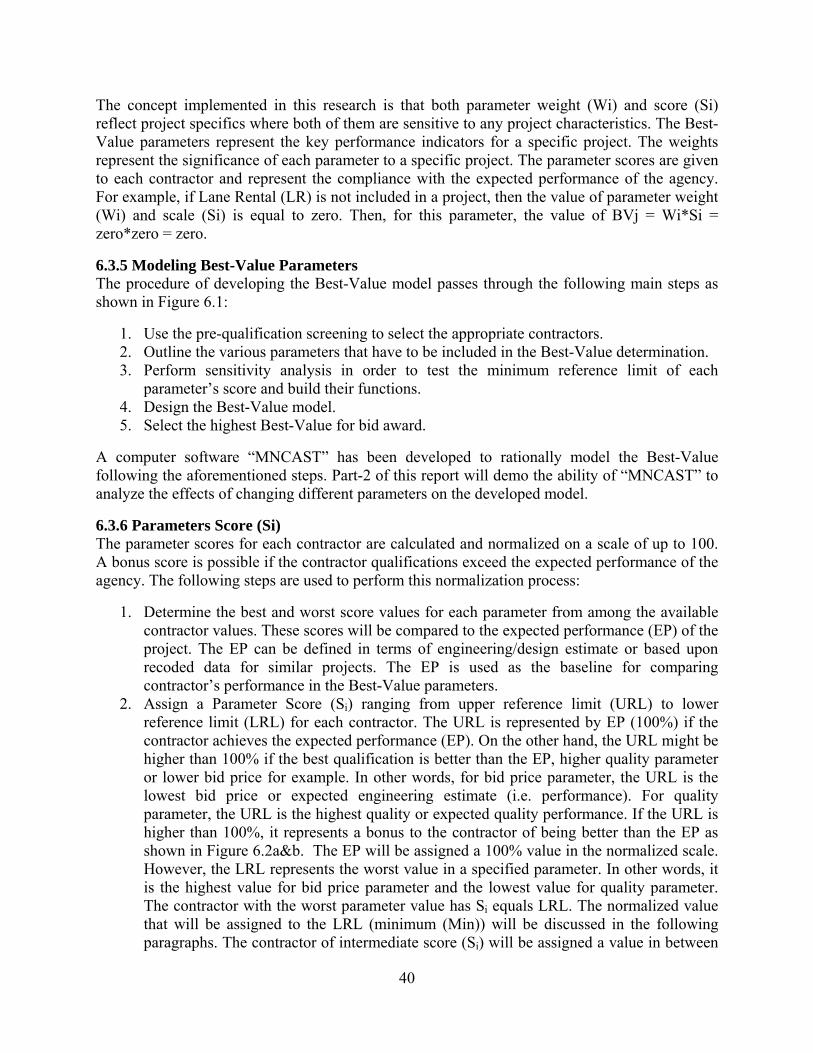
40
The concept implemented in this research is that both parameter weight (Wi) and score (Si) reflect project specifics where both of them are sensitive to any project characteristics. The Best-Value parameters represent the key performance indicators for a specific project. The weights represent the significance of each parameter to a specific project. The parameter scores are given to each contractor and represent the compliance with the expected performance of the agency. For example, if Lane Rental (LR) is not included in a project, then the value of parameter weight (Wi) and scale (Si) is equal to zero. Then, for this parameter, the value of BVj = Wi*Si = zero*zero = zero.
6.3.5 Modeling Best-Value Parameters The procedure of developing the Best-Value model passes through the following main steps as shown in Figure 6.1:
1. Use the pre-qualification screening to select the appropriate contractors. 2. Outline the various parameters that have to be included in the Best-Value determination. 3. Perform sensitivity analysis in order to test the minimum reference limit of each
parameter’s score and build their functions. 4. Design the Best-Value model. 5. Select the highest Best-Value for bid award.
A computer software “MNCAST” has been developed to rationally model the Best-Value following the aforementioned steps. Part-2 of this report will demo the ability of “MNCAST” to analyze the effects of changing different parameters on the developed model.
6.3.6 Parameters Score (Si) The parameter scores for each contractor are calculated and normalized on a scale of up to 100. A bonus score is possible if the contractor qualifications exceed the expected performance of the agency. The following steps are used to perform this normalization process:
1. Determine the best and worst score values for each parameter from among the available contractor values. These scores will be compared to the expected performance (EP) of the project. The EP can be defined in terms of engineering/design estimate or based upon recoded data for similar projects. The EP is used as the baseline for comparing contractor’s performance in the Best-Value parameters.
2. Assign a Parameter Score (Si) ranging from upper reference limit (URL) to lower reference limit (LRL) for each contractor. The URL is represented by EP (100%) if the contractor achieves the expected performance (EP). On the other hand, the URL might be higher than 100% if the best qualification is better than the EP, higher quality parameter or lower bid price for example. In other words, for bid price parameter, the URL is the lowest bid price or expected engineering estimate (i.e. performance). For quality parameter, the URL is the highest quality or expected quality performance. If the URL is higher than 100%, it represents a bonus to the contractor of being better than the EP as shown in Figure 6.2a&b. The EP will be assigned a 100% value in the normalized scale. However, the LRL represents the worst value in a specified parameter. In other words, it is the highest value for bid price parameter and the lowest value for quality parameter. The contractor with the worst parameter value has Si equals LRL. The normalized value that will be assigned to the LRL (minimum (Min)) will be discussed in the following paragraphs. The contractor of intermediate score (Si) will be assigned a value in between

41
the URL and LRL based upon a linear relation assumption as shown in Figure 6.2a&b. The relation assumed is a linear scoring function based on the sensitivity analysis results as will be discussed later. Future research will further examine this assumption through investigating the parameter combinations affecting the Best-Value scoring. The straight line slope is ascending and descending based upon the nature of the parameter. For example, it is descending, Figure 6.2a, because the URL represents the lowest bid value as in the case of bid price, lane rental, traffic control, rejected claims, and contract time parameters. It is however ascending, Figure 6.2b, for quality parameter because the URL reflects the highest value (i.e. quality). The corresponding percentage to the intermediate score can be determined using the model in Equation (6.10) as follows:
MinMinURL
MinteIntermediaMinURLX +−
−−= )((%) (6.10)
3. Sensitivity analysis is performed in order to examine the effect of the bid price weight and to assign a percent for the LRL (Min value). Because bid price was the only parameter that was used to select the awarded bidder, it was recognized by practitioners as the dominant parameter in the Best-Value calculation. However, a previous study revealed, based on practitioner opinions, that bid price had a weight of 10-15% relative to the rest of parameters that affected the Best-Value index [12]. In order to accommodate both opinions (i.e. practitioners and previous results) and to test the effect of bid price weight on the Best-Value calculation, sensitivity analysis is performed by assigning the weight of bid price parameter to 10%, 50%, 70%, 80%, and 90%. The weight of other parameters changes according to their relative importance and the previous percentages of bid price.
4. The score of bid price parameter is calculated, based on Table 3.1, assuming that URL = EP = 100%. This is due to the lack of EP estimation by the owner. The LRL will be assigned the values 50%, 70%, and 90% in order to check the effect of this change on the decision among contractors. In addition, this change might lead the research to select the minimum score (LRL value) for various parameters. The number of sensitivity analysis combinations is calculated to be 1134.

42
Figure 6.1 Research Methodologies
No
Yes
No
Contractors submit their bids
Is the Contractor
Prequalified?
Outline/Select the BV parameters
Develop parameters scores (EP, URL & LRL)
Design/Perform sensitivity analysis
Filtered from the competition
Design the BV model
Contractor has the highest
BV?
Filtered from the competition
Select the highest BV contractor
Yes

43
100% 100%
X% X%
Min Min
URL EP Intermediate LRL LRL Intermediate EP URL
(a) (b)
Figure 6.2 Score of Normalized Scale for Various Parameters; (a) Descending slope and (b) Ascending slope
6.3.7 Data Collection and Case Studies Two case studies of different pavement projects have been used to show the calculation results for the model and investigate how the model works. Mn/DOT suggested the two cases and provided the project details as part of the Minnesota Best-Value development effort.
6.3.7.1 TH-113 project The primary purpose of this project is to reclaim state highway TH-113 (Mahnomen County MN) from the Jct. of TH 32 to the Norman/Mahnomen County line. District 4 out of Detroit Lakes added a 1.5” overlay from Norman/Mahnomen County line to city of Waubun (Mahnomen County is in District 4). This contract was awarded in January 2006 with 35 working days and a bid price of $2,155,015.
6.3.7.2 TH-494 Project This project is a new Valley Creek Road interchange with interstate TH-494 in Woodbury, MN. The project includes grading, concrete and bituminous surfacing, and signal system. This contract was awarded in April 2006 with 145 working days and a bid price of $9,932,277.
6.3.7.3 Questionnaire A questionnaire is sent to District Engineers in order to encompass their subjective opinion regarding the parameters’ weights. The engineers are asked to evaluate the significance of parameters using a scale from 1 to 5 whereas 1 represents the maximum significance and 5 represents not significant. The collected data from these questionnaires are used to develop the parameters’ weight. Fourteen groups of District Engineers are asked to answer the questionnaire questions. Each group consists of the District Engineer and the other engineers in his/her office. All groups answered the questionnaire with 100% response rate.
6.3.8 Model Implementation To show how the developed Best-Value model works, real-world data is collected. This data includes a group of two pilot projects (two case studies) identified to be used in the test-drive process of the model. The chosen group represents two different project scenarios in order to test
Potential Bonus Score
Potential Bonus Score

44
values resulting from model application. Both are different in volume, location, scope, preferences, and work type. The lowest three bidders are selected after the pre-qualification stage for each pilot project. Calculations are made for the lowest three bidders through the following stages:
I. Determination of Parameters Weight (Wi). Weights may be determined before the bidding process to ensure fairness and transparency.
II. Determination of Parameters Score (Si) III. Determination of Best-Value
Data for case studies are collected from the Minnesota Department of Transportation (Mn/DOT). In addition, subjective data are collected from District Engineers through the questionnaire.
6.3.8.1 Determination of Parameters Weight (Wi) The relative weights (Wi) for each included parameter in the Best-Value model is determined where the total summation of parameters’ weight should be equal to 1. These weights are determined based on the opinion of DOT experts. The abovementioned steps of applying the AHP technique are carried out in order to generate the parameters’ weights. Pair-wise comparison matrices are analyzed. The matrices have dimensions 6x6 and 8x8 for TH-113 and TH-494 projects, respectively. The C.R. value of pair-wise comparison matrices of TH-113 and TH-494 projects are 0.021 and 0.0192 (less than 0.1), which are acceptable and consistent. The weights for Best-Value parameters using the AHP technique are shown in Table 6.2, column (1). It is noted that contract time and unauthorized time have the highest weight (0.178) and rejected claims has the lowest weight of 0.118. Table 6.2 shows the weights of each parameter based on assigned values for the weight of bid price parameter. Discussions with the Mn/DOT personnel indicate that Bid price can be the most decisive parameter in Best-Value procurement. This is particularly true in the early stages of Best-Value implementation. However; AHP questionnaires indicate that bid price weight can be significantly lower than 50% [12]. To ensure proper coverage of different scenarios, the weight of bid price parameter is assigned to values of 10%, 50%, 70%, 80%, and 90% as shown in Table 6.2. Based on the AHP technique, the weight of other parameters is calculated in which the summation is equal to one.
Table 6.2 Weights of Parameters Corresponding to Various Bid Price Weights (TH-494)
Weight Analysis Parameters (1) (2) (3) (4) (5) BP = Bid Price 0.100 0.500 0.700 0.800 0.900 CT = Contract Time 0.178 0.099 0.059 0.039 0.020 UT = Unauthorized Time 0.178 0.099 0.059 0.039 0.020 RC = Rejected Claims 0.118 0.066 0.039 0.026 0.013 PQ = Quality 0.154 0.086 0.051 0.034 0.017 LR = Lane Rental Cost 0.142 0.079 0.047 0.032 0.016 TC = Traffic Control 0.130 0.072 0.043 0.029 0.014
Sum 1.00 1.00 1.00 1.00 1.00
6.3.8.2 Determination of Parameter Scores (Si) Based upon the abovementioned procedure, the expected performance (EP), upper reference limit (URL) and lower reference limit (LRL) values are calculated for each parameter in the case

45
study project. In this implementation example, the URL value is estimated to be equal to the EP = 100%, which reflects the best performance of the contractor in each parameter. This is because most agencies do not include EP estimate in their bids. However, the LRL value estimate is tricky because assigning a value of zero to the LRL will reduce the chances of this contractor to compete with others. On the other hand, assigning a 90% value to the LRL will not serve the purpose of Best-Value where it is supposed to distinguish clearly between the competitors. Therefore, it is decided to perform sensitivity analysis to be able to test the effect of changing the LRL, from 50% - 90%, on the Best-Value index. This process will serve two purposes: (a) facilitate selecting the LRL that will not dominate the decision and (b) test the effect of changing the parameter scores on the Best-Value index.
The presented research in this paper shows the implementation of Best-Value concept to one of the pilot projects because both projects depict close results. Table 6.3 shows the implementation of such a process. For example, when the weight of bid price parameter is 50% and the minimum score is 50%, the URL will be for contractor A (100%), the LRL will be for contractor C (50%), and the Intermediate score will be for contractor B (62.07%), which is calculated using the model in Equation (6.10). Similarly, these score values are calculated for the other minimum score values of bid price parameter (70% and 90%). This process is repeated for other weight values of bid price parameter as shown in Table 6.3.
Typically after the pre-qualification screening, contractors who are available in the competition will be very competitive where the differences among them will be minimal. Therefore, assigning the LRL to a low value, such as 0% or even 50%, will be aggressive to such a contractor and might get him/her outside the competition. Similarly, assigning a high value for LRL, such as 90%, will not show any distinction among contractors as shown in Figure 3. Based on sensitivity analysis, it is noted that when the LRL equals to 70%, the distinction between contractors is clear (i.e. there is a significant difference among them) and contractors rank might not be affected, which will be reasonable for all project parties.
6.3.8.3 Determination of Best-Value The Best-Value is calculated, using AHP method, for TH-494 project as shown in Table 6.3. The numbers in Table 6.3 are calculated using the corresponding weight values in Table 6.2 for all bidders. When the weight of bid price parameter and the minimum scores of all parameters are 50%, it is noted that bidder-A has the highest Best-Value of 90.46.
6.3.9 Sensitivity of the Best-Value Index Table 6.3 shows samples of the sensitivity analysis results for determining the LRL score. The values presented are the individual parameter scores and are presented as URL, LRL or Intermediate. Contractor ranking, within the same parameter, is constant and is not affected by either the parameter weight or the LRL value. Obviously, contractor ranking will vary from one parameter to another as the awarded score depends on the qualification input, for example bid price.
Table 6.4 shows samples of the sensitivity analysis for the selection process. The presented values represent the Best-Value scores for all parameters. As shown, contractor ranking is not constant for all combinations of bid price weight and LRL values. LRL value has an effect on the Best-Value ranking at specific combinations of bid price weights and LRL values all parameters. LRL has no effect on the Best-Value ranking at bid price weight of 80% and 90% and LRL

46
values of 70%. Therefore, LRL = 70% is selected for all parameters. The results of the sensitivity analysis also confirm the assumption of a linear scoring function as starting point is acceptable until further research investigates the parameter combinations affecting the Best-Value scoring.
Table 6.3 Samples of Sensitivity Analysis Results for Selected Cases
Parameter Bid Price Contract Time Unauthorized Time Rejected Claims
Score Limits URL Inter LRL Inter URL LRL Inter LRL URL Inter LRL URLContractor A B C A B C A B C A B C
LRL=50 100 62.07 50 88.89 100 50 75 50 100 77.27 50 100 LRL=70 100 77.24 70 93.33 100 70 85 70 100 86.36 70 100
Bid Price
Weight = 50% LRL=90 100 92.41 90 97.78 100 90 95 90 100 95.45 90 100
LRL=50 100 62.07 50 88.89 100 50 75 50 100 77.27 50 100 LRL=70 100 77.24 70 93.33 100 70 85 70 100 86.36 70 100
Bid Price
Weight = 90% LRL=90 100 92.41 90 97.78 100 90 95 90 100 95.45 90 100 Parameter Quality Lane Rental Traffic Control
Score Limits Inter LRL URL Inter URL LRL Inter LRL URL
Contractor A B C A B C A B C
LRL=50 75 50 100 81.82 100 50 87.5 50 100 LRL=70 85 70 100 89.09 100 70 92.5 70 100
Bid Price
Weight = 50% LRL=90 95 90 100 96.36 100 90 97.5 90 100
LRL=50 75 50 100 81.82 100 50 87.5 50 100 LRL=70 85 70 100 89.09 100 70 92.5 70 100
Bid Price
Weight = 90% LRL=90 95 90 100 96.36 100 90 97.5 90 100
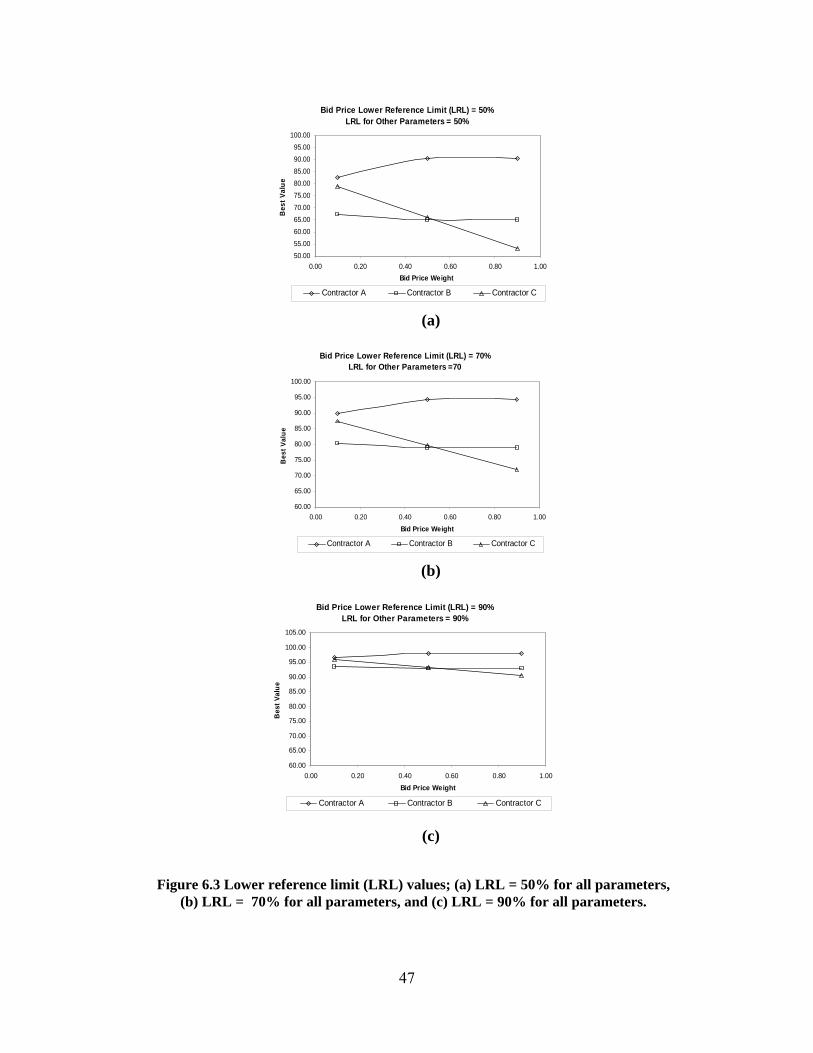
47
Bid Price Lower Reference Limit (LRL) = 50%LRL for Other Parameters = 50%
50.0055.0060.0065.0070.0075.0080.0085.0090.0095.00
100.00
0.00 0.20 0.40 0.60 0.80 1.00Bid Price Weight
Bes
t Val
ueContractor A Contractor B Contractor C
Bid Price Lower Reference Limit (LRL) = 70%LRL for Other Parameters =70
60.00
65.00
70.00
75.00
80.00
85.00
90.00
95.00
100.00
0.00 0.20 0.40 0.60 0.80 1.00
Bid Price Weight
Bes
t Val
ue
Contractor A Contractor B Contractor C
Bid Price Lower Reference Limit (LRL) = 90%LRL for Other Parameters = 90%
60.00
65.00
70.00
75.00
80.00
85.00
90.00
95.00
100.00
105.00
0.00 0.20 0.40 0.60 0.80 1.00
Bid Price Weight
Bes
t Val
ue
Contractor A Contractor B Contractor C
(a)
(b)
(c)
Figure 6.3 Lower reference limit (LRL) values; (a) LRL = 50% for all parameters, (b) LRL = 70% for all parameters, and (c) LRL = 90% for all parameters.

48
Table 6.4 Sensitivity Analysis for Decision Selection At 50% weight of “Bid Price” Parameter Min score of bid price parameter 50% 70% 90%
LRL Ranked Contractors BV Ranked
Contractors BV Ranked Contractors BV
A 90.5 A 90.5 A 90.46 C 66.1 C 76.1 C 86.12 50% B 64.9 B 72.5 B 80.09 A 94.3 A 94.3 A 94.28 B 71.4 C 79.7 C 89.67 70% C 69.7 B 79 B 86.54 A 98.1 A 98.1 A 98.09 B 77.8 B 85.4 C 93.22 90% C 73.2 C 83.2 B 92.98
At 70% weight of “Bid Price” Parameter A 90.5 A 90.5 A 90.5 B 64.9 C 73.7 C 87.7 50% C 59.7 B 72.5 B 80.1 A 94.3 A 94.3 A 94.3 B 71.4 B 79.0 C 89.8 70% C 61.8 C 75.8 B 86.5 A 98.1 A 98.1 A 98.1 B 77.8 B 85.4 B 93.0 90% C 63.9 C 77.9 C 91.9
At 80% weight of “Bid Price” Parameter A 90.5 A 90.5 A 90.5 B 64.9 B 72.5 C 88.5 50% C 56.5 C 72.5 B 80.1 A 94.3 A 94.3 A 94.3 B 71.4 B 79.0 C 89.9 70% C 57.9 C 73.9 B 86.5 A 98.1 A 98.1 A 98.1 B 77.8 B 85.4 B 93.0 90% C 59.3 C 75.3 C 91.3
At 90% weight of “Bid Price” Parameter A 90.5 A 90.5 A 90.5 B 64.9 B 72.5 C 89.2 50% C 53.2 C 71.2 B 80.1 A 94.3 A 94.3 A 94.3 B 71.4 B 79.0 C 89.9 70% C 53.9 C 71.9 B 86.5 A 98.1 A 98.1 A 98.1 B 77.8 B 85.4 B 93.0 90% C 54.6 C 72.6 C 90.6
6.4 Part-2 of Sensitivity Analysis Sensitivity analysis is used as a part of validation process to help testing the effect of changing MNCAST settings. The sensitivity analysis is developed for the following parameters:
• Number of Data Records, • Work Types, • Work Locations, • Bid Price/Performance parameters Weight Ratio,

49
• Zero References point for Bid Price, • Zero References point for Performance Parameters, and • Bid Price.
The expected outputs of the sensitivity analysis would set a guideline of how to utilize the software in awarding the project to the best contractor. Sensitivity analysis is used to investigate the effect of changing the price parameters’ relative weights from 0, when price parameters isn’t considered in the contractor selection process, to 100, when performance parameters is not considered in the contractor selection process (Traditional bidding process). And based on that, the most convenient weight of price parameters could be set. The sensitivity analysis used throughout the following sections is based on a reasonably assumed set of data for a construction project as shown in Table 6.5. The provided data represent MNCAST inputs for bid price, lane rental, rejected claims, international roughness index (IRI), and water cement ratio (W/C).
Table 6.5 MNCAST Inputs* for Different Contractors
CONTRACOR A B C D
Price parameters BID PRICE ($M) 1.25 1.3 1.4 1.35 LANE RENTAL ($M) 0.2 0.21 0.19 0.18 Performance parameters REJECTED CLAIMS (%) 6.44 5 1 1.444
IRI (%) 2.9167 1.0163 2.3564 3.55 QUALITY W/C (%) 0.5484 3.5 1.096 3.52
* Assumed based on collected data.
MNCAST has a number of options that could be adjusted to match the preferences of the owner in awarding his project to a specific contractor. Using MNCAST it is possible to;
• Choose the number of years of contractor past record that would be considered in the calculation of Best-Value.
• Choose between including a single or multiple locations/districts to include in the calculations.
• Choose between including a single or multiple project types in the calculations. • Change the weights of parameters. • Change the zero reference limit of each parameter.
MNCAST settings shown in Table 6.6 are used to design a matrix of different scenarios that might occur during the selection process. Using different levels in each setting created 19 different cases as shown in Table 6.7. Each case runs in MNCAST with the corresponding settings to calculate the resultant Best-Value for each participating contractor. The resultant Best-Value of these cases is shown in Table 6.8. The following sections will discuss the interpretations of the results.

50
Table 6.6 Matrix of MNCAST Settings Column (2)* Change the “number of years of data”
considered in the calculation of BV Case 1: 3 years of old record Case 2: 2 years of old record Case 3: 1 years of old record
Column (3)* Include data for the same type of project versus including for all types of work.
Case 1: use projects data of all types within the contractor record Case 2: use records for projects with the same type as the one he is bidding for
Column (4)* Include data from local district versus including data for other districts within the state as well.
Case 1: include all district within the state Case 2: include one district
Column (5)* & (6)* Change bid price and lane rental parameter weights
Case 1: bid price and lane rental weight of 50% Case 2: bid price and lane rental weight of 60% Case 3: bid price and lane rental weight of 70% Case 4: bid price and lane rental weight of 80% Case 5: bid price and lane rental weight of 90% Case 6: bid price and lane rental weight of 100%
Column (7)* & (8)* Change performance parameter weights (quality and rejected claims)
Case 1: rejected claim and quality weight of 50% Case 2: rejected claim and quality weight of 40% Case 3: rejected claim and quality weight of 30% Case 4: rejected claim and quality weight of 20% Case 5: rejected claim and quality weight of 10% Case 6: rejected claim and quality weight of 0%
Column (9)* Change the “0% Reference Limit” for price parameters
Case 1: max. bid Case 2: 2*max. bid- min. bid Case 3: 1.5*min. bid Case 4: 2*min. bid
Column (10)* Change the “100% Reference Limit” for performance parameters
Case 1: min. value Case 2: 100th percentile Case 3: 90th percentile Case 4: 75th percentile Case 4: 60th percentile
Column (11)* Change the “0 Reference Limit” for performance parameters
Case 1: 2*max. - min. value Case 2: 0th percentile Case 3: 10th percentile Case 4: 25th percentile Case 4: 40th percentile
* Columns are those of Table 6.7

51
Table 6.7 Sensitivity Analysis Cases
Weight C
ase
Yea
rs
Type
Loca
tion
BP LR QL RC 0% Ref for Price
parameter
100% Ref for performance
parameter
0% Ref for performance
parameter
(1) (2)* (3)* (4)* (5)*
(6)*
(7)*
(8)* (9)* (10)* (11)*
1 3 CP D1 50 20 15 15 2 Max Bid -Min Bid
min value 2 max -min
2 2 CP D1 50 20 15 15 2 max -min min value 2 max -min 3 1 CP D1 50 20 15 15 2 max -min min value 2 max -min 4 3 All D1 50 20 15 15 2 max -min min value 2 max -min 5 3 CP All 50 20 15 15 2 max -min min value 2 max -min 6 3 All All 50 20 15 15 2 max -min min value 2 max -min 7 3 CP D1 30 20 25 25 2 max -min min value 2 max -min 8 3 CP D1 40 20 20 20 2 max -min min value 2 max -min 9 3 CP D1 60 20 10 10 2 max -min min value 2 max -min 10 3 CP D1 70 20 5 5 2 max -min min value 2 max -min 11 3 CP D1 80 20 0 0 2 max -min - - 12 3 CP D1 50 20 15 15 Max Bid min value 2 max -min 13 3 CP D1 50 20 15 15 1.5* Min Bid min value 2 max -min 14 3 CP D1 50 20 15 15 2* Min Bid min value 2 max -min 15 3 CP D1 0 0 50 50 - min value 2 max -min 16 3 CP D1 0 0 50 50 - 100th percentile
population 0th percentile population
17 3 CP D1 0 0 50 50 - 90th percentile population
10th percentile population
18 3 CP D1 0 0 50 50 - 75th percentile population
25th percentile population
19 3 CP D1 0 0 50 50 - 60th percentile population
40th percentile population
(2)* Years of history considered in the BV calculations (3)* Project’s work type (CP= Concrete pavement included, All= all project types included) (4)* Project’s location (D1= District 1 included, All= all districts included) (5)* Parameters weight (BP= Bid price) (6)* Parameters weight (LR= Lane Rental) (7)* Parameters weight (QL= Quality) (8)* Parameters weight (RC= Rejected Claim) (9)* 0% Reference for Price parameter is upper limit of price parameters that get a score of zero. (10)* 100% Reference for performance parameter is lower limit of performance parameters that get a score of
100. (11)* 0% Reference for performance parameter is upper limit of performance parameters that get a score of zero.

52
Table 6.8 Results of Sensitivity Analysis Cases
CONTRACTORS’ CALCULATED BEST-VALUE CASE A B C D 1 83.02 76.16 65.93 78.97 2 85.83 81.67 56.67 75.83 3 82.08 77.92 56.67 75.83 4 85.83 81.57 68.82 80.94 5 93.33 79.28 57.55 78.58 6 85.49 80.85 68.41 80.78 7 76.15 75.82 72.11 82.73 8 79.59 75.99 69.02 80.85 9 86.46 76.33 62.85 77.09 10 89.90 76.50 59.76 75.21 11 93.33 76.67 56.67 73.33 12 76.36 57.82 37.60 62.30 13 85.25 83.82 80.05 87.64 14 87.47 89.16 87.16 91.64 15 65.63 81.63 80.89 85.46 16 88.48 98.33 80.56 87.02 17 85.63 81.63 80.89 85.46 18 40.63 50.00 80.89 80.09 19 40.63 50.00 80.89 87.50
6.4.1 Effect of Changing the Number of Data Record on Best-Value Case #1, 2 and 3 use the same inputs except the number of years of records considered in the analysis. Contractor past record are compared for 3, 2 and 1 year respectively. For these cases, the weight assigned to the performance parameters and price parameters are 30% and 70% respectively. The Best-Value results for the three cases are slightly different due to the small relative weight of the performance parameters knowing that the four contractors’ bids are relatively equal. It is expected that giving performance parameters a larger weight could cause a difference in the resultant Best-Value. Figure 6.4 shows the effect of changing the number of data record on Best-Value and so the contractors’ ranking. It’s obvious that there is an effect for the number of record years included in the calculations of Best-Value. But because of the dominant weight of bid price over the weight of performance parameters, this effect is minimized. This effect could be noted in the change of ranking for contractor B and D however the winning contractor is contractor A in all cases.

53
Figure 6.4 The Effect of Changing Data Record on Best-Value Results
6.4.2 Effect of Changing the Included Work Types on Best-Value Including data records for all project types within the analysis is represented in case #4. The result of case #4, where contractor past record of all work types is considered in the calculation, is compared to case #1, where the past record only for concrete pavement is considered. The Best-Value resulted from both cases are shown in Figure 6.5. This Figure does not show a significant change between the two cases. The reason behind this similarity is due to the small weights assigned to the performance parameters that make the total effect of changing the work type included in the calculation very insignificant.

54
Figure 6.5 The Effect of Changing the Included Work Types on Best-Value Results
6.4.3 Effect of Changing the Included Districts on Best-Value Including contractor past records for all project locations within the analysis is represented in case #5. The result of case #5, where contractor past record for all project locations is considered in the calculation, is compared to case #1, where only the past record of projects constructed in district 1 is considered. Contractors’ ranking for both cases is the same that contractor A is the winner. The difference between the two cases could be noted when looking at Figure 6.6. Contractors Best-Value of case #5 is wide spread compared to case #1. Contractor A gains more score when adding past record of his work in other districts to the calculation, while contractor C losses score by adding past record of his work in other districts. Both contractors B and D do not affected by adding past records of work in other districts. This result clearly shows the effect of considering past record for work done in other districts on the resulted Best-Value.

55
Figure 6.6 The Effect of Changing the Included Districts on Best-Value Results
6.4.4 Effect of Changing Bid Price/Performance Parameters Weight Ratio on Best-Value Cases 7,8,1,9,10, and 11 represent the difference occurs in Best-Value, as a result to the change of bid price/performance parameters ratio of 50/50, 60/40, 70/30, 80/20, 90/10, and 100/0 respectively. Figure 6.7 shows Best-Value for different bid price/performance parameters ratio. As seen in the figure contractor ranking changed dramatically as the ratio changed. The neutral point of this graph is 70/30 where all the contractors get closer values of Best-Value. This neutral point could be different from project to another. The values of Best-Value on the right side of the graph spread over a wider range. It could be noted also from the graph that contractors’ rankings have changed with the change of bid price/performance parameters ratio. A better selection of contractor occurs when there is a significant difference between contractors Best-Value what make the selection more reliable. Based on this rule, ratios 80/20, 90/10, and 100/0 give a reliable selection. In which case, the price parameters for all the contractors are too close.

56
Figure 6.7 The Effect of Changing Bid Price/Performance Parameters Weight Ratio on Best-Value Results
6.4.5 Effect of Changing the 0 References Point for Bid Price on Best-Value: The point of 0 references point for bid price is the lower limit point where the bid price score is equal to 0. Zero references point for bid price is calculated for (max. bid), (2*max. bid- min. bid), (1.5*min. bid), and (2*min. bid) in cases 12, 1, 13, and 14 respectively. The results of these cases are shown in Figure 6.8 below. It could be noted from the figure that the difference between the best-Value score is maximum when the 0 references point for bid price equals maximum bid, while this difference is minimum when 0 references point for bid price equals (2*min. bid). The reason for the minimum difference between the contractor Best-Value at the 0 references point of (2*min. bid) is that this point is far away from the bid prices of all contractors. This distance makes the individual differences between contractors vanished. The better contractor selection case would be with a 0 references point equals maximum bid where there is a significant differences between contractors Best-Value.

57
Figure 6.8 The Effect of Changing 0 References Point for Bid Price on Best-Value Results
6.4.6 Effect of Changing the 0 References Point for Performance Parameters on Best-Value One way to calculate the contractor score of the performance parameters is to calculate it relative to the performance parameters for only the contractors who are bidding in the same project. The other way is to give this score based on a certain percentile of the whole population of contractors exist in the owner data base. Zero reference limits of performance parameters was assigned to the 100th, 90th, 75th, and 60th percentile of contractor population for cases 16, 17, 18, and 19 respectively. As could be noted from Figure 6.9 below, there are minor differences between Best-Value calculated for different contractors in case 100th percentile population is used as 0 reference limits for performance parameters. According to the figure, a better contractor selection exists when using the 60th percentile of the population as 0 reference limit for performance parameters.

58
Figure 6.9 The Effect of Changing 0 References Point for Performance Parameters on Best-Value Results

59
7. SUMMARY AND CONCLUSIONS
7.1 Summary The proposed model includes the relevant parameters and associated weighting for specific project needs. Best-Value contracting aims at using factors other than only price in the evaluation of contractors. Doing so enhances the long-term performance of projects. The inclusion of key factors that match certain needs of a specific project guarantees that the selected contractor is the best to construct the facility. Previous attempts to implement Best-Value contracting did not consider the unique characteristics of each construction project. The current Best-Value model, unlike previous models, considers each project as unique. The aim was to establish a flexible model capable of being tailored to certain project needs. The inclusion and exclusion of parameters and different weights give owners flexibility. Historical records of contractor performance act as inputs to the Best-Value system. These records are an indication of the contractor’s qualification trend. Two pilot projects were used during model implementation to show the impact of the Best-Value system in the contractor selection process. Results of model implementation show significant differences from the Lowest Bid strategy. Bid Price constituted only 13 to 17 percent of the total weight for the two projects. As a result, the lowest bid did not decide the award, but rather the degree to which project priorities were accommodated. Assigning an initial fixed weight for bid price (80%) for both projects did not affect the selection as Contractor C prevailed in both cases. A trade-off analysis for the lowest and chosen contractors is shown below.
7.2 Summary of Part-1 The Best-Value contracting strategy aims at using price and other key factors in the evaluation and selection process to enhance the long term performance of projects. The inclusion of model parameter as key factors that match the very specific needs of a specific project guarantees that the selected contractor is the best to construct the facility. Previous attempts to implement Best-Value contracting strategy did not consider the unique characteristics of each construction project in which they based the selection criteria on subjective methods. Unlike previous studies, this study deals with each project as a unique case and includes the appropriate parameters in the contractor selection process. The study uses a rational approach in calculating the scores based on the agency expected performance. The aim is to establish a flexible but rational model capable of being tailored to specific needs of the project. This flexibility is obvious in the selection of parameters, to be included in the contractor selection process, and in the determination of parameter’s weights. The model rationality is achieved through relating all awarded scores to the agency’s expected performance. The establishment of the Best-Value model uses the past record of the contractor work for the agency as an indicator of the contractor’s qualification trend. This research incorporates pre-qualification as a first level screening technique in selecting top contractor bids in Best-Value procurement and then applies a rational scoring system in the final selection. Data are collected from groups of experts in the Minnesota Department of Transportation and processed through the analytic hierarchy process (AHP) to establish the parameter weights. A sensitivity analysis is conducted to verify the model scale and calculation methods. The analysis shows reasonable differences in the parameter scores reflecting the differences in the contractor qualifications.

60
Pilot projects are used during model implementation to clarify the impact of the Best-Value system in the contractor selection process. Results of model implementation shows the significant turnover from the lowest bid strategy to the choice of the best contractor based on past contractor performance. The maximum value of Best-Value for pilot projects has gone to a contractor other than the lowest bidder. This happens as an impact of including parameters more than just the lowest bid.
7.3 Summary of Part-2: The inference of sensitivity analysis results clearly show that a better selection would be more reliable and significant if the following condition occurs:
• More data records are used for the contractors such as data record for work done in other districts.
• The implementation of the Best-value system would start with a higher weight assigned to bid price, between 80-90% of the total weight, at which the selection will depend on the lowest bidder and considering other performance parameters. The opposite case would be for the weight of bid price ranges between 20-30% of the total weight leaving a higher weight value of 70-80% for the performance parameters at which the selection will be based heavily on the contractor with better performance. Reliable documentation of the contractor performance is necessary in this case.
• “0-reference limit” for bid price set as equal to max. Bid. Part-1 of this report discusses an alternative of setting a lower-reference-limit and the use of prescreening steps.
• The use of “0-reference limit” for performance parameters as equal to a specific percentile, the 60th to the 75th percentile of the contractor’s population in this case, is arbitrary and depends on available records to support the selected value.

61
8. REFERENCES
1. S. Scott, K. Molenaar, D. Gransberg, N. Smith, (2006) Best-Value Procurement Methods for Highway Construction Projects. Transportation Research Board, National Research Council, Report 561, Project NO. 10-61, WASHINGTON, D.C.
2. Federal Acquisition Regulation (FAR), (2005) “Qualifications Requirements” Part 9. CCH Incorporated, Chicago, Illinois, pp. 169-200.
3. Naval Facilities Engineering Command. Southern Division (NAVFAC), (1996) Instructions for Developing Request or Proposals for Source Selection Design/Build Projects. Specification Instruction 00011. Rep. Code 076 (RAM/SHP), Pensacola, FL.
4. R. Vacura and M. Bante, (2003) “Value Based Contracting - lt’s Not Just Price Anymore: Effective Use of Past Performance - Not a New Challenge.” American Bar Association Forum on the Construction Industry, Washington. D.C.
5. D. Gransberg and M. Ellicott, (1996) “Best-Value Contracting: Breaking the low-Bid Paradigm.” AACE Transactions, AACE International, Vancouver, VE&C.5.1-VE&C.5.4.
6. D. Gransberg and M. Ellicott, (1997) “Best-Value Contracting Criteria.” Journal of Cost Engineering, Vol. 39 (6), pp. 31–34.
7. D. Gransberg and S. Senadheera, (1999) “Design-Build Contract Award Methods for Transportation Projects.” Journal of Transportation Engineering, Vol. 125 (6), pp. 565-567.
8. D. Gransberg, J. Koch, and K. Molenaar, (2006) Preparing for Design-Build Projects: A Primer for Owners, Engineers, and Contractors. ASCE Press. ISBN: 0-7844-0828-9, VA.
9. K. Molenaar and D. Johnson, (2003) “Engineering the procurement Phase to Achieve Best-Value.” Leadership and Management in Engineering, Vol. 3(3), pp.137-141.
10. Jr. Minchin, G. Smith, (2001) Quality-Based Performance Rating of Contractors For Prequalification And Bidding Purposes. NCHRP Project D10-54, Washington, D.C.
11. Minnesota Department of Transportation. “Special Provisions Boiler Plates.” http://www.dot.state.mn.us/tecsup/prov/index.html, Accessed July 27, 2007.
12. M. Abdelrahaman, T. Zayed, and A. Elyamany, (2008) “A Best-Value Model Based on Project Specific Characteristics.” Journal of Construction Engineering and Management, Vol. 134(3), pp. 179-188.
13. T. Saaty, (1991) Decision Making with Dependence and Feedback: The Analytic Network Process. RWS Publications, Pittsburgh, PA.
14. T. Saaty, (1982) Decision Making for Leaders: The Analytic Hierarchy Process for Decision in a Complex World. Lifetime Learning Publications, Belmont, CA.
Additional References: 1. S. Anderson and J. Russell, (2001) Guidelines For Warranty, Multi-Parameter And Best-
Value Contracting, Report 451, Project No. 10-49, National Cooperative Highway Research Program, Transportation Research Board, National Research Council, Washington, D.C.
2. T. Napier and S. Freiburg, (1990) One-step and two-step facility acquisition for military construction: Project selection and implementation procedures. Technical Report P.90. U.S. Army Corps of Engineers, Construction Engineering Research Laboratory, Champaign, IL.
3. T. Zayed and D. Halpin, (2004) “Quantitative Assessment for Piles Productivity Factors.” Journal of Construction Engineering and Management, Vol. 130(3), pp. 405-414.

APPENDIX A MN/DOT RESIDENT ENGINEER QUESTIONNAIRE

A-1
This questionnaire intend to communicate with Mn/DOT resident engineers to receive their feedback on Best-Value as a procurement process where price and other key factors are considered in the selection process to enhance the long-term performance and value of
construction.
1) On a scale from 5 (very satisfied), 4(above average), 3(average), 2(below average), 1(not satisfies), how satisfied you are with (PLEASE CIRCLE):
Awarding the contract to the lowest bid? 5 4 3 2 1
Including other factors related to construction quality and contractor performance in the awarding process? 5 4 3 2 1
using incentive/disincentives to enhance the quality of construction and to deliver the project on time? 5 4 3 2 1
2) On a scale from 5 (very satisfied), 4(above average), 3(average), 2(below average), 1(not satisfies), how satisfied you are with the following parameters for the entire construction projects you worked on (PLEASE CIRCLE):
1. Contractor performance? 5 4 3 2 1 2. Quality of the final product? 5 4 3 2 1 3. Adherence to project schedule? 5 4 3 2 1 4. Motivation to decrease the project cost? 5 4 3 2 1 5. Employees’ skills? 5 4 3 2 1 6. Project Management plan? 5 4 3 2 1 7. Equipment Utilization? 5 4 3 2 1 8. Meet safety and environmental requirement? 5 4 3 2 1 9. Actual construction cost/bid unit price? 5 4 3 2 1
3) On a scale from 5 (Highest priority), 4(above average), 3(average), 2(below average), 1(Lowest priority), rank the following parameters of Best-Value (PLEASE CIRCLE):
Contractor qualifications: 1. Commercial contractor license in the state 5 4 3 2 1 2. Load of work could done 5 4 3 2 1 3. Business pattern in the last years 5 4 3 2 1 4. Previous owners 5 4 3 2 1
Contractor experience 1. Years of experience in the current construction field 5 4 3 2 1 2. Years of experience with department 5 4 3 2 1 3. States in which he is qualified 5 4 3 2 1 4. Key personnel experience 5 4 3 2 1

A-2
Project performance 1. Completed projects in the last years 5 4 3 2 1 2. Failure in completing a previous project 5 4 3 2 1 3. Claims and penalties 5 4 3 2 1 4. Equipment utilization 5 4 3 2 1 5. Traffic control 5 4 3 2 1
Quality of construction work 1. Quality of final product 5 4 3 2 1 2. Amount of rework 5 4 3 2 1 3. Compliance with specification 5 4 3 2 1 4. Compliance to EEO, safety, and labor 5 4 3 2 1
Financial situation of contractor 1. Past bankruptcy 5 4 3 2 1 2. Bond-ability 5 4 3 2 1 3. Financial ratios 5 4 3 2 1
Sub-contracting: 1. Receives credit/discredit for work by sub-contractors 5 4 3 2 1 2. Constructing records of sub-contractors 5 4 3 2 1 3. Do not qualify sub-contractors with bad records 5 4 3 2 1
4) What are the data/records that can be collected to be used as the best representative for the following parameters?
1. Contractor experience with DOT …………………. 2. Traffic control and maintenance …………………. 3. Quality of work completed ………….……… 4. Safety and environmental aspects …………………. 5. Adherence to project schedule …………………. 6. Rework/rejected work ……….………… 7. Equipment utilization …………………. 8. Financial situation …………………. 9. Project performance …………………. 10. Contractor qualification ………………..

APPENDIX B MN/DOT QUESTIONNAIRE

B-1
The determination process of the parameters to be included in the model required the help of Mn/DOT engineer’s experience. A questionnaire was distributed on the resident engineers during a monthly meeting held on April 17, 2006. This questionnaire intended to communicate with Mn/DOT resident engineers to receive their feedback on Best-Value as a procurement process where price and other key factors are considered in the selection process to enhance the long-term performance and value of construction. There were some comments about Best-Value raised during the meeting which summarized as follows:
• How both environmental and safety be in one category? • Comment about a possibility of a contractor with good EAO has a subcontractor with bad
EAO, how it is rated? • Comment about the benefits of using BV system to include other parameters rather than
the lowest bid. • Question about the level of details that is required to be considered? • Comment about the necessity of gathering data in the future in case of conducting the
new approach. • Comment about the need to move to the project level to best answer the questionnaire
questions. • Clarification of the fact that the new approach will deal with each project as a unique, so
that represent how much the system is flexible. • The need to distribute the questionnaire to more people rather than resident engineers to
avoid personal judgment. •
Table B-1 Percentage Engineers Satisfaction for Question one
V. satisfied
above Av. Average below
Av. Not
satisfieda Awarding the contract to the lowest bid 14.29 50.00 21.43 14.29 0.00
b including other factors related to construction quality in awarding process 14.29 7.14 28.57 35.71 14.29
c using incentive/disincentive to enhance the quality and deliver the project on time 0.00 14.29 21.43 50.00 14.29
Table B-2 Percentage Engineers Satisfaction for Question Two
V. satisfied above Av. Average below Av. Not
satisfieda Contractor performance 0.00 28.57 42.86 14.29 7.14 b Quality of the final product 0.00 14.29 57.14 28.57 0.00 c Adherence to project schedule 14.29 21.43 35.71 28.57 0.00 d Motivation to decrease the project cost 21.43 35.71 35.71 7.14 0.00 e Employees’ skills 7.14 28.57 42.86 21.43 0.00 f Project Management plan 21.43 35.71 35.71 0.00 7.14 g Equipment Utilization 0.00 21.43 57.14 14.29 0.00 h meet safety and environmental requirement 7.14 28.57 42.86 21.43 0.00 I Actual construction cost/bid unit price 0.00 21.43 57.14 14.29 0.00

B-2
Table B-3 Percentage Engineers Satisfaction for Contractor Qualification Parameters
V. satisfied
above Av. Average below
Av. Not
satisfied Rank
a commercial contractor license in the state 35.71 14.29 42.86 0.00 7.14 1
b load of work could done 0.00 7.14 35.71 50.00 7.14 3 c business pattern in last years 0.00 0.00 7.14 64.29 28.57 4 d previous owners 7.14 28.57 64.29 0.00 0.00 2
Table B-4 Percentage Engineers Satisfaction for Contractor Experience Parameters
V. satisfied
above Av. Average below
Av. Not
satisfied Rank
a years of experience in the current construction field 0.00 7.14 42.86 42.86 7.14 2
b years of experience with department 0.00 0.00 28.57 42.86 28.57 3 c states in which he is qualified 21.43 28.57 21.43 21.43 7.14 1 d key personnel experience 0.00 0.00 14.29 57.14 28.57 4
Table B-5 Percentage Engineers Satisfaction for Project Performance Parameters
V. satisfied
above Av. Average below
Av. Not
satisfied Rank
a completed projects in the last years 0.00 7.14 64.29 21.43 7.14 1 b failure in completing a previous project 0.00 0.00 0.00 50.00 50.00 4 c claims and penalties 0.00 0.00 7.14 28.57 64.29 5 d equipment utilization 0.00 14.29 42.86 21.43 7.14 2 e traffic control 0.00 0.00 7.14 57.14 35.71 3
Table B-6 Percentage Engineers Satisfaction for Project Quality Parameters
V. satisfied
above Av. Average below
Av. Not
satisfied Rank
a quality of final product 0.00 0.00 7.14 21.43 71.43 4 b amount of rework 0.00 0.00 21.43 57.14 21.43 2 c compliance with specification 0.00 0.00 0.00 71.43 28.57 3 d compliance to EEO, safety, and labor 0.00 14.29 50.00 28.57 7.14 1
Table B-7 Percentage Engineers Satisfaction for Financial Situation Parameters
V. satisfied
above Av. Average below
Av. Not
satisfied Rank
a past bankruptcy 0.00 14.29 35.71 21.43 28.57 2 b bondability 0.00 0.00 50.00 14.29 28.57 3 c financial ratios 0.00 0.00 57.14 28.57 7.14 1

B-3
Table B-8 Percentage Engineers Satisfaction for Subcontractor Parameters
V. satisfied
above Av. Average below
Av. Not satisfied Rank
a receive credit/discredit for work by subcontractor 0.00 7.14 21.43 14.29 57.14 1
b considering records of subcontractor 0.00 0.00 0.00 64.29 35.71 2
c do not qualify subcontractor with bad record 0.00 0.00 7.14 50.00 42.86 3
Q9: What are the project data records you have that could be the best representative for the following..?
1. Contractor experience with DOT 2. Traffic control and maintenance 3. Quality of work completed 4. Safety and environmental aspects 5. Adherence to project schedule 6. Rework/rejected work 7. Equipment utilization 8. Financial situation 9. Project performance 10. Contractor qualification
Table B-9 Data Sources as Suggested by Resident Engineers
Data Sources annual survey result MPCA violation incentive/disincentive bituminous plant report NPDER report inspection records certified contract time record NPDS loans maintenance record change order OSHA record supplemental agreement claims penalties work zone safety review contract project specification record Maplewood lab. report contractor core report project weekly traffic logs diary contractor rating form project files references cpm rating of contractor at finals cms data base recorded accidents

APPENDIX C MNCAST MANUAL

C-1
MNCAST is a level ground to build on a procurement system proposed to help the owner in its search for getting the Best-Value from each dollar spent on the project. MNCAST provides a decision-making support tool for the owner to best select the most appropriate contractor. Upon full implementation, MNCAST will heavily depend on the records of the contractor’s previous work for the owner.
Getting Started This section shows how the software can be installed.
Installation Instruction:
General Installation Instructions For the time being, the MNCAST software is located in the following server: ftp://pez.dreamhost.com. The Setup program copies the MNCAST system files into the C:\ directory on the hard disk. To run the Setup program in Windows 95 or higher:
Open the website; ftp://pez.dreamhost.com Choose Best-Value directory, then click on the setup file Login using
o Username= mndot (case sensitive) o Password = bestvalue. (case sensitive)
Select open in the file download window. Select the MNCAST zip file to start downloading the software. Follow the installation process steps to finish the installation process. Double click the MNCAST icon to start using the software.
If you encounter problems while installing MNCAST, verify that there is adequate space available.
Creating Shortcut A shortcut is created upon installation in the start menu. However, if problems are encountered during Setup, or if the user wishes to do this manually, follow the following directions.
Click the Start button, and then point to Settings. Click Taskbar, and then click the Start Menu Programs tab. Click Add, and then click Browse. Locate the file MNCAST.EXE and double click it. Click next, and then double-click the menu on which you want the program to appear. Type the name "MNCAST", and then click Finish.
Quick Start: A brief list of instructions for running the software (after initial file setup) is given as follows:
Click the MNCAST icon in the Windows Start Programs. Use the File > Open command to open Example. The default location for the examples is
C:\ MNCAST\PROJECTS\EXAMPLE. Click the Best-Value icon on the MNCAST Toolbar. You could find the name, type,
location, and year of this example project.

C-2
In Results tab there is a list of the parameters (in columns) included in calculating Best-Value of example project for each contractor (in rows) considered in the selection process.
Details tab shows the details of Best-Value calculations such weight, score, weighted score, and Best-Value for each contractor selected from drop down menu.
Data view tab shows the record of the contractor selected from contractor drop down menu for the parameter selected from parameter drop down menu.
Starting a New Project: File menu > New
Input menu > Project Information.
Input Files The software uses excel as the input file format. Input files should be closed before running the software. Each contractor will be assigned an excel workbook. Within this workbook, several sheets exist.
Contractor Information The sheet labeled “Contractor Information” is solely used to store the contractor name. Attempting to create a new contractor input file with a pre-existing contractor name is not allowed. Names must be unique. Names cannot contain spaces, or the following characters: $,!,@,#,%,^,&,*
Creating a New Contractor Input File New contractors are added in the File Manager or in the Tool Menu. Adding a new contractor will create an empty workbook with a sheet for every parameter. After creating a new contractor, the user must open the contractor’s input file and enter the data in the appropriate sheet.
Parameters The remaining worksheets contain the contractor’s data. Each parameter is dedicated a separate sheet. The sheet contains 6 columns:
Numerator This column contains the numerator for the given parameter equation. The numerator will be different for most parameters. See parameter equations.
Denominator This column contains the denominator for the given parameter equation. The denominator will be different for most parameters. See parameter equations.
Type This column contains the type code for the given job. See Type Codes Options.
Year This column contains the year in which the job was completed. The software will only use a set history (# of years) in the Best-Value calculation. The number of years used is determined in the Project Settings Menu.

C-3
Location This column contains the location code for the given job. See Location Codes Options.
Direction This column contains the direction code. The code is only necessary in the first row below the heading. The direction codes are as follows:
Assign 1 = Bigger numbers are better Assign 0 = Smaller numbers are better
Creating a New Parameter New parameters are created in the Tool Menu. This option creates a new worksheet to each contractor input file that is loaded. The title of the worksheet is the parameter name. The name cannot contain spaces, $, !, @, %, ^, &, or *. The user must enter the data in the newly added worksheet and restart the software for the changes to take effect.
Entering New Project Information: In the Project Information dialog box shown in Figure C.1.
Enter the name of your project. Enter the state project number. Enter the trunk highway number. Determine the project date: month, day, and year. Select the type/s of project. Select project location/s to be included in the calculations.

C-4
Figure C-1 Project Information Window
Adding a New Project Type: Input menu > Project Information.
Work Type text group > Add/Delete Types.
Type the name of the new type > Add New (Figure C.2).

C-5
Figure C-2 Edit Types Window
Adding a New Location: Input menu > Project Information.
Location text group > Add/Delete Types.
Type the name of the new location > Add New (Figure C.3).
Figure C-3 Edit Location Window

C-6
SETTING MNCAST OPTIONS: Before getting any further in developing a new project, one should set the options for the software. Two types of options are available: General Settings and comparison options.
General Settings: Parameter Direction Settings:
Tools menu > Settings.
Parameter Direction tab (Figure C.4) > double click any parameter from the list to change its value desired between minimum and maximum.
Figure C-4 Parameter Settings in Options Window
Project Location Code Settings: Tools menu > Settings.
Project Location tab (Figure C.5) > select the desired location and update code in the dropdown list.

C-7
Figure C-5 Project Location Code Settings in Option Window
Project Type Code Settings: Tools menu > Settings.
Project Type Code (Figure C.6) > select the desired type and update code in the dropdown list.
Figure C-6 Project Type Code Settings in Option Window

C-8
Quality Settings: Tools menu > Settings.
Quality Settings (Figure C.7) > select the work type from drop down list > double click any quality sub-category to include/not include it.
Figure C-7 Quality Settings in Option Window
Output Settings: Tools menu > Settings.
Check the box of desired output setting (Figure C.8).
Figure C-8 Output Settings in Option Window

C-9
Comparison Options: Figure 4.1 shows how parameters are scaled. This figure shows the relationship between scale and bid price. As an example, consider Bid Price. Here, bids less than $3.6 million are given a scaled score of 100 (or > 100 if the bonus option is selected). Likewise, bids greater than $4 million are given a scaled score of 0. Bids falling in between these two reference points will receive a proportional scaled score.
To set these reference points, use the Comparison Options menu shown in Figure C.9.
Tools menu > Comparison Options.
Figure C-9 Comparison Options Window
The user is presented with two options
1. Compare contractor with other contractors bidding on this project 2. Compare each contractor with the population
Compare Contractor with other Contractors Bidding on this Project
This option uses only the data from the bidding contractors to find the reference points. Following the same example of bid price the “100 Reference Point” is taken as the minimum bid

C-10
among contractors. The maximum bid is automatically given a scaled score of 50. The “0 Reference Point” is then extrapolated using the 50 & 100 reference points.
Compare Contractor with other Contractors Bidding on this Project This option uses all loaded data to calculate the user-defined percentile for each parameter. The default is the 90th percentile for the “100 Reference Point” and the 10th percentile for the “0 Reference Point”. This option only applies to random parameters (i.e. all parameters in the input files). Consider IRI, for example. If this option is selected and the 90th percentile is chosen as the “100 Reference Point”, the software will find the point (% Rejected) at which only 10% were better. To calculate this value, all projects matching the given work type and location from all contractors loaded into the software are used.
Individual parameter reference points can be changed by double clicking the parameter and clicking the update button with the appropriate value.
Building Contractor Data Base Loading Contractor File:
File menu > File Manager.
Browse for the contractor file name > Add.
Click Done.
Selecting Competing Contractors: In the Select Contractors dialogue box, all contractors that already in the database will appear in the left hand side widow. To select a contractor to compete in the current project:
Input menu > Contractor Information.
Select the desired contractor from the left side list as shown in Figure C.10.
Enter the applicable contractor offer values (i.e. Bid Price, Lane Rental and Warranty) in the corresponding text box > Add/Replace Button.

C-11
Figure C-10 Select Contractors Window
Removing a Contractor from Bidding List: To remove a contractor from the bidding list:
Input menu > Contractor Information.
Select the desired contractor form the right hand side list.
Click Remove
Creating a New Contractor to the Bidding List: Creating New Contractor will create an empty excel file for the contractor. Within the new file, a worksheet exists for each parameter. Upon completion of the following steps, the user must enter the contractor’s data in the newly created file (see Figure C.11):
Tool menu > Create New Contractor.
Enter the Contractor name.
A message will notify the successful addition of the new contractor.
Figure C-11 New Contractor Window

C-12
Managing Project Parameters
Entering Parameter Information In the Select Parameter dialog box, all Parameters that already exist in the database will appear in the left hand side widow. To include a parameter in the Best-Value analysis:
Input menu > Parameter Information.
Select the Parameter from the left hand side list in Figure C.12
Assign the preferred weight of the parameter in Weight (%) text box
Click Add/Replace Button to consider the parameter with the specified weight. The selected parameter and its weight will appear in the list view (right side).
The remaining weight appears above Weight (%) test box, as the summation of all weights should be equal to 100%.
Figure C-12 Select Parameters Window

C-13
Eliminating a Parameter from Selection Criteria: To remove a parameter from the selection criteria;
Input menu > Parameter Information.
Select the desired Parameter form the right hand side list.
Click Remove.
Creating a New Parameter: This option will create a new worksheet in each contractor file that is currently loaded. To add a new Parameter to the Parameter List:
Tool menu > Create New Parameter.
Enter the name of the new parameter as in Figure C.13.
Select upper limit value of the new parameter to be the maximum or the minimum parameter value.
A message will notify the successful addition of the new contractor
Figure C-13 New Parameter Window
Calculating project Best-Value
Calculating Best-Value: Based on the past record, MNCAST calculates the Best-Value for prospective contractors. This will show the owner which contractor offers the Best-Value for the money spent on the project.
Using MNCAST to Calculate Best-Value: Output menu > Best-Value
This will open the “Best-Value” window. The top of the window shows general information about the current project. The bottom portion contains three options: Summary of Results, Details of Results, and Input Data.

C-14
Best-Value Results: To display the calculated Best-Value for the current project
Output menu > Best-Value
Click Summary of Result from the tree view as in Figure C.14
Best-Value calculation for the bidding contractors appears in the output list view
1st column represents the contractor name 2nd column contains the calculated Best-Value. 3rd column represents the discrete portion of Best-Value for the parameters that does not
depend on past records but instead on values entered by the user (i.e. bid price, lane rental, and warranty).
4th column represents the random portion of the Best-Value that includes the average parameter scores taken from the contractor input files (i.e. rejected claims, rejected quality…).
5th column represents the 95% confidence intervals for the random portion. Higher confidence intervals indicate high construction variability.
6th column represents the probability of being best in the population of loaded contractors. This probability is calculated by summing the probabilities of each random parameter and multiplying it by the parameter’s weight. Probabilities are based on the normal distribution, the contractor’s mean, the population mean, and the population standard deviation.
7th column represents the probability of being the best in the sample. These probabilities are calculated by summing the individual probabilities of each parameter. The p-value (1-tailed) obtained from the multiple comparisons of each contractor in the normal distribution are used as the probabilities.
Figure C-14 Summary of Results in Best-Value Results Window

C-15
Ranking Contractors: To put the contractor in order of the best to the worst for one of the six columns, click on the head of the desired column head.
Best-Value Calculation Details: To display a detailed calculation results of Best-Value for a selected contractor;
Output menu > Best-Value
Click Details of Results from the left hand side list > Contractor name as shown in Figure C.15.
The right hand side list will show weight, score, and scaled score for each parameter for the selected contractor.
Figure C-15 Details of Results in Best-Value Results Window
Recorded Data View: MNCAST allows further investigation of the contractors’ recorded data for different parameters. To view the data stored in each contractor’s excel file:
Output menu > Best-Value
Click Input Data from the left hand side list > Contractor name> Parameter name as shown in Figure C.16.
The right hand side list will show details of the recorded data.

C-16
Figure C-16 Input Data in Best-Value Results Window
Print a Summary Report: To print a summary report and/or export the results to an Excel sheet;
Output menu > Best-Value > Print and Export
MNCAST Software Capabilities: MNCAST helps in selecting the best contractor through the concept of Best-Value using one or more parameters in the contractor selection process. MNCAST uses records relevant to specific project type and location.
MNCAST Functionality: The following sections will show what can be done using each menu exists in the software.
File Menu: Creating a New project file. Opening an existing project file. Saving the created project for future review. Modifying an existing project’s parameters and/or weights then Save As a new project
name. Loading contractor’s input files using File Manager. Adding/Deleting/Creating New contractor input file using File Manager.
Input Menu:
1. Project Information window: Reading Project Information:

C-17
Project name. State Project number, S.P. Trunk Highway number, T.H. Letting date. Past record years limit
Considering the project as a multi type project by including more than one work type. Considering the project as multi location project by including more than one project
location. Adding/Deleting work types Help selecting the best contractor for the job through the concept of Best-Value. Use one or more parameters in the contractor selection process. Use records relevant to specific project type and location Renaming an existing work type. Adding/Deleting project locations. Renaming an existing project location.
2. Contractor Information window: Selecting desired contractors from the list of loaded contractor input files. Entering each contractor values for: Bid Price. Lane Rental cost. Warranty years. Removing wrong entry and re-enter it again.
3. Parameter Information window: Selecting suitable parameters, from parameter list, to be included as a contractor selection
criteria. Removing wrong entry from Parameter Considered in BV list. Showing the equation of the selected parameter. Considering parameter weights by one of the following:
o Using Questionnaire to formulate the Engineering opinion of relative importance into a parameter weight using one of the following methods:
Weighted Average Method (WAM) Analytical Hierarchal Process (AHP)
o Directly entering the desired weight Considering more than one engineer opinion in the questionnaire. Showing the remaining weight after each parameter entry and redistribute it in case of
closing window without entering a parameter having this weight. Showing a parameter-weight entry list.
Output Menu: Best-Value window:
Showing the calculated Best-Value for contractors and sorting them from best to worst. Showing values of:
Discrete portion Random portion 95% confidence

C-18
Probability of being best in population Probability of being best in sample
Showing the details of results for each contractor for; Parameter weight. Parameter score. Scaled score. Showing the input data for each contractor’s parameter. Exporting Best-Value project result to Excel File. Printing a summary report of the results.
Tools Menu:
Create new questionnaire window: Choosing between creating AHP or WAM questionnaire. Selecting the number of respondent of the questionnaire.
Create new contractor Creating a new contractor input file with the available parameters.
Create new parameter window: Creating a new parameter in the system to be used as a contractor selection criterion. Assigning the desired value to maximum or minimum parameter value.
Comparison options window: Choosing between comparing the contractor to the contractors in the same project only or
to the population-specific percentile. Calculating the acceptable limits for a parameter from the population using a user-defined
percentile values. Letting user to enter his acceptable limit.
Settings window: Setting a code for each parameter. Setting a code for each project location Selecting the desired tests to be included as a sub-component of quality parameter. Allowing bonus to be considered in BV calculations. Assigning the desired maximum or minimum parameter value. Selecting to show the statistics in the output
Help Menu: Displaying the help on all the topic and terms used throughout the software. Providing an index for the most important items. Displaying a “What is this?” help in each menu for a quick help.

APPENDIX D
SOFTWARE TRAINING PRESENTATION

D-1
MN DOT CONTRACT 88127
BEST VALUE BASED ON PERFORMANCE
Task Four MNCAST Software Development
BYTHE RESEARCH TEAM
OF NORTH DAKOTA STATE UNIVERSITY
July 23, 2007
MNCAST Software
• Is a tool developed for MnDOT to help in contractor selection process.
• Uses MnDOT and the contractors records as inputs.
Software Capabilities-1
• Help selecting the best contractor for the job through the concept of Best-Value.
• Use one or more parameters in the contractor selection process.
• Use records relevant to specific project type and location

D-2
MNCAST Flow Chart-1
MNCAST Flow Chart-2
MNCAST Functionality

D-3
“File Menu”-1
• Creating a New project file.• Opening an existing project file.• Saving the created project for future
review.• Modifying an existing project’s
parameters and/or weights then Save As a new project name.
“File Menu”-2
• Loading contractor’s input files using File Manager.
• Adding/Deleting/Creating New contractor input file using File Manager.
Demo

D-4
“Input Menu>Project Information”-1
• Reading Project Information; – Project name.– State Project S.P.#– Trunk Highway T.H.#– Letting date.– Past record years limit.
“Input Menu>Project Information”-2
• Considering the project as a multi type project by including more than one work type.
• Considering the project as multi location project by including more than one project location.
• Adding/Deleting work types
“Input Menu>Project Information”-3
• Renaming an existing work type.• Adding/Deleting project locations.• Renaming an existing project
location.

D-5
Demo
“Input Menu>Contractor Information”
• Selecting desired contractors from the list of loaded contractor input files.
• Entering each contractor values for:• Bid Price.• Lane Rental cost. • Warranty years.
• Removing wrong entry and re-enter it again.
Demo
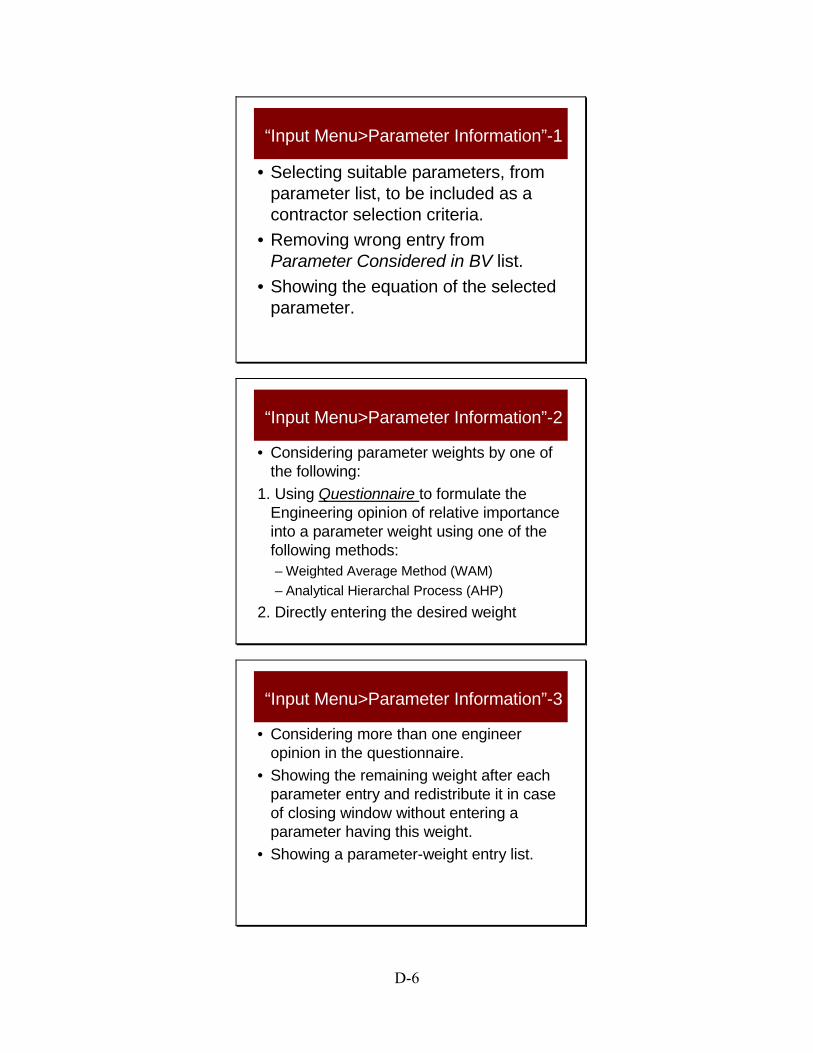
D-6
“Input Menu>Parameter Information”-1
• Selecting suitable parameters, from parameter list, to be included as a contractor selection criteria.
• Removing wrong entry from Parameter Considered in BV list.
• Showing the equation of the selected parameter.
“Input Menu>Parameter Information”-2
• Considering parameter weights by one of the following:
1. Using Questionnaire to formulate the Engineering opinion of relative importance into a parameter weight using one of the following methods:– Weighted Average Method (WAM)– Analytical Hierarchal Process (AHP)
2. Directly entering the desired weight
“Input Menu>Parameter Information”-3
• Considering more than one engineer opinion in the questionnaire.
• Showing the remaining weight after each parameter entry and redistribute it in case of closing window without entering a parameter having this weight.
• Showing a parameter-weight entry list.

D-7
Demo
“Output Menu>Best Value”-1
• Showing the calculated Best-Value for each contractor and sort them best to worst.
• Showing values of:– Discrete portion – Random portion– 95% confidence – Probability of being best in population– Probability of being best in sample
“Output Menu>Best Value”-2
• Showing the details of results for each contractor for;
• Parameter weight.• Parameter score.• Scaled score.
• Showing the input data for each contractor’s parameter.

D-8
“Output Menu>Best Value”-3
• Exporting Best-Value project result to Excel File.
• Printing a summary report of the results.
Demo
“Tools Menu>Create new questionnaire”
• Choosing between creating AHP or WAM questionnaire.
• Selecting the number of respondent of the questionnaire.

D-9
Demo
“Tools Menu>Create new contractor”
• Creating a new contractor input file with the available parameters.
“Tools Menu>Create new parameter”
• Creating a new parameter in the system to be used as a contractor selection criteria.
• Assigning the desired value to maximum or minimum parameter value.

D-10
“Tools Menu>Comparison options”
• Choosing between comparing the contractor to the contractors in the same project only or to the population-specific percentile.
• Calculating the acceptable limits for a parameter from the population using a user-defined percentile values.
• Letting user to enter his acceptable limit.
Demo
“Tools Menu>Settings”-1
• Setting a code for each parameter.• Setting a code for each project
location• Selecting the desired tests to be
included as a sub-component of quality parameter.
• Allowing bonus to be considered in BV calculations.

D-11
Demo
“Tools Menu>Settings”-2
• Assigning the desired value to the maximum or minimum parameter value.
• Selecting to show the statistics in the output or not.
“Help Menu>Settings”
• Displaying the help on all the topic and terms used through out the software.
• Providing index for the most important terms.
• Displaying a “What is this?” help in each menu for a quick help.

D-12
Software Updating Capabilities
–MnDOT records as input files–Flexibility in inputs selection–Use statistics