best practices to support and improve pavement management
TRANSCRIPT

Applied Research and Innovation Branch
BEST PRACTICES TO SUPPORT AND IMPROVE PAVEMENT MANAGEMENT SYSTEMS FOR LOW-VOLUME PAVED
ROADS-PHASE I
Marwan Hafez, M.S.
Khaled Ksaibati, Ph.D., P.E.
Rebecca Atadero, Ph.D., P.E.
Report No. CDOT-2018-03
February 2018

The contents of this report reflect the views of the author(s), who is(are) responsible for the facts and accuracy of the data presented herein. The contents do not necessarily reflect the official views of the Colorado Department of Transportation or the Federal Highway Administration. This report does not constitute a standard, specification, or regulation.

Technical Report Documentation Page 1. Report No.
CDOT-2018-03 2. Government Accession No.
3. Recipient's Catalog No.
4. Title and Subtitle
BEST PRACTICES TO SUPPORT AND IMPROVE PAVEMENT MANAGEMENT SYSTEMS FOR LOW-VOLUME PAVED ROADS – PHASE I
5. Report Date
February 2018 6. Performing Organization Code
7. Author(s) Marwan Hafez, Khaled Ksaibati, Rebecca Atadero
8. Performing Organization Report No.
9. Performing Organization Name and Address Colorado State University Fort Collins, CO, 80523
10. Work Unit No. (TRAIS)
11. Contract or Grant No.
12. Sponsoring Agency Name and Address Colorado Department of Transportation - Research 4201 E. Arkansas Ave. Denver, CO 80222
13. Type of Report and Period Covered
Final 14. Sponsoring Agency Code 415.01
15. Supplementary Notes Prepared in cooperation with the US Department of Transportation, Federal Highway Administration
16. Abstract The Colorado Department of Transportation (CDOT) has been trying to identify the most effective methods for managing low-volume roads (LVRs). These roads are facing multiple challenges including: reductions in maintenance budgets, impact of industrial activities, and potentially not receiving the most cost effective treatments. Considerable savings can be secured by implementing an effective and informed management system for all LVRs engineering issues, including: planning, design, and maintenance. This report documents current national and local practices and investigates treatment policies that are in place on LVRs by summarizing the results of multiple surveys. Four online surveys were sent to the TRB low-volume roads committee, eight state DOTs, local governments in Colorado, and the material advisory committee in the CDOT. Seventy-one transportation agencies and individuals responded to the survey. The findings of this study provide CDOT and transportation agencies nationwide with comprehensive guidelines and state-of-the-practice information for managing LVRs. These guidelines include information about defining low-volume paved roads and types of PMS data recommended on these roads. It also gives insight about the effectiveness of some of treatment strategies applied to LVRs by different states at different management levels. The participants emphasized the need for some innovative maintenance activities for LVRs and integrating optimization techniques. A comprehensive literature review is introduced showing the most commonly applied treatments and new technologies for maintaining LVRs. This report is a useful reference to present key planning, design, and maintenance that are successfully meeting LVRs management needs. Implementation
The results of this synthesis report are used to inform the second phase of the project studying CDOT maintenance strategies for low-volume roads.
17. Keywords
Low-Volume Roads; Pavement Management System; Pavement Maintenance; State Maintenance Strategies
18. Distribution Statement
This document is available on CDOT’s website http://www.coloradodot.info/programs/research/pdfs
19. Security Classif. (of this report)
Unclassified 20. Security Classif. (of this page)
Unclassified 21. No. of Pages
203 22. Price
Form DOT F 1700.7 (8-72) Reproduction of completed page authorized

iii
Acknowledgements
The authors of the report gratefully acknowledge the guidance and assistance provided by the study
panel leaders: Gary DeWitt, CDOT Region 4 Materials and Stephen Henry, CDOT Materials and
Geotechnical Branch; and the study panel members: Bob Mero, CDOT Region 1 Materials,
Michael Stanford, CDOT Materials and Geotechnical Branch, Jay Goldbaum, CDOT Materials
and Geotechnical Branch, Tyler Weldon, CDOT Division of Highway Maintenance, and Donna
Harmelink, FHWA Colorado Division.

iv
Executive Summary
The Colorado Department of Transportation (CDOT) has been trying to identify the most effective
methods for managing low-volume roads (LVRs). These roads are facing multiple challenges
including: reductions in maintenance budgets, impact of industrial activities, and potentially not
receiving the most cost effective treatments. Considerable savings can be secured by implementing
an effective and informed management system for all LVRs engineering issues, including:
planning, design, and maintenance. This report documents current national and local practices and
investigates treatment policies that are in place on LVRs by summarizing the results of multiple
surveys. Four online surveys were sent to the TRB low-volume roads committee, eight state DOTs,
local governments in Colorado, and the material advisory committee in the CDOT. The surveys
included questions that focused on the pavement management system (PMS) specifications
recommended for only low-volume paved roads. Seventy-one transportation agencies and
individuals responded to the survey. The findings of this study provide CDOT and transportation
agencies nationwide with comprehensive guidelines and state-of-the-practice information for
managing LVRs. These guidelines include information about defining low-volume paved roads
and types of PMS data recommended on these roads. It also gives insight about the effectiveness
of some of treatment strategies applied to LVRs by different states at different management levels.
The participants emphasized the need for some innovative maintenance activities for LVRs and
integrating optimization techniques. This report provides an independent review of PMS initiatives
for roads at the local level. A comprehensive literature review is introduced showing the most
commonly applied treatments and new technologies for maintaining LVRs. This report is a useful
reference to present key planning, design, and maintenance that are successfully meeting LVRs
management needs.

v
Table of Contents
Chapter 1: Introduction ......................................................................................................... 1
1.1 Objectives ................................................................................................................. 3
1.2 Background .............................................................................................................. 3
1.2.1 Funding Levels.......................................................................................................... 4
1.2.2 Data Availability ....................................................................................................... 5
1.2.3 Safety-Related Issues ................................................................................................ 5
1.3 Summary .................................................................................................................. 5
Chapter 2: Literature Review ................................................................................................ 7
2.1 Low-Volume Roads Definition ................................................................................ 7
2.2 Types of Low-Volume Road Surfaces ................................................................... 10
2.2.1 A Framework for Selecting the Appropriate Road Surface .................................... 11
2.3 Low-Volume Roads Pavement Design Methods ................................................... 21
2.3.1 AASHTO Design Procedure ................................................................................... 23
2.3.2 United States Army Corps of Engineers (USACE) Procedure ............................... 26
2.3.3 National Crushed Stone Association (NCSA) Procedure ....................................... 27
2.3.4 Asphalt Institute Procedure ..................................................................................... 28
2.3.5 States Design Procedure ......................................................................................... 28
2.4 Pavement Maintenance and Preservation on Low-Volume Roads ........................ 34
2.4.1 Introduction ............................................................................................................. 34
2.4.2 Pavement Preservation ............................................................................................ 36
2.4.3 Types of Preventive Maintenance ........................................................................... 37
2.4.4 Pavement Structural Rehabilitation and Reconstruction ........................................ 48
2.4.5 States Maintenance Strategies for Low-Volume Paved Roads............................... 49
2.5 Current Low-Volume Road Engineering Practices ................................................ 55
2.5.1 Practices for Long-Lasting Low-Volume Pavements ............................................. 55

vi
2.5.2 Low-Volume Roads Engineering Best Management Practices Field Guide .......... 58
2.5.3 Previous Management Efforts for Local Agencies ................................................. 61
2.6 Summary ................................................................................................................ 62
Chapter 3: Pavement Management System Survey on Low-Volume Paved Roads ....... 65
3.1 Introduction ............................................................................................................ 65
3.2 Survey Methodology .............................................................................................. 65
3.2.1 TRB Low-Volume Committee Members Survey ................................................... 66
3.2.2 Regional Departments of Transportation Survey ................................................... 67
3.2.3 Colorado Local Governments Survey ..................................................................... 67
3.2.4 CDOT MAC Committee Members Survey ............................................................ 68
3.3 Survey Sections ...................................................................................................... 70
Chapter 4: Survey Data Analysis ........................................................................................ 72
4.1 Section 1: Low-Volume Paved Road Definition .................................................... 72
4.2 Section 2: Data Collection & Inspection Survey .................................................... 74
4.3 Section 3: Treatment Strategies .............................................................................. 79
4.4 Section 4: Resources Optimization ........................................................................ 85
4.5 CDOT’s Policy on Low-Volume Paved Roads ...................................................... 87
Chapter 5: Conclusions ........................................................................................................ 89
5.1 Literature Conclusions ........................................................................................... 89
5.2 Surveys Conclusions .............................................................................................. 91
Chapter 6: Recommendations to Colorado DOT .............................................................. 95
References .................................................................................................................................... 98
Appendix A-1: TRB Low-Volume Committee AFB30 Survey ............................................. 106
Appendix A-2: TRB Low-Volume Committee AFB30 Responses ....................................... 114
Appendix B-1: Regional Departments of Transportation Survey ........................................ 125
Appendix B-2: Regional Departments of Transportation Responses .................................. 136
vii
Appendix C-1: Colorado Local Governments Survey ........................................................... 148
Appendix C-2: Colorado Local Governments Responses ..................................................... 162
Appendix D-1: Colorado Department of Transportation Material Advisory Committee Survey......................................................................................................................................... 177
Appendix D-2: Colorado Department of Transportation Material Advisory Committee Responses ................................................................................................................................... 184

viii
List of Figures
Figure 1.1: 2002-11 Highway and Transit Spending by Level of Government (The Pew Charitable
Trusts, 2014) ................................................................................................................................... 4
Figure 2.1: Highway Ownership by Level of Government (Mozaffarian et al., 2015) .................. 9
Figure 2.2: Types of Road Surface; (a) Paved "Asphalt" Road; (b) Unpaved "Gravel" Road ..... 10
Figure 2.3: Road Cumulative Maintenance Costs of Different Surface Types (Rukashaza-Mukome
et al., 2003) ................................................................................................................................... 15
Figure 2.4: Factors for Converting Vehicle Operating Costs from HMA sections to Gravel Roads
(Zimmerman and Wolters, 2004) .................................................................................................. 19
Figure 2.5: Schematic Profile of (a) High-Volume Road; (b) Low-Volume Road Pavement (Brito,
2011) ............................................................................................................................................. 22
Figure 2.6: AASHTO Design Nomograph (AASHTO, 1993) ..................................................... 25
Figure 2.7: Flexible Pavement Design Curve for Roads and Streets (USACE, 1992) ................. 27
Figure 2.8: Relationship between Pavement Performance and Repairing Costs (Shahin and Walter,
1990) ............................................................................................................................................. 35
Figure 2.9: Performance Models vs. Trigger Values for Treatments (Smith, 2002) .................... 36
Figure 2.10: Pavement Preservation Concept (NPS, 2014) .......................................................... 37
Figure 2.11: Crack Sealing of Flexible Pavement (Wilde et al., 2014) ........................................ 38
Figure 2.12: Applying a Chip Seal Layer on a Paved Road (Hafez, 2015) .................................. 39
Figure 2.13: Single Chip Seal (Caltrans, 2003) ............................................................................ 40
Figure 2.14: Double Chip Seal (Caltrans, 2003)........................................................................... 40
Figure 2.15: The Difference of Aggregate Gradations between (a) a Single Chip Seal, and (b) a
Single Otta Seal (Overby and Pinard, 2007) ................................................................................. 41
Figure 2.16: Applying and smoothing a Slurry Seal layer on the Surface (LA County, 2017a) .. 42
Figure 2.17: Application of Microsurfacing ................................................................................. 43

ix
Figure 2.18: Cold In-Place Recycling Train (LA County, 2017b) ............................................... 44
Figure 2.19: Thin Bonded Wearing Course Application (Wilde et al., 2014) .............................. 45
Figure 2.20 Nevada DOT Rehabilitation Strategies for Low-Volume Roads (Hoffman, 2008) .. 51
Figure 2.21: MNDOT Decision Tree for the Proposed Rehabilitation Strategies (Jahren et al.,
2016) ............................................................................................................................................. 53
Figure 2.22: The Environmental Impact of Two Alternatives during Planning (Keller and Sherar,
2003a) ........................................................................................................................................... 59
Figure 2.23: The Impact of Drainage Design. (a) A poorly drained road with rutting and erosion
problems; (b) An armored road surface with positive surface drainage using rolling dips (Keller
and Sherar, 2003b) ........................................................................................................................ 60
Figure 2.24: A low-water crossing with an armored roadway surface in need of additional
downstream scour protection (Keller and Sherar, 2003b) ............................................................ 61
Figure 3.1: Surveys on PMS of Low-volume Paved Roads ......................................................... 66
Figure 3.2: Low-Volume Roads in CDOT Regions (Atadero and Ksaibati, 2015) ...................... 70
Figure 4.1: ADT Distribution vs. Traffic Volumes for Low-Volume Paved Roads .................... 73
Figure 4.2: Pavement Management Data Collection for Low-Volume Paved Roads .................. 75
Figure 4.3: Recommended traffic data for managing low-volume paved roads (TRB Survey: Q6)
....................................................................................................................................................... 76
Figure 4.4: Recommended structural data for managing low-volume paved roads (TRB Survey:
Q7) ................................................................................................................................................ 77
Figure 4.5: Condition Indices Used for Low-Volume Paved Roads ............................................ 78
Figure 4.6: Data Collection Frequency of Pavement Condition Data .......................................... 79
Figure 4.7: Recommended Variables for a Decision Tree (TRB Survey: Q11) ........................... 80
Figure 4.8: Effectiveness of Eliminating Expensive Treatments on LVRs .................................. 81
Figure 4.9: Treatments Allowed on Low-Volume Paved Roads .................................................. 82
Figure 4.10: Expected Service Lives of Treatments Applied on LVRs (67 Responses) .............. 83

x
Figure 4.11: Effectiveness of Treatments on Severely Distressed Roads (65 Responses) ........... 84
Figure 4.12: Recommended Objectives in Optimization Strategies (51 Responses) ................... 86
Figure 4.13: Budget Assignments on Different Condition Levels (48 Responses) ...................... 87

xi
List of Tables
Table 2.1: Typical Distribution of Functional Systems .................................................................. 8
Table 2.2: Rural Roads Status in Developing Countries (Cook et al., 2013) ............................... 11
Table 2.3: Construction and Maintenance Costs for HMA Roadways ......................................... 17
Table 2.4: Construction and Maintenance Costs for Gravel Roadways ....................................... 17
Table 2.5: Construction and Maintenance Costs for Stabilized Gravel Roadways ...................... 17
Table 2.6: Construction and Maintenance Costs for Blotter Roadways ....................................... 18
Table 2.7: Standard Crash Costs (1990 dollars) (FHWA, 1999) .................................................. 19
Table 2.8: Pavement Design Index Versus Traffic load (USACE, 1992) .................................... 26
Table 2.9: Inputs Summary of Traffic and Soil Strength Criteria by Design Procedure for Low-
Volume Roads ............................................................................................................................... 33
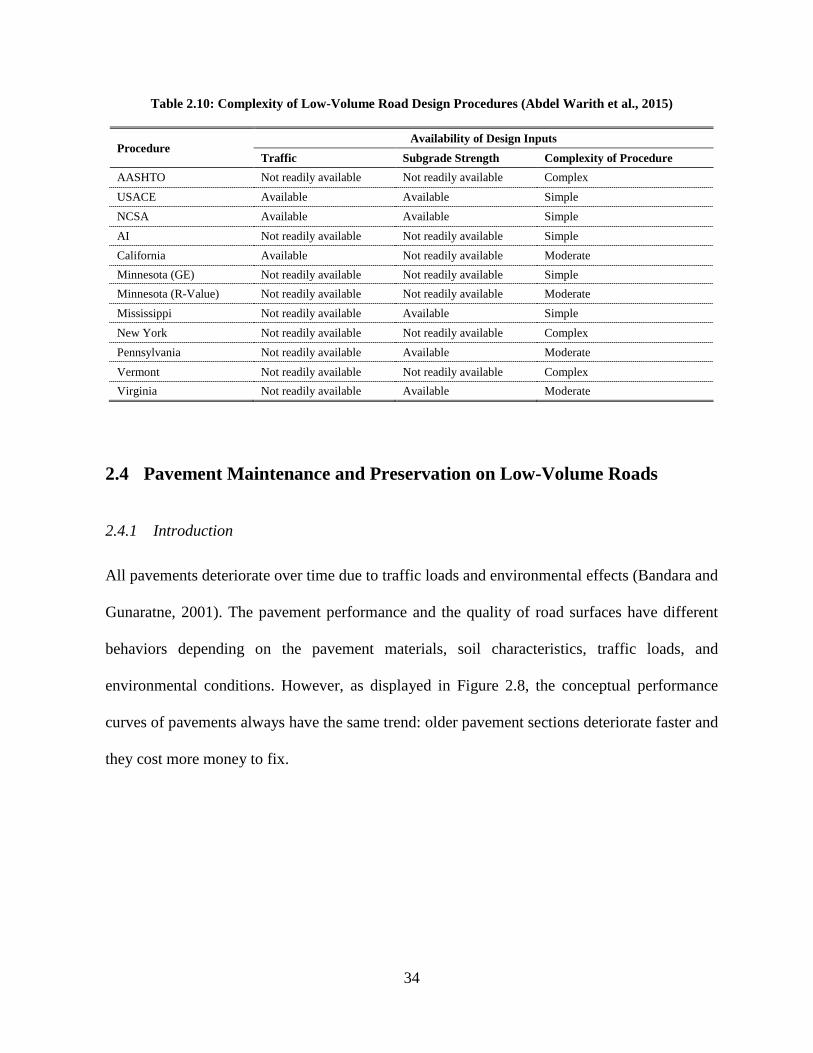
Table 2.10: Complexity of Low-Volume Road Design Procedures (Abdel Warith et al., 2015) . 34
Table 2.11: Expected Life Extension in Years of Various Treatments ........................................ 47
Table 2.12: Cost per Square Meter of Various Treatments .......................................................... 47
Table 2.13: Georgia DOT Surface Treatment Materials on Low-Volume Roads (GDOT, 2006) 50
Table 2.14: Georgia DOT Recommended Maximum and Minimum Layer Thickness (GDOT,
2006) ............................................................................................................................................. 50
Table 2.15: Iowa DOT Preliminary Treatment Selection Table (Yu et al., 2015) ....................... 55
Table 3.1: Pavement Treatment Types (Redd, 2013) ................................................................... 69
Table 4.1: Traffic Volume Consideration for Low-Volume Paved Roads (73 responses) ........... 72
Table 4.2: Truck Traffic Volume Consideration for Low-Volume Paved Roads (61 responses) 74

xii
List of Abbreviations
The following table describes the various abbreviations and acronyms used throughout the
report:
Abbreviation Description AASHO American Association of State Highway Officials AASHTO American Association of State Highway and Transportation Officials AC Asphalt Cement ADT Average Daily Traffic ADTT Average Daily Truck Traffic CBR California Bearing Ratio CDOT Colorado Department of Transportation CIR Cold In-Place Recycling CSU Colorado State University DL Drivability Life ESAL Equivalent Single Axle Load FDR Full-Depth Reclamation FHWA Federal Highway Administration FWD Falling Weight Deflectometer GDOT Georgia Department of Transportation HMA Hot-Mix Asphalt IDOT Iowa Department of Transportation IRI International Roughness Index LCCA Life-cycle Cost Analysis LVR Low-Volume Road M&R Maintenance and Rehabilitation MAC Material Advisory Committee MNDOT Minnesota Department of Transportation MR&R Maintenance, Rehabilitation, and Reconstruction MUTCD Manual on Uniform Traffic Control Device NCSA National Crushed Stone Association PASER Pavement Surface Evaluation Rating PCI Pavement Condition Index PCI Pavement Condition Index PMS Pavement Management System PSI Present Serviceability Index RSL Remaining Service life RUT Rut Depth SDDOT South Dakota Department of Transportation SSV Soil Support Value USACE United States Army Corps VSR Visual Inspection Rating WYDOT Wyoming Department of Transportation WYT2/LTAP Wyoming Technology Transfer Center/ Local Technical Assistance Program
1
Chapter 1: Introduction
Departments of Transportation (DOTs) face the challenge of maintaining the pavement condition
of a road network. Although pavement deterioration rates increase over time, the maintenance
financial resources are not raised accordingly. This challenge is more critical for low-volume
roads (LVRs) which are managed under the supervision of state DOTs and local agencies. Most
federal aid supports state highway agencies to improve the condition of national highways
(NHS). The Moving Ahead for Progress in the 21st Century Act (MAP-21) established
performance targets for the NHS which includes Interstates and state highways carrying
relatively high traffic volumes. All state DOTs are required to integrate a risk-based Pavement
Management System (PMS) for their primary national highways to achieve the desired pavement
performance (Title 23 U.S.C. §303 (a), 2011). There is no legal requirement to implement a
typical pavement management system on county and local roads since there are no specific
performance targets. More flexibility was given to state and local governments in determining
their needs, especially considering the modest maintenance budgets allocated for LVRs.
Unlike high volume roads, state and local agencies are interested in developing lower-cost
pavement rehabilitation and surface treatments on their LVRs for two reasons. The first reason
is that agencies are trying to enhance the overall weighted serviceability of the LVRs network
with the available limited resources. The second reason is that most deteriorated low-volume
roads usually suffer from non-load-related distresses caused by environmental factors, thus the
pavement preservation strategy would have priority compared to the structural enhancement of
pavements.
2
It was recently realized by pavement engineers and researches that considerable savings
can be obtained by implementing an effective and informed management system for all LVRs
engineering issues, including: planning, design, and maintenance. Several states have been
making efforts to research, investigate, and adopt specific polices for their LVRs according to
their local objectives. Decision makers and road asset managers need access to the available
knowledge on good practice regarding the construction and maintenance of LVRs. This report
documents the best practices that have been employed among various U. S. agencies. In 2016,
Colorado State University (CSU) and the Wyoming Technology Transfer Center/Local
Technical Assistance Program (WYT2/LTAP) started a research project on evaluating practices
applied to build a pavement management system for low-volume roads. As part of this project,
multiple surveys were developed, distributed, collected, and then analyzed to investigate the most
common and effective practices in managing low-volume paved roads. On average, 26 questions
in each survey were disseminated to 73 agencies representing state DOTs, expert engineers, and
local governments. The results of the surveys are summarized in this report which focuses only
on the management of low-volume paved roads. The pavement management program for LVRs
is recommended to integrate the most appropriate pavement treatment techniques resulting in
better performance of the network. In addition, a comprehensive literature review is included in
this report to highlight and discuss the most commonly applied engineering techniques and new
technologies on LVRs. This report should be a useful reference to present key planning, design,
and maintenance issues affecting LVRs.

3
1.1 Objectives
The primary objective of this report is to assist CDOT and other transportation agencies in
identifying the best practices and techniques that can enrich their capabilities to manage,
maintain, and improve LVRs. This report aims to achieve the following:
1. Provide an independent review of pavement management practice initiatives for LVRs,
2. establish state-of-the-practice information on structural data required for design of
LVRs,
3. define common practices of data collection and pavement survey,
4. identify effective polices in various states that are in place on LVRs,
5. evaluate current strategies in optimizing available resources,
6. identify pavement treatments resulting in efficiencies in budgeting and construction
efforts, and
7. highlight innovative techniques that are successfully meeting agency needs.
1.2 Background
There are considerable challenges when it comes to managing low-volume roads. Some
challenges are related to unpaved surfaces while others are related to low-volume paved roads.
There are additional challenges beyond managing the pavement infrastructures such as traffic
engineering and safety-related issues.
When managing high volume pavements, there are plenty of experience, training, materials
and resources available. However, LVRs have limited resources and lower priority when it comes
to allocating funding. Consequently, LVRs fall into poor condition and need reconstruction and

4
improvements around the world (Coghlan, 2000). Some of the major challenges facing LVRs are
described below.
1.2.1 Funding Levels
Funds are considered the most important issue associated with managing and maintaining LVRs.
According to data from the U.S. Office of Management and Budget and the U.S. Census Bureau,
the investment for maintaining transportation surfaces is declining in recent years. Figure 1.1
shows the amount of decline in spending for state, local, and federal surface transportation from
2002 to 2011.
Figure 1.1: 2002-11 Highway and Transit Spending by Level of Government (The Pew Charitable Trusts, 2014)
Local spending fell by 7 percent adjusted for inflation (The Pew Charitable Trusts, 2014).
In addition, the amount of spending by localities (e.g., municipalities, counties, and local
transportation authority) comprises 36 percent of the total spending on surface transportation.
This funding should be invested so that higher return can be achieved. Most federal aid and
support focuses mainly on Interstate roads and national highways. LVRs have low-effective
returns. They cannot compete with the return of higher-speed roadways and higher traffic volume
transportation facilities. Therefore, the limited funding for low-volume roads affects the

5
sufficiency of appropriate construction and maintenance. As a consequence, the LVRs continue
to deteriorate annually, resulting in overall poor conditions and lower-performance levels.
1.2.2 Data Availability
LVRs have significant shortage of inventory, traffic, condition, structural, and performance data.
Local governments and municipalities suffer from difficulty in allocating the funds required for
building a management system in addition to a lack of expertise. In many cases, the construction
data history and drawings of LVRs have been lost or never existed. As a result, low-volume road
networks have incomplete data. The roadway management officials don’t have a clear strategy
of maintaining and enhancing the LVRs networks. They cannot demonstrate priorities, quantify
disinvestment, or support maintenance needs to the state legislatures. Therefore, investments and
funding justifications are inherently weak for LVRs. However, most state DOTs do not have
these issues and they include LVRs data in their pavement management databases.
1.2.3 Safety-Related Issues
LVRs experience safety-related issues for traffic. Along LVRs, some crash frequencies and
severities are strongly related to traffic volume. A study in the State of Iowa has shown that low-
volume local roads exhibit a high frequency of injury crashes compared to the primary roads
(Souleyrette et al., 2010). LVRs experience frequent crashes of fixed objects, rollover, and other
run-off-road crashes.
1.3 Summary
Although state DOTs are supported with federal aid for managing their national highways,
limited resources and funding are allocated for managing low-volume roads. This challenge is
more critical to local governments and municipalities which suffer from limited expertise,

6
budgets, and knowledge. In recent years, state and local agencies have dealt with considerable
challenges for managing LVRs, including: low funding levels, data shortage, and increasing
crash rates. As a result, good and informed management practices are highly required. This report
documents the best management practices that have been employed by summarizing the results
of multiple surveys sent to state DOTs, expert engineers, and local governments in Colorado.
These surveys provide evaluation of management techniques commonly applied on LVRs. Also,
they highlight recent and innovative technologies adopted to maintain pavement surfaces cost-
effectively. Further, a comprehensive literature review is included in this report showing main
LVRs engineering issues. This report should be a useful reference for Colorado DOT and other
transportation agencies to present key planning, design, and maintenance issues applicable to
LVRs.

7
Chapter 2: Literature Review
This chapter provides a comprehensive literature review about the definition of low-volume
roads and key points of LVRs design, maintenance, and rehabilitation. Surface treatments and
low-cost pavement rehabilitation are also introduced showing the most recent technologies
applied for surfacing and recycling. In addition, several PMS programs and studies were
reviewed to provide information on what other states have been doing to face LVRs management
challenges.
2.1 Low-Volume Roads Definition
Low-volume roads have relatively lower usage and occur in regions connecting remote areas
with local access and collector roads. Some agencies differentiate between urban low-volume
roads and from-farm-to-market rural low-volume roads. In rural areas, the roadways are generally
classified into four functional systems as follows (Male, 2014):
• Principal arterials – which are interstate roads, major federal and state highways linking
states and major population centers.
• Minor arterials – comprised of less traveled state and county highways linking smaller
cities and major towns.
• Rural collectors – which are major and minor collectors linking the smaller population
centers with the rural areas.
• Local roads – which are residential roads connecting the smaller communities and the
individual homes. They also connect business and farm roads to the surrounding
communities. Table 2.1 lists the typical distribution of traffic volumes on the different

8
functional systems in addition to the percentage of road miles compared to the total length
of network. It is obvious that local road systems account for a small percentage of the
total traffic volume. Yet, local roads represent the majority of road miles with a
percentage ranging from 65 to 80 percent.
Table 2.1: Typical Distribution of Functional Systems
Functional System
Range Traffic Volume (%) Length (%)
Principal arterial system 40-65 5-10 Principal arterial plus minor arterial street system 65-80 15-25 Collector road 5-10 5-10 Local road system 10-30 65-80
Source: A Policy on Geometric Design of Highways and Streets, American Association of State Highways and Transportation Officials, 2001
Based on traffic volumes, roads can be also classified into three categories: High-volume;
medium-volume; and low-volume roads. According to the Manual on Uniform Traffic Control
Devices (MUTCD), a low-volume road (LVR) is defined as a road carrying an Annual Average
Daily Traffic (AADT) less than 400 vehicles per day (MUTCD, 2009). LVRs cannot be any of
the following roadway facilities (MUTCD, 2009):
• A freeway
• An expressway
• An interchange ramp
• A freeway service road
• A road on a designated State highway system
• A residential street in a neighborhood
Low-volume roads constitute the vast majority of the United States road network. There
are about 73 percent of the public roads located in rural areas with populations less than 5,000

9
(Mozaffarian et al., 2015), and the total miles of low-volume roads represent approximately 70
percent of federal-aid road miles nationwide (Muench et al., 2004). Most of these roads are
owned by the local governments. The 2015 status of the nation’s highways shows that about 77%
of highway mileage nationwide are owned by the local governments, see Figure 2.1.
Figure 2.1: Highway Ownership by Level of Government (Mozaffarian et al., 2015)
Suitable LVRs classifications are important to provide the appropriate framework for
designing, managing, and maintaining these roads. In many countries, rural roads are classified
based on administrative or political criteria and not on the traffic volumes (Cook et al., 2013).
However, from an engineering viewpoint, a low-volume road should be designed to
accommodate not only the amount of traffic volume but also the types of vehicles travelling on
the road. There are questions about including more parameters in defining LVRs. For example,
oil and natural gas production involves heavy trucks which might have a greater effect on the
performance of pavements on LVRs. Industrial activities generate higher volumes of trucks.
Hence, LVRs should be defined with a limitation of truck volumes. Other parameters such as
design speeds and corresponding road geometry are also recommended to be considered.
19.0%3.7%
77.3%
Highway Mileage
State
Federal
Local
10
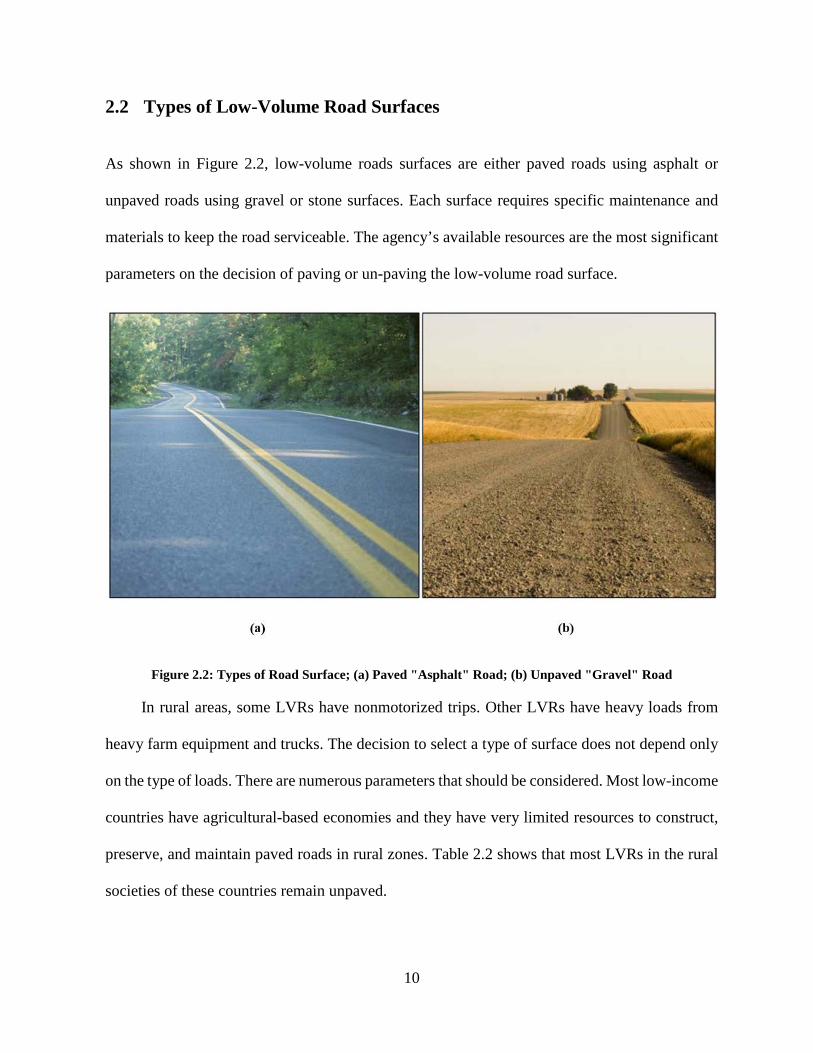
2.2 Types of Low-Volume Road Surfaces
As shown in Figure 2.2, low-volume roads surfaces are either paved roads using asphalt or
unpaved roads using gravel or stone surfaces. Each surface requires specific maintenance and
materials to keep the road serviceable. The agency’s available resources are the most significant
parameters on the decision of paving or un-paving the low-volume road surface.
Figure 2.2: Types of Road Surface; (a) Paved "Asphalt" Road; (b) Unpaved "Gravel" Road
In rural areas, some LVRs have nonmotorized trips. Other LVRs have heavy loads from
heavy farm equipment and trucks. The decision to select a type of surface does not depend only
on the type of loads. There are numerous parameters that should be considered. Most low-income
countries have agricultural-based economies and they have very limited resources to construct,
preserve, and maintain paved roads in rural zones. Table 2.2 shows that most LVRs in the rural
societies of these countries remain unpaved.

11
Previous research studies were conducted by agencies to find the appropriate decision as to
whether a road should be paved or unpaved. The decision-making process depends on a variety
of factors. Some of these factors were minutely discussed and others still need more investigation.
The following section provides a brief review of these considerations for the appropriate surface
type of LVRs.
Table 2.2: Rural Roads Status in Developing Countries (Cook et al., 2013)
Country/Region Rural Roads (mile) %Unsealed
Indonesia 180,819 46
Philippines 104,825 80
Cambodia 13,484 96
Lao PDR 13,484 85
Vietnam 80,778 82
Bangladesh 127,443 86
Mongolia 23,550 97
Kenya 23,220 94
SADC 254,762 95
2.2.1 A Framework for Selecting the Appropriate Road Surface
Any road should fulfill the objective of maximizing the benefits from applying a particular
surface type. The costs and benefits of the alternative surfaces are strongly influenced by the
maintenance practices which in fact vary significantly among agencies. Several documents
provide information on recommended maintenance practices for gravel roads (FHWA, 2015;
Bloser et al., 2012; Huntington and Ksaibati, 2010; AASHTO, 2007; Skorseth and Selim, 2005)
and paved roads (AASHTO 2007; Smith, 2006). It is commonly known that engineers rely on
the use of unsealed gravel roads as the default low-volume rural road (Cook et al., 2013) due to

12
its low initial cost and simplicity of construction. Then, different issues are studied on the
maintenance and sustainability of these roads. The decision of upgrading the default road depends
on three general terms: 1) Engineering factors, 2) Costs, and 3) Public opinion. These terms are
explained below.
2.2.1.1 Engineering Factors
Gravel and paved roads differ in many aspects, including construction, maintenance, drainage
systems, smoothness, and types of vehicles that can be accommodated (Kentucky Transportation
Center, 1988). The simplicity of constructing and maintaining gravel roads make the costs of
building unpaved roads low. However, gravel roads have more dust problems, lower operational
speed, and higher user costs. On the other hand, paved roads provide smoother surfaces, better
protection for both the subgrade and base layers, and more durable surfaces against adverse
weather and environmental conditions. However, paved roads require a comprehensive
management system and higher-quality materials to preserve the pavements in serviceable
conditions. Therefore, low-volume unpaved roads should be considered where the following
engineering characteristics are achieved:
1. The gravel quantities are available and the quality is adequate.
2. The road does not have steep gradients.
3. Low-traffic levels are expected on the road with lower speeds.
4. A practice for controlling dust and maintaining roads is guaranteed.
5. The surrounding environment is suitable where the rainfall rate is low to
moderate.
13
It is to be noted that unpaved roads should not only be a gravel road. There are other
surfacing types for unpaved roads, including dirt roads, earth or native soil roads, chemically
treated roads, and gravel roads (Huntington and Ksaibati, 2010). However, unpaved roads are
often referred to with the general term of a ‘gravel road’ which comprises appropriate and
sustainable granular aggregates in unsealed conditions. When the unpaved roads have
engineering problems, specific stabilization treatments are applied in which case the road is
called a ‘treated road’. The decision of paving the gravel road is taken by the officials to acquire
many objectives which include:
1. Accommodate heavier trucks and higher traffic volume
2. Eliminate summer dust and spring mud
3. Drain most of the water off the surface into ditches
4. Provide a smoother and safer ride
5. Improve vehicle and driver efficiency
2.2.1.2 Costs
Agencies should conduct Life-Cycle Cost Analysis (LCCA) on their roads since the available
funds, spent on the roadways, are decreasing in recent years (Figueroa et al., 2013). Many local
agencies cannot effectively make the decision of paving a gravel road because they do not have
enough information about the initial and maintenance costs of the different alternatives. Applying
an asphalt overlay is expensive. However, it does not require any expensive repairs as long as
the pavement is not highly deteriorated. On the other hand, the initial costs of gravel roads are
very low for a low-volume road. It may provide a cost-effective solution in an appropriate rural
environment. However, the costs of maintaining these roads should be analyzed. Gravel can be
lost from the road surface at more than 1.2 inch per year (Cook et al., 2013) so there is a need to

14
re-gravel the road frequently. Also, there are other costs required for the regular maintenance of
these roads, including grading, shaping, and dust control. These costs increase significantly when
the traffic volumes are relatively higher (MaineDOT, 2013).
Therefore, the costs associated with gravel and paved roads vary significantly. There is a
need to identify methods and costs of maintaining and upgrading gravel roads. However, many
state and local agencies do not track these costs. They found difficulties in estimating the life
cycle costs of the different maintenance practices. As noted in When to Pave a Gravel Road?
(Kentucky Transportation Center, 1988), agencies must determine the costs of maintenance for
all options before making the decision of paving the gravel road. These estimates enable the
agencies not only to compare between the different surfacing types, but also to determine the
appropriate time to change the surface type of the low-volume unpaved road. As shown in Figure
2.3, cost estimates for the routine maintenance of unpaved roads indicate that, at a specific time,
it is more cost-effective to apply asphalt rehabilitation on the surface. The cost of the
rehabilitation is significant, however, less money will be spent on the road in the future.

15
Figure 2.3: Road Cumulative Maintenance Costs of Different Surface Types (Rukashaza-Mukome et al., 2003)
In order to identify the appropriate surfacing decision, many research studies were
conducted to provide numerical analyses of the costs based on the spending history on low-
volume roads. South Dakota Department of Transportation (SDDOT) developed a software tool
that enables local officials to make a surfacing decision using an Excel-based program. The
decision can be made by comparing the costs associated with different surface types and the
available funding (Zimmerman and Wolters, 2004). In this software, cost analysis models were
developed for different surface types, including hot-mix asphalt (HMA), blotter, gravel, or
stabilized gravel. The total cost for each surface type derives from three main components which
are:
1. Initial costs
2. Annual maintenance costs

16
3. User costs
The models were developed using regression analysis of 95 roadway sections in South
Dakota and based on a 20-year analysis period. Local agencies can calculate all the associated
costs automatically, even though SDDOT provides a guideline to calculate the costs manually
using a technical brief provided with the report (Zimmerman and Wolters, 2004). Table 2.3 lists
the construction and maintenance costs determined for the HMA roadways. The costs are
dependent on the traffic volumes because it was found that ADT is a significant predictor in the
regression models. The estimated costs were based upon average costs of the roadway sections
collected during the study. It should be noted that all the costs were determined in 2003.
Therefore, all costs need to be adjusted by inflation when using those estimates. For unpaved
roads, the costs and frequencies of applying maintenance practices differ depending on whether
the road is a gravel or stabilized gravel road. Table 2.4 shows the costs for gravel roads that
derive from the initial construction or major rehabilitation, blading, and regravelling. For
stabilized gravel roads, application of dust control is applied which reduces the frequency of both
blading and regravelling practices compared to the non-stabilized gravel road. Table 2.5 and
Table 2.6 summarize the costs related to the stabilized gravel roads and blotter roads,
respectively.

17
Table 2.3: Construction and Maintenance Costs for HMA Roadways (Zimmerman and Wolters, 2004)
ADT
Initial Const.
or Major Rehab.
Cost ($/mile)
Crack Seal Seal coat Overlay Stripping and Marking
Patching/Annual Maint. Cost
($/mile) Years
between app.
Cost ($/mile)
Years between
app.
Cost ($/mile)
Years between
app.
Cost ($/mile)
Years between
app.
Cost ($/mile)
0-99 35,000 3 900 5 6,500 21 35,000 5 210 500 100-199 35,000 3 900 5 6,500 17 35,000 4 250 500
200-299 37,000 3 1,200 4 7,000 20 37,000 4 280 500
300-399 37,000 3 1,200 4 7,000 20 37,000 4 280 500
400-499 39,000 5 1,600 4 7,300 20 39,000 4 310 500
500-599 40,000 6 1,600 4 7,300 20 40,000 4 320 500
600-699 43,000 6 1,600 4 7,300 20 50,000 4 360 500
>700 43,000 6 1,600 4 7,300 20 50,000 4 360 500
NOTE: All costs were determined using 2003 dollars
Table 2.4: Construction and Maintenance Costs for Gravel Roadways (Zimmerman and Wolters, 2004)
ADT
Initial Const. or
Major Rehab. Cost
($/mile)
Blading Regravel Spot Gravel/Annual Maint. Cost ($/mile) Times per
year Cost
($/mile) Years
between app. Cost
($/mile)
0-99 3,700 17 45 8 3,700 350 100-199 3,700 20 45 8 3,700 800 200-299 4,500 30 50 6 4,500 1,070
>300 7,036 50 65 6 7,036 2,420 NOTE: All costs were determined using 2003 dollars
Table 2.5: Construction and Maintenance Costs for Stabilized Gravel Roadways (Zimmerman and Wolters, 2004)
ADT
Initial Const.
or Major Rehab.
Cost ($/mile)
Dust Control Blading Regravel Reshape Cross Section Spot
Gravel/Annual Maint. Cost
($/mile)
Years between
app.
Cost ($/mile)
Times per year
Cost ($/mile)
Years between
app.
Cost ($/mile)
Years between
app.
Cost ($/mile)
0-99 5,000 1 2,700 4 40 12 2,300 -- -- 500 100-199 8,154 1 3,300 4 40 5 4,854 -- -- 333
200-299 8,154 1 3,300 4 40 5 4,854 -- -- 333
>300 19,716 1 2,300 6 380 10 17,416 10 3,400 3,635 NOTE: All costs were determined using 2003 dollars
18
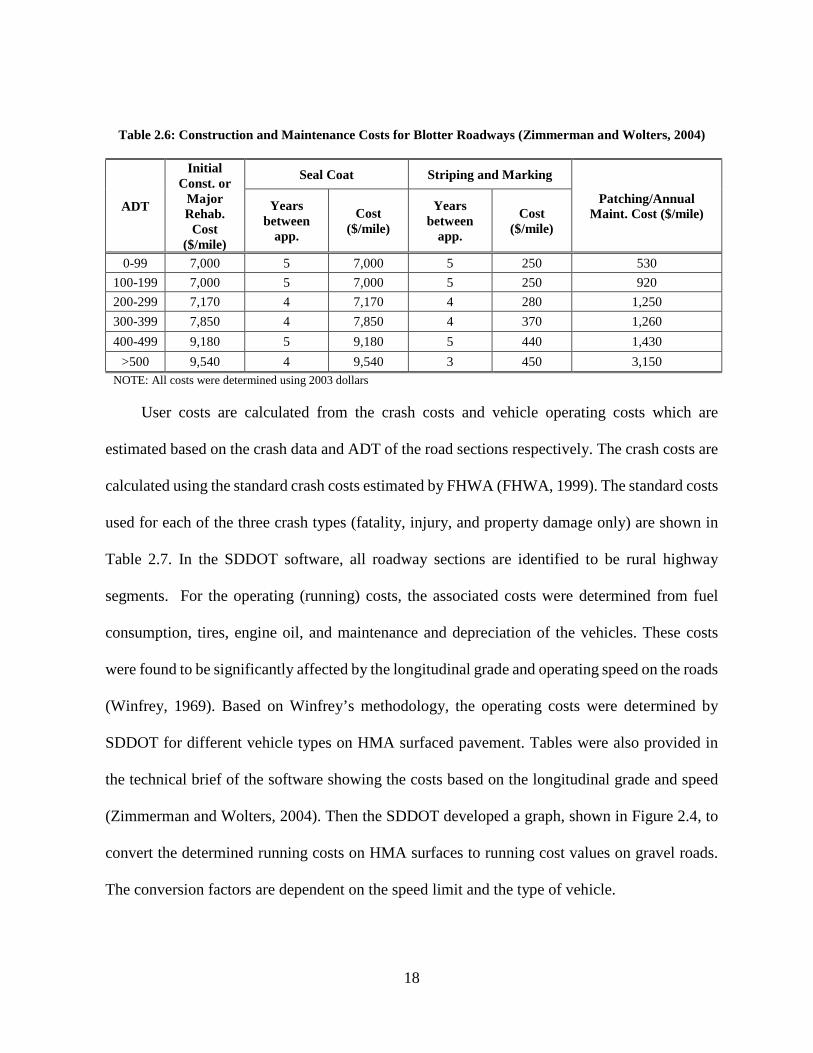
Table 2.6: Construction and Maintenance Costs for Blotter Roadways (Zimmerman and Wolters, 2004)
ADT
Initial Const. or
Major Rehab.
Cost ($/mile)
Seal Coat Striping and Marking
Patching/Annual Maint. Cost ($/mile) Years
between app.
Cost ($/mile)
Years between
app.
Cost ($/mile)
0-99 7,000 5 7,000 5 250 530 100-199 7,000 5 7,000 5 250 920 200-299 7,170 4 7,170 4 280 1,250 300-399 7,850 4 7,850 4 370 1,260 400-499 9,180 5 9,180 5 440 1,430
>500 9,540 4 9,540 3 450 3,150 NOTE: All costs were determined using 2003 dollars
User costs are calculated from the crash costs and vehicle operating costs which are
estimated based on the crash data and ADT of the road sections respectively. The crash costs are
calculated using the standard crash costs estimated by FHWA (FHWA, 1999). The standard costs
used for each of the three crash types (fatality, injury, and property damage only) are shown in
Table 2.7. In the SDDOT software, all roadway sections are identified to be rural highway
segments. For the operating (running) costs, the associated costs were determined from fuel
consumption, tires, engine oil, and maintenance and depreciation of the vehicles. These costs
were found to be significantly affected by the longitudinal grade and operating speed on the roads
(Winfrey, 1969). Based on Winfrey’s methodology, the operating costs were determined by
SDDOT for different vehicle types on HMA surfaced pavement. Tables were also provided in
the technical brief of the software showing the costs based on the longitudinal grade and speed
(Zimmerman and Wolters, 2004). Then the SDDOT developed a graph, shown in Figure 2.4, to
convert the determined running costs on HMA surfaces to running cost values on gravel roads.
The conversion factors are dependent on the speed limit and the type of vehicle.

19
Table 2.7: Standard Crash Costs (1990 dollars) (FHWA, 1999)
Intersection or Facility Type
Fatality Nonfatal Injury Property Damage Only (PDO)
Rural Urban Rural Urban Rural Urban
RR Grade Crossing $1,008,000 $994,000 $252,000 $133,000 $159,000 $309,000
Intersection/Interchange $1,059,000 $932,000 $219,000 $143,000 $198,000 $135,000
Bridge $1,111,000 $978,000 $249,000 $143,000 $214,000 $127,000
Highway Segment $1,111,000 $978,000 $249,000 $143,000 $214,000 $127,000
Figure 2.4: Factors for Converting Vehicle Operating Costs from HMA sections to Gravel Roads (Zimmerman and Wolters, 2004)
Based on the cost data, a comparison between the different surfaces can be conducted to
make the appropriate surfacing decision. The SDDOT software allows the user to compare any
combination of the four surface types: HMA, blotter, gravel, and stabilized gravel. The LCCA is
conducted in the software using the default values shown before. However, the user has the

20
ability to alter the inputs to be consistent with the agency’s needs. The decision is based on the
present value (PV) which can be calculated using Eq. 1. It is to be noted that most of the
associated costs for the different types of road surfaces have different economic impacts.
Agencies may have to alter evaluation practices for some of the costs, especially the operating
cost, because they, most of the time, overwhelm the agency costs. The software allows the user
to decide to exclude user costs or reduce the impact of associated costs using weighting factors.
These factors are available in the technical brief for all sources of costs and for each surface type
(Zimmerman and Wolters, 2004).
𝑃𝑃𝑃𝑃 = 𝐴𝐴 ∗ (1+𝑖𝑖)𝑁𝑁−1𝑖𝑖∗(1+𝑖𝑖)𝑁𝑁
Eq. (1)
where,
PV: is the present value
A: is the annual value
i: is a discount rate
N: is the study years
2.2.1.3 Public Opinion
After studying all the previous considerations in deciding the appropriate surface type for a low-
volume road, public opinion is an important factor to be considered. Every agency has different
circumstances about the public acceptance of gravel roads. In most cases, public opinion favors
paved roads. However, gravel roads are more applicable in agricultural and low-income societies
because of the low maintenance costs. In some cases, residents may prefer gravel roads for the
local roads more than the paved roads. They believe that gravel roads reduce the speed and

21
volume of traffic which is desirable from the perspective of local walkers, equestrians, and
cyclists (Kimley-Horn and Associates, Inc., 2009). In general, poorly maintained roads generate
negative public opinion. State and local agencies should consider the potential reactions from
public users of low-volume roads before making the decision of selecting the type of road surface.
2.3 Low-Volume Roads Pavement Design Methods
Throughout the world, safe roads and sustainable pavement sections are the ultimate goals of
designing roads. Transportation agencies apply different standards of road alignments and
geometric designs in order to enhance sight and safety on roads. Another important aspect of
designing roads is to select the thickness and material characteristics of pavement layers to
accommodate the expected traffic loading over the pavement service-life. Most research efforts
for infrastructure investments are geared toward high volume roads. When it comes to designing
LVRs, it is challenging to define the appropriate pavement structure in an economic manner using
inexpensive materials and techniques. Although traffic volumes on LVRs are relatively low,
pavements are still subjected to environmental effects over time. When the pavement deteriorates
to a poor level, it becomes hard to sufficiently maintain or rehabilitate the road because of the
limited resources allocated on LVRs. Thus, it is important to document the efforts used to
improve the ability to sustain LVRs in an economic manner and within the local needs.
The methodology to design LVRs pavement structure should focus on eliminating the main
types of pavement distresses. Pavements in LVRs have similar structure to high volume and
national highways. However, LVRs have unbound granular layers covered with a thin layer of
asphaltic seal and chips, see Figure 2.5.

22
Figure 2.5: Schematic Profile of (a) High-Volume Road; (b) Low-Volume Road Pavement (Brito, 2011)
Since rutting is the main distress mode in unsealed and thin sealed pavement, LVRs should
be designed to limit the vertical permanent deformation in the base and subgrade layers. Coghlan
(1999), Visser and Hall (2003), and El abd et al. (2004) emphasized that LVRs may not be
designed with the traditional highway engineering standards. The reason is that most of the
design methods are based on linear elastic calculations. The unbound properties of LVRs layers
make applying many traditional design methods inapplicable. As a result, research was
conducted to investigate the appropriate design procedures for low-volume roads. Many states
have developed or adopted other design methods for lower-volume pavements. Some of them
are empirical by designing the layer thicknesses on the basis of experience. Others are semi-
analytical and mechanistic-empirical procedures. In general, the objective from any pavement
design guide is to select the most economic pavement structure providing a satisfactory level of
service for the expected traffic. There are several input variables for a pavement design
procedure. They should comprise the following (Brito, 2011):
• Design Traffic
• Subgrade and pavement materials
• Environment

23
• Construction and maintenance
• Road geometry
• Equipment availability
• Social concerns
• Sustainability
The existing pavement condition is also an important input when designing an overlay, or
re-gravelling in case of unsurfaced roads. The following subsections compile the effort by
pavement agencies to develop specific low-volume design methods.
2.3.1 AASHTO Design Procedure
The American Association of State Highway and Transportation Officials (AASHTO) developed
design methods for flexible pavements based on the AASHO road test in the 1950’s (AASHTO,
1993). The methods include design catalog and empirical methods. The design principle of this
method is that the overall pavement strength should endure the total applied traffic loads, where
the serviceability loss is acceptable over the pavement serviceable age. The outputs from this
methodology depend mainly on the subgrade soil strength in terms of resilient modulus (Mr),
reliability in terms of desired design reliability, traffic, and material properties. For traffic data,
there are different vehicle configurations travelling on roads. The mixed types of traffic cause
different magnitudes and repetitions of wheel loads. All of these loads can be converted into a
single value called the Equivalent Single Axel Load (ESAL), commonly 18,000 lbs (e.g., 18
kips). The general equation of the design method is shown in Eq. (2).

24
log10(W18) = Zr so + 9.36 log10 (SN + 1) − 0.20 +log10 �
∆PSI4.2 − 1.5�
0.40 + � 1094(SN + 1)5.19�
+2.32log10(Mr) − 8.07 Eq. (2)
where,
W18: is the estimated traffic (ESAL)
Zr: is standard normal deviate determined from the reliability
so: is the overall standard deviation of the input data
SN: is the structural number (inches)
ΔPSI: is the loss in serviceability over the life of the road
Mr: is the resilient modulus of the subgrade (lb/in2)
Nomographs were developed to solve the previous equation graphically as shown in
Figure 2.6. The output from these graphs is the structural number (SN) which is an indication
of the pavement strength. SN is then represented by the compound properties of the pavement
layers as shown in Eq. (3).
SN = a1D1 + a2D2 + a3D3 Eq. (3)
where,
a1, a2, and a3 are layer coefficients for the surface, base, and subbase layers, respectively,
reflecting their material strengths
D1, D2, and D3 are the thicknesses of the surface, base, and subbase layers, respectively.

25
Figure 2.6: AASHTO Design Nomograph (AASHTO, 1993)
The AASHTO Guide for Design of Pavement Structures (AASHTO, 1993) provides specific
design standards for low-volume roads. The design guide states that a low-volume road should
have ESAL values ranging from 50,000 up to 1,000,000. The design charts for flexible pavement
in low-volume roads are similar to those for highway pavement design. However, the inputs are
simplified to allow state and local agencies the option of using some default and standard inputs.
Hall and Bettis (2000) indicated that AASHTO design procedure is relatively complex and
includes many input variables. Most of the inputs need to be determined in a way that is beyond
the local agency’s needs and capabilities. Although the design procedure for LVRs is a simplified
version of the high volume roads, the resilient modulus (Mr) of the subgrade, traffic ESAL, and
the structural layer coefficients (ai) still need to be determined. Therefore, the AASHTO design
method may be an inapplicable procedure for LVRs given the limited resources available to local
agency engineers.

26
2.3.2 United States Army Corps of Engineers (USACE) Procedure
The USACE’s airport pavement design method has been also simplified into a version that is
suitable for low-volume roads and local streets (USACE, 1992). Two major inputs are considered
in the design method. The first input is the soil strength in terms of CBR (e.g., California Bearing
Ratio) value. This value can be determined by applying a penetration test in the lab on a soil
sample of the subgrade. The second input is the traffic load in terms of 18-kips ESALs. The
design method is classified by the design index which is obtained by the traffic category, as
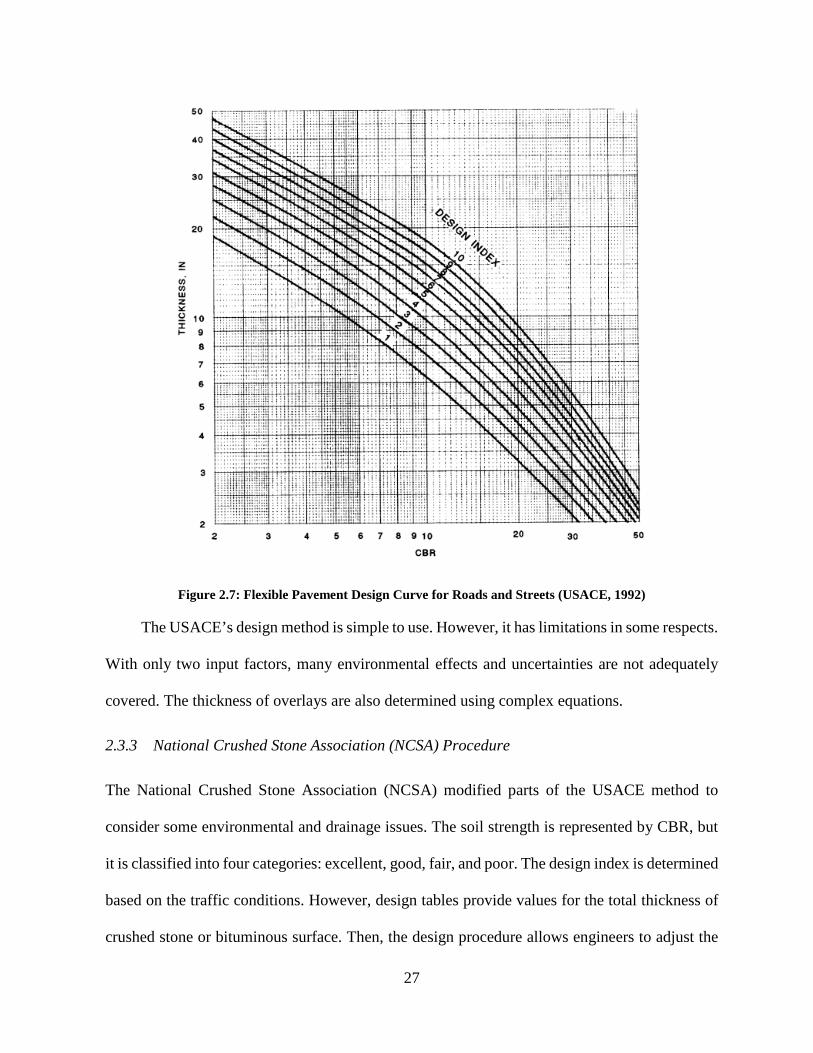
shown in Table 2.8 . Then the pavement thickness of each layer is determined using design charts
depicted in Figure 2.7. The design method also gives recommendations about the minimum
thicknesses of pavement layers and provides equivalency factors for stabilized soil layers. These
factors enable designers to reduce the base or subbase thicknesses depending on the material
properties of each layer.
Table 2.8: Pavement Design Index Versus Traffic load (USACE, 1992)
27
Figure 2.7: Flexible Pavement Design Curve for Roads and Streets (USACE, 1992)
The USACE’s design method is simple to use. However, it has limitations in some respects.
With only two input factors, many environmental effects and uncertainties are not adequately
covered. The thickness of overlays are also determined using complex equations.
2.3.3 National Crushed Stone Association (NCSA) Procedure
The National Crushed Stone Association (NCSA) modified parts of the USACE method to
consider some environmental and drainage issues. The soil strength is represented by CBR, but
it is classified into four categories: excellent, good, fair, and poor. The design index is determined
based on the traffic conditions. However, design tables provide values for the total thickness of
crushed stone or bituminous surface. Then, the design procedure allows engineers to adjust the

28
design thickness if severe conditions are applicable, such as frost damage or drainage issues
(Abdel Warith et al., 2015).
2.3.4 Asphalt Institute Procedure
This method was developed using a mechanistic-empirical approach. The analysis of pavement
layers is conducted using two main inputs: 1) the design subgrade resilient modulus; 2) traffic in
terms of 18-kips ESALs. The method was simplified to the local needs so that the number of 18-
kips ESALs can be determined. Also, there are simplified methods to calculate the resilient
modulus of the subgrade. This design procedure is relatively simple to use. However, it is limited
by specific application of stabilized layers or subbase layers (Asphalt Institute, 1991).
2.3.5 States Design Procedure
Many states have developed specific low-volume pavement design procedures. These procedures
are considered as ‘non-AASHTO’ design protocols and they have various complexity levels.
Some of these methods incorporate the soil and environmental effects for the states’ regions.
Relatively recently, California, Illinois, Kentucky, Mississippi, New York, Pennsylvania, Texas,
Vermont, Virginia, and Minnesota have developed their own design procedures. In this section, a
brief description is introduced about each method developed at the previously mentioned states. Then,
a comparison among all methods is presented to show the common data inputs required for designing
LVRs.
2.3.5.1 California Procedure
The California design procedure was developed based on studies and tests from various agencies.
Three major parameters are required in this procedure which are (Caltrans, 2017):

29
• Traffic – The traffic data is represented by a traffic index (TI) based on 18-kips ESALs.
TI can be determined through a standard method. Traffic counts are first obtained and
then they are converted into the equivalent loads using truck constants. Another
simplified method is obtaining TI directly from ADT, percentage of trucks, and a
design-life period of 10 years.
• Soil Resistance Value (R-Value) – This value can be determined using a stabilometer
test (Chua and Tenison, 2003). The R-value of the subgrade refers to the ability of a
material to resist lateral deformation when acted upon by a vertical load. The R-value
ranges from 0 (water) to 100 (steel). Typically, the R-value of subgrade ranges from
less than 5 up to 85. When testing subgrade, the soil specimen is compacted to
conditions that approximate those in the field. Then, it is tested at full moisture
saturation as to represent the worst case the soil can be in at any given time. If the local
agency cannot perform a stabilometer test on the soil, the R-value may be estimated by
using some simple soil classification tests in conjunction with the sand equivalent (SE)
test (Caltrans, 2017).
• Gravel Equivalent Factor (Gf) – This is an empirical factor developed through research
and field experience. Gf represents the strength of the pavement structure, and it relates
the relative strength of a unit thickness of the pavement materials in terms of an
equivalent thickness of gravel. The Gf is easily taken from a chart included in the design
procedure.
The California design method is relatively simple. A design chart is used to determine the
required thickness of each layer of the pavement structure after obtaining the three inputs.
30
2.3.5.2 Minnesota Procedure
Two pavement design methods are available to local agencies when designing LVRs in
Minnesota (MNDOT, 2017). The first method depends on obtaining the R-value of the subgrade.
The second method is based on gravel equivalency (GE) found in Minnesota’s State Aid Manual.
This method is more preferable to the local agencies since it depends on a less conservative
procedure. The designer simply uses a design table to obtain a soil factor and an estimated R-
value based on the soil classification of the subgrade. This information is then combined with the
ADT of the road to obtain a Minimum Bituminous GE and Total GE for the design. These values
represent the bituminous and base layer thicknesses in inches. In the R-value procedure, two
additional inputs are considered. The traffic load is determined in terms of Sigma N-18 value
(e.g., the standard 18-kip ESAL). The second input is the actual R-value of the soil determined
from the stabilometer test. The design outputs are very sensitive to the R value.
2.3.5.3 Mississippi Procedure
The updated Mississippi design procedure combines several inputs. The thickness of each layer
is determined using a design chart requiring the following inputs:
• Soil Strength – The Soil Support Value (SSV) represents the soil strength with a scale
ranging from 1 to 10 (George, 2004). The natural soil at the road commonly has an SSV
of 3. Although the AASHTO design guide replaced the SSV with the resilient modules,
local agencies still use SSV because it is relatively simple to estimate. Through research
performed on soils in Mississippi, Eq. (4) was developed to determine SSV. A correlation
was found between the SSV and the CBR of the soil.
𝑆𝑆𝑆𝑆𝑃𝑃 = 30289 𝑙𝑙𝑙𝑙𝑙𝑙10(𝐶𝐶𝐶𝐶𝐶𝐶) + 1.421 Eq. (4)

31
• Design Life – The design life, in years, is not the same. It is estimated depending on the
amount of Design Heavy Vehicles (DHVs).
• Traffic Loads – Two parameters are determined for traffic loads: the percent 18-kip load
and the average 18-kip daily load (ADL).
Also, the ADT for the road is used in the design chart to obtain the design index (DI). DI is
used to determine the design thickness of subbase and the combined base and surface thickness.
Although this design procedure has empirical equations and charts, it gives similar design values
as AASHTO’s (Abdel Warith et al., 2015).
2.3.5.4 New York Procedure
This procedure is based on the AASHTO design equation for flexible pavements (NYSDOT,
1994). However, it takes into account the frost susceptibility in the determination of the layer
coefficients (ai) and the Drainage coefficients (mi). This is because various frost susceptible soils
are encountered in the upper Northeast of the United States. The frost susceptible soils affects
the design charts when determining the subgrade modulus.
2.3.5.5 Virginia Procedure
The Virginia design procedure for low-volume roads differs from the other procedures. This
method appears to be applicable for many states and local agencies since it has simple inputs.
First, the design traffic amounts are determined based on the present ADT and an estimated
Growth Factor (GF). These factors can be found from historical traffic data or empirically
estimated by a traffic engineer. Second, the soil strength is represented by SSV. It is calculated
by the Design CBR and a Resiliency Factor (RF) (VDOT, 2000). The RF represents the soil’s

32
elastic deformation characteristics and its ability to withstand repeated loading. Typical values
are extracted for RF from design tables based on soil classification. The required thicknesses can
be determined by the design index (DR) (obtained from a design nomograph using SSV and
design ADT).
From all the previously discussed procedures, it was found that traffic data and soil strength
of the subgrade are the most common inputs when designing low-volume roads. Each state has
its own methodology to represent these inputs with different sophistication levels. However, all
states tried to customize their procedure to the available local needs and resources. In summary,
Table 2.9 lists the different input parameters required for each design procedure. Abdel Warith
et al. (2015) also displayed the complexity of each design procedure. Table 2.10 shows the level
of complexity and the availability of the design inputs. Most of the local agencies are obviously
struggle to obtain the input data for designing the pavement of LVRs. According to Abdel Warith
et al. (2015), only the USACE and the NCSA design procedures are simple enough for many
local agencies.

33
Table 2.9: Inputs Summary of Traffic and Soil Strength Criteria by Design Procedure for Low-Volume Roads
Procedure (a) Traffic Input Criteria
ESAL ADT Index Design Period GF AASHTO • • USACE • NCSA • • Asphalt Institution • California • • Minnesota (GE) • Minnesota (R-Value) • Mississippi • • New York • Pennsylvania • Vermont • Virginia • • Procedure
(b) Subgrade Strength Criteria MR CBR Soil Type R-value Frost Drainage
AASHTO • USACE • NCSA • • • • Asphalt Institution • California • Minnesota (GE) • Minnesota (R-Value) • • Mississippi • New York • • • Pennsylvania • • Vermont • • Virginia •
NOTE: GF = growth factor; blank cells = no input required
34
Table 2.10: Complexity of Low-Volume Road Design Procedures (Abdel Warith et al., 2015)
Procedure Availability of Design Inputs
Traffic Subgrade Strength Complexity of Procedure AASHTO Not readily available Not readily available Complex USACE Available Available Simple NCSA Available Available Simple AI Not readily available Not readily available Simple California Available Not readily available Moderate Minnesota (GE) Not readily available Not readily available Simple Minnesota (R-Value) Not readily available Not readily available Moderate Mississippi Not readily available Available Simple New York Not readily available Not readily available Complex Pennsylvania Not readily available Available Moderate Vermont Not readily available Not readily available Complex Virginia Not readily available Available Moderate
2.4 Pavement Maintenance and Preservation on Low-Volume Roads
2.4.1 Introduction
All pavements deteriorate over time due to traffic loads and environmental effects (Bandara and
Gunaratne, 2001). The pavement performance and the quality of road surfaces have different
behaviors depending on the pavement materials, soil characteristics, traffic loads, and
environmental conditions. However, as displayed in Figure 2.8, the conceptual performance
curves of pavements always have the same trend: older pavement sections deteriorate faster and
they cost more money to fix.

35
Figure 2.8: Relationship between Pavement Performance and Repair Costs (Shahin and Walter, 1990)
There are multiple treatment options applied on paved roads. They have different effects
on the roads depending on present pavement conditions and the targeted serviceability. All
pavement treatments can be categorized into four main types:
1. Routine or Preventive Maintenance
2. Light to Moderate or Minor Rehabilitation
3. Heavy or Major Rehabilitation
4. Reconstruction
Figure 2.9 shows an example of identifying the type of treatment recommended for a road
based on the Pavement Condition Index (PCI) of the segment. It is not prudent to include only
the roads requiring reconstruction in the maintenance strategy of the road network. This is not
only an expensive strategy, but good and fair pavements will also continue to deteriorate to very
poor levels. Therefore, the process of only repairing the worst roadways when they fall into very
poor condition is not a cost-effective strategy.

36
Figure 2.9: Performance Models vs. Trigger Values for Treatments (Smith, 2002)
2.4.2 Pavement Preservation
The concept of pavement preservation has become an important treatment strategy especially
with the limited resources available for agencies. Pavement preservation has the ability to keep
the overall condition of pavement in higher levels by applying early, frequent routine
maintenance and minor rehabilitation.
Figure 2.10 shows how the pavement preservation process maintains roads in good
condition over the pavement age compared to the major rehabilitation and reconstruction
practices. It should be noted that most pavement preservation programs do not enhance the
structural capacity of pavements. Pavement preservation only extends the remaining service life
of good pavements by applying surface treatments which can be labeled as ‘preventive’ or
‘corrective’ maintenance (Peshkin and Hoerner, 2005). The advantage of applying surface low-
cost treatments is that most agencies can afford these treatments in the maintenance strategies
compared to the ‘worst first’ approach. As a result, maintenance budgets can cover more miles
of road and the overall weighted condition of the network can be enhanced. Therefore, pavement
preservation appears more applicable to the agencies.

37
Figure 2.10: Pavement Preservation Concept (NPS, 2014)
2.4.3 Types of Preventive Maintenance
Several types of preventive maintenance are used in the pavement preservation strategy. This
section focuses on treatments commonly applied on low-volume paved roads. Some of these
treatments are known as thin surface treatments (TSTs) or light surface treatments (LSTs) (Jahren
et al., 2016). Other treatment options are basically applications of pavement replacement using
recycled materials. The most common preventive maintenance treatments for flexible pavements
are explained below.
2.4.3.1 Crack Sealing and Crack Filling
The main objective of sealing and filling surface cracks is to prevent water and incompressible
materials from entering into the pavement layer. Figure 2.11 shows an example of sealed cracks
on a flexible pavement surface. Low-severity cracks can be sealed from the top with an
emulsified asphalt. When cracks are wide, they have to be filled using an appropriate filling

38
material such as sand or specific asphalt filler. There are different practices for crack preparation
and selecting the type of sealant materials. Crack seal and fill are commonly applied on
longitudinal, transverse, block, and edge cracking. Neither crack sealing or filling can treat
fatigue cracking because this type of distress affects the full depth of the asphalt layer. It is
commonly recommended to implement a full-depth reclamation of the distressed pavement in
the case of fatigue cracking (Caltrans, 2003).
Figure 2.11: Crack Sealing of Flexible Pavement (Wilde et al., 2014)
There are various criteria that need to be fulfilled when sealing and filling cracks such as:
• Sealant must remain adhered to the wall of the crack.

39
• Sealant should have the ability to expand and contract over a range of service
temperatures without rupture.
• Sealant should resist abrasion and damage caused by traffic.
2.4.3.2 Chip Seal
Chip seal is one of the most common types of surface treatments and preventive maintenance
among agencies. As shown in Figure 2.12, a chip seal is constructed by applying a layer of asphalt
binder on the surface. Then a layer of single-sized aggregate is distributed with only limited
compaction efforts. Chip seal looks like a gravel road at the beginning. When vehicles move on
the chip seal, they compact the aggregate and make it tight with the binder. The main objective
of chip sealing is to improve the surface friction. It is also used for waterproofing and sealing
small cracks. One major problem in chip seal is when the aggregates are not adequately
embedded in the asphalt, they fly up from tires. This leads to more windshield damage of moving
vehicles. Therefore, chip seal is not recommended on high-speed roads because of the potential
for windshield damage.
Figure 2.12: Applying a Chip Seal Layer on a Paved Road (Hafez, 2015)

40
There are many types of chip sealing used by agencies. Two main types are commonly
used on low-volume roads, described below:
• Single Chip Seal – This seal is used as a pavement preservation treatment. It provides a
new skid resistant wearing surface. Figure 2.13 shows a single chip seal application.
Figure 2.13: Single Chip Seal (Caltrans, 2003)
• Double Chip Seal – This treatment consists of two or multiple applications of chip
seals. Some agencies use this application when a harder wearing and longer lasting
surface treatment is needed.
Figure 2.14: Double Chip Seal (Caltrans, 2003)

41
2.4.3.3 Otta Seal
Otta seal was originally developed by the Norwegian Road Research Laboratory (NRRL) in the
early 1960s. It derives its name from the location in Norway where it was developed - the Otta
Valley (Overby and Pinard, 2007). This is an asphalt surface treatment which is very similar to
chip seal. Both Otta and chip seals are used to increase surface friction by adding an aggregate
layer laid on soft asphalt. The main difference between chip seals and Otta seals is that Otta seals
have graded aggregates while chip seals have single-size aggregates. This difference is shown in
Figure 2.15 for single chip and Otta seals. Otta seals can be applied as single or double layers.
The gradation of the aggregates ranges from open to dense gradation depending on the traffic
amounts, with higher traffic volumes requiring denser materials.
Figure 2.15: The Difference of Aggregate Gradations between (a) a Single Chip Seal, and (b) a Single Otta Seal (Overby and Pinard, 2007)
2.4.3.4 Slurry Seal
Slurry seal is an application to seal pavement surfaces by filling cracks and voids. These kinds
of applications use a cold asphalt mixture which involves water, asphalt emulsion, and small

42
crushed stone aggregates. Polymer is usually added to the emulsified asphalt to provide better
mixture properties. As shown in Figure 2.16, no rolling is required for compacting the seal. The
slurry seal layer is smoothed using a piece of burlap dragged behind the slurry truck. Hours later,
the road can be opened to the traffic. Slurry seal and fog seals are similar applications with similar
objectives, except fog seals do not include aggregates in the mixtures.
Figure 2.16: Applying and smoothing a Slurry Seal layer on the Surface (LA County, 2017a)
2.4.3.5 Microsurfacing
Like a chip seal, micro surfacing treatments are used to increase the skid resistance of the surface.
Since micro surfacing mixtures hold small size aggregates, they can also be used for filling cracks
and rutting. Rideability can be improved using this type of low cost treatment. Cold-mix mixtures
are used with polymer additives and asphalt emulsion. Unlike slurry seals, no water is added to
the asphalt mix which make the mixtures harden, ‘break’, without relying on the sun for water
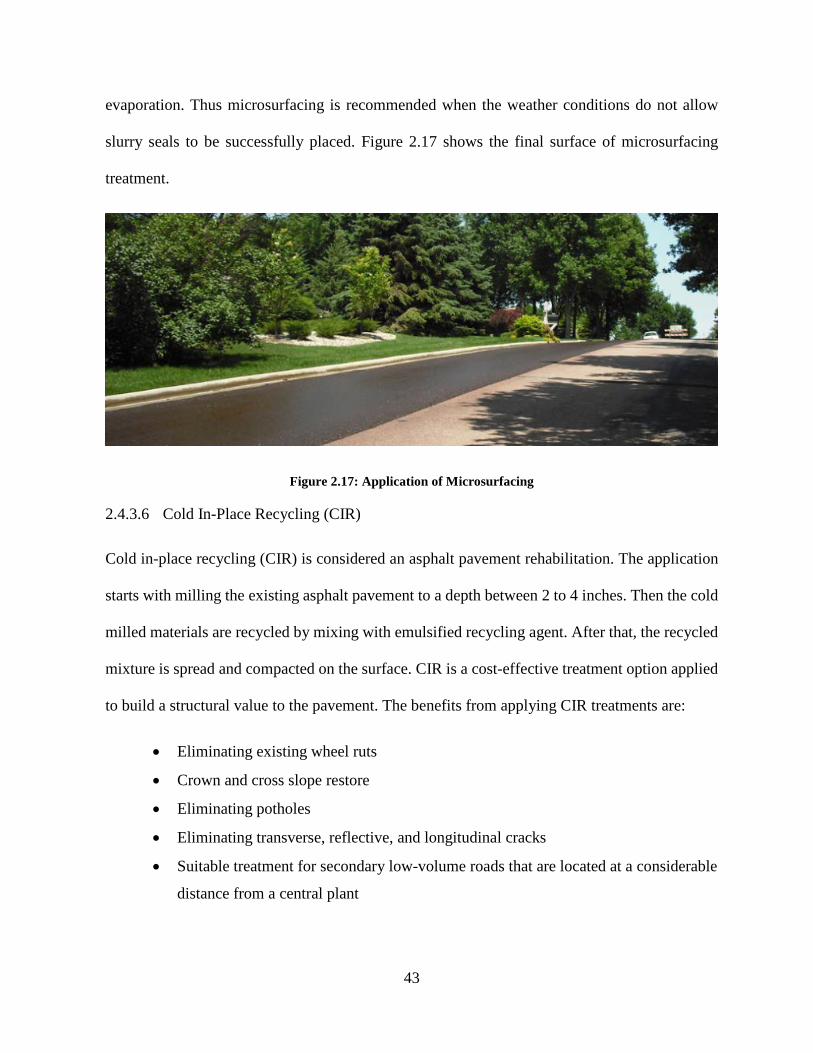
43
evaporation. Thus microsurfacing is recommended when the weather conditions do not allow
slurry seals to be successfully placed. Figure 2.17 shows the final surface of microsurfacing
treatment.
Figure 2.17: Application of Microsurfacing
2.4.3.6 Cold In-Place Recycling (CIR)
Cold in-place recycling (CIR) is considered an asphalt pavement rehabilitation. The application
starts with milling the existing asphalt pavement to a depth between 2 to 4 inches. Then the cold
milled materials are recycled by mixing with emulsified recycling agent. After that, the recycled
mixture is spread and compacted on the surface. CIR is a cost-effective treatment option applied
to build a structural value to the pavement. The benefits from applying CIR treatments are:
• Eliminating existing wheel ruts
• Crown and cross slope restore
• Eliminating potholes
• Eliminating transverse, reflective, and longitudinal cracks
• Suitable treatment for secondary low-volume roads that are located at a considerable
distance from a central plant

44
Compared to the conventional mill-and-fill methods, CIR allows 100% of the recycled
materials to be reused onsite. It can reduce the costs significantly compared to new HMA layers.
Figure 2.18 shows a cold in-place recycling train consists of a milling machine; cold reclamation
machine, which is capable of pulverization, sizing, and blending; and emulsion storage. Graders
and compactors following the Cold in-place train restore the road profile and compact the CIR
layer to achieve the desired density and strength.
Figure 2.18: Cold In-Place Recycling Train (LA County, 2017b)
2.4.3.7 Full-Depth Reclamation (FDR)
FDR is a cold recycling treatment similar to CIR. However, FDR recycles the entire pavement
thickness. FDR is also known as full-depth cold recycling, whereas CIR is partial-depth cold
recycling. FDR is more effective in eliminating deep cracking patterns than CIR. It also reduces
the chances of having reflective cracking. The application of FDR can be conducted using the
same equipment as the CIR. However, it requires more compactive efforts because the overlaying
recycled layer is thicker. FDR provides another cost-effective solution for pavement

45
rehabilitation compared to the conventional new HMA layers. This technology is relatively new
and the long term field performance has not been well evaluated (Jahren et al., 2016).
2.4.3.8 Thin and Ultra-Thin Overlay
Thin and ultra-thin overlays are used as a preventive maintenance to retard future deteriorations.
Compared to chip seal and micro surfacing, thin overlays can add structural value and improve
ride quality. Furthermore, thin overlays seal cracks, enhance skid resistance, and improve
drainage by repairing slopes. It is considered one of the most cost-effective maintenance to
enhance the long-term performance compared to the surface treatments. The increase in structural
capacity varies depending on the thickness of the overlay and condition of the existing pavement.
To achieve all of the mentioned benefits, the pavement should have about 75 percent of its service
life remaining at the time of the overlay (Attoh-Okine and Park, 2007). Also some pre-treatments
(sealing or milling) are highly recommended before applying overlays. Generally, thin overlays
are applied with a thickness of 1.5 inches. They can also be placed very thin, close to about 0.5-
in thick. Figure 2.19 shows an example of thin bonded wearing course application.
Figure 2.19: Thin Bonded Wearing Course Application (Wilde et al., 2014)

46
One type of thin overlay is Ultra-Thin Bonded HMA Wearing Course (UTBWC). UTBWC
consists of a layer of HMA laid over a heavy asphalt emulsion layer. The thickness of UTBWC
commonly ranges from 0.375 to 0.75 inches. This treatment can enhance the aggregate retention
from polishing and raveling. However, it is not recommended to apply ultra-thin overlays on a
pavement with longitudinal cracking that exceeds the medium severity level (Attoh-Okine and
Park, 2007). Also, all the surface cracking should be cleaned, routed, and sealed before applying
ultra-thin overlays.
All of the mentioned treatments have the ability to extend the serviceable life of pavements as
long as the road is in relatively good condition. Life extension of roads using preventive
maintenance has been investigated extensively. The effectiveness of the surface treatments when
they are applied to a poor pavement has not been well investigated. Table 2.11 summarizes the
expected life of the different types of preventive maintenance from previous studies. It is to be
noted that chip seal treatments are widely used and they have been investigated extensively. Most
of the studies have mentioned that chip seals can extend the serviceable life of good pavements
from 3 up to 8 years. The reader should be aware that the results from the mentioned studies were
developed from different projects where LVRs were applied with treatments that are used for
preventive maintenance. Yu et al. (2015) mentioned that the surface preventive treatments can
be applied on deteriorated roads as holding strategies to keep the road in serviceable conditions
until funding is available for rehabilitation or reconstruction. When considering holding
strategies, the expected service life of the different options can be estimated as the lower end of
the life range mentioned by the different studies. Table 2.12 lists the typical costs associated with
most common surface treatments and preventive maintenance. These costs were estimated by

47
averaging the costs from different projects. These costs are subject to adjustment for inflation,
but provide a good reference to be considered in LCCA techniques.
Table 2.11: Expected Life Extension in Years of Various Treatments
Treatment
Geoffroy (1996)
(Geoffroy 1996)
Hicks et al. (2000)
(Hicks, Seeds and Peshkin 2000)
Maher et al. (2005) (Maher, et al. 2005)
Huang (2009) (Huang
and Dong 2009)
Wu et al. (2010)
(Wu, et al. 2010)
Michigan DOT
(2011) (Galehous
e 2003)
Crack Sealing 2 to 5 Up to 3 0 to 4 Up to 3
Thin Asphalt Overlay 2 to 12 9 to 12 3 to 23 5 to 10 Chip Seal 4 to 7 3 to 7 3 to 5 3 to 5 3 to 8 3 to 6
Double Chip Seal 4 to 8 4 to 7 Microsurfacing 4 to 7 3 to 9 5 to 8 7 to 9 3 to 8 3 to 5
Slurry Seal 1 to 6 3 to 7 3 to 8 3 to 8 4 to 7 Fog Seal 2 to 4 1 to 3 4 to 5
Otta Seal 4 to 8 4 to 8 Double Otta Seal 8 to 15
Cold In-place Recycling 6 to 20 4 to 17 Hot In-place Recycling 6 to 15 3 to 8
Full Depth Reclamation 7 to 20 10 to 20
Table 2.12: Cost per Square Meter of Various Treatments
Treatment
Hicks et al. (2000)
(Hicks, Seeds and Peshkin 2000)
Maher et al. (2005) (Maher,
et al. 2005)
Huang (2009) (Huang and Dong 2009)
Crack Sealing $1 to $5
Thin Asphalt Overlay $2.09 $1 to $1.5 $2.1 to $2.4
Chip Seal $0.85 $1.5 to $3 $0.84 to $1.14
Microsurfacing $1.25 $3.1 to $3.9
Slurry Seal $1.08 $0.9 to $1.8 $0.9 to $1.8
Fog Seal $0.54 $0.25 to $0.6
Otta Seal $2 to $2.7 $2 to $2.7
Cold In-place Recycling $4.2 to $4.8
Hot In-place Recycling $1.5 to $3.9
Full Depth Reclamation $5 to $8

48
2.4.4 Pavement Structural Rehabilitation and Reconstruction
Unlike preventive maintenance, pavement rehabilitation is applied when the pavement
deteriorates to very poor conditions due to the lack of regular maintenance. Rehabilitation adds
new life to older asphalt by applying an asphalt overlay to the existing pavement or reconstructing
the road pavement layers. Overlays are an effective treatment that cover all surface defects.
However, cracking and rutting can be reflected to the new layer if suitable preparations have not
been taken. The thicknesses of overlays can be classified into three categories:
• Thin overlays – have thicknesses less than 1.5 inches
• Medium overlays – have thicknesses ranging from 1.5 inches to 4 inches
• Thick overlays – have thicknesses greater than 4 inches
Overlays are applied on LVRs without exceeding a 3-inch layer thickness. They can be
directly placed on the old surface when all the following are confirmed:
• Additional structure is needed
• No major issues on the pavement surface
• No vertical limitations
However, when the pavement surface exhibits high distresses and severe cracks, pre-
overlay treatments should be considered. It is highly recommended to repair the top layer of
pavement by sealing the minor cracks, filling the rutting, or milling the whole surface depending
on the status of the surface. The decision of applying a full-pavement reconstruction is usually
taken when major problems are occurred in the bottom layers of base, subbase, and subgrade.
Pavement reconstruction is considered the most expensive decision that can be made to maintain
a road.

49
2.4.5 States Maintenance Strategies for Low-Volume Paved Roads
When it comes to managing low-volume and local roads, a high percentage of roads require
application of rehabilitation or reconstruction because they are in poor condition. However,
several state and local agencies do not have sufficient financial resources to enhance all the
deteriorated roads. As a consequence, each agency developed specific policies for maintaining
LVRs in order to reach specific pavement performance targets. The strategy of low-cost surface
treatments is extensively employed among local agencies and state DOTs on LVRs even if the
pavement performance is poor.
2.4.5.1 Georgia DOT
Many state DOTs recommend constructing and preserving the pavement of low-volume roads
using low-cost thin overlays due to the limited funding (Brown and Heitzman, 2013). Research
studies were conducted in an effort to reduce the cost of mixtures and overlays without affecting
the expected performance. Georgia DOT (GDOT) proposes applications of thinner overlays on
low-volume roads compared to those applied on high volume roads. In order to properly place
and compact the thin overlays, GDOT reduces the nominal maximum aggregate size (NMAS) to
4.75 mm. Table 2.13 shows the GDOT guidance for low-volume roads. It was found that using
4.75 mm asphalt mixtures allows the layer thickness to be reduced. Using thinner asphalt layers
reduces the costs and makes these type of asphalt mixture more competitive among agencies.
GDOT also provides recommendations about layer thicknesses of each mix type for thin
overlays, as shown in Table 2.14.

50
Table 2.13: Georgia DOT Surface Treatment Materials on Low-Volume Roads (GDOT, 2006)
Traffic Volume Traffic Count Surface Type
Low to Medium ADTT<100 or ADT<800 Bituminous Surface Treatment
ADTT<100 or ADT<1,000 4.75 mm NMAS HMA
ADTT<200 or ADT<2,000 Type 1, 9.5 mm NMAS HMA
NOTE: ADTT = Average daily Truck Traffic (vehicles per day)
Table 2.14: Georgia DOT Recommended Maximum and Minimum Layer Thickness (GDOT, 2006)
Mix Type Minimum Layer Thickness
Recommended Layer Thickness
Maximum Layer Thickness
4.75 mm ¾ in – 85 lbs/sq yd 7/8 in – 90 lbs/sq yd 1-1/8 in – 125 lbs/sq yd 9.5 mm 7/8 in – 90 lbs/sq yd 1-1/8 in – 125 lbs/sq yd 1-1/4 in – 135 lbs/sq yd
2.4.5.2 Nevada DOT
In the State of Nevada, alternative maintenance strategies were developed to balance between
pavement preservation and capacity improvement strategies on low-volume paved roads. A
combination of surface and rehabilitation treatments were investigated in 2007. The research
results lead to the following conclusions (Maurer et al., 2007):
• The application of CIR treatment with double chip seal saves $100,000 per center-line
mile compared to 2-inch HMA overlays
• A CIR with chip seal surface treatment can effectively rehabilitate a LVR at almost half
the cost of placing a 2-in. plant mix bituminous surface (PBS) overlay and surface
treatment.
• FDR is an effective treatment on LVRs where milled materials are cold-recycled. This
treatment can increase the structural capacity of the road.

51
As a result, the Nevada DOT developed the treatment policies on LVRs when the roads need
structural enhancement as shown in Figure 2.20.
Figure 2.20 Nevada DOT Rehabilitation Strategies for Low-Volume Roads (Hoffman, 2008)
2.4.5.3 Minnesota DOT
Minnesota DOT (MNDOT) conducted a survey for county engineers in Minnesota and
neighboring states to investigate any applied practices of recycling techniques on LVRs. The
results from the survey revealed that CIR and FDR are extensively applied in Minnesota (Jahren
et al., 2016). It was also found that chip seals were the only surface treatments applied directly
to CIR and FDR layers. In the context of pavement preservation, several agencies apply other
surface treatments such as microsurfacing, Otta seal, and ultra-thin asphalt overlay. The survey
also indicates that most Minnesota counties make decisions about pavement rehabilitation based
on past experience. Road surface, pavement age, and costs are the primary factors for such
decisions. MNDOT found inconsistent decision making procedures for pavement rehabilitation
on LVRs in Minnesota.

52
In order to find innovative solutions for pavement rehabilitation, MNDOT proposed four
pavement rehabilitation alternatives involving recycling technologies. A study was conducted to
investigate the performance and economic impacts of proposed alternatives by evaluating test
sections (Jahren et al., 2016). The pavement rehabilitation alternatives include the following:
• CIR layer with thin overlay (AC)
• CIR layer surfaced with a chip seal
• FDR with thin overlay (AC)
• FDR surfaced with a chip seal
Based on the results of the survey conducted by MNDOT, 15 test sections were located in
Minnesota to receive specific combinations of the proposed rehabilitations. A decision tree was
developed to identify the appropriate alternative based on the structural status and targeted
smoothness. Figure 2.21 shows the decision tree developed for the low-volume roads. Then a
pavement condition survey was conducted to assess the performance of the treated sections.
LCCA was also conducted over 30-year and 50-year analysis periods. LCCA results helped
MNDOT to produce the preliminary decision tree for LVRs which involves information about
the additional costs for smoothing assigned based on the user demand. Based on the expected
performance, the benefit-cost ratio was determined for each alternative using the performance
model of each section. The results of this study led to the following conclusions:
• All proposed rehabilitation alternatives are effective for rutting and roughness. However,
all test sections with asphalt overlay had lower roughness levels than the sections with a
chip seal surface. The alternative of FDR with chip seal produced the highest International
Roughness Index (IRI) values compared to the other treatments.
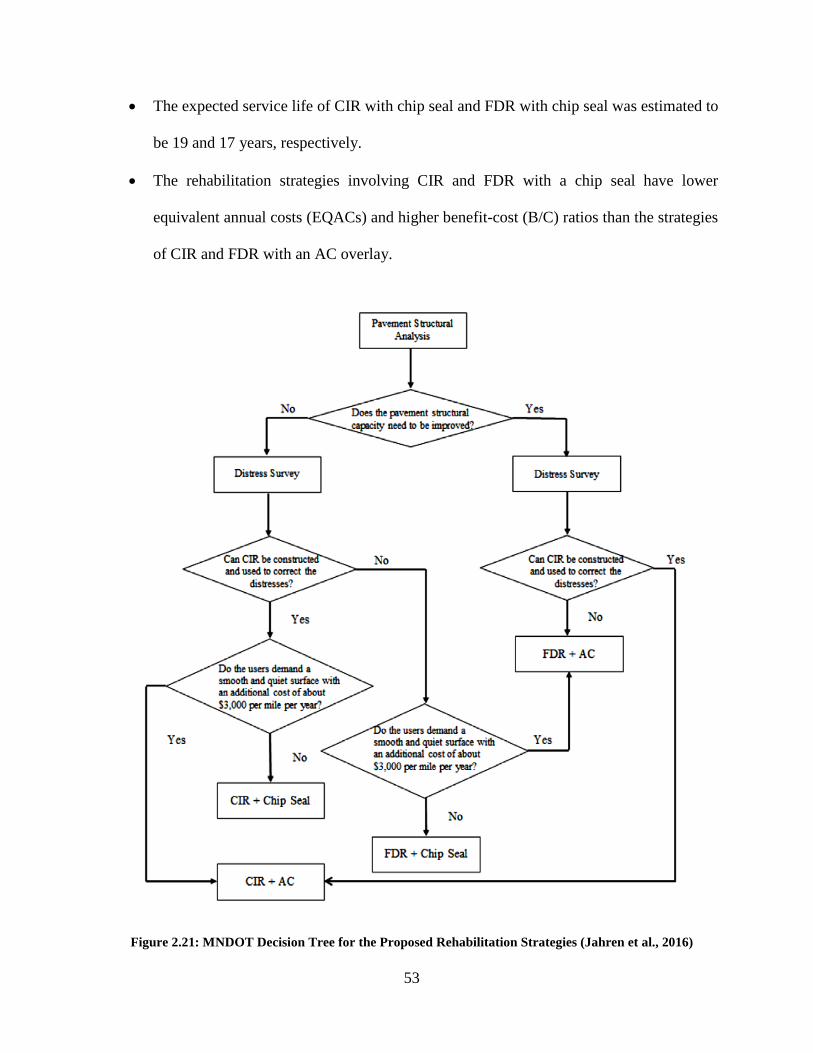
53
• The expected service life of CIR with chip seal and FDR with chip seal was estimated to
be 19 and 17 years, respectively.
• The rehabilitation strategies involving CIR and FDR with a chip seal have lower
equivalent annual costs (EQACs) and higher benefit-cost (B/C) ratios than the strategies
of CIR and FDR with an AC overlay.
Figure 2.21: MNDOT Decision Tree for the Proposed Rehabilitation Strategies (Jahren et al., 2016)

54
2.4.5.4 Iowa DOT
In 2013, Iowa Department of Transportation (IDOT) sponsored a research project in conjunction
with the Federal Highway Administration State Planning and Research Funding to evaluate
various rehabilitation methods on LVRs. Although low-cost treatments may not be appropriate
on severely distressed roads, IDOT thought that these treatments can hold the condition of
pavement at an acceptable level until funding is available for traditional rehabilitation (Yu et al.,
2015). The proposed holding strategy used different combinations of thin overlays, surface
treatments, and in-place recycling technologies. IDOT constructed 10 test sections in 2013 which
involved the following:
• 1.5” HMA overlay
• 1.5” HMA overlay + Single chip seal
• 1” interlay course + 0.75” ultra-thin HMA overlay
• 8” FDR + 1.5” HMA overlay
• 8” FDR + Double chip seal
• 2.5” CIR + Double chip seal
• 2.5” CIR + 1.5” HMA overlay
• 2” HMA overlay
• Leveling and strengthening course + Single chip seal
• Single chip seal
These sections were evaluated using pavement condition surveys and Falling Weight
Deflectometer (FWD) tests. This project is still in progress to study the long-term performance;
however findings about the construction process during different seasons were published (Yu et
al., 2015). Also, the initial costs of the different strategies were compared to the conventional

55
rehabilitation using a 3-inch HMA overlay. The alternative with FDR surfacing and 1.5-inch
overlay was found to be more expensive than the conventional rehabilitation and it was excluded
from the study. The costs of the other recycling and surfacing strategies were found to be 15%
to 45% lower than the costs of 3-inch overlay. Recently, IDOT developed a preliminary selection
table for agencies based on the desired holding life. The expected holding life for each strategy
was estimated based on the literature. The agencies in Iowa can rely on the rehabilitation
strategies listed in Table 2.15, until the performance of tested roads support these estimations.
Table 2.15: Iowa DOT Preliminary Treatment Selection Table (Yu et al., 2015)
Years of Holding Proposed Treatment
1 scarification + chip seal
2 – 4 CIR + double chip seal
5 – 7 CIR + thin overlay
8 – 10 scarification + interlayer + ultra-thin overlay
2.5 Current Low-Volume Road Engineering Practices
Significant effort has been put forth by different agencies to develop guidelines for the process
of design, construction, and rehabilitation of high-volume roads because of their great value.
Other practices were developed for low-volume roads in an attempt to customize the current
standards and practices to local needs. The following studies are introduced showing
contributions toward cost-effective management systems for low-volume roads.
2.5.1 Practices for Long-Lasting Low-Volume Pavements
In Washington State, a set of six practices was developed and defined to ensure the pavement
will have long-lasting performance on low-volume roads. The advantage of having long-lasting

56
pavements for LVRs is that major rehabilitation and reconstruction projects would be limited.
The maintenance strategies would emphasize periodic surface treatments that prevent top-down
cracking from propagating into the whole depth of pavements, which would optimize the modest
maintenance budgets allocated by state and local agencies on LVRs. Based on an extensive study
on long-lasting low-volume and high-volume pavements owned by the Washington State
Department of Transportation (WSDOT), the following practices were defined for LVRs
(Muench et al., 2007):
2.5.1.1 Low-Volume Road Traffic Loading
In order to apply specific standards on the road as a low-volume road, a maximum amount of
traffic load was defined. Low-volume roads endure less than one million 80 kN (18,000 lb)
equivalent single axle loads (ESAL) over the pavement age of 40 years. This traffic limit was
identified assuming no predicted or planned overweight vehicles over the pavement service life,
such as farm equipment and tractor-trailer trucks.
2.5.1.2 Subgrade Minimum Support Strength
A minimum requirement of subgrade strength should be fulfilled to support long-lasting
pavements. Having enough support for pavements prevents the vertical deformation on the
subgrade surface which is an important criteria for increasing pavement rutting resistance. The
study recommends having a subgrade with a CBR of 10% or more. Specific geotechnical analysis
is performed for subgrades with a CBR less than 10%, and applications of using subbase layers
and stabilization are also implemented.

57
2.5.1.3 Pavement Structure and Mix Design
The study identified minimum thicknesses for pavement structure which enable local agency
practitioners to maintain the surface of pavements more efficiently. Having enough pavement
thickness prevents initiating cracking at the bottom of hot mix asphalt (HMA) layers. It also
allows application of mill-and-inlay rehabilitation on the surface without affecting the bulk of
the HMA layer. Thus, a minimum thickness of five inches for the HMA layer is recommended.
For aggregate base layers, a minimum thickness of six inches is recommended for better
constructability. Other recommendations were presented to provide frost protection. The
pavement structural thickness should be at least 50% of design freeze depth calculated using the
modified Berggren formula in Modberg (free software by Cortez et al., 2006).
Some design standards were recommended for pavement mixtures on low-volume roads.
The purpose was to increase the durability of asphalt and provide a mix design procedure that is
consistent with the local practices. Fine dense-graded mixes were recommended since they are
easier to compact. Also, higher optimum asphalt content was proposed to enhance the durability
by reducing the compactive effort during mix design.
2.5.1.4 Construction Quality & Pavement Preservation
The study recommends including construction quality guidelines developed by the National
Asphalt Pavement Association, Asphalt Institution, and Asphalt Pavement Association of
Oregon, Colorado, and Indiana. Quality control tests should be conducted by the contractor, and
the results should be sent to the owner. Minimum density specifications should be acquired for
each HMA lift which is defined as 92-94% of theoretical maximum density. Also, a minimum
compaction level is proposed to be defined.

58
Pavement preservation is very important since delaying the appropriate treatment could
allow bottom-up cracking to propagate. As a consequence, more expensive rehabilitation will be
required which, in many cases, cannot be afforded by local agencies. The study recommends
apply maintenance strategies in a timely manner. Thin HMA layers with disposable pavements
should be avoided since they commonly deteriorate from the bottom up through subgrade rutting
and traditional fatigue cracking. Also, it was recommended to apply overlays with adequate
thickness in curbed areas to ensure having adequate structure at the pavement’s edges.
2.5.1.5 Financing
Although no specific funding plan is proposed, sufficient funding for low-volume pavement
could be $7,000 to $9,000 per lane-mile not adjusted for inflation. The study emphasizes having
consistent funding so that pavement condition can be preserved without costing much money to
restore it to a predetermined level.
2.5.1.6 Marketing
The study promotes educating public officials about the costs and benefits of long-lasting low-
volume pavements. Communication plans require collecting adequate information about the
existing condition of pavements and the costs to maintain roads. LCCA can provide a more
convincing demonstration of the importance of managing low-volume roads wisely and
efficiently.
2.5.2 Low-Volume Roads Engineering Best Management Practices Field Guide
In 2003, the US Agency for International Development (USAID), in cooperation with USDA
Forest Service International Program and Virginia Polytechnic Institute, developed a
comprehensive field guide to plan, locate, survey, design, construct, and maintain low-volume

59
roads (Keller and Sherar, 2003a). This guide introduces the concept of best management practices
(BMPs). It defines the BMPs as practices that help produce well built, long-term cost-effective
roads that minimize adverse environmental impacts. It combines the concept of addressing the
social and environmental impacts with the persistent need for cost-effectiveness for low-volume
roads. This guide was first developed in Honduras then it was extended by gathering information
worldwide about low-volume roads. The key areas of application for best management practices
were defined in order to have an “environmentally friendly” road (Keller and Sherar, 2003b).
The guide is comprised of the following areas and topics of road management and design:
2.5.2.1 Environmental Analysis
The guide provides an interdisciplinary process to evaluate planning and managing low-volume
roads considering the project environmental impacts. For example, Figure 2.22 shows how the
different alternatives impact the environment. The corresponding ground disturbance, drainage
conditions, surface erosion, and slope stabilization will be significantly different based on the
selected alternative.
Figure 2.22: The Environmental Impact of Two Alternatives during Planning (Keller and Sherar, 2003a)

60
2.5.2.2 Hydrology for Drainage Design
Based on a reasonable design flow, well designed drainage systems are recommended. Figure
2.23 shows the impact of having positive surface drainage and adequately sized and appropriate
drainage crossing structures. Therefore, it is highly recommended to consider the drainage of
roads in the design process, which includes both the surface drainage for controlling the surface
water and subsurface drainage collecting the ground water under roads in natural channels.
Figure 2.23: The Impact of Drainage Design. (a) A poorly drained road with rutting and erosion problems; (b) An armored road surface with positive surface drainage using rolling dips (Keller and Sherar, 2003b)
For roads crossing a water stream, the guide provides recommendations about the design
of cross drainage systems. Culverts can be installed and are commonly used to pass the water
under the roads. These pipes should be large enough to pass the expected flow and they should
be well protected from scour. Another application of water cross drainage is low-water crossings
or what are called “fords”. These types of crossings are applied on low-volume roads where road
use and stream flow conditions are appropriate. Another important consideration is to protect the
downstream from scouring as shown in Figure 2.24. Although this type of drainage can cause
occasional traffic delays, they can be a desirable alternative to culverts and bridges for stream

61
crossings on a low-volume road. The costs would be significantly lower compared to low-water
crossing structures.
Figure 2.24: A low-water crossing with an armored roadway surface in need of additional downstream scour protection (Keller and Sherar, 2003b)
2.5.2.3 Slope Stabilization and Stability of Cuts and Fills
The objective of this topic is to provide recommendations about the stability of slopes for cut and
fill road sections. These recommendations are important in keeping cuts and fills stable over
time, which reduce the costs of repairs and long-term maintenance. The guide also shows some
applications of fixing fill failure surfaces and landslides at lower costs.
2.5.3 Previous Management Efforts for Local Agencies
DOTs have good expertise in pavement management. Numerous pavement management
guidelines and policies have been developed to help local agencies understand the importance of
PMS. Many PMS software packages have been developed for assisting agencies to manage State
highways and higher-standard roads. However, adopting PMS standards for local agencies may
not be cost-effective due to the lack of expertise and the low funding levels. As a result, different

62
studies have introduced simple, effective and affordable PMS for local agencies and
municipalities.
Starting in 2003, local agencies were encouraged to implement the software of
Metropolitan Transportation Commission (MTC) PMS. The software had the ability to modify
information and standards for supporting Governmental Accounting Standards Board (GASB)
34 requirements (Dewan and Smith, 2003). Douglas documented the outlines of PMSs designed
for local agencies (Dogulas, 2011). Management systems at lower sophistication levels were
recommended for introducing pavement management practices. However, the paper did not
provide cost-effective solutions. New York LTAP center developed specific standards for
designing, planning, and maintaining LVRs for local agencies in New York State (Orr, 2009).
Washington DOT conducted a survey for managing LVRs among local agencies in Washington
(White, 2012). The objective was to define the gaps among agencies and to unify the practices
so that inconsistent data sets do not corrupt network-level maintenance decisions. Pavement
condition data was proposed to be collected less frequently for county roads (Hafez et al., 2016).
In this study, the condition data was collected for only 50 percent of the road network. The
uncollected data was estimated as missing data using multiple imputation analysis (Schafer,
1997). The multiple imputation analysis can provide good estimation of the uncollected
pavement-condition data so that the data can be collected at lower costs.
2.6 Summary
Low-volume roads constitute about 70 percent of the U. S. road network, and these roads are
owned by local agencies and state DOTs. Usually, they are defined by maximum traffic volumes
and truck volumes. The appropriate surface type on these roads is selected to fulfil the required

63
local needs of different transportation modes. Several studies have identified the appropriate
engineering, economic, and political issues that should be studied when deciding whether a LVR
should be paved or unpaved. The most significant factors in such decisions are the agencies’
available resources. When designing the pavement of LVRs, AASHTO provided a simplified
design version of the AASHTO design method for flexible pavements. In this modified method,
various parameters can be estimated using standard values without having to implement field and
lab measurements. However, many states have developed specific low-volume pavement design
procedures. These procedures are considered as ‘non-AASHTO’ design protocols and they have
various complexity levels. In general, traffic data and soil strength of the subgrade are the most
common inputs when designing low-volume roads.
Pavement preservation strategies apply low-cost surface and preventive treatments to
extend the service life of the pavement before considerable deterioration. There are numerous
types of preventive maintenance. Chip seal is one of the most common surface treatments applied
on LVRs. The objective of applying surface treatments is to enhance the skid resistance of a
surface by using different layer applications of chip seals and Otta seals. Chip seals are applied
with single-sized aggregates while Otta seals integrate a gradation of aggregates. Another
objective of surface treatment is to fill cracks and voids on the surface by using different
applications of cold asphalt mixes as involved in slurry seals, fog seals, and microsurfacing.
Recycling technologies are being integrated extensively in the maintenance of LVRs. Cold
in-place recycling (CIR) and full-depth reclamation (FDR) are preventive maintenance options
applied to add structural value to the pavement. They allow for reduced costs of pavement
materials by recycling the old asphalt with a percentage up to 100% using emulsion and in-place
mixing equipment. Thin and ultra-thin overlays are applied to reduce the rate of deterioration and

64
not to enhance the structural capacity of severely deteriorated roads. Pavement rehabilitation is
applied to add a new life to older pavement by applying asphalt overlays or reconstructing the
road pavement layers. However, LVRs commonly receive relatively thinner overlays that do not
exceed a 3-inch layer thickness.
State DOTs are making efforts to develop specific maintenance policies for their LVRs.
The objective is to use the most cost-effective preventive maintenance in the pavement
preservation strategies. Most of these DOTs are combining recycling techniques with surface
treatments and chip seals. Strategies of CIR with chip seals or thin overlays were studied and
they can improve the structural status of pavements with lower costs. Using lower nominal
maximum aggregate sizes was also proposed as a way to reduce the thickness of overlays so that
costs can be lowered. Other engineering practices were defined for the pavement of LVRs.
Different standards and criteria were defined for traffic amounts, structural properties, and
construction qualities. These standards support long-lasting LVR pavements where major
rehabilitation and reconstruction projects would be limited. The Low-Volume Roads Engineering
Best Management Practices Field Guide is a comprehensive management guide developed to
plan, locate, survey, design, construct, and maintain low-volume roads. The guide comprises
environmental, hydrologic, and geotechnical issues that should be well investigated while
managing LVRs.

65
Chapter 3: Pavement Management System Survey on Low-Volume
Paved Roads
3.1 Introduction
The WYT2/LTAP is working with Colorado DOT (CDOT) to evaluate maintenance strategies on
LVRs. As part of these projects, an evaluation of current tools and treatments for managing LVRs
was performed. In 2015, CSU and the WYT2/LTAP developed online surveys for transportation
officials responsible for preserving low-volume paved roads in Colorado and nationwide. These
surveys had several questions which solicited information on the respondents’ management of
their LVRs. This study focuses only on the management of low-volume paved roads. The
pavement management program for LVRs is recommended to integrate the most appropriate
techniques resulting in better performance of the network. This report summarizes the responses
and demonstrates the most widely applied practices and strategies recommended by various
states/agencies.
3.2 Survey Methodology
In order to capture the knowledge from various LVRs experts, four online surveys were sent to
transportation professionals with different management/experience types. The four groups
targeted in the surveys are displayed in Figure 3.1. The surveys are listed below:
• A survey for Transportation Research Board (TRB) low-volume roads committee
members
• A regional survey for different state DOTs nationwide
• A survey for local governments in Colorado

66
• A survey for members of the Material Advisory Committee (MAC) in Colorado
Department of Transportation (CDOT)
Figure 3.1: Surveys on PMS of Low-volume Paved Roads
3.2.1 TRB Low-Volume Committee Members Survey
The Transportation Research Board (TRB) committee AFB30 has had a great interest in low-
volume roads since the early 1970s (TRB, 2015). This committee holds International conferences
every four years for LVRs to exchange different experiences among attendants. These
conferences are sponsored by federal agencies in the USA such as: FHWA, Forest Service,
Bureau of Indian Affairs, and Army Corps of Engineers. The objective of the conference is to
exchange experiences among people who are concerned with all aspects of low-volume roads. In
August 2015, the first survey was sent to all TRB low-volume roads committee members and
friends who are concerned with planning, design, construction, safety, maintenance, and
operations on LVRs. This survey was conducted online using the SurveyMonkey® website and
the feedback was received from 36 respondents representing 31 transportation agencies. A
complete list of questions of the survey in addition to the response counts and percentages of
different answers are shown in Appendix A-1 and Appendix A-2.
Surveys
TRB Low-Volume Committee Memebers
Regional DOTs Local Governments in Colorado
CDOT MAC Committee Members

67
3.2.2 Regional Departments of Transportation Survey
State DOTs have various policies for managing their low-volume roads. DOTs try to match
maintenance expenditures to available budgets. The objective of this survey is to highlight
effective policies and recommended practices from various state DOTs. The results of this survey
can provide practical strategies for low-volume roads in Colorado. These strategies provide cost-
effective treatments that can be applied within the available resources. In January 2016, the
following eight DOTs participated in the survey: Arizona, Kansas, Montana, Nebraska, New
Mexico, Texas, Utah, and Wyoming. A complete list of questions of the survey in addition to the
response counts and percentages of different answers are shown in Appendix B-1 and Appendix
B-2.
3.2.3 Colorado Local Governments Survey
Local governments are responsible for the management of some low-volume roads in Colorado.
As mentioned earlier, local governments are not required to implement a typical PMS on their
local roads. Manuals are being developed by state DOTs and FHWA to encourage local
governments to use a PMS. In many cases, the allocated funds for local governments are limited.
In addition, previous experiences of some local governments can provide recommended practices
based on the available resources. As a result, some local governments have their own policies for
managing and maintaining low volume paved roads.
This survey investigates the efforts at the local level. It studies the importance of
implementing specific policies on low-volume paved roads. It identifies appropriate tools and
recommended treatments for LVRs developed by local governments. There are numerous local
governments across the country with a variation in responsibilities and available resources. In
addition, different programs are implemented with different levels of sophistication (FHWA,

68
2015). Therefore, this study focuses on the experience and challenges faced by local governments
in Colorado. In October 2015, the survey was sent to local governments in Colorado and 53
transportation professionals from 32 local agencies in Colorado responded to this survey. The
summary of this survey is presented in Appendix C-1 and Appendix C-2.
3.2.4 CDOT MAC Committee Members Survey
About 9,106 center-lane miles are managed and maintained by CDOT (Redd, 2013). More than
50% of these roads are not considered as NHS. However, CDOT has a transportation asset
management system for different road systems. Recently, CDOT began evaluating the overall
condition of pavements by the Drivability Life (DL) metric. DL is a measure, in years, of how
long a road will have acceptable driving conditions (Redd, 2013). CDOT uses different standards
for DL on different road classifications. DL is determined for asphalt pavement based on a trend
analysis of 5 main distresses (Redd, 2013):
• IRI
• Rutting
• Transverse cracking
• Longitudinal cracking
• Fatigue cracking
All of the previous distresses are normalized into condition indices on a scale of 0 to 100,
100 being the best condition where the pavement is free of distress (Keleman et al., 2005). When
CDOT applied DL-based evaluation, new pavement maintenance strategies were developed. At
network level, LVRs are assigned with two different treatment categories recommended based
on the available funding of the maintenance program. The first treatment category is called
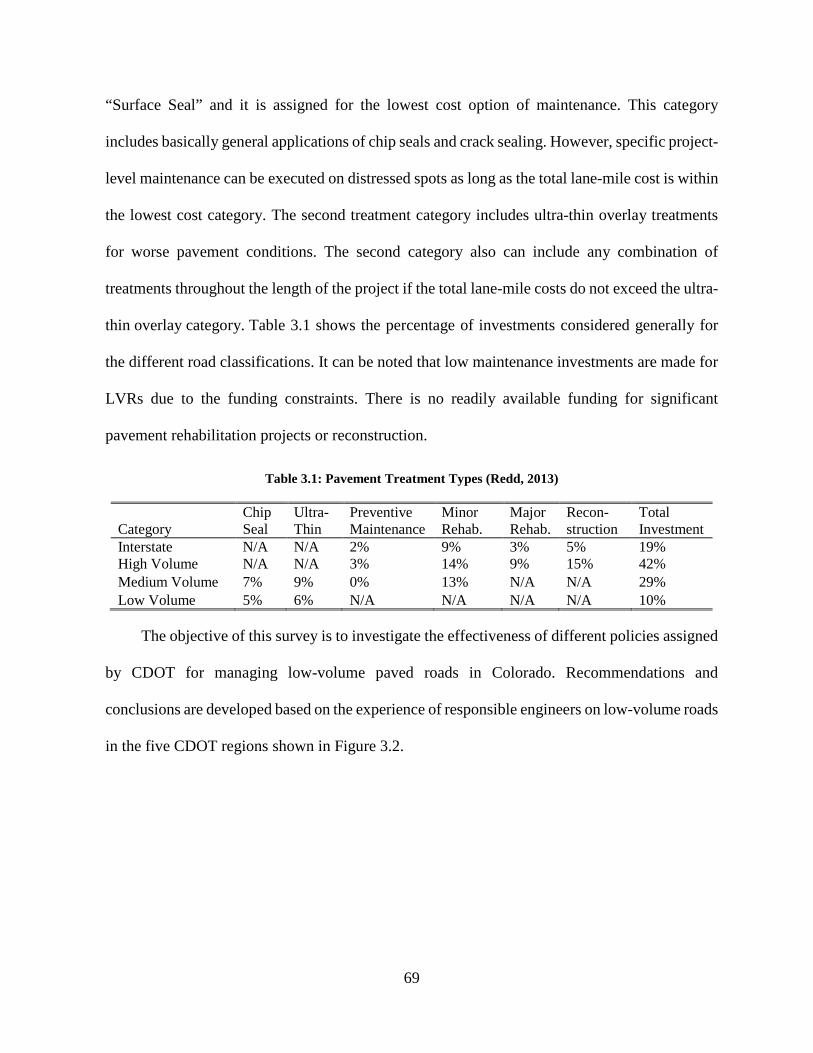
69
“Surface Seal” and it is assigned for the lowest cost option of maintenance. This category
includes basically general applications of chip seals and crack sealing. However, specific project-
level maintenance can be executed on distressed spots as long as the total lane-mile cost is within
the lowest cost category. The second treatment category includes ultra-thin overlay treatments
for worse pavement conditions. The second category also can include any combination of
treatments throughout the length of the project if the total lane-mile costs do not exceed the ultra-
thin overlay category. Table 3.1 shows the percentage of investments considered generally for
the different road classifications. It can be noted that low maintenance investments are made for
LVRs due to the funding constraints. There is no readily available funding for significant
pavement rehabilitation projects or reconstruction.
Table 3.1: Pavement Treatment Types (Redd, 2013)
Category Chip Seal
Ultra-Thin
Preventive Maintenance
Minor Rehab.
Major Rehab.
Recon- struction
Total Investment
Interstate N/A N/A 2% 9% 3% 5% 19% High Volume N/A N/A 3% 14% 9% 15% 42% Medium Volume 7% 9% 0% 13% N/A N/A 29% Low Volume 5% 6% N/A N/A N/A N/A 10%
The objective of this survey is to investigate the effectiveness of different policies assigned
by CDOT for managing low-volume paved roads in Colorado. Recommendations and
conclusions are developed based on the experience of responsible engineers on low-volume roads
in the five CDOT regions shown in Figure 3.2.

70
Figure 3.2: Low-Volume Roads in CDOT Regions (Atadero and Ksaibati, 2015)
In September 2015, the survey was disseminated online using the SurveyMonkey® website
to the CDOT MAC committee. Eight MAC members out of nine participated in this survey. A
copy of the survey is provided in Appendix D-1 and Appendix D-2 shows the response counts
and percentages for the different answers.
3.3 Survey Sections
The surveys have 4 sections covering most relevant aspects of managing and maintaining low-
volume paved roads. An additional section was provided for the CDOT MAC survey. The
sections are introduced as follows:
3.3.1.1 Low-Volume Paved Road Definition
This section is to identify an appropriate definition of low-volume paved roads that should be
considered when managing roadway networks.

71
3.3.1.2 Data Collection & Inspection Survey
This section provides recommendations about kinds of pavement management data that should
be collected for managing low-volume paved roads.
3.3.1.3 Treatment Strategies
This section studies the expected service lives of common treatment options. It also provides
recommendations about the decision making process and cost-effective treatments.
3.3.1.4 Resources Optimization
The objective from this section is to investigate the importance of applying optimization
analysis. In addition, the section provides recommendations on pavement management
parameters that should be considered in the optimization strategy of the whole low-volume
network.
3.3.1.5 CDOT Policies on Low-Volume Roads
This section is for the CDOT MAC survey only. The objective is to evaluate the effectiveness
of current CDOT policies on maintaining low-volume roads based on DL.

72
Chapter 4: Survey Data Analysis
This chapter introduces the results from the surveys. All relevant responses were combined from
the four surveys to provide comprehensive information about PMS for managing LVRs. These
findings are summarized in the sections below.
4.1 Section 1: Low-Volume Paved Road Definition
The first step is to define which roads are considered as LVRs. Nine DOTs, including CDOT, 34
TRB committee members, and 30 local governments in Colorado reported that they have upper
limits of Average Daily Traffic (ADT) for LVRs. As shown in Table 4.1, most agencies and
DOTs rely on the definition of the MUTCD which considers an ADT value of 400 vehicles per
day as a maxim traffic volume for LVRs. However, other participants mentioned higher traffic
volumes.
Table 4.1: Traffic Volume Considerations for Low-Volume Paved Roads (73 responses)
Upper Limit of Average Daily Traffic (ADT)
(vehicles per day)
Response Count
TRB committee State DOTs Local Governments
400 17 KS, MT, NE, WY 18 500 5 NM, TX 2 1000 5 UT 6 1500 1 -- 2 2000 5 CO 2 5000 1 AZ 0 Number of Responses 34 9 30 Skipped 2 0 5
NOTE: DOTs = Departments of Transportation
As shown in Figure 4.1, there is a direct relationship between statewide average traffic
volumes and the responses of the DOTs for LVRs definitions. It can be noted that higher
definitions for LVRs traffic volumes are selected when the states have higher ranges of traffic
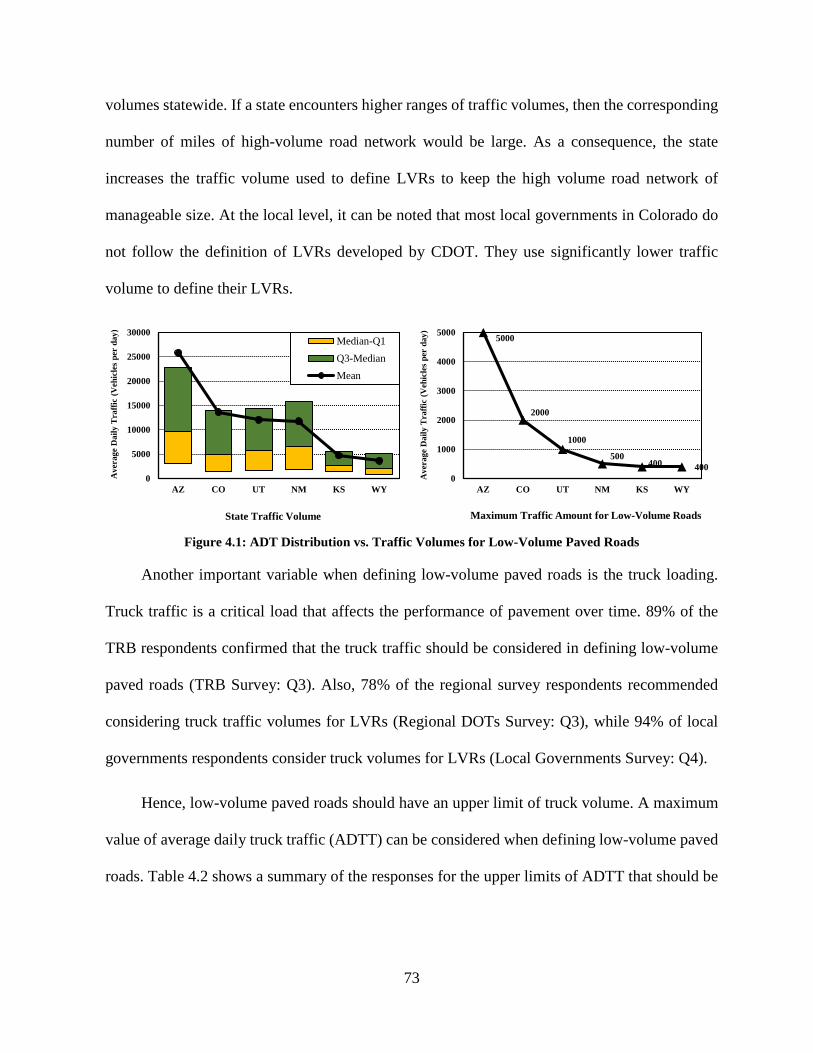
73
volumes statewide. If a state encounters higher ranges of traffic volumes, then the corresponding
number of miles of high-volume road network would be large. As a consequence, the state
increases the traffic volume used to define LVRs to keep the high volume road network of
manageable size. At the local level, it can be noted that most local governments in Colorado do
not follow the definition of LVRs developed by CDOT. They use significantly lower traffic
volume to define their LVRs.
Figure 4.1: ADT Distribution vs. Traffic Volumes for Low-Volume Paved Roads
Another important variable when defining low-volume paved roads is the truck loading.
Truck traffic is a critical load that affects the performance of pavement over time. 89% of the
TRB respondents confirmed that the truck traffic should be considered in defining low-volume
paved roads (TRB Survey: Q3). Also, 78% of the regional survey respondents recommended
considering truck traffic volumes for LVRs (Regional DOTs Survey: Q3), while 94% of local
governments respondents consider truck volumes for LVRs (Local Governments Survey: Q4).
Hence, low-volume paved roads should have an upper limit of truck volume. A maximum
value of average daily truck traffic (ADTT) can be considered when defining low-volume paved
roads. Table 4.2 shows a summary of the responses for the upper limits of ADTT that should be
0
5000
10000
15000
20000
25000
30000
AZ CO UT NM KS WY
Ave
rage
Dai
ly T
raffi
c (V
ehic
les
per
day)
State Traffic Volume
Median-Q1Q3-MedianMean
5000
2000
1000
500400 400
0
1000
2000
3000
4000
5000
AZ CO UT NM KS WY
Ave
rage
Dai
ly T
raffi
c (V
ehic
les
per
day)
Maximum Traffic Amount for Low-Volume Roads

74
considered for LVRs. Most of the responses rely on the definition by MUTCD for ADTT values
of 50 vehicles per day.
Table 4.2: Truck Traffic Volume Consideration for Low-Volume Paved Roads (61 responses)
Upper Limit of Average Daily Truck Traffic (ADTT)
(vehicles per day)
Response Count
TRB committee State DOTs Local Governments
No Limit 4 AZ, NE 2 50 15 NM, UT, WY 16 100 6 KS, CO 5 150 2 -- 3 200 4 TX, MT 0 Other 1 -- 2 Number of Responses 32 9 28 Skipped 4 0 7
NOTE: DOTs = Departments of Transportation
4.2 Section 2: Data Collection & Inspection Survey
The basic step in building a pavement management system is data collection, and there are
different kinds of data that can be collected. For the purpose of managing low-volume paved
roads, some of these data may not be needed. Sometimes, they don’t provide any useful
information to the decision making process. Collecting these data would lead to spending
unnecessary money and effort in building the pavement management database for low-volume
paved roads. Therefore, the survey asked about kinds of data that should be collected when
managing and maintaining low-volume paved roads. The response rate for this part was 88% for
all surveys. Figure 4.2 shows the responses in each survey for three main types of data; Traffic
counts, structural data, and pavement condition. All nine state DOTs, including CDOT, collect
pavement condition data. All TRB respondents recommended collecting pavement condition
data. However, funding constraints resulted in only 58% (14 responses) of local governments in
Colorado recommending collecting condition data. In addition, pavement condition data is very

75
complex and needs tools requiring expertise to operate and understand (Douglas, 2011). Local
agencies, lack the required expertise to collect/analyze pavement condition data on low-volume
paved roads.
Figure 4.2: Pavement Management Data Collection for Low-Volume Paved Roads
Of the eight participating states, Arizona and New Mexico DOTs do not collect traffic data
on LVRs. Ninety-four percent (30 responses) of TRB committee members recommended
collecting traffic data for the LVRs PMS. As shown in Figure 4.3, most responses from the TRB
survey recommended collecting actual traffic volumes. It is commonly known that pavement has
different deterioration rates depending on major factors such as traffic and truck volumes. Traffic
can be reasonably predicted for low-volume roads where there are not significant changes in the
traffic volumes or patterns. However, it was found that counting actual traffic volumes is
recommended rather than using different algorithms to predict current and future traffic volumes.
81% of respondents recommended actual traffic volumes, and 41% recommended predicted
volumes. Some responses mentioned other kinds of traffic data such as non-motorized and
94%
75% 79%81%
62%
79%
100% 100%
58%
0%
20%
40%
60%
80%
100%
TRB Committee State DOTs Local Governments
Traffic Counts Strucutral Data Pavement Condition

76
pedestrian volumes. Another response mentioned a specific practice of counting traffic where
ADT can be calculated based on a 15-minute count during a specific time of the day.
Figure 4.3: Recommended traffic data for managing low-volume paved roads (TRB Survey: Q6)
It was also found that the structural data is an important type of data for managing low-
volume paved roads with an agreement of 81% of TRB members (26 responses), 63% of
participating states (5 state DOTs) and 79% of local governments in Colorado. For the structural
data, Figure 4.4 shows the most common parameters collected as an indication of the structural
quality for low-volume paved roads. Pavement thicknesses and material characteristics are the
most recommended structural data collected for managing low-volume paved roads (90% and
87% respectively). At the network level, non-destructive instruments are used to determine
pavement thicknesses. One of those instruments is known as Ground Penetrating Radar (GPR).
The radar waves are directed into the ground. Then pavement thicknesses are determined based
on the time required for the return of any reflected signals (NCHRP, 1998). In addition, 43% of
respondents selected collecting the deflection data obtained from a FWD test to study the
structural quality for low-volume paved roads. However, it was also mentioned that the FWD
test is only useful for highways with higher truck traffic.
81%72%
41%
13%
0%
20%
40%
60%
80%
100%
Actual traffic volumedata
Truck Traffic Predicted trafficvolume data
Other

77
For the pavement condition data, Figure 4.5 shows a list of the most commonly used
condition indices utilized for low-volume paved roads. Pavement Condition Index (PCI) is the
most widely recommended index among respondents. However, only New Mexico and
Wyoming DOTs collect PCI data. It can be noticed that PCI, International Roughness Index
(IRI), and rut measurements are the most recommended condition indices. Surface Rating (SR)
and Pavement Surface Evaluation Rating (PASER) are more common for LVRs as a visual
inspection survey.
Figure 4.4: Recommended structural data for managing low-volume paved roads (TRB Survey: Q7)
90% 87%
43%
13%
0%
20%
40%
60%
80%
100%
Pavement thicknesses Pavement materialcharacteristics (suchas soil classification
and strength)
FWD – Falling Weight Deflectometer
data
Other

78
Figure 4.5: Condition Indices Used for Low-Volume Paved Roads
In addition, the surveys included questions intended to identify the method and frequency
of collecting PMS data. Two methods are commonly used for data collection: manual and
automated methods. They may be used alone or in conjunction with one another. Five state DOTs
collect condition data on LVRs automatically. The other state DOTs collect data using a
composite system of manual and automated techniques. At the local level, only 7% of local
governments collect data automatically. Figure 4.6 shows the most accepted data collection
frequencies among agencies for LVRs. Although LVRs have relatively low deterioration rates
compared to high-volume roads, collecting data annually was recommended by 35% of
respondents (18 responses). Reducing the frequency of data collection was acceptable to 65% of
3
7
7
4
6
9
6
11
8
10
12
16
1
3
4
1
5
1
7
8
2
1
1
2
2
1
1
3
5
2
1
5
0 5 10 15 20 25
PSR – Present Serviceability Rating
PQI – Pavement Quality Index
PSC – Pavement Structural Condition
OPI – Overall Pavement Index
PSI – Present Serviceability Index
CRS – Condition Rating Survey
DI – Distress Index
PASER – Pavement Surface Evaluation Rating
SR – Surface Rating
RUT – Rut depth
IRI – International Roughness Index
PCI – Pavement Condition Index
Response Count
TRB Committee State DOTs Local Governments

79
respondents (33 responses). Montana DOT selected a frequency up to 5 years. Some local
governments mentioned that they collect the condition data as needed.
Figure 4.6: Data Collection Frequency of Pavement Condition Data
4.3 Section 3: Treatment Strategies
Some agencies provide specific policies for the process of maintenance and rehabilitation on low-
volume paved roads. Different treatments are identified for roads based on different methods.
One of the simplest decision making process in PMSs is using decision trees or trigger values.
The survey asked about the importance of using a decision tree for selecting M&R treatments.
For the TRB survey, 82% of respondents recommended using a decision tree to identify
pavement treatments for low-volume paved roads (TRB Survey: Q10). The rest of respondents
think that treatments may be defined on low-volume roads directly without taking different
variables into consideration in a decision tree. This kind of decision making may be used when
agencies have fewer options. Some agencies have only one or two treatment options allowed on
LVRs .
3
5
5
7
8
1
4
4
4
1
2
1
6
0 5 10 15 20
Other
Every 4 years
Every 3 years
Every 2 years
Every year
Response Count
TRB Committee State DOTs Local Governments

80
Figure 4.7 presents the variables recommended for inclusion in decision trees. It can be
noticed that traffic-based treatments is the most accepted strategy when managing LVRs by 86%
of respondents (19 responses were received for ADTs). Fifty percent of respondents (11
responses) consider pavement conditions, represented by PCI, for decision trees.
Figure 4.7: Recommended Variables for a Decision Tree (TRB Survey: Q11)
The state DOTs survey asked about the most important maintenance policy followed by the
state. Four state DOTs indicated that they have specific polices when it comes to managing
LVRs. Most states’ policies depend on road classification. There is a lack of adequate funding to
consider all possible treatments. Consequently, surface treatments such as crack sealing, chip
seals, and surface repairs are widely applied to LVRs. The local government survey revealed that
2
2
3
3
3
4
5
6
7
7
11
13
13
15
17
19
0 2 4 6 8 10 12 14 16 18 20
PSC – Pavement Structural Condition
PSR – Present Serviceability Rating
PSI – Present Serviceability Index
DI – Distress Index
SR – Surface Rating
PQI – Pavement Quality Index
CRS – Condition Rating Survey
RUT – Rut depth
IRI – International Roughness Index
PASER – Pavement Surface Evaluation Rating
PCI – Pavement Condition Index
Pavement Age
Maintenance History
Average Daily Truck Traffic (ADTT)
Road Classification
Average Daily Traffic (ADT)
Response Count

81
75% of local agencies in Colorado do not follow CDOT’s policy for maintaining LVRs. Chip
seal is applied by some of the local agencies in a periodic manner every 5 to 7 years. Other
agencies apply treatments which should not exceed a thickness of 1.5 inches. Overlays are limited
and some local governments have policies of applying overlays every 15 years or as funds are
available.
It is clear from most survey responses that treatment strategies for LVRs are affected
considerably by funding levels. Most agencies avoid applying expensive treatments on low-
volume paved roads. However, the previous experience of pavement managers show that
inexpensive strategies are not very effective. As shown in Figure 4.8, 67% of regional survey
participants (6 state DOTs) and 49% of local government participants do not think that
eliminating expensive treatments provides cost-effective solutions.
Figure 4.8: Effectiveness of Eliminating Expensive Treatments on LVRs
For current treatment policies, Figure 4.9 shows the most common treatments applied to
LVRs. It is clear that chip seal is the most widely used treatment by agencies. Thin overlays with
17%
49%
34%
Local Governments
33%
67%
State DOTs
YesNoDo not know
Do you think that eliminating expensive treatments provides cost-effective strategies for maintaining low-volume paved roads?

82
thicknesses less than 1.5 inches are the most common pavement rehabilitation applied on low-
volume paved roads. Respondents that selected other treatments mentioned applying slurry seal,
Hot In-Place Recycling (HIR), and another application of chip sealing using recycled materials.
Figure 4.9: Treatments Allowed on Low-Volume Paved Roads
The identified LVRs treatments were further investigated. The surveys asked about the
expected service life of each treatment option. Results were received from the TRB low-volume
roads committee, regional DOTs, local governments, and CDOT MAC committee. The responses
were combined together as shown in Figure 4.10. The results show that chip seal has anticipated
service life ranging from 3 to 8 years. Crack seal and crack fill are commonly serviceable for a
period from 3 to 5 years.
2
1
5
6
4
5
7
6
8
9
1
1
3
4
9
14
12
18
22
24
0 5 10 15 20 25 30 35
Other
Thick Overlay (over 4")
Micro-surfacing
Rut Fill
Full Pavement Reconstruction
Medium Overlay (between 1.5" and 4")
Thin Overlay (1.5" or less)
Crack Fill
Crack Seal
Chip Seal
Response Count
State DOTs Local Governments

83
Figure 4.10: Expected Service Lives of Treatments Applied on LVRs (67 Responses)
The surveys also investigated the effectiveness of treatments on severely distressed
pavements for low-volume paved roads. Usually, when a low-volume paved road deteriorates to
a very poor level, agencies may not be able to afford full pavement reconstructions. Some kind
of surface treatment is applied instead, to increase the remaining service lives of low-volume
paved roads. The survey asked if this strategy is effective on severely distressed roads. According
to the results shown in Figure 4.11, surface treatments were found to be not effective by most
participants. Forty-one percent of respondents (22 respondents) are convinced that thin overlays
with a thickness less than 1.5 inches are effective treatments on severely distressed roads. Most
5
9
4
18
19
5
9
21
4
9
30
32
21
4
19
9
2
9
19
8
10
22
9
8
3
2
18
10
13
31
2
50
21
8
5
22
24
24
13
14
17
11
5
0 20 40 60
Thick Overlay (over 101.6 mm)
Micro-surfacing
Rut Fill
Full Pavement Reconstruction
Medium Overlay (between 38.1 mm and101.6 mm)
Thin Overlay (38.1 mm or less)
Crack Fill
Crack Seal
Chip Seal
Response Count
Less than 3 years 3 - 5 years
6 - 8 years 9 - 10 years
more than 10 years Do not know/Do not use
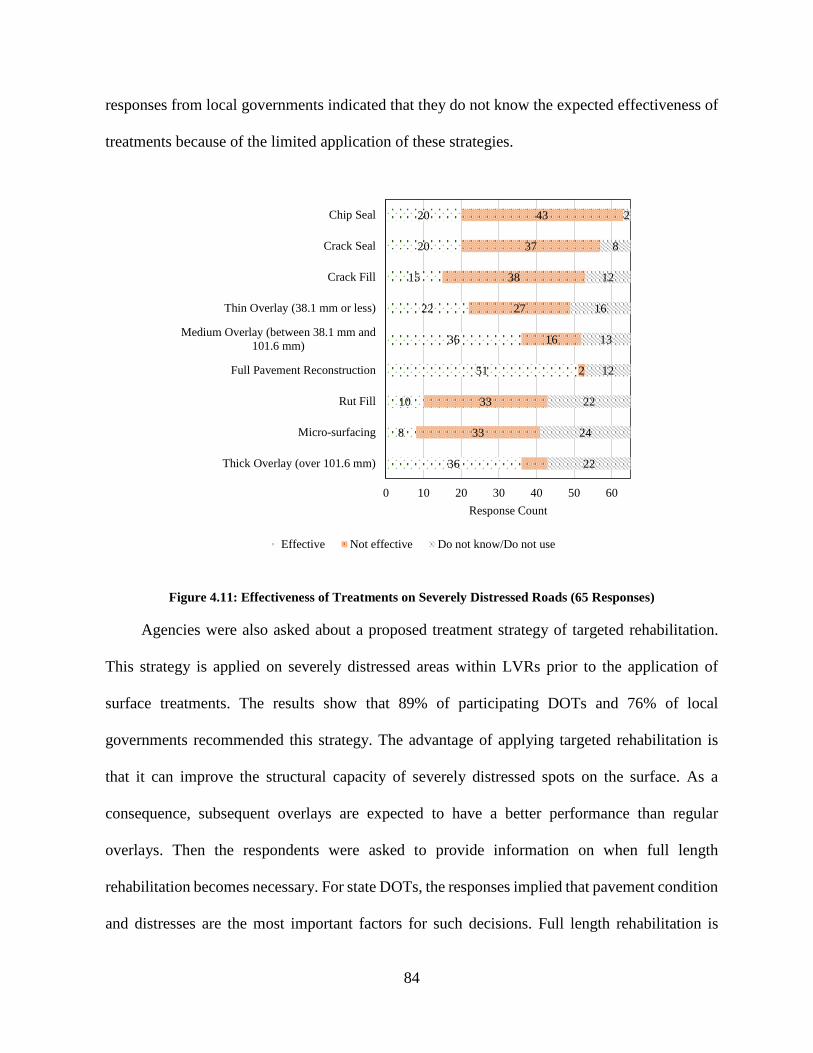
84
responses from local governments indicated that they do not know the expected effectiveness of
treatments because of the limited application of these strategies.
Figure 4.11: Effectiveness of Treatments on Severely Distressed Roads (65 Responses)
Agencies were also asked about a proposed treatment strategy of targeted rehabilitation.
This strategy is applied on severely distressed areas within LVRs prior to the application of
surface treatments. The results show that 89% of participating DOTs and 76% of local
governments recommended this strategy. The advantage of applying targeted rehabilitation is
that it can improve the structural capacity of severely distressed spots on the surface. As a
consequence, subsequent overlays are expected to have a better performance than regular
overlays. Then the respondents were asked to provide information on when full length
rehabilitation becomes necessary. For state DOTs, the responses implied that pavement condition
and distresses are the most important factors for such decisions. Full length rehabilitation is
36
8
10
51
36
22
15
20
20
33
33
2
16
27
38
37
43
22
24
22
12
13
16
12
8
2
0 10 20 30 40 50 60
Thick Overlay (over 101.6 mm)
Micro-surfacing
Rut Fill
Full Pavement Reconstruction
Medium Overlay (between 38.1 mm and101.6 mm)
Thin Overlay (38.1 mm or less)
Crack Fill
Crack Seal
Chip Seal
Response Count
Effective Not effective Do not know/Do not use
85
necessary for roads having severe pavement roughness, rutting, and distresses. At the local level,
treatment costs, pavement condition, and agencies’ policies are the factors affecting such
decisions. Other participants of local governments mentioned that this is a decision determined
by road managers and the chief engineer since these sorts of rehabilitation may not be allowed.
4.4 Section 4: Resources Optimization
Optimization models are mathematical programming techniques which are used to provide
recommendations for maintenance, rehabilitation, and reconstruction (MR&R) strategies.
MR&R strategies should maximize the overall benefits associated with maintenance
expenditures. This section of the survey was designed to collect recommendations pertaining to
optimization analysis on low-volume paved roads. Eighty-five percent of TRB participants and
all participating DOTs and local agencies responded affirmatively about the importance of
utilizing optimization analysis when selecting treatments on LVRs. Figure 4.12 displays
parameters and objectives recommended in optimization analysis. Participants were able to select
multiple responses. Since all MR&R strategies are constrained with the network-level budgets,
68% of respondents recommended optimizing budgets on LVRs. The most important objective
was found to be maximizing Remaining Service Life (RSL) (68% of respondent selected
Maximizing RSL). Pavement condition can also be optimized by applying treatments. PCI was
found to be the most recommended condition index to be maximized.

86
Figure 4.12: Recommended Objectives in Optimization Strategies (51 Responses)
At the end, the survey asked the participants about how the total available budget should
be distributed on the full network. Respondents were asked to assign funds to three condition
levels: 1) worst segments, 2) rapidly deteriorating segments, and 3) segments requiring routine
maintenance. Figure 4.13 shows recommendations about budget assignments to the three
condition levels. Since slightly different responses were received, the recommended percentages
were computed using a weighted average. The TRB survey results show that the budget can be
equally divided among the three parts. The state DOTs participants think that relatively more
investments should be allocated to roads having rapid deterioration rates. At the local level, local
governments assigned relatively higher budget to routine maintenance because of the lack of
funding available for extensive repair and rehabilitation.
2
4
3
8
18
14
6
5
4
2
7
7
1
3
8
12
10
14
0 5 10 15 20 25 30 35
Minimizing IRI – International Roughness Index
Minimizing RUT – Rut depth
Maximizing PSI – Present Serviceability Index
Maximizing PCI – Pavement Condition Index
Maximizing Remaining Service Life
Optimizing Budgets
Response Count
TRB Committee State DOTs Local Governments

87
Figure 4.13: Budget Assignments on Different Condition Levels (48 Responses)
4.5 CDOT’s Policy on Low-Volume Paved Roads
Since CDOT has a policy of applying low-cost treatments on low-volume paved roads even if
the DL is low, the survey asked if the participants agree with that policy. Fifty percent of
participant don’t agree with that policy (CDOT Survey: Q5). In addition, 40% of respondents
don’t think that eliminating expensive treatments provides cost-effective alternatives on LVRs
(CDOT Survey: Q14). The location of LVRs seems not to be the reason of rejecting that policy.
The following question asked respondents about their reasons and how this policy should be
changed to better manage low-volume paved roads (CDOT Survey: Q6). Some of the respondents
mentioned that applying thin overlay treatments are not always effective. The minor treatments
present short-term effectiveness on LVRs with low DL values. The justification of selecting such
treatments is the funding constraints on LVRs. Another respondent stated that the policy does
not need to be changed. Instead, a prior surface treatments can be applied before overlaying.
The survey investigated how the new policy affected decisions about maintaining low-
volume paved roads (CDOT Survey: Q7). Some responses mentioned there are some changes for
31%
34%
35%
TRB LVRs Committee
Worst segments Rapidly deteriorating segments Segments requiring routine maintenance
27%
40%
33%
State DOTs
30%
31%
39%
Local Governments

88
the decision making process. In the context of the DL evaluation metric, the treatment type should
enhance the smoothness of the pavement surfaces. For low-volume paved roads, there are
funding-related issues. New treatment options are developed focusing on surface treatments
rather than structural improvements. It was found that DL can be improved using cheaper
treatments such as chip seal. However, another respondent argued that these kinds of treatments
have a short-term effect.
For the targeted rehabilitation strategy, all participants of the CDOT survey recommend
this strategy (CDOT Survey: Q12). The survey then asked about the appropriate time when full
length rehabilitation becomes necessary (CDOT Survey: Q13). It was mentioned that the
combined costs of targeted rehabilitation and surface repairs, sometimes, are more than the costs
of full length rehabilitation when road distresses are extensive. Another important consideration
for full length rehabilitation is the rate of deterioration and the available budget. The severely
distressed areas are expected to have higher deterioration rates. Therefore, the full length
rehabilitation was highly recommended in these situations especially if the treatment cost can fit
in the available budget.

89
Chapter 5: Conclusions
This report provides a comprehensive review of the best practices utilized by various
transportation agencies to effectively manage and maintain low-volume roads (LVRs). The
limited availability of financial resources encouraged many agencies to study and investigate the
effectiveness of applying alternative maintenance strategies on their low-volume paved roads.
5.1 Literature Conclusions
The following summarizes the conclusions from the literature:
• Low-volume roads are extensively distributed in rural communities and low-population
areas. They comprise the vast majority of the United States road network. However, these
roads are owned by local governments and state DOTs which suffer from funding
constraints, and they have a considerable maintenance backlog for maintaining optimal
serviceability on roads.
• Various states have their own pavement design procedures for low-volume paved roads.
They deal very effectively with different input variables required for the pavement design
process. Traffic data and soil strength of the subgrade are the most common inputs when
designing LVRs. Most of the design procedures follow the principles of the AASHTO
design method, but they were simplified to the restricted capabilities of local agencies. It
was revealed that most of these procedures, however, have different levels of complexity
and the input variables are not readily available to some agencies.
• Maintenance decisions for LVRs are initially investigated in the context of “to pave or
not to pave”. In some cases, the decision of upgrading aggregate-surfaced roads likely

90
requires greater investment than continuing to maintain the aggregate of the surface. Also,
some LVRs may have issues that recommend converting the pavement into an aggregate
surface. The decision of selecting the appropriate surface type should be investigated
from engineering; economic; and political stand points.
• In the context of pavement preservation strategies, numerous research studies have
emphasized the cost-effectiveness of applying low-cost and surface treatments as a
preventive maintenance. However, they should be applied to roads where the pavement
is still performing well. The preventive strategies include sealing practices such as chip
seals. Chip seals are the most commonly applied surface treatment. On-site pavement
rehabilitations using recycling techniques are also implemented as preventive
maintenance strategies which provide lower-cost materials and better construction
practices for LVRs.
• When applying preventive maintenance on severely distressed low-volume paved roads,
these strategies have different effectiveness depending on the initial pavement
performance and the surrounding environment. Some of the applied treatments may
provide only short-term effectiveness and agencies make unnecessary expenditures when
applying these strategies.
• Innovative techniques combining surface treatments and pavement rehabilitation are
being investigated extensively. The recycling technologies in cold in-place and full depth
reclamation techniques enable agencies to add structural value to the deteriorated
pavement. When integrating these techniques with surface treatments such as chip seals,
the performance of the rehabilitated pavement is expected to extend the life of the

91
pavement. These strategies are very interesting since they provide cost-effective solutions
to deteriorated LVRs.
5.2 Surveys Conclusions
The PMS survey responses of the TRB low-volume roads committee, eight DOTs, local
governments in Colorado, and CDOT MAC committee surveys were summarized. The findings
provide transportation agencies nationwide with comprehensive guidelines for managing LVRs.
They also provide feedback about the effectiveness of common treatment strategies applied on
LVRs by different states at different management levels. The participants emphasized the need
for some innovative techniques recommended for LVRs. The responses of the surveys lead to
the following conclusions:
• LVRs have different traffic volume ranges among states. Transportation agencies are
encouraged to consider appropriate traffic volumes and truck volumes for LVRs
depending on the traffic volume distribution in their jurisdictions.
• Traffic, maintenance history, and structural data are important to collect when building a
PMS database for low-volume paved roads. These kinds of data will help agencies
identify treatments that have direct beneficial impact on the LVR network.
• Although traffic volumes can be determined using reasonable prediction models, it is
more often recommended that actual traffic and truck volumes be collected.
• The most common structural data are collected at the network level using nondestructive
techniques. The structural status of pavements is commonly represented using two
practices. The first practice is by measuring the thicknesses of pavement layers using

92
Ground Penetrating Radar (GPR) and determining pavement material characteristics. The
second practice is by evaluating the structural quality using FWD deflection tests.
• Pavement condition data should be collected at the network level. PCI, IRI, and rut depths
are the most common condition data as measured indices, whereas PASER is the most
common visual inspection survey.
• Data collection frequency can be reduced to optimize costs of data collection. The rate of
pavement deterioration is low on LVRs and there is no need to collect the condition data
annually.
• Decision trees are recommended to be used for selecting treatments. Trigger values of
traffic volumes, road classification, maintenance history, and PCI values can be
considered in the decision tree. Traffic volumes have the highest impact to select
treatments on LVRs.
• Among treatment strategies implemented by agencies at different management levels,
LVRs are commonly applied with specific maintenance strategies. The lack of adequate
funding forces agencies not to consider all possible and recommended treatments on
LVRs. The most common maintenance strategies on LVRs are surface treatments, such
as: crack sealing, chip seals, and surface repairs. They are widely applied while overlays
should not exceed a thickness of 1.5 inches.
• Local governments have their own objectives for LVRs and they do not usually follow
state DOT’s maintenance policies. Chip seals are commonly applied on a frequency from
5 to 7 years. Overlays are applied when surgical repairs are needed; however, overlay
application is very limited and is applied every 15 years or as funds are available.

93
• Although most agencies are avoiding applying expensive treatments on LVRs, they
believe that low-cost treatments are not always effective based on their previous
experience.
• Different kinds of treatments have common service lives when they are applied to LVRs.
Surface treatments can extend the service life of pavements up to eight years while
rehabilitation options have service lives more than 10 years.
• Although some agencies apply a thin overlay on severely damaged roads, it may not be
an effective treatment. The surface minor treatments and light rehabilitations on poor
roads are more likely to have only short-term effectiveness in enhancing the performance
of pavements.
• Based on the previous experience of state agencies, pre-overlay treatments and targeted
rehabilitations exhibit better performance of the overlaid pavement layers on LVRs. This
strategy can cost-effectively extend the service life of overlays without having to apply
another layer of asphalt pavement. However, full-length pavement rehabilitation is more
recommended when severe roughness and rutting are extensively distributed on the LVR
pavement surfaces.
• Optimization analysis is highly recommended for identifying MR&R strategies on low-
volume paved roads. Maximizing remaining service lives within available budgets is the
most important objective in optimization strategies.
• Five condition indices were considered in managing LVRs in Colorado when CDOT
started evaluating the pavements in terms of DLs. The maintenance decisions are
commonly taken based on Fatigue and Longitudinal indices. However, some maintenance

94
strategies are applied to increase the overall drivability life taking all conditions into
consideration.
• The DL- based evaluation process provides higher estimates of pavement service lives.
Therefore, treatment options focus more on surface treatments compared to structural
enhancement recommended from RSL-based evaluation processes.
• Based on the experience of CDOT MAC members, The CDOT policy of low-cost
treatments on LVRs provides short-term effectiveness on roads with low DL values. The
funding constraints are the controlling factor for applying low-cost and surface treatments
on deteriorated low-volume paved roads.

95
Chapter 6: Recommendations to Colorado DOT
Based on the findings of this report, it is highly recommended for CDOT to identify the specific
needs and desired benefits from managing LVRs. All practices have different impacts depending
on the expected outcome for both CDOT and road users. However, this report provides the
following recommendations for consideration:
• For LVRs, the concept of limiting ADT to a value of 2000 vehicles per day and ADTT
to a value of 100 vehicles per day is an appropriate consideration in Colorado due to the
high amounts of traffic statewide.
• Since CDOT provides a unique process of evaluating the condition of pavements using
drivability life metrics, roughness is an important criteria affecting driving conditions. As
a result, smoothness should be more emphasized on low-volume pavement surfaces to
increase the drivability life. That is, CDOT is recommended to include treatments that
have significant effectiveness on road roughness.
• A practice for evaluating the structural quality of pavements should be defined on LVRs.
• It is recommended to lower the frequency of collecting condition data when costs of data
collection affect CDOT’s LVRs management budgets. There is no need to collect the
pavement distresses and roughness data annually on LVRs. The condition indices can be
determined every other year. The cost savings can be used to apply more treatments on
LVRs.
• A maintenance decision tree is recommended to be developed for LVRs in Colorado. The
treatment type should not be selected based on the overall drivability value. Instead, the
decision should be based on the five condition indices.

96
• The maintenance of chip seals and ultra-thin overlays are expected to be cost-effective as
long as the road is in good DL categories. When a LVR falls into poor drivability
conditions, a combination of treatments within the available total lane-mile costs can be
applied to add a structural value to the pavement. However, the potential impact of these
combinations need to be investigated before application.
• Because of the limitation of applying low-cost treatments on LVRs in Colorado,
innovative maintenance alternatives are recommended to be considered for severely
deteriorated pavements.
• CDOT is advised to study the potential cost-effectiveness on the drivability conditions
when applying some in-practice innovative surface treatments on LVRs. Light
rehabilitation techniques using recycling technologies can be combined with surface
treatments or sealing practices. For example, cold in-place recycling may enhance the
performance of the applied ultra-thin overlays and extend the drivable life of poor LVRs.
• Other innovative treatments are also recommended to be evaluated on LVRs. Applying
chip seals over paving fabrics has the potential to reduce reflective fatigue cracking in the
newly applied overlays or chip seals. Another technique includes applying absorbing
membranes such as fiber mat or rubberized asphalt binder. This technique increases the
flexibility of pavement surfaces and enhances the ability to relieve stresses on the
pavement layer. Some of these practices still need further investigation.
• Pre-overlay treatments are recommended to be applied on roads restricted by low funding
amounts to enhance the effectiveness of inexpensive surface treatments. Also, targeted
rehabilitation before applying overlays is recommended to be evaluated. This technique
could increase the structural quality of the deteriorated spots and enhance the overall
97
performance of the applied overlays so that an overlay can last longer compared to the
regular practice applied on LVRs.
• Further research is needed to document the cost-effectiveness of the proposed treatment
options. CDOT is advised to compare between current and all future treatments proposed
for LVRs using life-cycle cost analysis and not initial construction costs. However, the
limited funding on LVRs may continue to restrict CDOT’s maintenance decisions on
LVRs.
• Maintenance strategies on the LVRs are recommended to be identified using optimization
analysis. A state-wide optimization tool is recommended for LVRs to maximize the
overall weighted drivability life given the budgets constraints. CDOT is also advised to
develop multi-year maintenance plans to determine the requirements for capital
improvement plans (CIP) for all treatments that are in place or recommended for LVRs.

98
References
AASHTO. (1993). AASHTO Guide for Design of Pavement Structures. American Association of State Highways and Transportation Officials. Washington, D.C.
AASHTO. (2007). Maintenance Manual for Roadways and Bridges. American Association of Highway and Transportation Officials. Washington, D.C.
Abdel Warith, K. A., Anastasopoulos, P. C., Seidel, J. C., & Haddock, J. E. (2015). Simple Empirical Guide to Pavement Design of Low-Volume Roads In Indiana. In Transportation Research Record: Journal of the Transportation Research Board, No. 2472, p.p. 29-39.
Asphalt Institute. (1991). Thickness Design – Asphalt Pavements for Highways and Streets, Manual Series No. 1. The Asphalt Institute, Lexington, KY.
Attoh-Okine, N., and Park, H. (2007). Thin Overlay Maintenance Treatment Application in Delaware Communities. Delaware Department of Transportation. Newark, DE.
Bandara, N., and M. Gunaratne. (2001). Current and Future Pavement Maintenance Prioritization Based on Rapid Visual Condition Evaluation. Journal of Transportation Engineering, Vol. 127, No. 2. Washington, D.C., pp. 116-123.
Bloser, S., Creamer, D., Napper, C., Scheetz, B., and Ziegler, T. (2012). Environmentally Sensitive Road Maintenance Practices for Dirt and Gravel Roads: Final Report No. 1177 1802—SDTDC. USDA Forest Service.
Brito, L. (2011). Design methods for low volume roads, Doctoral dissertation. University of Nottingham, England.
Brown, E. R., and Heitzman, M. (2013). Thin HMA Overlays for Pavement Preservation and Low Volume Asphalt Roads: NCAT Report No. 13-05. National Center for Asphalt Technology. Auburn, AL.
Caltrans. (2003). Caltrans Maintenance Technical Advisory Guide. California Department of Transportation. Sacramento, CA.
99
Caltrans. (2017). California Highway Design Manual (HDM): Chapter 630 - Flexible Pavement. California Department of Transportation. http://www.dot.ca.gov/hq/oppd/hdm/pdf/english/chp0630.pdf. Accessed by Feb. 15, 2017.
Chua, K. M., & Tenison, J. (2003). Explaining the Hveem stabilometer test: Relating R-value, S-value, and the elastic modulus. Journal of testing and evaluation, Vol. 31, No. 4, p.p. 1-8.
Coghlan, G. T. (1999). Opportunities for low-volume roads. TRB A5002. Committee on Low Volume Roads. Unpublished.
Coghlan, G. T. (2000). Opportunities for low-volume roads. A5002: Committee on Low-Volume Roads, Transportation Research Board. Washington, D. C.
Cook, J. R., Petts, R. C., and Rolt, J. (2013). Low Volume Rural Road Surfacing and Pavements, A Guide to Good Practice. Final Report: OTB Engineering UK LLP, London, UK.
Cortez, E., Moore, S., Pidgeon, D., Kestler, M., and Berg, R. (2006). ModBerg, version 99.2.0, software from the U.S. Army Cold Regions Research and Engineering Laboratory (CRREL), Hanover, N.H., https://transportation.wes.army.mil.
Dewan, S., A., and Smith, R., E. (2003). Modifying Local Agency Pavement Management System to Support Governmental Accounting Standards Board 34 Requirements. In Transportation Research Record: Journal of the Transportation Research Board, No. 1819. Transportation Research Board of National Academies. Washington, D.C., p.p. 15-23.
Douglas, R. (2011). Appropriate Pavement Maintenance and Rehabilitation Management System for Local Governments. In Transportation Research Record: Journal of the Transportation Research Board, No. 2205, Transportation Research Board of National Academies. Washington, D.C., pp. 206-212
Douglas, R. (2011). Appropriate Pavement Maintenance and Rehabilitation Management System for Local Governments. In Transportation Research Record: Journal of the Transportation Research Board, No. 2205, Transportation Research Board of National Academies. Washington, D.C., pp. 206-212.
100
El Abd, A., Hornych, P., Breysse, D., Denis, A. & Chazallon, C. (2004), A Simplified Method of Prediction of Permanent Deformations of Unbound Pavement Layers. Proceedings of 6th International Symposium on Pavements Unbound (UNBAR6), Nottingham, England.
FHWA. (2015). Gravel Roads Construction and Maintenance Guide. Federal Highway Administration: U.S. Department of Transportation. Washington, D.C.
Figueroa, C., Fotsch, B., Hubbard, S. M., and Haddock, J. (2013). Assessment Procedures for Paved and Gravel Roads: Final Report No. SP-28-2013. Purdue University School of Civil Engineering, Indiana Local Technical Assistance Program. West Lafayette, IN.
GDOT. (2006). Asphalt Pavement Selection Guidelines. Georgia Department of Transportation. Forest Park, GA.
Geoffroy, D. N. (1996). Cost-Effective Preventive Pavement Maintenance. Monograph, Transportation Research Board, Washington, D.C.
George, K. P. (2004). Prediction of Resilient Modulus from Soil Index Properties: Final Report No. FHWA/MS-DOT-RD-04-172. Mississippi Department of Transportation. Jackson MS.
Hafez, M. (2015). Pavement Management System for Low-volume Paved Roads in Wyoming. Available from Dissertations & Theses at University of Wyoming. Laramie, WY.
Hafez, M., Ksaibati, K., and Anderson-Sprecher, R. (2016). Utilizing Statistical Techniques in Estimating Uncollected Pavement-Condition Data. Journal of Transportation Engineering, Vol. 142, No. 12, 04016065.
Hall, K. D., & Bettis, J. W. (2000). Development of comprehensive low-volume pavement design procedures: Final Report No. MBTC FR-1070. Arkansas State Highway and Transportation Department. Little Rock, AR.
Hicks, R. G., Seeds, S. B., and Peshkin, D. G. (2000). Selecting a Preventive Maintenance Treatment for Flexible Pavements. Foundation for Pavement Preservation, Washington, D.C.
Hoffman, B. (2008). CIR for Low-Volume Roads in Nevada. Western Regional In-Place Recycling Conference. Salt Lake City, UT.
101
Huang, B., and Dong, Q. (2009). Optimizing Pavement Preventive Maintenance Treatment Applications in Tennessee (Phase I). Knoxville, TN.
Huntington, G., & Ksaibati, K. (2010). Gravel Roads Management. Report prepared for the Wyoming Department of Transportation and the Mountain-Plains Consortium, Wyoming Technology Transfer Center (T2/LTAP). Retrieved October, 21, 2011.
Huntington, G., A. Pearce, N. Stroud, J. Jones, and K. Ksaibati. (2013). Mitigating Impacts of Oil and Gas Traffic on Southeastern Wyoming County Roads: Final Report. Wyoming Department of Transportation.
Jahren, C., J. Yu, and R. Williams. (2016). Alternate Design Methods to Renew Lightly Traveled Paved Roads: Final Report, No. MN/RC 2016-14. Minnesota Department of Transportation, St. Paul, Minnesota.
Jahren, C., Yu, J., and Williams, R. C. (2016). Alternate Design Methods to Renew Lightly Traveled Paved Roads: Final Report No. MN/RC 2016-14. Minnesota Department of Transportation. Paul, MN.
Keller, G., & Sherar, J. (2003b). Low-Volume Roads Engineering: Best Management Practices. In Transportation Research Record: Journal of the Transportation Research Board, No. 1819, Transportation Research Board of National Academies. Washington, D.C., p.p. 174-181.
Keller, G., and Sherar, J. (2003a). Low volume roads engineering: Best management practices field guide. National Transportation Library Web site. http://ntl.bts.gov/lib/24000/24600/24650/Chapters/B_Preface_TableOfContents_Glossary.pdf.
Kentucky Transportation Center. (1988). When to Pave a Gravel Road. Lexington, KY
Kimley-Horn and Associates, Inc. (2009). Milton on the Move. City of Milton Transportation Plan. Milton, GA.
LA County. (2017a). Slurry Seals. Department of Public Works, LA County. http://dpw.lacounty.gov/gmed/lacroads/TreatmentSlurrySeal.aspx. Accessed by Feb 18, 2017.

102
LA County. (2017b). Cold In-Place Recycling (CIR). Department of Public Works, LA County. http://dpw.lacounty.gov/gmed/lacroads/TreatmentColdinPlace.aspx. Accessed by Feb 18, 2017.
Maher, M., Marshall, C., Harrison, F., and Baumgaertner, K. (2005). Context Sensitive Roadway Surfacing Selection Guide. Technical Report, Federal Highway
MaineDOT. (2013). When should I Pave a Gravel Road? MaineDOT. http://www.maine.gov/mdot/csd/mlrc/technical/gravelrdmaint/pavgr.htm. Accessed February 8, 2017.
Male, P. (2014). Basics of a Good Road. New York LTAP Center, CLRP No. 14-04. Cornell Local Roads Program. Ithaca, New York.
Maurer, G., Bemanian, S., and Polish, P. (2007). Alternative strategies for rehabilitation of low-volume roads in Nevada. In Transportation Research Record: Journal of the Transportation Research Board, No. 1989, p.p. 309-320.
MNDOT. (2017). Minnesota Pavement Design Manual. Minnesota Department of Transportation. https://roaddesign.dot.state.mn.us/. Accessed by Feb 15, 2017.
Mozaffarian, D., Benjamin, E. J., Go, A. S., Arnett, D. K., Blaha, M. J., Cushman, M., De Ferranti, S., Després, J.P., Fullerton, H.J., Howard, V.J. and Huffman, M.D. (2015). Executive summary. Circulation, Vol. 131, No. 4, p.p. 434-441.
Muench, S. T., Mahoney, J. P., Wataru, W., Chong, L., & Romanowski, J. (2007). Best practices for long-lasting low-volume pavements. Journal of Infrastructure Systems, Vol. 13, No. 4, p.p. 311-320.
Muench, S. T., White, G. C., Mahoney, J. P., Pierce, L. M., and Sivaneswaran, N. (2004). Long-lasting low-volume pavement in Washington State. International Symposium on Design and Construction of Long Lasting Asphalt Pavements, Auburn, AL.
MUTCD. (2009). Manual on Uniform Traffic Control. “Part 5 - Traffic Control Devices for Low-Volume Roads”. FHWA, U. S. Department of Transportation, Washington, D.C.
NCHRP. (1998). Ground Penetrating Radar for Evaluating Subsurface Conditions for Transportation Facilities. National Cooperative Highway Research Program, Synthesis 255. Transportation Research Board. Washington, D.C.

103
NPS. (2014). Pavement Preservation in Our National Parks. National Park Service, U.S. Department of the Interior. https://www.nps.gov/transportation/factsheets/pavement_preservation_08132014.pdf. Accessed by Feb. 17, 2017.
NYSDOT. (1994). Thickness Design Manual for New and Reconstructed Pavements. New York State Department of Transportation. Albany, NY.
Orr, D. (2009). Highway Standards for Low-Volume Roads in New York State. New York LTAP Center, Cornell Local Roads Program. Ithaca, New York.
Peshkin, D. G., and Hoerner, T. E. (2005). Pavement preservation: Practices, research plans, and initiatives: Final Report, NCHRP Project No. 20-07, Task 184. American Association of State Highway and Transportation Officials, Washington, D.C.
Redd, L. (2013). CDOT's Risk-Based Asset Management Plan. Colorado Department of
Transportation. Frederick, CO.
Rukashaza-Mukome, M. C., Thorius, J. M., Jahren, C. T., Johnson, G. D., and White, D. J. (2003). Cost comparison of treatments used to maintain or upgrade aggregate roads. In Proceedings of the 2003 Mid-Continent Transportation Research Symposium. Ames, IA.
Schafer, J. L. (1997). Analysis of incomplete multivariate data. Chapman & Hall, London.
Shahin, M. Y., and J. A. Walter. (1990). Pavement Maintenance for Roads and Streets Using the PAVER System: Final Report, No. USACERL TR M-90/05. U.S. Army Construction Engineering Research Laboratory. Champaign, IL.
Skorseth, K., and Selim, A. (2005). Gravel Roads Maintenance and Design Manual. Brookings, SD: South Dakota Local Transportation Assistance Program.
Smith, D. (2006). Local Roads Maintenance Workers’ Manual: Final Report No. TR-514. Center for Transportation Research and Education, Iowa State University. Ames, IA.
Smith, R. (2002). Integrating Pavement Preservation into a Local Agency Pavement Management System. In Transportation Research Record: Journal of the Transportation Research Board, No. 1795. Washington, D.C. pp. 27-32.

104
Souleyrette, R. R., M. Caputcu, T. J. McDonald, R. B. Sperry, Z. N. Hans, and D. Cook. (2010). Safety Analysis of Low-Volume Rural Roads in Iowa: Final Report, No. InTrans Project 07-309. Iowa State University. Ames, IA.
The Pew Charitable Trusts. (2014). Intergovernmental Challenges in Surface Transportation Funding. The Pew Charitable Trusts.
Title 23 U.S.C. (2011). Management Systems. United States Code, 2011 Edition, Title 23-Highways, §303 (a).
TRB. (2015). Low Volume Roads Conference. TRB Low-Volume Roads (LVR) Literature. http://www.trb.org/LowVolumeRoadsConference/LVR10Literature.aspx. Accessed December 21, 2015.
USACE. (1992). Pavement Design for Roads, Streets, Walks, and Open Storage Areas: Final Report No. TM 5-822-5. Department of the Army and the Air Force. Washington, D.C.
VDOT. (2000). Pavement Design Guide for Subdivision and Secondary Roads. Virginia Department of Transportation. Richmond, VA.
Visser, A. T. and Hall, S. (2003). Innovative and cost-effective solutions for roads in rural areas and difficult terrain. In Transportation Research Record: Journal of the Transportation Research Board, No. 1819, p.p. 169-173.
White, G. (2012). WSDOT Pavement Preservation Guide for Local Agencies: Final Report, No. WA-RD 800.1. Washington State Department of Transportation, Olympia, Washington.
Wilde, W. J., Thompson, L., and Wood, T. J. (2014). Cost-Effective Pavement Preservation Solutions for the Real World: Final Report No. MN/RC 2014-33. Minnesota Department of Transportation. Paul, MN.
Winfrey, R. (1969). Economic Analysis for Highways. International Textbook, Scranton, PA.
Wu, Z., Groeger, J. L., Simpson, A. L., and Hicks, R. G. (2010). Performance Evaluation of Various Rehabilitation and Preservation Treatments. Technical Report, Federal Highway Administration, Washington D.C.

105
WYT2/LTAP. (2014). A Monitoring Program for Wyoming County Paved Roads. Wyoming Technology Transfer Center/Local Technical Assistance Program. Laramie, WY.
Yu, J., Jahren, C. T., and Williams, R. C. (2015). Development of Holding Strategies for Deteriorated Low-Volume Roads: Introduction to Test Sections in Iowa. In Transportation Research Record: Journal of the Transportation Research Board, No. 2474, p.p. 217-224.
Zimmerman, K. A., & Wolters, A. S. (2004). Local Road Surfacing Criteria: Final Report, No. SD2002-10-F. South Dakota Department of Transportation. Pierre, SD.
Overby, C., and Pinard, M. (2007). The Otta Seal Surfacing: Practical and Economic Alternative to Traditional Bituminous Surface Treatments. In Transportation Research Record: Journal of the Transportation Research Board, No. 2349, p.p. 136-144.

106
Appendix A-1: TRB Low-Volume Committee AFB30 Survey

107

108

109

110

111

112

113

114
Appendix A-2: TRB Low-Volume Committee AFB30 Responses

115
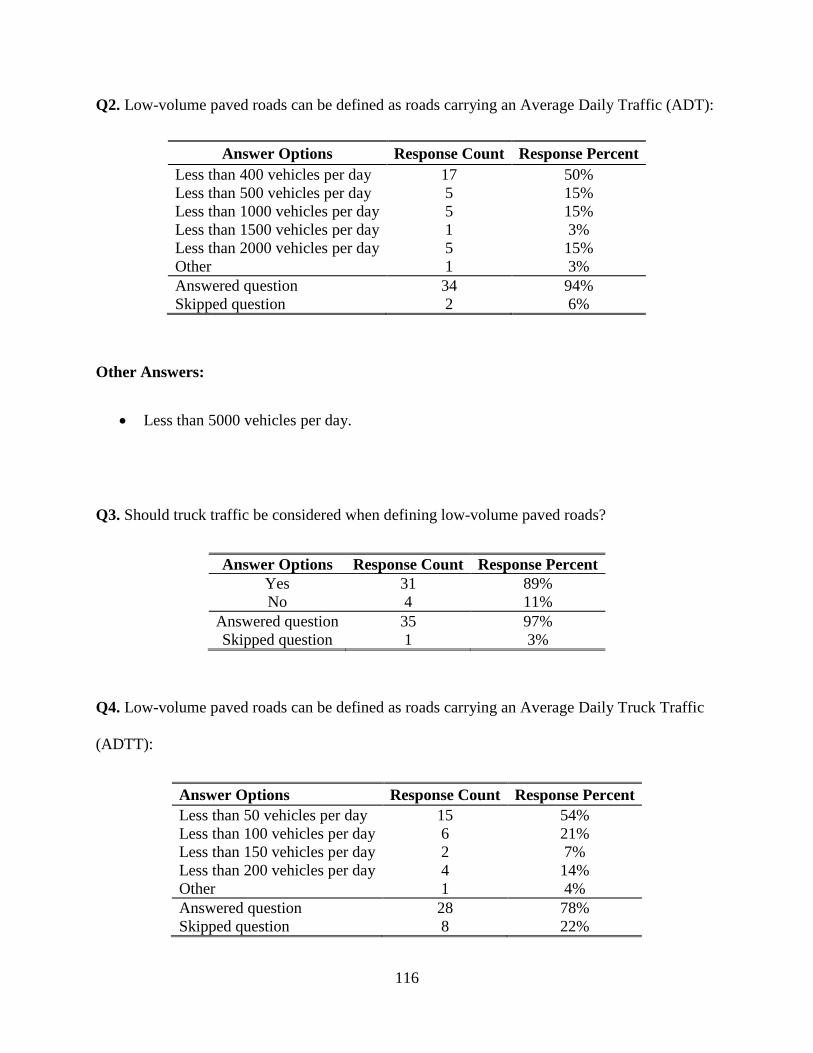
116
Q2. Low-volume paved roads can be defined as roads carrying an Average Daily Traffic (ADT):
Answer Options Response Count Response Percent Less than 400 vehicles per day 17 50% Less than 500 vehicles per day 5 15% Less than 1000 vehicles per day 5 15% Less than 1500 vehicles per day 1 3% Less than 2000 vehicles per day 5 15% Other 1 3% Answered question 34 94% Skipped question 2 6%
Other Answers:
• Less than 5000 vehicles per day.
Q3. Should truck traffic be considered when defining low-volume paved roads?
Answer Options Response Count Response Percent Yes 31 89% No 4 11%
Answered question 35 97% Skipped question 1 3%
Q4. Low-volume paved roads can be defined as roads carrying an Average Daily Truck Traffic
(ADTT):
Answer Options Response Count Response Percent Less than 50 vehicles per day 15 54% Less than 100 vehicles per day 6 21% Less than 150 vehicles per day 2 7% Less than 200 vehicles per day 4 14% Other 1 4% Answered question 28 78% Skipped question 8 22%

117
Other Answers:
• Less than 10 vehicles per day.
Q5. What kind of data should be collected when managing and maintaining low-volume paved
roads?
Answer Options Response Count Response Percent Pavement Condition 32 100% Traffic 30 94% Maintenance History 30 94% Structural Data 26 81% Road Classification 24 75% Other 10 31% Answered question 32 89% Skipped question 4 11%
Other Answers:
• Drainage condition evaluation
• Non-motorized and pedestrian traffic
• Accident history
• Establishment and right of way easement. In addition, Fee title information
• Land classification around highway
• Basic geometry (such as: length and width of roads)
• Accident-related infrastructure (such as: culverts, lighting, and guardrails)
• Cost of treatment options
• Age
• roadbed soil classification

118
Q6. What traffic data should be obtained for managing and maintaining low-volume paved
roads?
Answer Options Response Count Response Percent Actual traffic volume data 26 81% Truck Traffic 23 72% Predicted traffic volume data 13 41% Other 4 13% Answered question 32 89% Skipped question 4 11%
Other Answers:
• Bridge Load Rating
• All-terrain vehicles (ATVs)
• Non-motorized transportation (NMT) and pedestrian
• Daily traffic calculated by 15-minute counts
Q.7 Which of the following structural data is useful for managing and maintaining low-volume
paved roads?
Answer Options Response Count Response Percent Pavement thicknesses 27 90% Pavement material characteristics (such as soil classification and strength) 26 87%
FWD – Falling Weight Deflectometer data 13 43% Other 4 13% Answered question 30 83% Skipped question 6 17%
Other Answers:
• Shoulder width (if any) for pavement edge stability.
• FWD needs to be seasonal and only useful on highways with larger amounts of truck
traffic.

119
Q8. Which of the following indices should be used to summarize the condition of low-volume
paved roads?
Answer Options Response Count Response Percent PCI – Pavement Condition Index 16 57% IRI – International Roughness Index 12 43% PASER – Pavement Surface Evaluation Rating 11 39% RUT – Rut depth 10 36% CRS – Condition Rating Survey 9 32% SR – Surface Rating 8 29% PSC – Pavement Structural Condition 7 25% PSI – Present Serviceability Index 6 21% DI – Distress Index 6 21% PQI – Pavement Quality Index 7 25% OPI – Overall Pavement Index 4 14% PSR – Present Serviceability Rating 3 11% Other 5 18% Answered question 28 78% Skipped question 8 22%
Other Answers:
• Ride Quality Index (RQI)
Q9. What is the optimum pavement condition data collection frequency for low-volume paved
roads?
Answer Options Response Count Response Percent Every year 8 29% Every 2 years 7 25% Every 3 years 5 18% Every 4 years 5 18% Other 3 11% Answered question 28 78% Skipped question 8 22%
Other Answers:
• Every five years
• In Costa Rica, data is collected every five years for low-volume paved roads.

120
Q10. Some agencies use decision trees to select pavement treatments for their low-volume paved
roads. Do you think that developing a decision tree for selecting pavement treatments is
beneficial?
Answer Options Response Count Response Percent Yes 23 82% No 5 18%
Answered question 28 78% Skipped question 8 22%
Q11. Which indices / data should be included in the decision tree to identify treatments for low-
volume paved roads?
Answer Options Response Count Response Percent Average Daily Traffic (ADT) 19 86% Road Classification 17 77% Average Daily Truck Traffic (ADTT) 15 68% Pavement Age 13 59% Maintenance History 13 59% PCI – Pavement Condition Index 11 50% IRI – International Roughness Index 7 32% PASER – Pavement Surface Evaluation Rating 7 32% RUT – Rut depth 6 27% CRS – Condition Rating Survey 5 23% PQI – Pavement Quality Index 4 18% PSI – Present Serviceability Index 3 14% DI – Distress Index 3 14% SR – Surface Rating 3 14% PSC – Pavement Structural Condition 2 9% PSR – Present Serviceability Rating 2 9% OPI – Overall Pavement Index 0 0% Other 1 5% Answered question 22 61% Skipped question 14 39%

121
Q12. Based on your experience, what would be the expected service lives for the most widely
used pavement treatments for low-volume paved roads?
Answer Options
Response Percent Response Count Less than
3 years 3 - 5 years 6 - 8 years
9 - 10 years
more than 10 years
No Response
Chip Seal 19% 30% 26% 19% 7% 0% 27
Micro-surfacing 15% 19% 41% 7% 7% 11% 24
Crack Seal 48% 30% 11% 4% 0% 7% 25
Crack Fill 44% 37% 11% 0% 0% 7% 25
Rut Fill 22% 48% 15% 4% 0% 11% 24
Thin Overlay (1.5” or less) 11% 19% 30% 26% 7% 7% 25
Medium Overlay (between 1.5" and 4”) 4% 7% 19% 30% 33% 7% 25
Thick Overlay (over 4”) 0% 4% 4% 26% 59% 7% 25
Full Pavement Reconstruction 0% 0% 4% 4% 93% 0% 27
Other (please specify) 3
Answered question 27
Skipped question 9
Other Answers:
• It depends on traffic loads and climate.
• All of these vary greatly for various traffic, material, and drainage conditions. The values
marked are for typical LVR (moderate drainage, thin surface, marginal quality).

122
Q13. Based on your experience, what would be the effectiveness of pavement treatments used
for severely damaged low-volume paved roads?
Answer Options
Response Percent Response Count Effective Not effective No
Response Chip Seal 19% 81% 0% 26 Micro-surfacing 8% 85% 8% 24 Crack Seal 12% 81% 8% 24 Crack Fill 15% 77% 8% 24 Rut Fill 15% 77% 8% 24 Thin Overlay (1.5” or less) 35% 50% 15% 22 Medium Overlay (between 1.5" and 4”) 54% 38% 8% 24 Thick Overlay (over 4”) 62% 23% 15% 22 Full Pavement Reconstruction 92% 4% 4% 25 Answered question 26 Skipped question 10
Q14. Are you aware of any new innovative techniques/treatments which might be effective when
maintaining low-volume paved roads?
Answer Options Response Count Response Percent Yes 10 38% No 16 62%
Answered question 26 72% Skipped question 10 28%
Q15. Please identify these techniques.
Answers:
• TX-underseal prior to overlay
• Cold in-place recycling with asphalt rejuvenator; Hot in-place recycling

123
• Fiber Mat
• Otta seals, slurry/sand seals; Cold recycling pavers; Geocells; Roller compacted concrete;
PCC slabs
• Paving fabric with Chip Seal; Polymer modified or engineered emulsions/binders; Cold
in-place recycling; Foamed asphalt stabilized base
• Cement recycled asphalt base
• Recycling; Cape seal; Cold mix with a hot mix overlay, Fabrics, Spot improvements
• Ultra-thin bonded wearing course; Thin overlay with modified asphalt binder
• Chip seal based Stress Absorbing Membrane treatments (e.g., rubberized asphalt binder,
Fiber Mat)
Q16. Do you think that optimization techniques should be used when selecting treatments and
managing low-volume paved roads?
Answer Options Response Count Response Percent Yes 22 85% No 4 15%
Answered question 26 72% Skipped question 10 28%

124
Q17. Which parameters should be optimized?
Answer Options Response Count Response Percent Maximizing Remaining Service Life 18 82% Optimizing Budgets 14 64% Maximizing PCI – Pavement Condition Index 8 36% Minimizing RUT – Rut depth 4 18% Maximizing PSI – Present Serviceability Index 3 14% Minimizing IRI – International Roughness Index 2 9% Other 0 0% Answered question 22 61% Skipped question 14 39%
Q18. When optimizing budget expenditures, what is the approximate percentage of total budgets
that should be allocated to each of the following segment condition levels? “Percentages must
add up to 100%”
Answer Options 0% 10% 20% 30% 40% 50% 60% 70% 80% Response Count
Weighted Average
Worst segments 1 3 5 3 3 6 0 0 0 21 31% Rapidly deteriorating segments 0 1 1 14 2 2 0 1 0 21 34%
Segments requiring routine maintenance 0 1 9 3 1 3 2 1 1 21 35%
Answered question 21 Skipped question 15
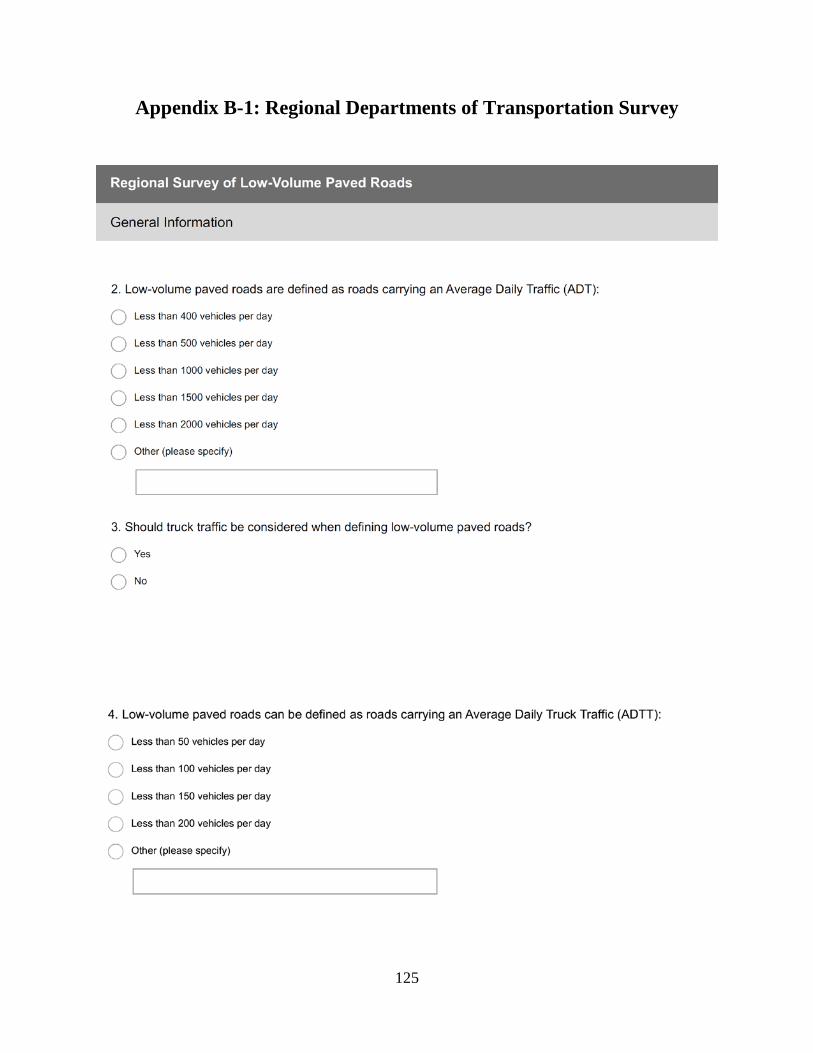
125
Appendix B-1: Regional Departments of Transportation Survey

126

127
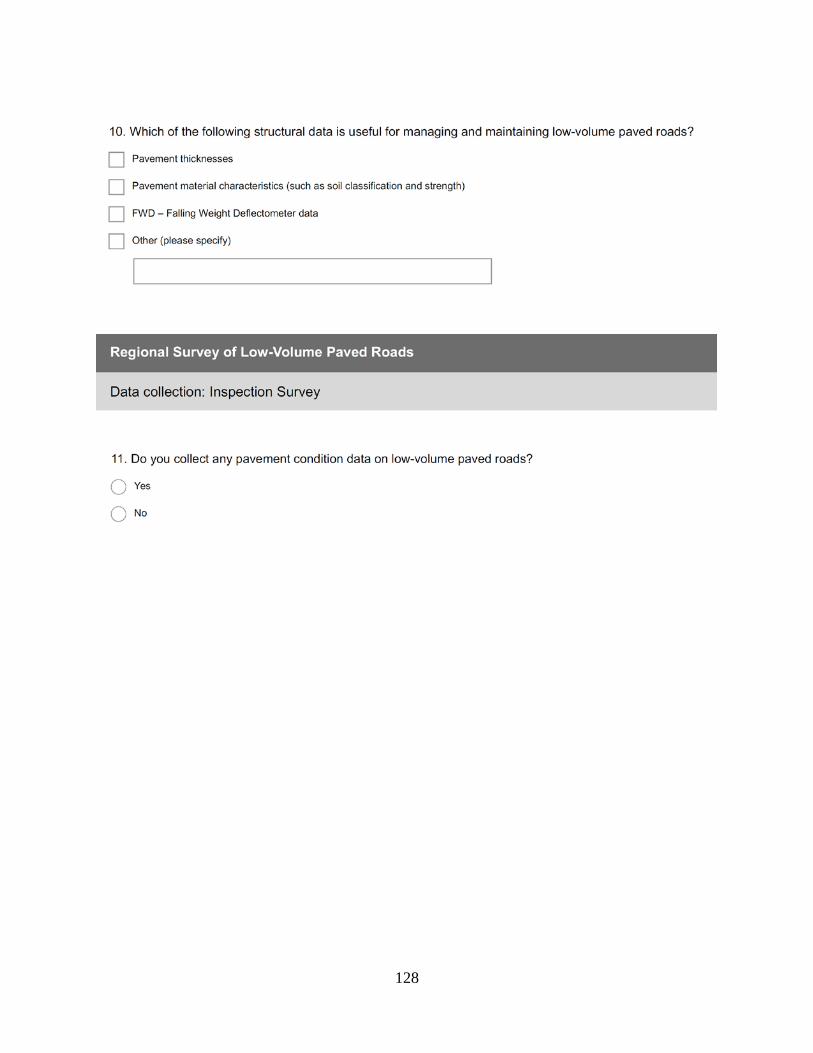
128

129

130

131

132

133

134

135

136
Appendix B-2: Regional Departments of Transportation Responses
Q1. Please enter your contact information:
Respondent # Name Title: Agency Email Address: Phone Number:
1 Michael Vigil Maintenance Operations Engineer NMDOT [email protected] +1 5058275393
2 Kevin Robertson Surface Treatment Engineer AZDOT [email protected] +1 6027123131
3 Rick Miller Pavement Management Engineer KSDOT [email protected] +1 7852913842
4 Magdy Mikhail Director Pavements Branch TXDOT [email protected] +1 5128327210
5 Scott Andrus Utah DOT State Materials Engineer UDOT [email protected] +1 8019654859
6 Matt Beran Assistant Flexible Pavements Engineer NEDOT [email protected] +1 4024794663
7 Mike Farrar Pavement Management Engineer WYDOT [email protected] +1 3077774075
8 Jim Davies Pavement Analysis Engineer MTDOT [email protected] +1 4064443424
9 Gary Kuhl Pavement Management Engineer - UDOT UDOT [email protected] +1 8019644552
Q2. Low-volume paved roads are defined by your agency as roads carrying an Average Daily
Traffic (ADT):
Answer Options Response Count Response Percent Less than 400 vehicles per day 4 44% Less than 500 vehicles per day 2 22% Less than 1000 vehicles per day 2 22% Other 1 11%
Answered question 9 100% Skipped question 0 0%
Other Answers:
• Less than 5000 vehicles per day.

137
Q3. Should truck traffic be considered when defining low-volume paved roads?
Answer Options Response Count Response Percent Yes 7 78% No 2 22%
Answered question 9 100% Skipped question 0 0%
Q4. Low-volume paved roads can be defined as roads carrying an Average Daily Truck Traffic
(ADTT):
Answer Options Response Count Response Percent Less than 50 vehicles per day 3 43% Less than 100 vehicles per day 1 14% Less than 200 vehicles per day 3 43%
Answered question 7 78% Skipped question 2 22%
Q5. How many miles of low-volume paved roads are in your state?
Answer Options Response Count Response Percent More than 250 miles 8 100% 200 – 250 miles 0 0% 150 – 199 miles 0 0% 100 – 149 miles 0 0% 50 – 99 miles 0 0% 10 – 49 miles 0 0% Less than 10 miles 0 0%
Answered question 8 89% Skipped question 1 11%
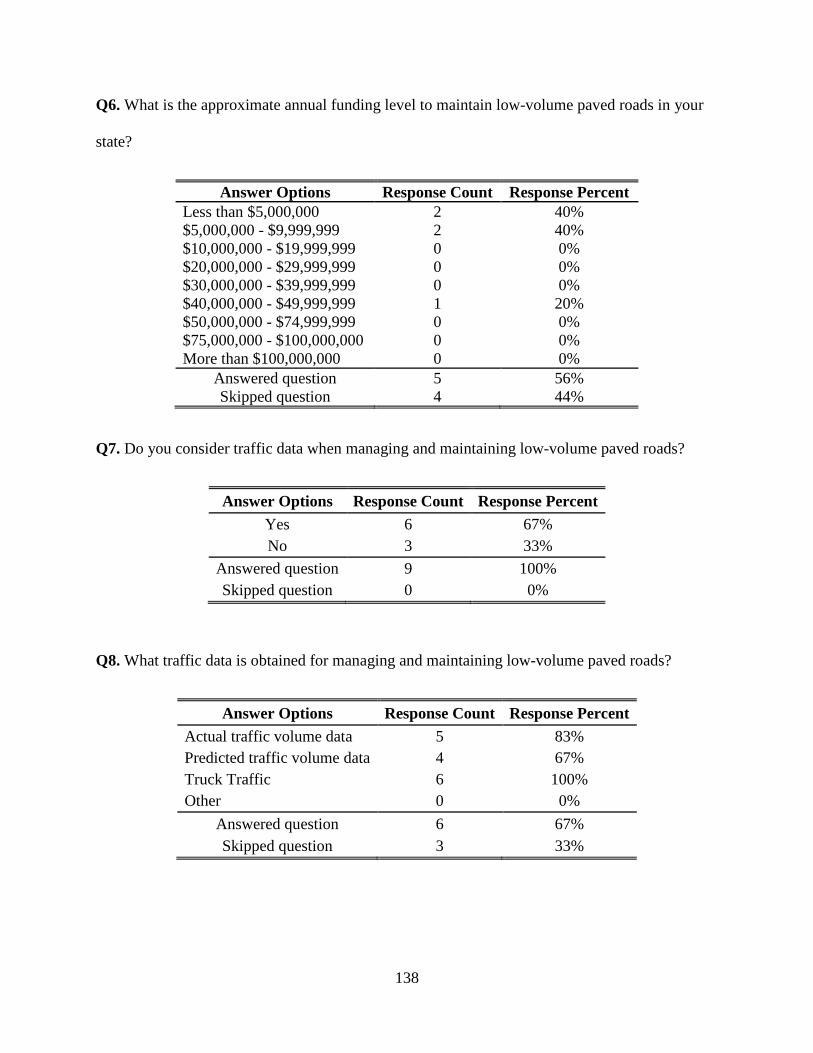
138
Q6. What is the approximate annual funding level to maintain low-volume paved roads in your
state?
Answer Options Response Count Response Percent Less than $5,000,000 2 40% $5,000,000 - $9,999,999 2 40% $10,000,000 - $19,999,999 0 0% $20,000,000 - $29,999,999 0 0% $30,000,000 - $39,999,999 0 0% $40,000,000 - $49,999,999 1 20% $50,000,000 - $74,999,999 0 0% $75,000,000 - $100,000,000 0 0% More than $100,000,000 0 0%
Answered question 5 56% Skipped question 4 44%
Q7. Do you consider traffic data when managing and maintaining low-volume paved roads?
Answer Options Response Count Response Percent Yes 6 67% No 3 33%
Answered question 9 100% Skipped question 0 0%
Q8. What traffic data is obtained for managing and maintaining low-volume paved roads?
Answer Options Response Count Response Percent Actual traffic volume data 5 83% Predicted traffic volume data 4 67% Truck Traffic 6 100% Other 0 0%
Answered question 6 67% Skipped question 3 33%
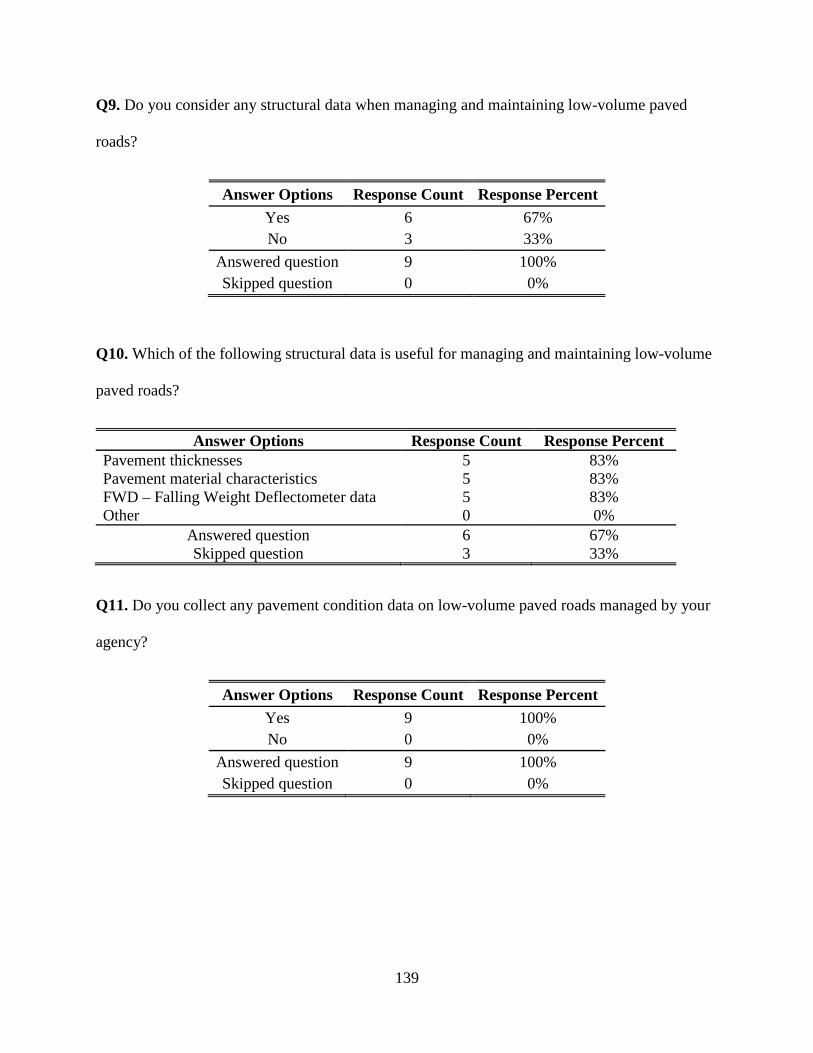
139
Q9. Do you consider any structural data when managing and maintaining low-volume paved
roads?
Answer Options Response Count Response Percent Yes 6 67% No 3 33%
Answered question 9 100% Skipped question 0 0%
Q10. Which of the following structural data is useful for managing and maintaining low-volume
paved roads?
Answer Options Response Count Response Percent Pavement thicknesses 5 83% Pavement material characteristics 5 83% FWD – Falling Weight Deflectometer data 5 83% Other 0 0%
Answered question 6 67% Skipped question 3 33%
Q11. Do you collect any pavement condition data on low-volume paved roads managed by your
agency?
Answer Options Response Count Response Percent Yes 9 100% No 0 0%
Answered question 9 100% Skipped question 0 0%

140
Q12. How do you collect the pavement condition data of low-volume paved roads in your
county?
Answer Options Response Count Response Percent Manual and automated data collection systems 4 44% Manual data collection system 0 0% Automated data collection system 5 56% Other 0 0%
Answered question 9 100% Skipped question 0 0%
Q13. How frequently is pavement condition data collected?
Answer Options Response Count Response Percent Every year 4 44% Every 2 years 4 44% Every 3 years 0 0% Every 4 years 0 0% Other 1 11% Answered question 9 100% Skipped question 0 0%
Other Answers:
• Every 5 years network level.

141
Q14. Which of the following indices are used to summarize low-volume pavement conditions?
Answer Options Response Count Response Percent IRI – International Roughness Index 8 89% RUT – Rut depth 7 78% DI – Distress Index 5 56% PSI – Present Serviceability Index 4 44% OPI – Overall Pavement Index 3 33% PCI – Pavement Condition Index 2 22% SR – Surface Rating 1 11% PSR – Present Serviceability Rating 1 11% CRS – Condition Rating Survey 1 11% PASER – Pavement Surface Evaluation Rating 0 0% PSC – Pavement Structural Condition 0 0% PQI – Pavement Quality Index 0 0%
Answered question 9 100% Skipped question 0 0%
Q15. Do you use a specific pavement maintenance policy or guidelines for maintaining low-
volume paved roads?
Answer Options Response Count Response Percent Yes 4 44% No 5 56%
Answered question 9 100% Skipped question 0 0%
Please highlight the most important item in your policy:
• The policy depends on the road classification. There is no traffic volume-based treatment
policies.
• Due to the funding we are not able to follow our pavement program completely on low
volume roads. Surface treatments is most important item in our pavement management
for these roads.
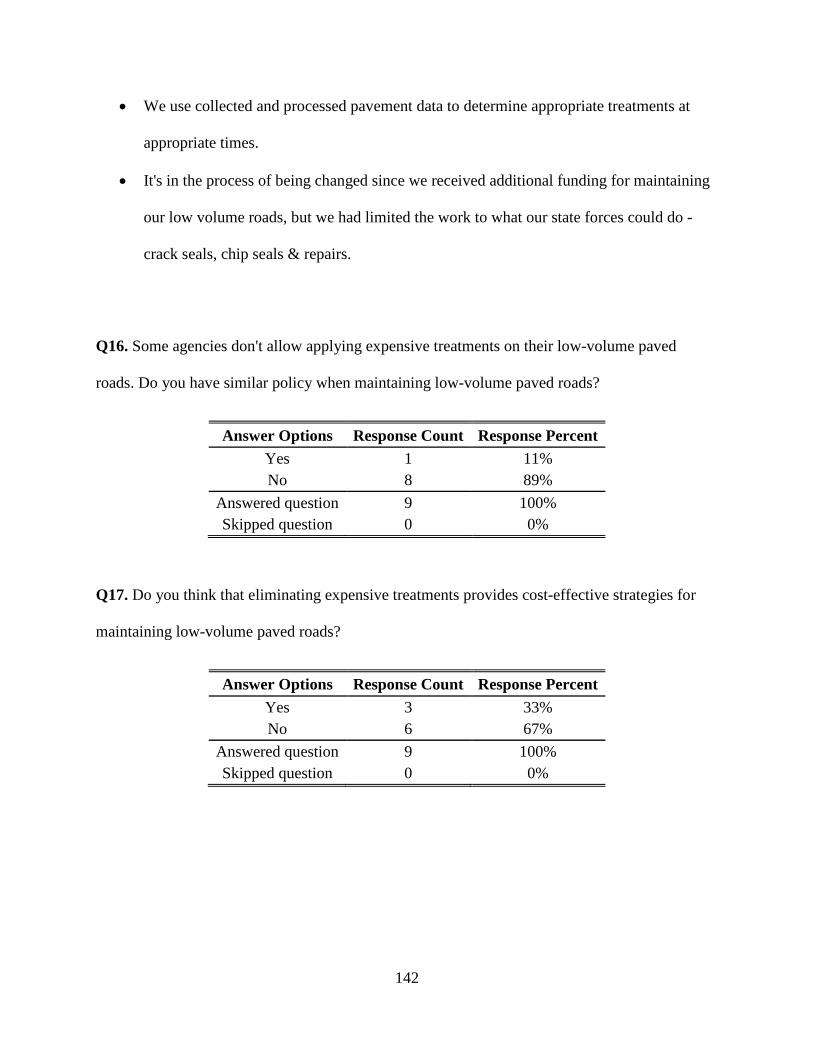
142
• We use collected and processed pavement data to determine appropriate treatments at
appropriate times.
• It's in the process of being changed since we received additional funding for maintaining
our low volume roads, but we had limited the work to what our state forces could do -
crack seals, chip seals & repairs.
Q16. Some agencies don't allow applying expensive treatments on their low-volume paved
roads. Do you have similar policy when maintaining low-volume paved roads?
Answer Options Response Count Response Percent Yes 1 11% No 8 89%
Answered question 9 100% Skipped question 0 0%
Q17. Do you think that eliminating expensive treatments provides cost-effective strategies for
maintaining low-volume paved roads?
Answer Options Response Count Response Percent Yes 3 33% No 6 67%
Answered question 9 100% Skipped question 0 0%

143
Q18. What are treatments allowed for maintaining low-volume paved roads?
Answer Options Response Count Response Percent Chip Seal 9 100% Crack Seal 9 100% Crack Fill 6 67% Thin Overlay (1.5” or less) 6 67% Rut Fill 6 67% Medium Overlay (between 1.5" and 4”) 5 56% Micro-surfacing 5 56% Full Pavement Reconstruction 4 44% Thick Overlay (over 4”) 1 11% Other 2 22%
Answered question 9 100% Skipped question 0 0%
Other Answers:
• HIR
• We'll start doing some surface recycling & thin overlays, but I expect that they'll still be a
chip sealed surface.
Q19. Do you recommend or routinely perform targeted rehabilitation of severely distressed areas
within low-volume paved roads prior to application of surface treatments?
Answer Options Response Count Response Percent Yes 8 89% No 1 11%
Answered question 9 100% Skipped question 0 0%
Q20. How do you determine when full length rehabilitation becomes necessary?
Answers:
• Pavement Distress
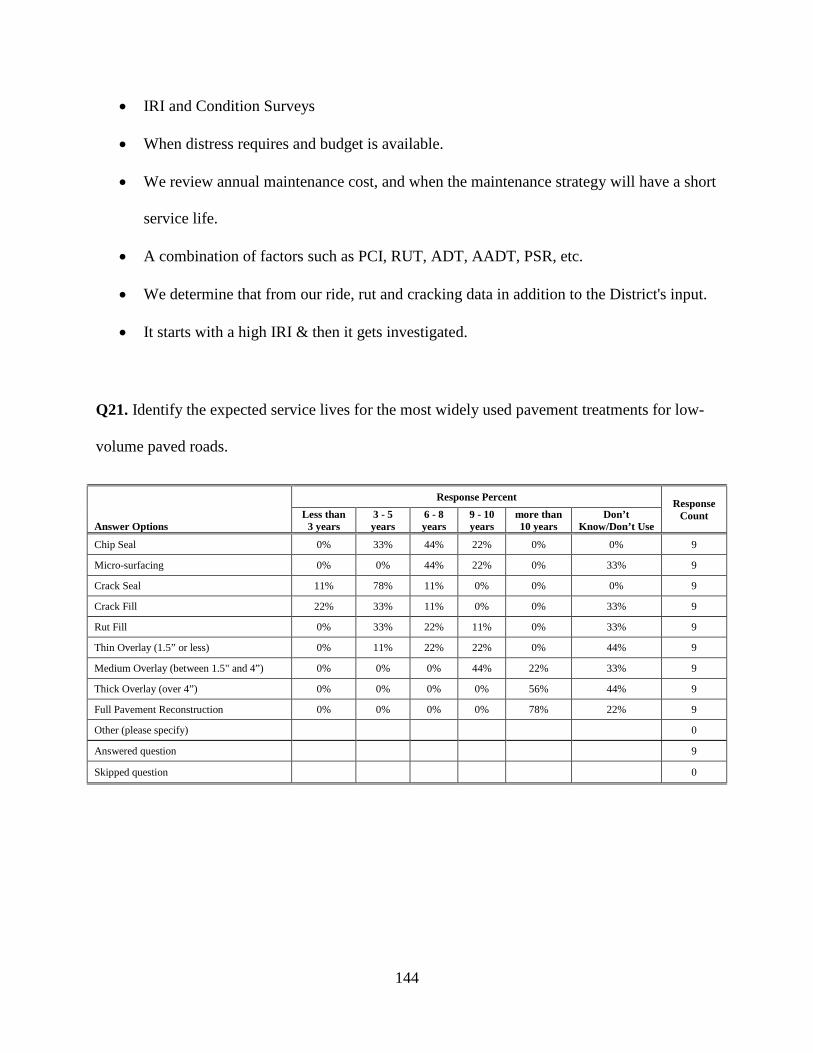
144
• IRI and Condition Surveys
• When distress requires and budget is available.
• We review annual maintenance cost, and when the maintenance strategy will have a short
service life.
• A combination of factors such as PCI, RUT, ADT, AADT, PSR, etc.
• We determine that from our ride, rut and cracking data in addition to the District's input.
• It starts with a high IRI & then it gets investigated.
Q21. Identify the expected service lives for the most widely used pavement treatments for low-
volume paved roads.
Answer Options
Response Percent Response Count Less than
3 years 3 - 5 years
6 - 8 years
9 - 10 years
more than 10 years
Don’t Know/Don’t Use
Chip Seal 0% 33% 44% 22% 0% 0% 9
Micro-surfacing 0% 0% 44% 22% 0% 33% 9
Crack Seal 11% 78% 11% 0% 0% 0% 9
Crack Fill 22% 33% 11% 0% 0% 33% 9
Rut Fill 0% 33% 22% 11% 0% 33% 9
Thin Overlay (1.5” or less) 0% 11% 22% 22% 0% 44% 9
Medium Overlay (between 1.5" and 4”) 0% 0% 0% 44% 22% 33% 9
Thick Overlay (over 4”) 0% 0% 0% 0% 56% 44% 9
Full Pavement Reconstruction 0% 0% 0% 0% 78% 22% 9
Other (please specify) 0
Answered question 9
Skipped question 0

145
Q22. Identify the effectiveness of each pavement treatment when placed directly on severely
distressed surfaces within low-volume paved roads.
Answer Options Response Percent Response
Count Effective Not effective Don’t Know/Don’t Use Chip Seal 25% 63% 13% 8 Micro-surfacing 13% 63% 25% 8 Crack Seal 50% 38% 13% 8 Crack Fill 13% 50% 38% 8 Rut Fill 38% 38% 25% 8 Thin Overlay (1.5” or less) 13% 50% 38% 8 Medium Overlay (between 1.5" and 4”) 38% 50% 13% 8 Thick Overlay (over 4”) 63% 13% 25% 8 Full Pavement Reconstruction 88% 0% 13% 8 Answered question 8 Skipped question 1
Q23. Are you aware of any new innovative techniques/treatments which might be effective when
maintaining low-volume paved roads?
Answer Options Response Count Response Percent Yes (Please Specify) 4 44%
No 5 56% Answered question 9 100% Skipped question 0 0%
Answers:
• Thin Bonded Overlays (TBO's)
• Cold and Hot in place recycle, fibers, hi-polymer binders
• Scrub seals cold in place recycling
• We're looking into how well they Kevlar type fibers perform in the thin overlays

146
Q24. Do you think that optimization techniques should be used when selecting treatments and
managing low-volume paved roads?
Answer Options Response Count Response Percent Yes 9 100% No 0 0%
Answered question 9 100% Skipped question 0 0%
Q25. Which parameters should be optimized?
Answer Options Response Count Response Percent Optimizing Budgets 7 78% Maximizing Remaining Service Life 7 78% Minimizing IRI – International Roughness Index 6 67% Minimizing RUT – Rut depth 5 56% Maximizing PSI – Present Serviceability Index 4 44% Maximizing PCI – Pavement Condition Index 2 22% Other 1 11%
Answered question 9 100% Skipped question 0 0%
Other Answers:
• Our deterioration model optimizes a combined condition index, using ride, rutting,
environmental & fatigue cracking indexes.

147
Q26. When optimizing budget expenditures, what is the approximate percentage of total budgets
that should be allocated to each of the following segment condition levels?
Answer Options 0% 10% 20% 30% 40% 50% 60% 70% 80% Response Count
Weighted Average
Worst segments 0 1 1 3 1 0 0 0 0 6 27%
Rapidly deteriorating segments 0 0 1 1 1 3 0 0 0 6 40%
Segments requiring routine maintenance 0 0 3 0 1 2 0 0 0 6 33%
Answered question 6 Skipped question 3

148
Appendix C-1: Colorado Local Governments Survey

149

150

151

152

153

154

155

156

157

158

159

160
161
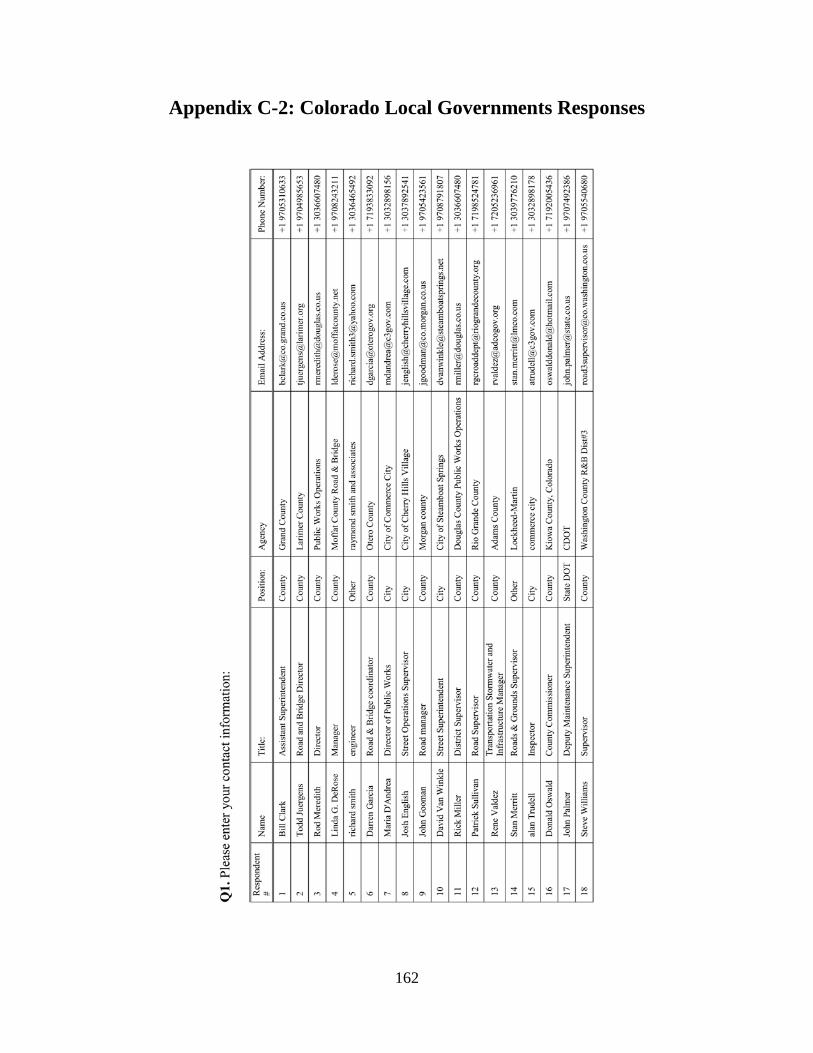
162
Appendix C-2: Colorado Local Governments Responses

163
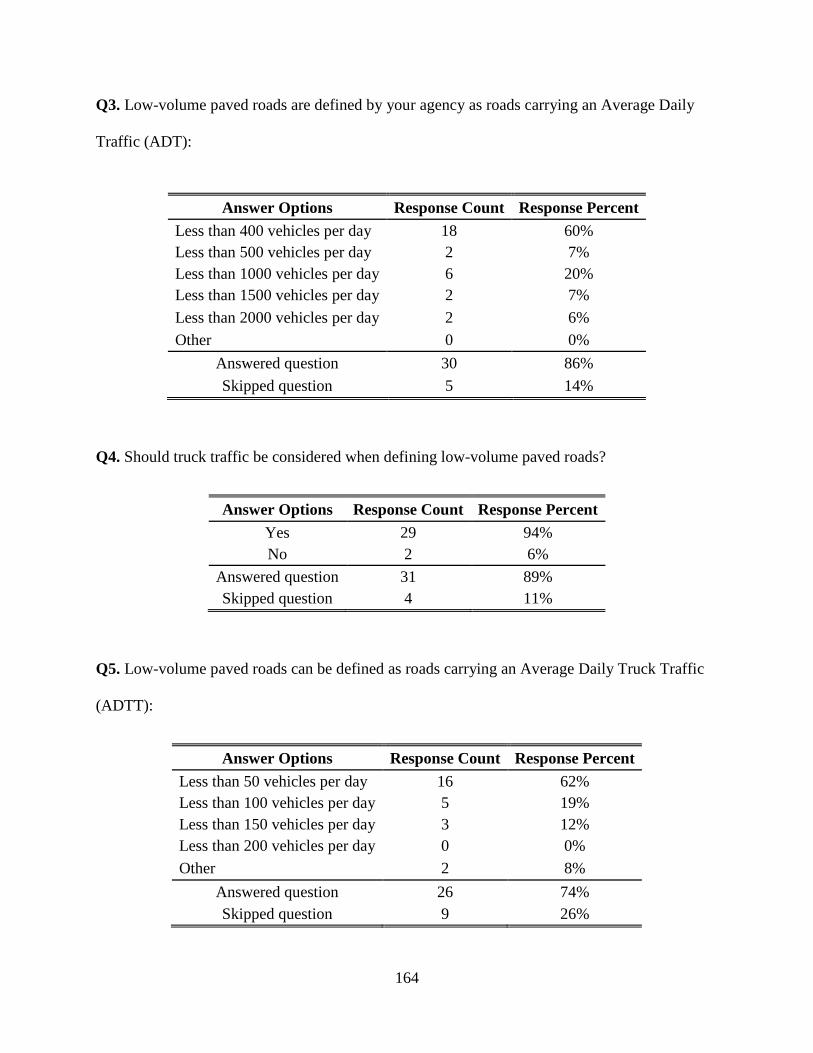
164
Q3. Low-volume paved roads are defined by your agency as roads carrying an Average Daily
Traffic (ADT):
Answer Options Response Count Response Percent Less than 400 vehicles per day 18 60% Less than 500 vehicles per day 2 7% Less than 1000 vehicles per day 6 20% Less than 1500 vehicles per day 2 7% Less than 2000 vehicles per day 2 6% Other 0 0%
Answered question 30 86% Skipped question 5 14%
Q4. Should truck traffic be considered when defining low-volume paved roads?
Answer Options Response Count Response Percent Yes 29 94% No 2 6%
Answered question 31 89% Skipped question 4 11%
Q5. Low-volume paved roads can be defined as roads carrying an Average Daily Truck Traffic
(ADTT):
Answer Options Response Count Response Percent Less than 50 vehicles per day 16 62% Less than 100 vehicles per day 5 19% Less than 150 vehicles per day 3 12% Less than 200 vehicles per day 0 0% Other 2 8%
Answered question 26 74% Skipped question 9 26%

165
Other Answers:
• 500 vehicles per day.
• 400 vehicles per day.
Q6. What is approximate total length in miles of low-volume paved roadways owned and
maintained by your agency?
Answer Options Response Count Response Percent More than 250 miles 6 24% 200 – 250 miles 4 16% 150 – 199 miles 1 4% 100 – 149 miles 1 4% 50 – 99 miles 5 20% 10 – 49 miles 6 24% Less than 10 miles 2 8% Answered question 25 71% Skipped question 10 29%
Q7. What is your agency’s approximate annual funding level to maintain low-volume paved
roads?
Answer Options Response Count Response Percent Less than $500,000 11 44% $500,000 - $999,999 4 16% $1,000,000 - $1,999,999 6 24% $2,000,000 - $3,000,000 1 4% More than $3,000,000 3 12%
Answered question 25 71% Skipped question 10 29%

166
Q8. Do you consider traffic data when managing and maintaining low-volume paved roads?
Answer Options Response Count Response Percent
Yes 19 76% No 6 24%
Answered question 25 71% Skipped question 10 29%
Q9. What traffic data is obtained for managing and maintaining low-volume paved roads?
Answer Options Response Count Response Percent Actual traffic volume data 15 79% Predicted traffic volume data 9 47% Truck Traffic 8 42% Other 0 0%
Answered question 19 54% Skipped question 16 46%
Q10. Do you consider any structural data when managing and maintaining low-volume paved
roads?
Answer Options Response Count Response Percent Yes 19 76% No 6 24%
Answered question 25 71% Skipped question 10 29%

167
Q11. Which of the following structural data is useful for managing and maintaining low-volume
paved roads?
Answer Options Response Count
Response Percent
Pavement thicknesses 16 89% Pavement material characteristics (such as soil classification and strength) 12 67%
FWD – Falling Weight Deflectometer data 5 28% Other 1 6%
Answered question 18 51% Skipped question 17 49%
Other Answers:
• Road surface conditions.
Q12. Do you collect any pavement condition data on low-volume paved roads managed by your
agency?
Answer Options Response Count Response Percent Yes 14 58% No 10 42%
Answered question 24 69% Skipped question 11 31%
Q13. Do you follow any CDOT procedures when collecting pavement condition data of low-
volume paved roads?
Answer Options Response Count Response Percent Yes 3 23% No 10 77%
Answered question 13 37% Skipped question 22 63%

168
Q14. Please specify this procedure.
Answers:
• CDOT standards are applied to develop the rating system parameters.
• Annual condition survey to identify pavement conditions, structure and drainage systems
and roadside facilities. Additionally, all traffic devices and striping.
• HUTF
Q15. How do you collect the pavement condition data of low-volume paved roads in your
county?
Answer Options Response Count Response Percent Manual and automated data collection systems 8 57% Manual data collection system 5 36% Automated data collection system 1 7% Other 0 0%
Answered question 14 40% Skipped question 21 60%
Q16. How frequently is pavement condition data collected?
Answer Options Response Count Response Percent Every year 6 43% Every 2 years 1 7% Every 3 years 2 14% Every 4 years 1 7% Other 4 29% Answered question 14 40% Skipped question 21 60%

169
Other Answers:
• Every 5 years
• As Needed
Q17. Which of the following indices are used by your agency to summarize low-volume
pavement conditions?
Answer Options Response Count Response Percent PCI – Pavement Condition Index 5 38% SR – Surface Rating 5 38% PASER – Pavement Surface Evaluation Rating 3 23% RUT – Rut depth 2 15% OPI – Overall Pavement Index 2 15% PSC – Pavement Structural Condition 2 15% IRI – International Roughness Index 1 8% DI – Distress Index 1 8% PQI – Pavement Quality Index 1 8% PSR – Present Serviceability Rating 1 8% CRS – Condition Rating Survey 1 8% PSI – Present Serviceability Index 0 0% Other 3 23%
Answered question 13 37% Skipped question 22 63%
Other Answers:
• Drivability Life
• None
• RQI

170
Q18. Do you use a specific pavement maintenance policy or guidelines for maintaining low-
volume paved roads?
Answer Options Response Count Response Percent Yes 5 22% No 18 78%
Answered question 23 66% Skipped question 12 34%
Please highlight the most important item in your policy:
• Chip seal every 5 to 7 years and overlay every 15 years or as funds are available.
• 7-year rotating program focused on routine, preventive and corrective maintenance.
Priority is given to preventive maintenance.
• Cracking and potholing
• Utilizing the pavement management model to evenly distribute funding throughout the
area allowing for systematic minor repairs to surgically address areas of concern while
waiting for longer term fixes to be approved.
• Treatments on Low Volume Roads shall not exceed 1.5" thickness, with the exception of
isolated, surgical repairs
Q19. Some agencies such as CDOT don't allow applying expensive treatments on their low-
volume paved roads. Do you have similar policy when maintaining low-volume paved roads?
Answer Options Response Count Response Percent Yes 6 25% No 18 75%
Answered question 24 69% Skipped question 11 31%

171
Q20. Do you think that eliminating expensive treatments provides cost-effective strategies for
maintaining low-volume paved roads?
Answer Options Response Count Response Percent Yes 6 26% No 17 74%
Answered question 23 66% Skipped question 12 34%
Q21. What are treatments allowed by your agencies for maintaining low-volume paved roads?
Answer Options Response Count Response Percent Chip Seal 24 96% Crack Seal 22 88% Crack Fill 18 72% Medium Overlay (between 1.5" and 4”) 14 56% Thin Overlay (1.5” or less) 12 48% Full Pavement Reconstruction 9 36% Rut Fill 4 16% Micro-surfacing 3 12% Thick Overlay (over 4”) 1 4% Other 1 4%
Answered question 25 71% Skipped question 10 29%
Other Answers:
• Slurry Seal

172
Q22. Do you recommend or routinely perform targeted rehabilitation of severely distressed areas
within low-volume paved roads prior to application of surface treatments?
Answer Options Response Count Response Percent Yes 19 76% No 6 24%
Answered question 25 71% Skipped question 10 29%
Q23. How do you determine when full length rehabilitation becomes necessary?
Answers:
• Based on available funds. Should happen when PCI goes below 75.
• OCI below 15 and/or need to replace utilities beneath the pavement
• It is determined by the road manager
• Overall road surface conditions
• When other treatments are no longer sufficient.
• By policy, we are not allowed to perform full length rehabs. This would require Chief
Engineer concurrence.
• On an as-needed basis.
• Money
• Visual observation
• Condition index
• Base and pavement condition
• Engineering STIP does.
• Based on pavement survey and field evaluation of entire section.
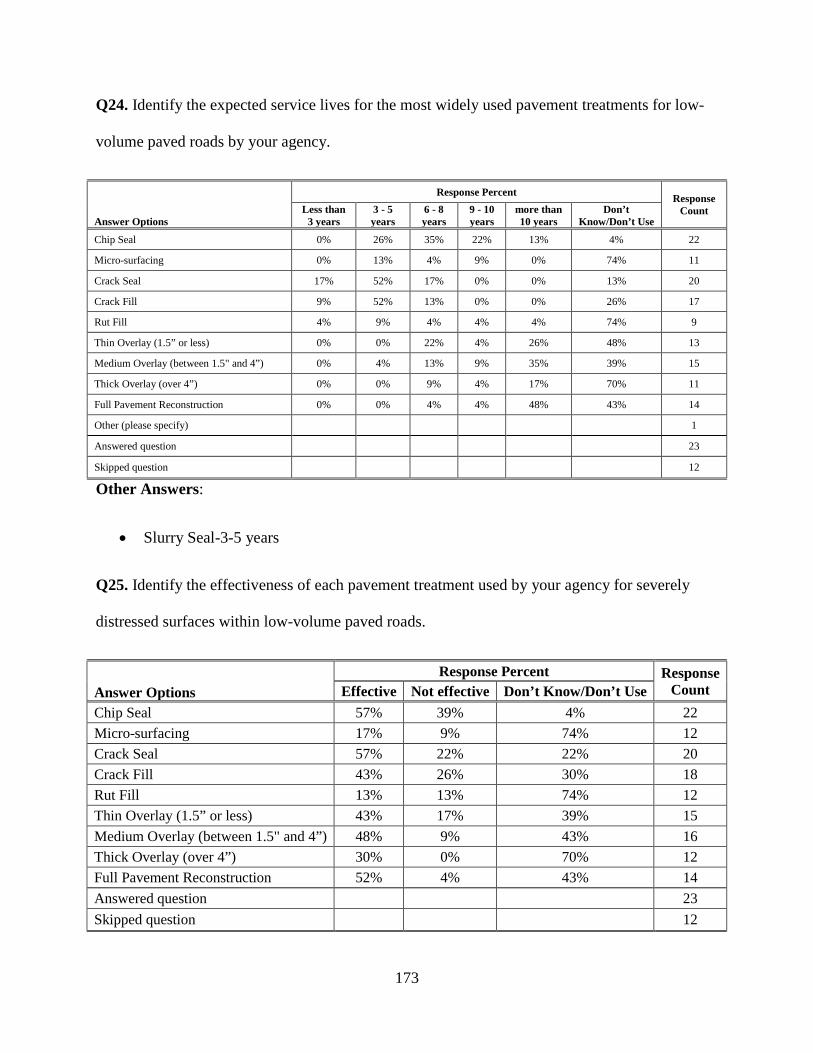
173
Q24. Identify the expected service lives for the most widely used pavement treatments for low-
volume paved roads by your agency.
Answer Options
Response Percent Response Count Less than
3 years 3 - 5 years
6 - 8 years
9 - 10 years
more than 10 years
Don’t Know/Don’t Use
Chip Seal 0% 26% 35% 22% 13% 4% 22
Micro-surfacing 0% 13% 4% 9% 0% 74% 11
Crack Seal 17% 52% 17% 0% 0% 13% 20
Crack Fill 9% 52% 13% 0% 0% 26% 17
Rut Fill 4% 9% 4% 4% 4% 74% 9
Thin Overlay (1.5” or less) 0% 0% 22% 4% 26% 48% 13
Medium Overlay (between 1.5" and 4”) 0% 4% 13% 9% 35% 39% 15
Thick Overlay (over 4”) 0% 0% 9% 4% 17% 70% 11
Full Pavement Reconstruction 0% 0% 4% 4% 48% 43% 14
Other (please specify) 1
Answered question 23
Skipped question 12
Other Answers:
• Slurry Seal-3-5 years
Q25. Identify the effectiveness of each pavement treatment used by your agency for severely
distressed surfaces within low-volume paved roads.
Answer Options Response Percent Response
Count Effective Not effective Don’t Know/Don’t Use Chip Seal 57% 39% 4% 22 Micro-surfacing 17% 9% 74% 12 Crack Seal 57% 22% 22% 20 Crack Fill 43% 26% 30% 18 Rut Fill 13% 13% 74% 12 Thin Overlay (1.5” or less) 43% 17% 39% 15 Medium Overlay (between 1.5" and 4”) 48% 9% 43% 16 Thick Overlay (over 4”) 30% 0% 70% 12 Full Pavement Reconstruction 52% 4% 43% 14 Answered question 23 Skipped question 12

174
Q26. Has your agency implemented any new pavement treatments not listed above for low-
volume paved roads?
Answer Options Response Count Response Percent Yes 3 13% No 20 87%
Answered question 23 66% Skipped question 12 34%
Q27. Please identify these treatments.
Answers:
• Slurry seal
• Full depth reclamation
• Cape seal and Haco
Q28. Are you aware of any new innovative techniques/treatments which might be effective when
maintaining low-volume paved roads?
Answer Options Response Count Response Percent Yes (Please Specify) 4 17%
No 19 83% Answered question 23 66% Skipped question 12 34%
Answers:
• Thin lift overlays
• Double pinned chip seal
• Cold-in-Place Recycle with rejuvenating agent and a chip seal

175
• Double chip seals
• Full depth rec to non-paved
Q29. Do you think that optimization techniques should be used when selecting treatments and
managing low-volume paved roads?
Answer Options Response Count Response Percent Yes 21 100% No 0 0%
Answered question 21 60% Skipped question 14 40%
Q30. Which parameters should be optimized?
Answer Options Response Count Response Percent Optimizing Budgets 14 67% Maximizing PCI – Pavement Condition Index 12 57% Maximizing Remaining Service Life 10 48% Maximizing PSI – Present Serviceability Index 8 38% Minimizing RUT – Rut depth 3 14% Minimizing IRI – International Roughness Index 1 5% Other 1 5%
Answered question 21 60% Skipped question 14 40%
Other Answers:
• Maximizing Drivability Life

176
Q31. When optimizing budget expenditures, what is the approximate percentage of total budgets
that should be allocated to each of the following segment condition levels?
Answer Options 0% 10% 20% 30% 40% 50% 60% 70% 80% Response Count
Weighted Average
Worst segments 0 4 7 3 1 4 1 0 1 21 30% Rapidly deteriorating segments 0 2 6 7 1 3 1 0 1 21 31%
Segments requiring routine maintenance 1 1 4 4 1 2 6 2 0 21 39%
Answered question 21 Skipped question 14

177
Appendix D-1: Colorado Department of Transportation Material
Advisory Committee Survey

178

179

180
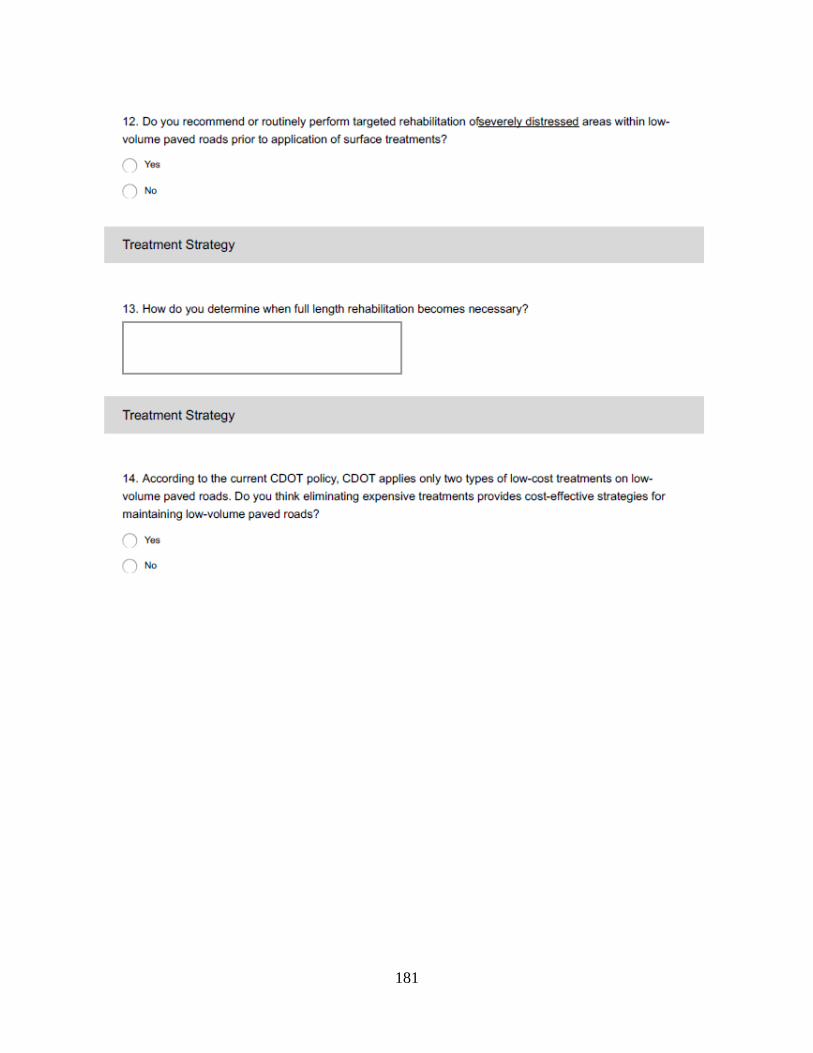
181
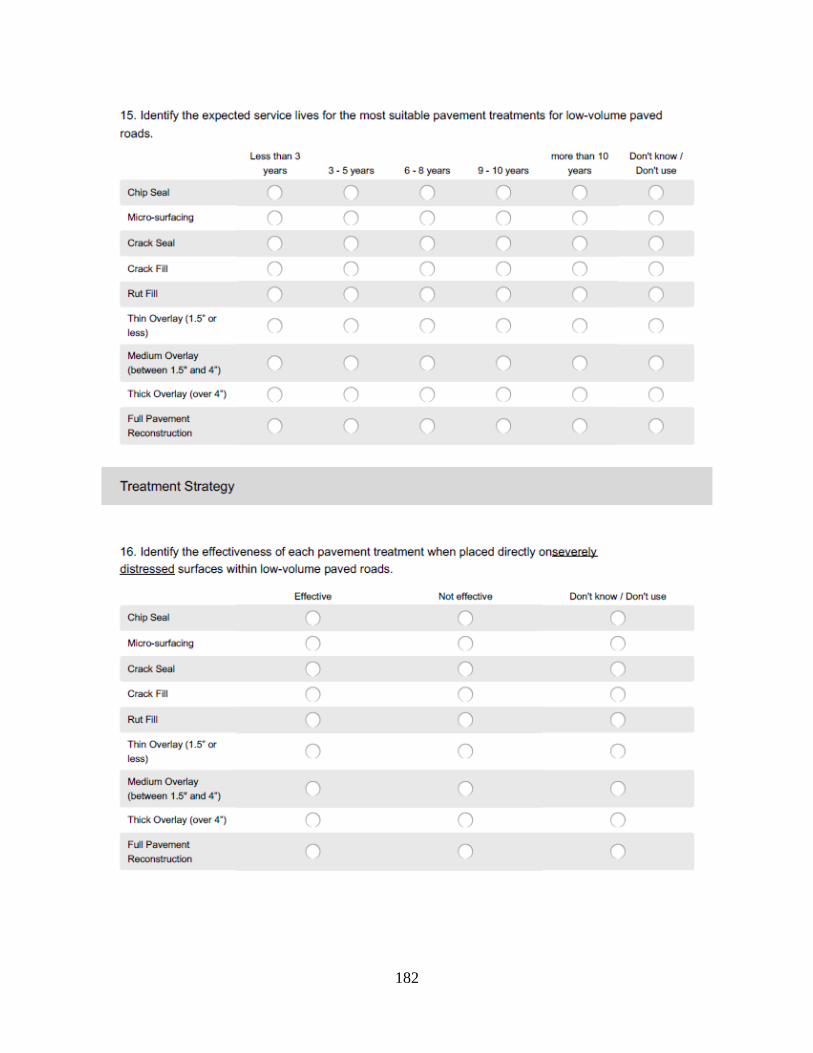
182

183

184
Appendix D-2: Colorado Department of Transportation Material
Advisory Committee Responses
Q1. Please enter your contact information:
Res.# Name Title: CDOT Region: Email Address: Phone Number:
1 Michael Stanford Asphalt Program Manager - HQ Staff Materials [email protected] +1 3033986576
2 Bob Mero Pavement Manager 1 [email protected] +1 3033986703
3 James Chang Region Materials Engineer South and West 1 [email protected] +1 3033986702
4 Bill Schiebel CDOT Materials and Geotechnical Branch Manager CO [email protected] +1 3033986501
5 Gary Dewitt Region 4 Materials Engineer CO [email protected] +1 9703502379
6 Craig Wieden Materials Engineer Region 2 [email protected] +1 7195465438
7 Jay Goldbaum Pavement Design Program Manager Colorado [email protected] +1 3033986561
8 Jeremy Lucero Region Materials Engineer 3 [email protected] +1 9706837562
Q2. How many miles of low-volume paved roads are in your region?
Answer Options Response Count Response Percent More than 250 miles 5 63%
200 – 250 miles 0 0% 150 – 199 miles 0 0% 100 – 149 miles 0 0% 50 – 99 miles 2 25% 10 – 49 miles 0 0%
Less than 10 miles 1 13% Answered question 8 Skipped question 0

185
Q3. The current CDOT definition for low-volume paved roads includes roads carrying: Average
Daily Traffic (ADT) less than 2000 vehicles per day, and Average Daily Truck Traffic (ADTT)
less than 100 vehicles per day. Do you agree with this definition?
Answer Options Response Count Response Percent Yes 7 88% No 1 12%
Answered question 8 Skipped question 0
Q4. Based on your experience, a low-volume paved road should have which of the following
traffic volume?
Answer Options Response Count Response Percent ADT 0 0%
ADTT 0 0% Answered question 0 Skipped question 8
Q5. According to current CDOT policy, low-volume paved roads are maintained mainly with
minor rehabilitation pavement treatments (less than 1.5" in thickness with isolated, surgical, and
structural repair) when the drivability is low. Do you agree with this policy?
Answer Options Response Count Response Percent Yes 4 50% No 4 50%
Answered question 8 Skipped question 0

186
Q6. How should this policy be changed to better maintain low-volume paved roads?
Answers:
• I understand the philosophy and why we have to do this, but we are finding that these thin
treatments right now are showing issues. In an ideal world, we would not be under a
restriction such as this.
• Should consider the condition of the road for value gained of minor treatments. Many
roads will only see a 1 to 2 year temporary appearance fix with minor treatments.
• I don't think the policy needs to be changed. There is an allowance to do a more
substantial treatment, but it is a length involved process needed to get a more substantial
treatment approved on a low volume road.
• It should be based on cost per mile and not allowable treatments.
Q7. Recently, CDOT started using the Drivability Life (DL) to evaluate the overall condition of
low-volume paved roadways. How did this change affect your decision making when it comes to
maintaining low-volume paved roads?
Answers:
• Does not affect my role as Asphalt Program Manager
• Not at all.
• It affected the type of treatment selected a little bit since the treatment would have to
emphasize smoothness a lot more was previously done in addition to other distresses.
• New treatment types and combination of treatment options are now needed

187
• Surface treatment with little or no structural value are considered more important than
structural improvements.
• I look for the cheapest treatment that can be done that will improve the DL. Often, a chip
seal is recommended through our pavement management system on a low volume road
that has a low DL based on IRI. This type of treatment is not effective at addressing the
cause of the low DL.
• Increased the life without any increase in budgets.
• It tends to provide shorter term solutions.
Q8. CDOT evaluates pavement conditions of low-volume paved asphalt roads in terms of
Fatigue Index, Longitudinal Index, Transverse Index, Ride Index and Rut Index. Do you select
pavement treatments of low-volume paved roads based on any of those indices?
Answer Options Response Count Response Percent Yes 8 100% No 0 0%
Answered question 8 Skipped question 0
Q9. What are the pavement condition indices included when selecting the suitable pavement
treatments on low-volume paved road?
Answer Options Response Count Response Percent FATIG_IDX – Fatigue Index 6 75% LONG_IDX – Longitudinal Index 6 75% TRANSV_IDX – Transverse Index 5 63% RIDE_IDX – Ride Index 4 50% RUT_IDX – Rut Index 5 63% Other 4 50%
Answered question 8 Skipped question 0

188
Other Answers:
• Regional Decision
• This is similar to what we look at for other pavements. All parameters are considered,
however, in the overall evaluation.
• Age as evident by oxidation, alligator cracking, proximity to heavy industry
• All are used, but the treatment needs to address the reason for the low DL
Q10. Other agencies use decision trees to identify pavement treatment options on their low-
volume paved roads. Do you think that developing a decision tree for identifying pavement
treatment options is needed?
Answer Options Response Count Response Percent Yes 5 63% No 3 38%
Answered question 8 Skipped question 0

189
Q11. Which indices/data should be included in the project decision making process to identify
treatments for a specific low-volume paved roads?
Answer Options Response Count
Response Percent
Road Classification 5 100% Pavement Age 3 60% Average Daily Traffic (ADT) 4 80% Average Daily Truck Traffic (ADTT) 4 80% Maintenance History 3 60% FATIG_IDX – Fatigue Index 4 80% LONG_IDX – Longitudinal Index 4 80% TRANSV_IDX – Transverse Index 4 80% RIDE_IDX – Ride Index 2 40% RUT_IDX – Rut Index 3 60% DL - Drivability Life 3 60% Project Site Evaluation Data (cores, soils, distress survey) 5 100%
Degree of Localized Distress Areas 5 100% Performance of Past Treatments 5 100% Cost of Treatment Options 5 100% Cost of Single versus Mix of Combined Treatments 3 60% Available Budget for Low Volume Road System 4 80% Other 1 20%
Answered question 5 Skipped question 3
Other Answers:
• Tenth-mile condition data to I.D. localized repair options. Climate conditions. Winter
maintenance activities and amount. Cost of mix of fixes vs cost of rehab options.

190
Q12. Do you recommend or routinely perform targeted rehabilitation of severely distressed areas
within low-volume paved roads prior to application of surface treatments?
Answer Options Response Count Response Percent Yes 5 100% No 0 0%
Answered question 5 Skipped question 3
Q13. How do you determine when full length rehabilitation becomes necessary?
Answers:
• When "surgical" repairs out-weigh full length rehabilitation.
• It should be an iterative process through data review and field investigations.
• It depends on how quickly the pavement is "deteriorating" and the available budget.
• Combined cost of targeted rehab and repairs plus final full length surface treatment vs
cost of full length rehab options (including final riding surface treatment).
• When the distress becomes too severe and the amount is very large.
Q14. According to the current CDOT policy, CDOT applies only two types of low-cost
treatments on low-volume paved roads. Do you think eliminating expensive treatments provides
cost-effective strategies for maintaining low-volume paved roads?
Answer Options Response Count Response Percent Yes 3 60% No 2 40%
Answered question 5 Skipped question 3

191
Q15. Identify the expected service lives for the most suitable pavement treatments for low-
volume paved roads.
Answer Options
Response Percent Response
Count Less than
3 years 3 - 5 years
6 - 8 years
9 - 10 years
more than 10 years
No Response
Chip Seal 0% 50% 38% 13% 0% 0% 8
Micro-surfacing 13% 13% 38% 25% 0% 13% 8
Crack Seal 13% 63% 25% 0% 0% 0% 8
Crack Fill 25% 63% 13% 0% 0% 0% 8
Rut Fill 25% 38% 25% 0% 0% 13% 8
Thin Overlay (1.5” or less) 13% 38% 50% 0% 0% 0% 8
Medium Overlay (between 1.5" and 4”) 0% 13% 13% 50% 25% 0% 8
Thick Overlay (over 4”) 0% 0% 13% 13% 75% 0% 8
Full Pavement Reconstruction 0% 0% 0% 0% 88% 13% 8
Other (please specify) 0
Answered question 8
Skipped question 0
Q16. Identify the effectiveness of each pavement treatment when placed directly on severely
distressed surfaces within low-volume paved roads.
Answer Options
Response Percent Response
Count Effective Not effective No
Response Chip Seal 0% 100% 0% 8
Micro-surfacing 13% 50% 38% 8 Crack Seal 0% 100% 0% 8 Crack Fill 0% 100% 0% 8 Rut Fill 0% 88% 13% 8
Thin Overlay (1.5” or less) 25% 75% 0% 8 Medium Overlay (between 1.5" and 4”) 100% 0% 0% 8
Thick Overlay (over 4”) 100% 0% 0% 8 Full Pavement Reconstruction 100% 0% 0% 8
Answered question 8 Skipped question 0
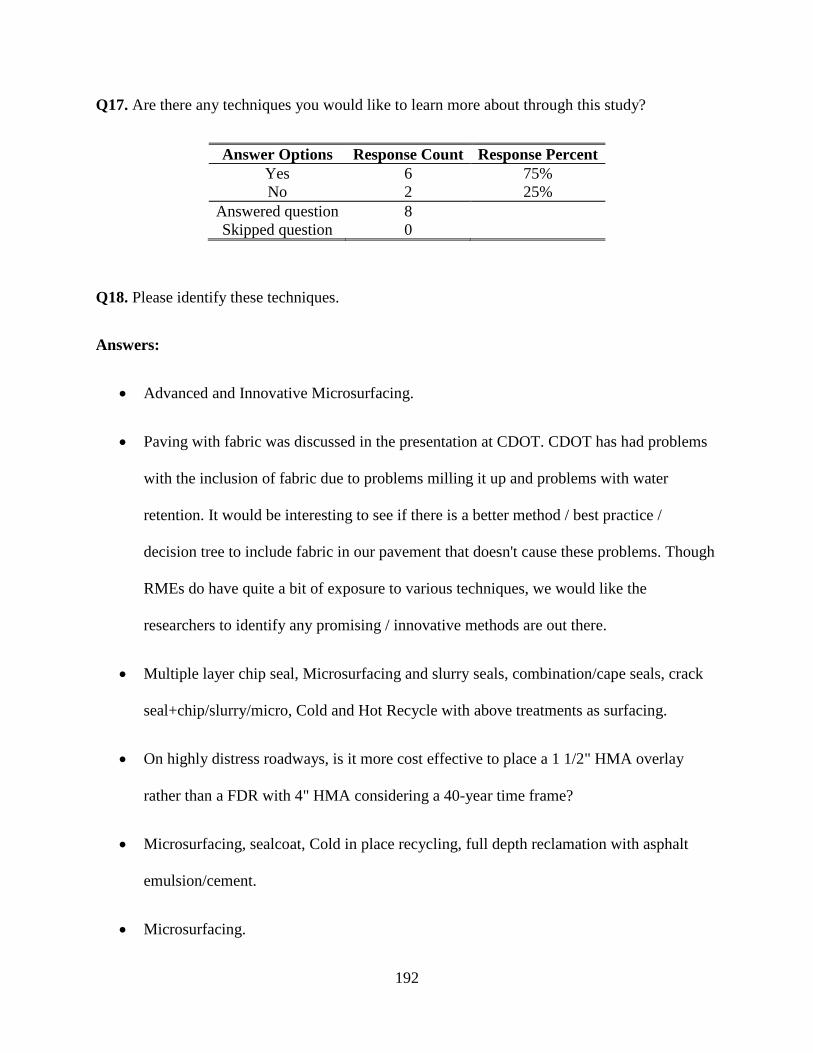
192
Q17. Are there any techniques you would like to learn more about through this study?
Answer Options Response Count Response Percent Yes 6 75% No 2 25%
Answered question 8 Skipped question 0
Q18. Please identify these techniques.
Answers:
• Advanced and Innovative Microsurfacing.
• Paving with fabric was discussed in the presentation at CDOT. CDOT has had problems
with the inclusion of fabric due to problems milling it up and problems with water
retention. It would be interesting to see if there is a better method / best practice /
decision tree to include fabric in our pavement that doesn't cause these problems. Though
RMEs do have quite a bit of exposure to various techniques, we would like the
researchers to identify any promising / innovative methods are out there.
• Multiple layer chip seal, Microsurfacing and slurry seals, combination/cape seals, crack
seal+chip/slurry/micro, Cold and Hot Recycle with above treatments as surfacing.
• On highly distress roadways, is it more cost effective to place a 1 1/2" HMA overlay
rather than a FDR with 4" HMA considering a 40-year time frame?
• Microsurfacing, sealcoat, Cold in place recycling, full depth reclamation with asphalt
emulsion/cement.
• Microsurfacing.