best practices in bid management
TRANSCRIPT
ASIA-PACIFIC CONFERENCE 2016 | MELBOURNE MARRIOTT HOTEL | 8-9 MARCH
Best Practices in Bid ManagementA cross-industry global survey
Presenter: James Smith

ASIA-PACIFIC CONFERENCE 2016
Have you ever wondered …
2
What is best
practice in bid
management?
Which bid management
activities make a difference?How everyone
else does bid
management?
Is our win rate
good enough?
How can we improve
our win rate?
Can better bidding improve
our commercial outcomes?
Do I have to work
these long hours?
How can I get more support
for bid management?

Background to the survey
ASIA-PACIFIC CONFERENCE 2016
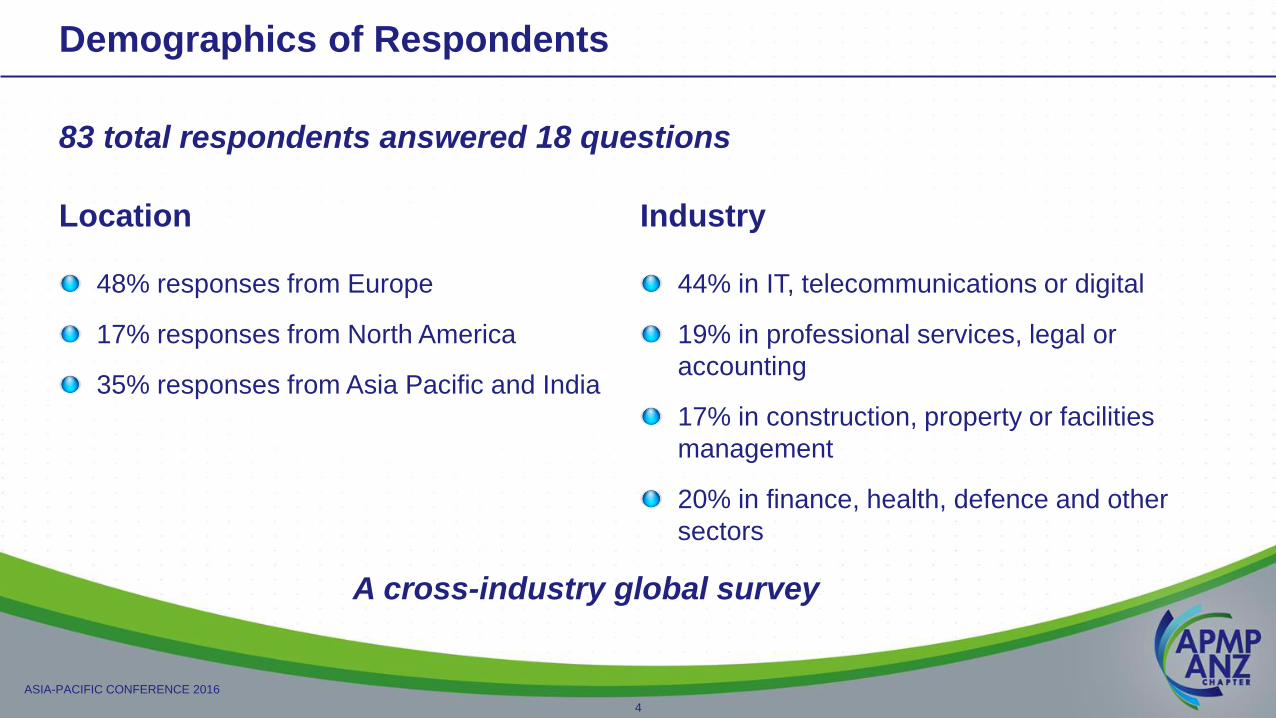
Demographics of Respondents
Location
48% responses from Europe
17% responses from North America
35% responses from Asia Pacific and India
Industry
44% in IT, telecommunications or digital
19% in professional services, legal or
accounting
17% in construction, property or facilities
management
20% in finance, health, defence and other
sectors
4
83 total respondents answered 18 questions
A cross-industry global survey
ASIA-PACIFIC CONFERENCE 2016
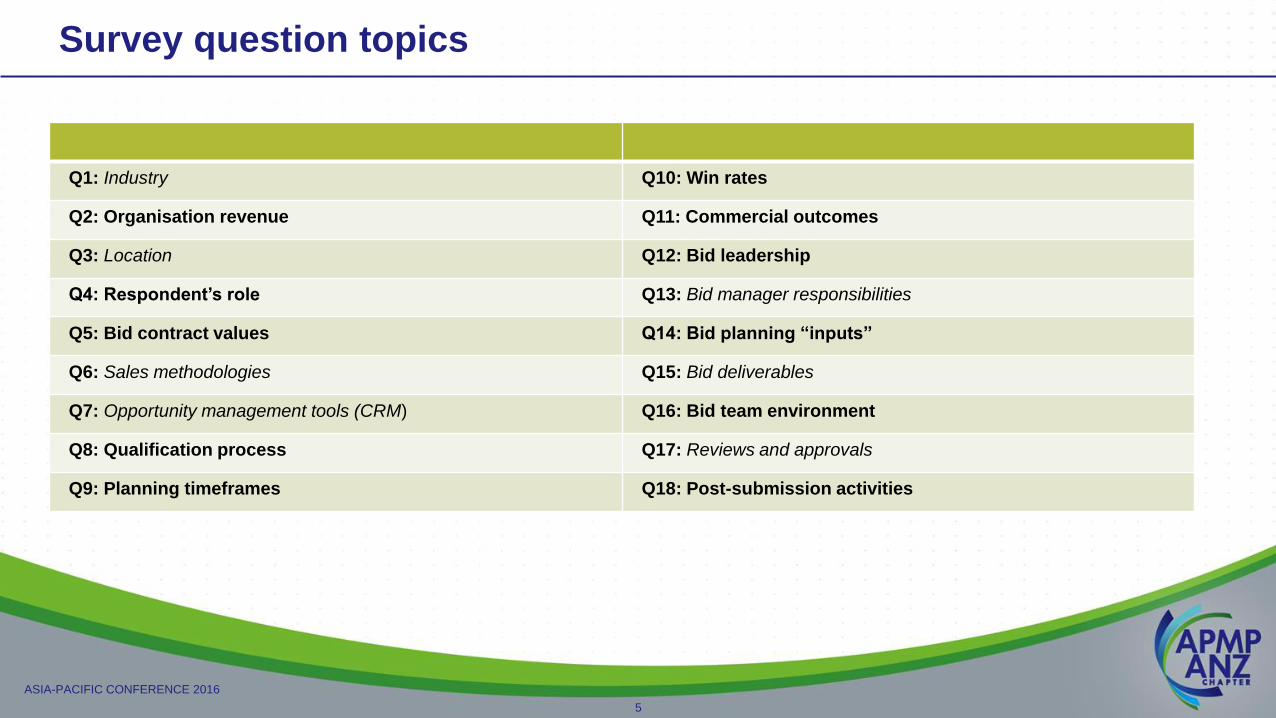
Survey question topics
Q1: Industry Q10: Win rates
Q2: Organisation revenue Q11: Commercial outcomes
Q3: Location Q12: Bid leadership
Q4: Respondent’s role Q13: Bid manager responsibilities
Q5: Bid contract values Q14: Bid planning “inputs”
Q6: Sales methodologies Q15: Bid deliverables
Q7: Opportunity management tools (CRM) Q16: Bid team environment
Q8: Qualification process Q17: Reviews and approvals
Q9: Planning timeframes Q18: Post-submission activities
5

Results Summary
6
ASIA-PACIFIC CONFERENCE 2016
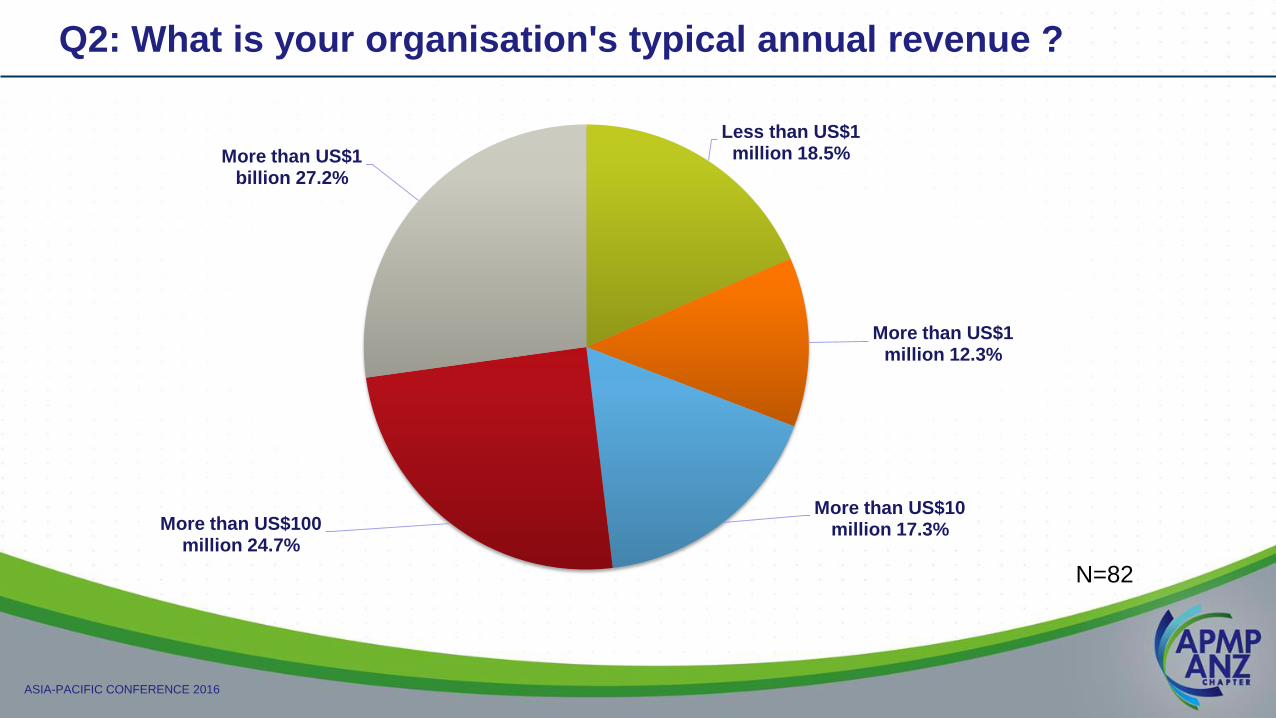
Q2: What is your organisation's typical annual revenue ?
Less than US$1 million 18.5%
More than US$1 million 12.3%
More than US$10 million 17.3%More than US$100
million 24.7%
More than US$1 billion 27.2%
N=82
ASIA-PACIFIC CONFERENCE 2016
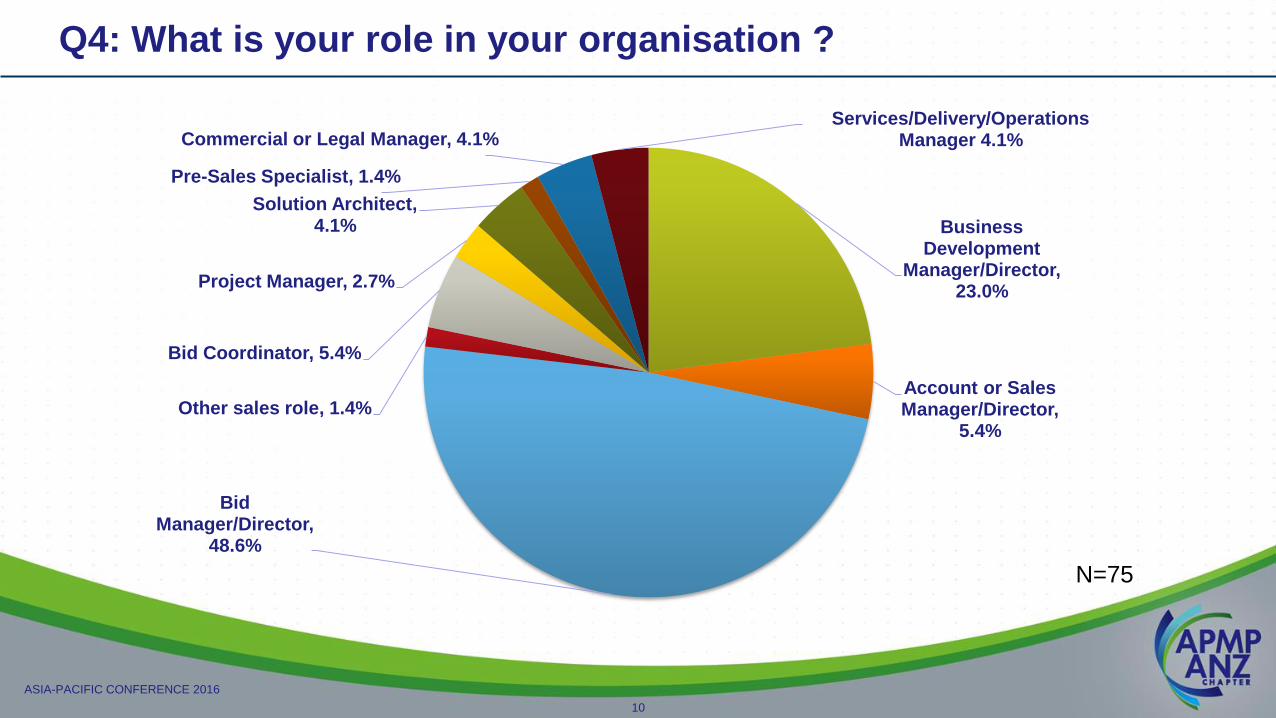
Q4: What is your role in your organisation ?
10
Business Development
Manager/Director, 23.0%
Account or Sales Manager/Director,
5.4%
Bid Manager/Director,
48.6%
Other sales role, 1.4%
Bid Coordinator, 5.4%
Project Manager, 2.7%
Solution Architect, 4.1%
Pre-Sales Specialist, 1.4%
Commercial or Legal Manager, 4.1%Services/Delivery/Operations
Manager 4.1%
N=75
ASIA-PACIFIC CONFERENCE 2016
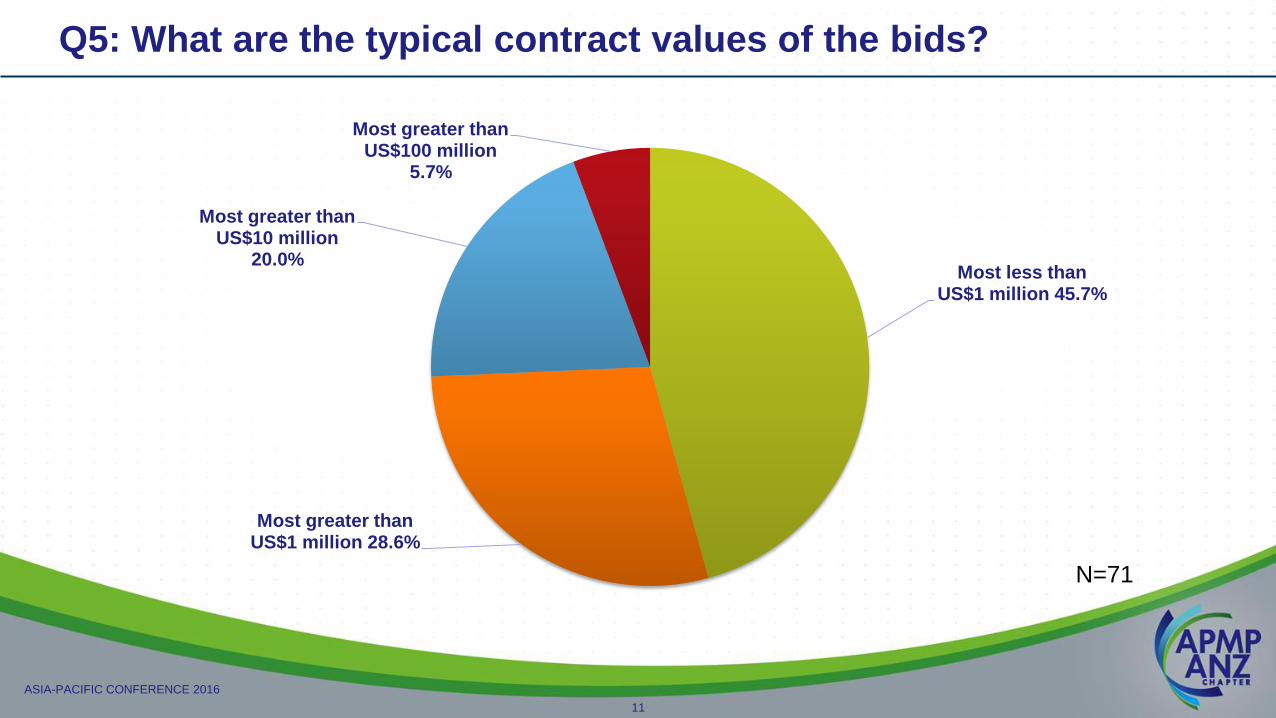
Q5: What are the typical contract values of the bids?
11
Most less than US$1 million 45.7%
Most greater than US$1 million 28.6%
Most greater than US$10 million
20.0%
Most greater than US$100 million
5.7%
N=71
ASIA-PACIFIC CONFERENCE 2016
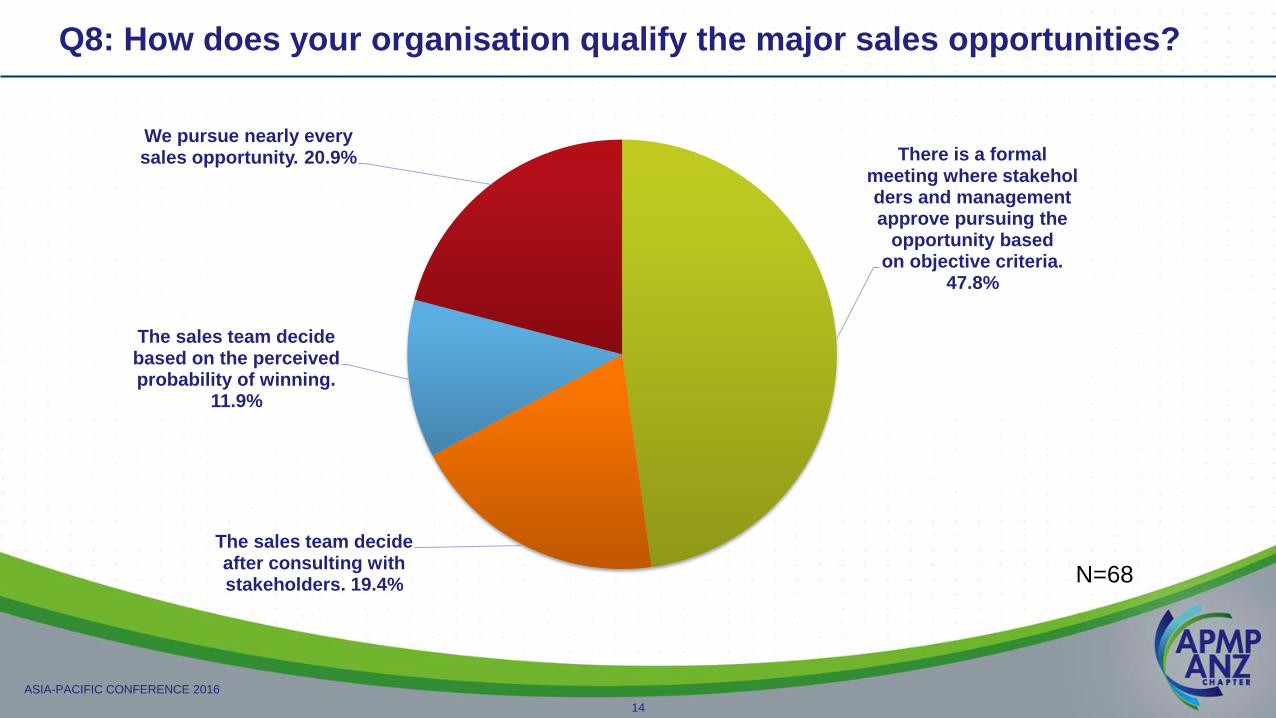
Q8: How does your organisation qualify the major sales opportunities?
14
There is a formal meeting where stakeholders and management approve pursuing the
opportunity based on objective criteria.
47.8%
The sales team decide after consulting with stakeholders. 19.4%
The sales team decide based on the perceived probability of winning.
11.9%
We pursue nearly every sales opportunity. 20.9%
N=68

ASIA-PACIFIC CONFERENCE 2016
Q9: For major opportunities, when do you start planning a response ?
15
6 months or more before submitting.
26.1%
3 months or more before submitting.
29.0%1 month or more before submitting. 24.6%
Less than one month before submitting.
20.3%
N=70
ASIA-PACIFIC CONFERENCE 2016
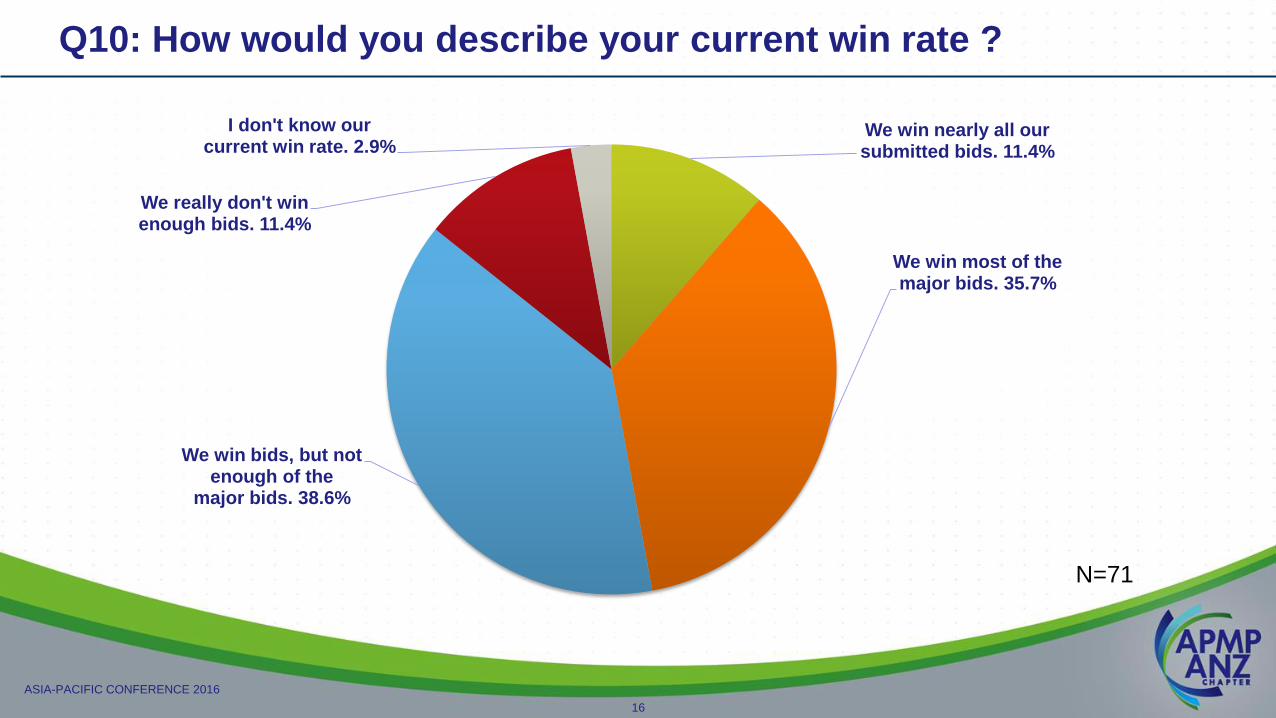
Q10: How would you describe your current win rate ?
16
We win nearly all our submitted bids. 11.4%
We win most of the major bids. 35.7%
We win bids, but not enough of the
major bids. 38.6%
We really don't win enough bids. 11.4%
I don't know our current win rate. 2.9%
N=71

ASIA-PACIFIC CONFERENCE 2016
Q11: How would you describe your commercial outcomes?
17
We usually achieve the profitability forecast in
the business case approved before
submitting the bid.42.0%
We usually make a profit, but less than that forecasted in the
approved business case. 29.0%
We usually rely on contract variations or change requests to
make any profit. 4.3%
We have had several loss-making contracts recently and/or had to pay penalties for non-performance on major
contracts. 2.9%
We do not report profitability of individual
contracts. 11.6%
I do not have access to profitability reports. 10.1%
N=70

ASIA-PACIFIC CONFERENCE 2016
Q12: Who leads the development of a bid ?
18
A director or manager from sales or business
development. 50.8%
A bid manager or bid director.
43.1%
A commercial manager. 1.5%
A manager whose staff will be responsible for delivering the proposed solution. 4.6%
N=66

ASIA-PACIFIC CONFERENCE 2016
Q14: During a bid, which of the following are clearly communicated?
20
64.6%
78.5%
93.8% 93.8%
76.9%69.2%
86.2%
Bid strategyand win themes
Customer'sbusinessobjectives
Scope of theproposedsolution
Time framesand deadlinesfor developing
the bid
Review andapproval
requirements
Responsibilitiesfor planning
and costing thedelivery of the
solution
Responsibilitiesfor developingthe content for
the biddocuments
N=66

ASIA-PACIFIC CONFERENCE 2016
Q16: During a bid, which of the following are usual?
22
52.2%
88.1%79.1%
61.2% 65.7% 67.2%
52.2%
32.8%
Clearleadership and
direction forthe bid team
Kick-offmeeting withthe bid team
Frequentstatus andprogressmeetings
Readilyavailable
informationand content
Structuredreviews of bid
documents
Re-work due tochanging or
missinginformation
Long days,nights and
weekend work.
Frictionbetween
different teams
N=68
ASIA-PACIFIC CONFERENCE 2016
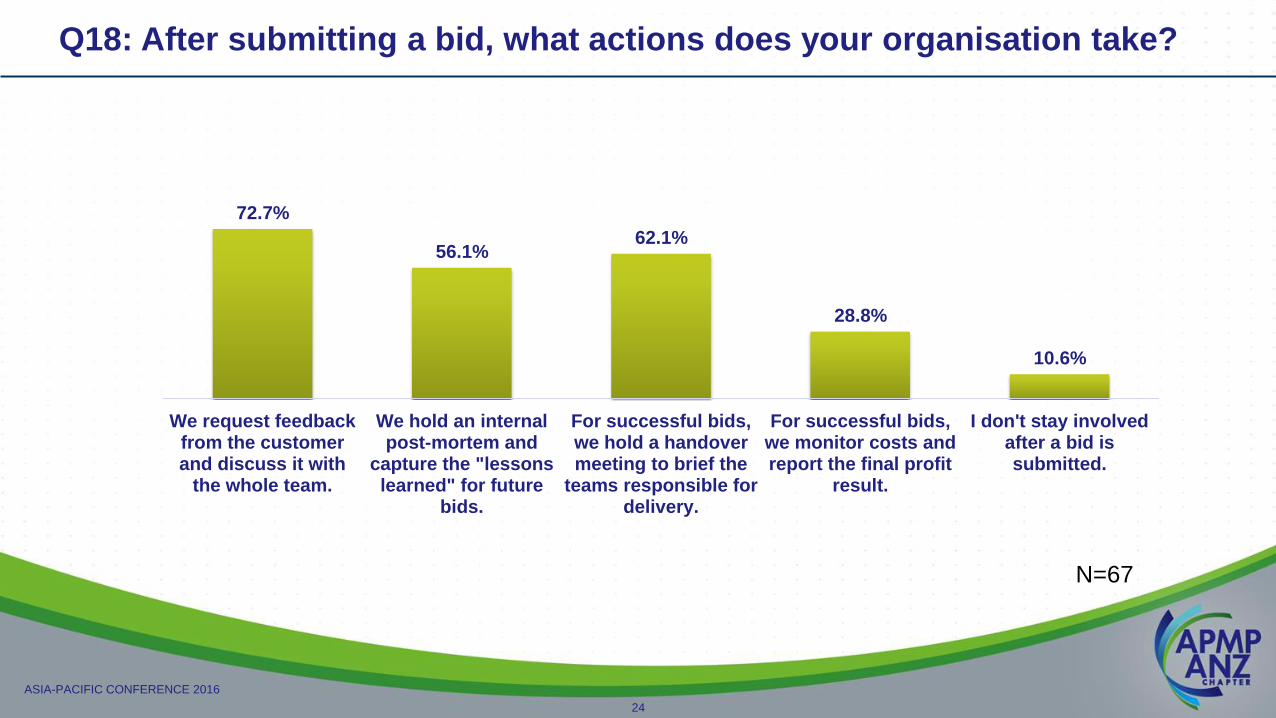
Q18: After submitting a bid, what actions does your organisation take?
24
72.7%
56.1%62.1%
28.8%
10.6%
We request feedbackfrom the customerand discuss it with
the whole team.
We hold an internalpost-mortem and
capture the "lessonslearned" for future
bids.
For successful bids,we hold a handovermeeting to brief the
teams responsible fordelivery.
For successful bids,we monitor costs andreport the final profit
result.
I don't stay involvedafter a bid issubmitted.
N=67

Results analysis
25

ASIA-PACIFIC CONFERENCE 2016
Does sales qualification improve win rates?
No obvious impact of formal
qualification on win rates
Has qualification become a box-
ticking exercise?
Whatever you do, don’t stop
qualifying but do challenge
assumptions.
Q8: Bid win-rateNearly all or
most
Don’t win
enough
Q10: Formal meeting with
all stakeholders and
objective criteria
43% 57%
13 17
Q10: Sales team consult
with other stakeholders
31% 69%
4 9
Q10: Sales team decide
based on perceived
probability of winning
75% 25%
6 2
Q10: We pursue just about
everything
50% 50%
7 7
26
???
???
???
???
ASIA-PACIFIC CONFERENCE 2016
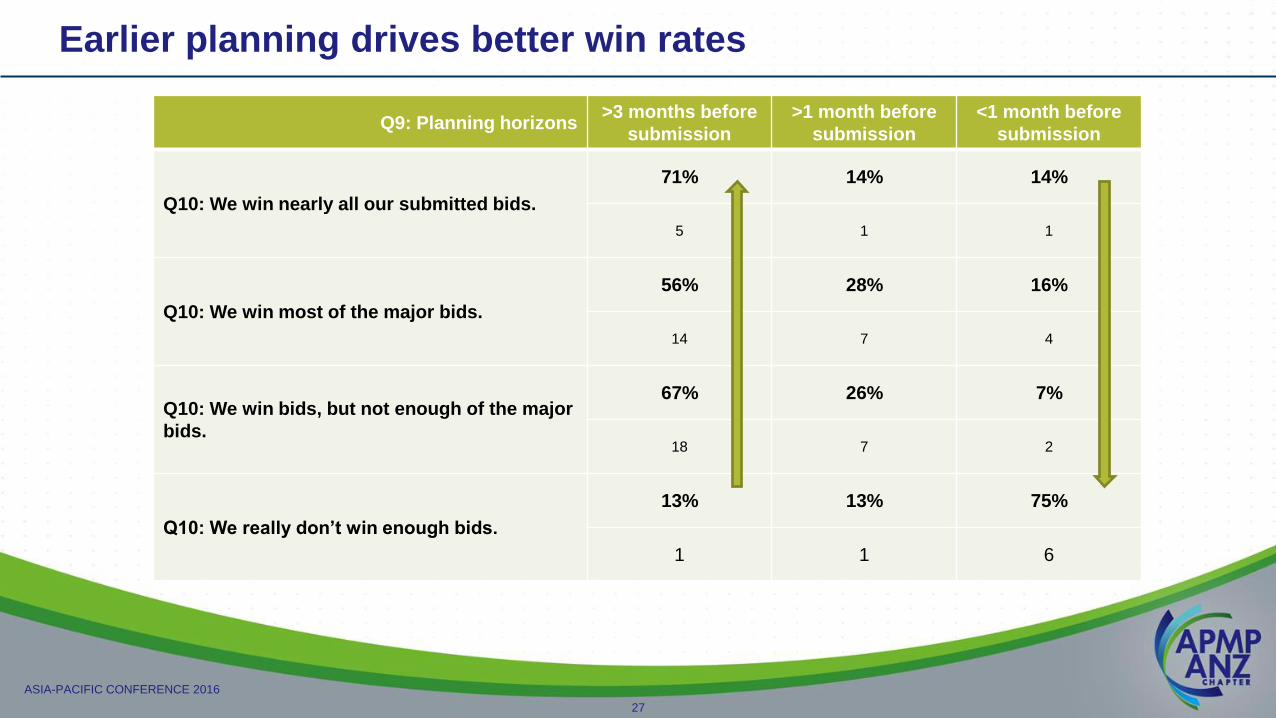
Earlier planning drives better win rates
27
Q9: Planning horizons>3 months before
submission
>1 month before
submission
<1 month before
submission
Q10: We win nearly all our submitted bids.
71% 14% 14%
5 1 1
Q10: We win most of the major bids.
56% 28% 16%
14 7 4
Q10: We win bids, but not enough of the major
bids.
67% 26% 7%
18 7 2
Q10: We really don’t win enough bids.
13% 13% 75%
1 1 6
ASIA-PACIFIC CONFERENCE 2016
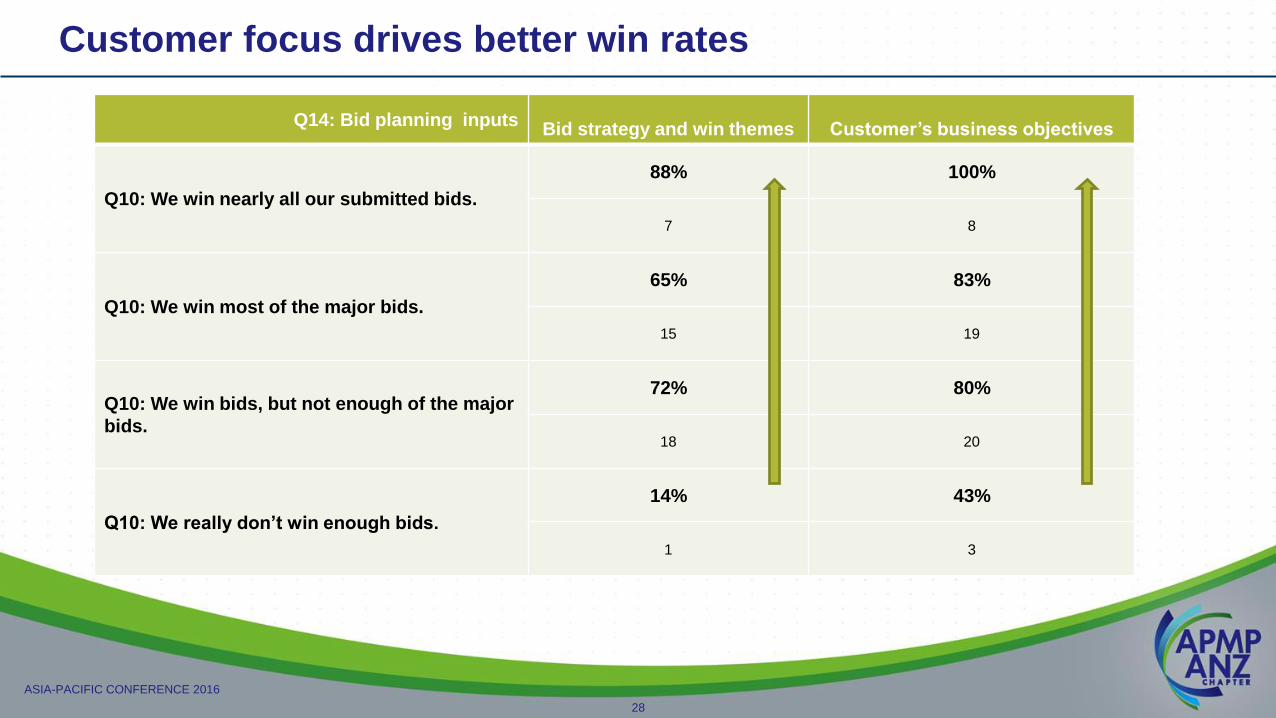
Customer focus drives better win rates
28
Q14: Bid planning inputsBid strategy and win themes Customer’s business objectives
Q10: We win nearly all our submitted bids.
88% 100%
7 8
Q10: We win most of the major bids.
65% 83%
15 19
Q10: We win bids, but not enough of the major
bids.
72% 80%
18 20
Q10: We really don’t win enough bids.
14% 43%
1 3

ASIA-PACIFIC CONFERENCE 2016
Leadership and team work drive better win rates
29
Q16: Bidding environmentClear leadership and direction Friction between teams
Q10: We win nearly all our submitted bids.
100% 0%
8 0
Q10: We win most of the major bids.
38% 38%
9 9
Q10: We win bids, but not enough of the major
bids.
60% 40%
15 10
Q10: We really don’t win enough bids.
25% 38%
2 3
ASIA-PACIFIC CONFERENCE 2016
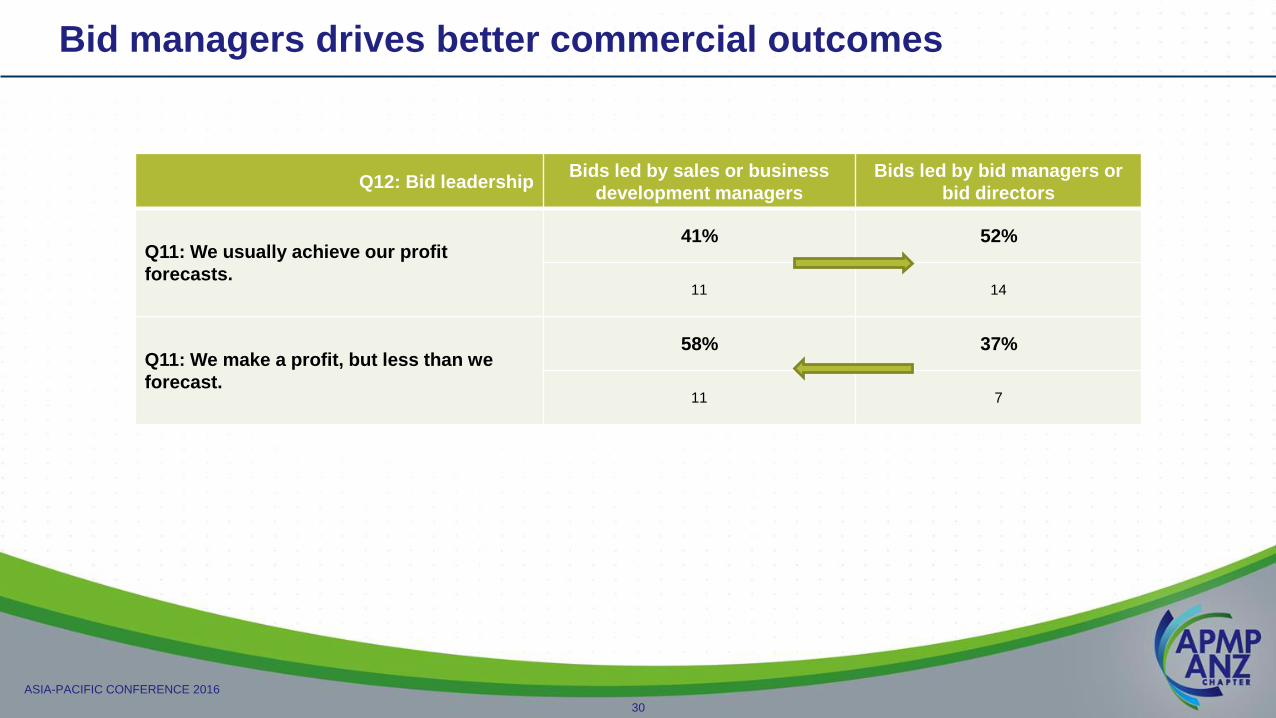
Bid managers drives better commercial outcomes
30
Q12: Bid leadershipBids led by sales or business
development managers
Bids led by bid managers or
bid directors
Q11: We usually achieve our profit
forecasts.
41% 52%
11 14
Q11: We make a profit, but less than we
forecast.
58% 37%
11 7
ASIA-PACIFIC CONFERENCE 2016
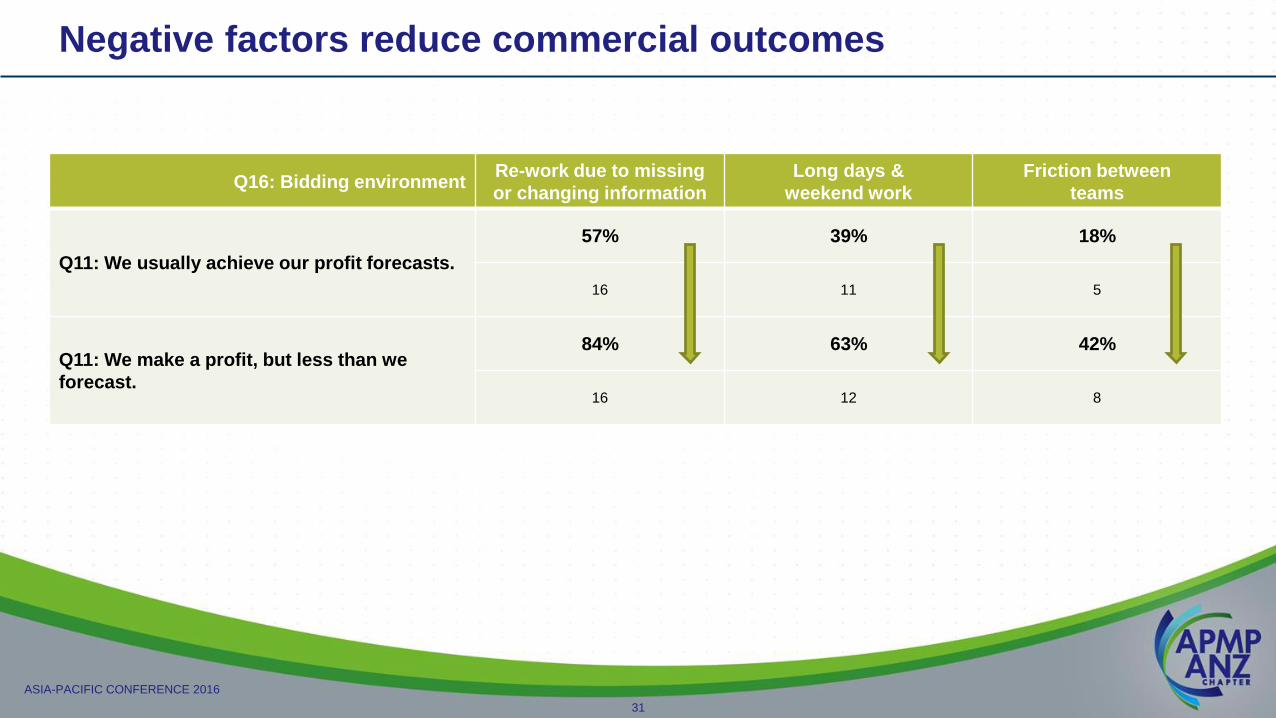
Negative factors reduce commercial outcomes
31
Q16: Bidding environmentRe-work due to missing
or changing information
Long days &
weekend work
Friction between
teams
Q11: We usually achieve our profit forecasts.
57% 39% 18%
16 11 5
Q11: We make a profit, but less than we
forecast.
84% 63% 42%
16 12 8
ASIA-PACIFIC CONFERENCE 2016
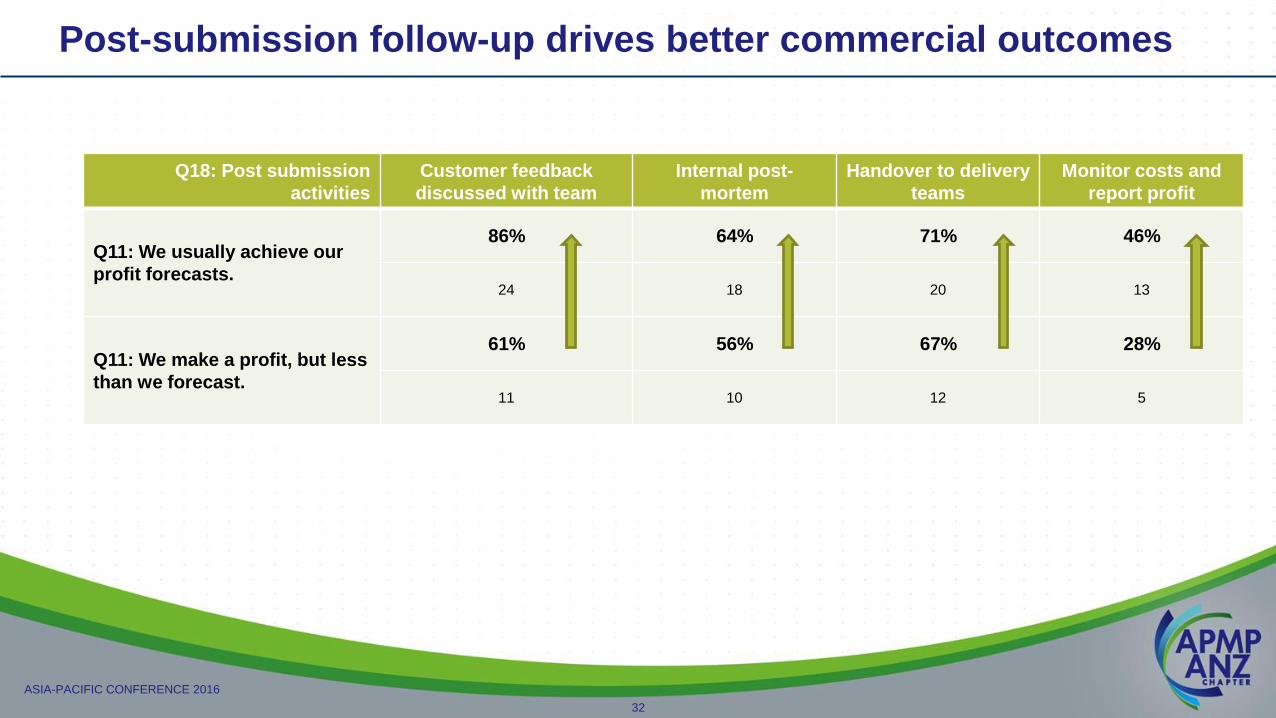
Post-submission follow-up drives better commercial outcomes
32
Q18: Post submission
activities
Customer feedback
discussed with team
Internal post-
mortem
Handover to delivery
teams
Monitor costs and
report profit
Q11: We usually achieve our
profit forecasts.
86% 64% 71% 46%
24 18 20 13
Q11: We make a profit, but less
than we forecast.
61% 56% 67% 28%
11 10 12 5
ASIA-PACIFIC CONFERENCE 2016
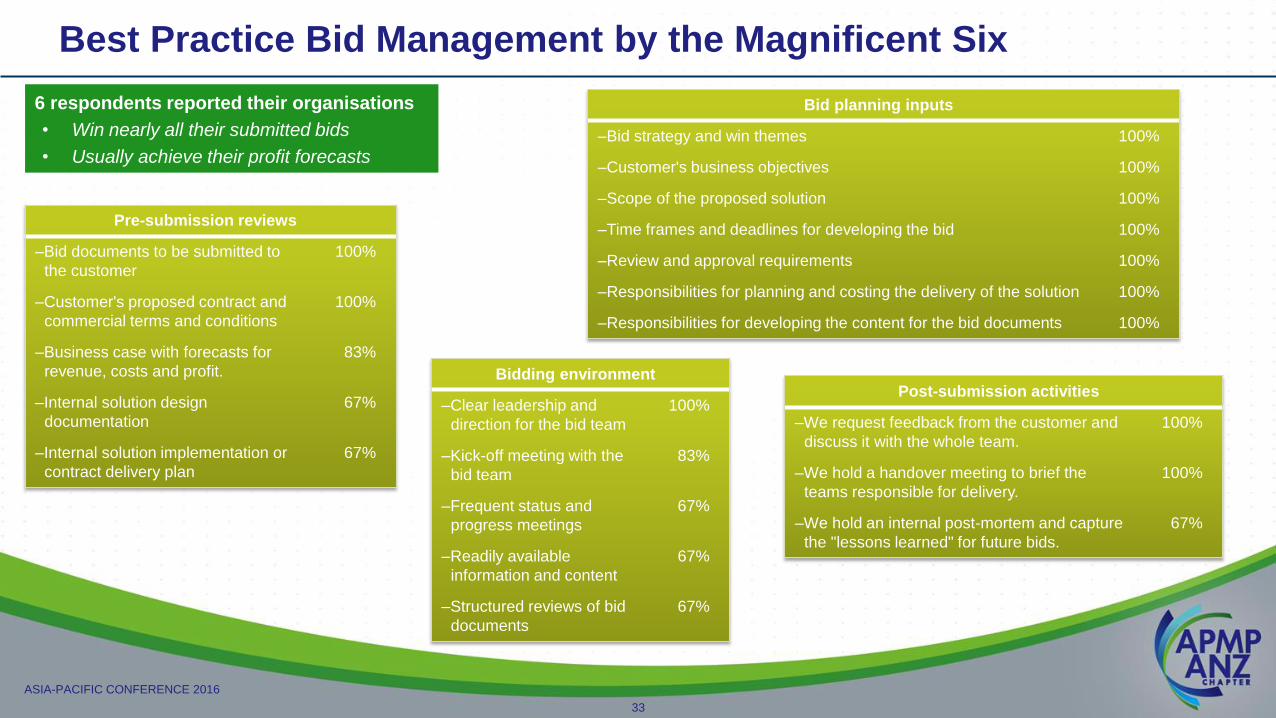
Best Practice Bid Management by the Magnificent Six
33
6 respondents reported their organisations
• Win nearly all their submitted bids
• Usually achieve their profit forecasts
Bidding environment
–Clear leadership and
direction for the bid team
100%
–Kick-off meeting with the
bid team
83%
–Frequent status and
progress meetings
67%
–Readily available
information and content
67%
–Structured reviews of bid
documents
67%
Bid planning inputs
–Bid strategy and win themes 100%
–Customer's business objectives 100%
–Scope of the proposed solution 100%
–Time frames and deadlines for developing the bid 100%
–Review and approval requirements 100%
–Responsibilities for planning and costing the delivery of the solution 100%
–Responsibilities for developing the content for the bid documents 100%
Pre-submission reviews
–Bid documents to be submitted to
the customer
100%
–Customer's proposed contract and
commercial terms and conditions
100%
–Business case with forecasts for
revenue, costs and profit.
83%
–Internal solution design
documentation
67%
–Internal solution implementation or
contract delivery plan
67%
Post-submission activities
–We request feedback from the customer and
discuss it with the whole team.
100%
–We hold a handover meeting to brief the
teams responsible for delivery.
100%
–We hold an internal post-mortem and capture
the "lessons learned" for future bids.
67%

ASIA-PACIFIC CONFERENCE 2016
34
Thanks, and please follow me for more discussion of this survey.
James Noel SmithFounder, Bid.Win.Deliver FrameworkM: +61 439 617 [email protected]
Originally presented through JNS Business Development Pty Ltd