best practices for optimization and scale-up of ... · within the feed side of the ultrafiltration...
TRANSCRIPT

Spring 2012 BioProcessing Journal • • www.bioprocessingjournal.com30
TRENDS & DEVELOPMENTS IN BIOPROCESS TECHNOLOGY
Introduction
Tangential flow filtration (TFF) is widely used in biopharmaceutical processing for protein purification – a common application for TFF is ultrafiltration for concentration/diafiltration of proteins. In this type of
application, the product protein is retained (concentrated) within the feed side of the ultrafiltration membrane, while the buffer components and other small impurities (smaller than the membrane pore size) freely pass through the membrane into the permeate side. Several scholarly articles are available in literature[1-6] which discuss the ultrafiltration application as well as its optimization strategies.
Another category of application where TFF finds significant use is in the clarification of cell culture bioreactor and microbial fermenter feed solutions using microfiltration membranes. In some of these microfiltration TFF applications (e.g., mammalian cell culture clarification), the product (protein) freely passes through the microfiltration membrane and is recovered on the permeate side, while the contaminating impurities (cells, cell debris, colloids) are retained on the feed side of the membrane. In certain other microfiltration TFF applications (allantoic fluid clarification in egg-based flu
process), the product (flu virus) may get concentrated on the feed side of the microfiltration membrane (similar to an ultrafiltration step), while the contaminating impurities (ovalbumin, etc.) may get removed into the permeate side.
In either category of microfiltration TFF application, a noteworthy feature is the low transmembrane pressures (TMP) (in the range of 1–3 psi) required for the process operation. Secondly, a microfiltration TFF step is also limited by a maximum throughput or capacity obtainable under a given set of operating conditions, which may potentially limit or determine process sizing. The low TMP requirement, along with the potential throughput limitations, demands a special approach or methodology to develop a robust, optimized process condition for a microfiltration TFF process. While there is a fair amount of literature that describes the theory and propensity for fouling of a microfiltration TFF process[1,7-9], a practical method for developing and optimizing a microfiltration process in biopharmaceutical processing is often not clearly treated or delineated.
The current article is devoted to describing a robust methodology to develop and optimize a microfiltration TFF process.
Best Practices for Optimization and Scale-Up of Microfiltration TFF Processes
By BALA RAGHUNATH*, WANG BIN, PRIYABRATA PATTNAIK, and JEROEN JANSSENS
ABOUT THE AUTHORS
Bala Raghunath, PhD, is the Director of Asia/India BioManufacturing Sciences Network, Merck Millipore, Singapore. Wang Bin, MS, is the Manager of BioManufacturing Sciences Network, Merck Millipore, China.
Priyabrata Pattnaik, PhD, is the Technical Manager of Biomanufacturing Sciences Network, Merck Millipore, Singapore. Jeroen Janssens, BE, is a Biomanufacturing Engineer, Merck Millipore, Belgium.
*Dr. Raghunath is the corresponding author: Biomanufacturing Sciences and Training Centre
1 Science Park Road, #02-10/11 The Capricorn, Singapore 117528 Phone: +65-6403-5314 | Fax: +65-6403-5322 | Email: [email protected]
RP4111EN00

Spring 2012 BioProcessing Journal • • www.bioprocessingjournal.com31
TFF Microfiltration TheoryThe stagnant film model (see Figure 1 and Equation 1),
which is based on the balance between convective transport and diffusive (Brownian) back transport, is found to significantly underpredict the observed permeate fluxes in TFF microfiltration processes.
Equation 1. Where Cb = concentration of solute in the bulk feed solution, Cwall = concentration of solute at membrane wall, and D = Brownian diffusion coefficient of the solute, ∂ = boundary layer thickness, then solute passage (or sieving, σ) through the membrane is assumed to be zero (i.e., σsolute = 0). Therefore, Cp = concentration of solute in the permeate = 0.
In Brownian diffusion[1], the filtrate flux would be expected to decrease with increase in particle size (due to reduction in the diffusion coefficient, D, where D α 1/dp, dp = particle size). In contrast, experimental data indicate that, in TFF microfiltration, the flux increases with an increase in particle size. Many theories[1, 7, 10-12] have been proposed to successfully describe the increased permeate flux in TFF microfiltration process – typically, by ascribing an alternate mode of particle back diffusion to the fluid bulk from the membrane surface. The result is a significantly enhanced effective particle diffusion coefficient which is modeled to arise from either inertial migration, shear-induced diffusion, and/or lateral migration of particle along a ‘flowing’ cake. The relative importance of the Brownian diffusion, vis-à-vis the shear induced diffusion or the inertial migration model, may have to do with the size of the particles/solute that is being microfiltered (described by Zeman and Zydney[1]).
Peculiarities of a TFF Microfiltration Process and its Impact on Process Design and Optimization
One of the key factors that can ensure a stable and successful TFF microfiltration process operation is the design to control permeate flux (as opposed to controlling TMP in a typical TFF process) to reasonable levels in order to manage/reduce polarization and fouling. This may be understood by examining some of the peculiarities of a TFF microfiltration process: 1) a TFF microfiltration process typically has a critical or maximum flux associated with it; and 2) a critical flux is the point beyond which the process becomes unstable (at a given cross-flow rate). Process instability is evidenced in the form of sudden and consistent increase in TMP (if permeate flux is controlled) or decline in flux (if TMP is controlled) beyond a certain
operating point (flux or TMP). Process instability may also be marked by a sharp decline in the sieving or passage of the desired solute (protein) of interest.
There are several references[1, 13, 14] that discuss the theoretical basis for critical flux in colloidal TFF microfiltration – one of the explanations put forth is that the critical flux is related to the coagulation of the dispersed phase close to the membrane surface, followed by deposition upon it. Accumulated matter at the membrane is thought to undergo a phase transition from a dispersed phase (concentration polarization) to a condensed phase (multi-layer deposit). From an observational (experimental) perspective, “critical” flux may also be thought of as the flux below which the TMP remains stable and fouling is reversible. Figure 2 graphically shows the point of critical flux in a TFF microfiltration process.
FIGURE 1. Schematic description of the stagnant film model.
FIGURE 2. TMP vs. flux profile showing onset of critical flux.
RP4111EN00

Spring 2012 BioProcessing Journal • • www.bioprocessingjournal.com32
While it is easy to describe the TMP instability qualitatively by observing the TMP vs. flux curve for TMP rise, one may need a quantitative guideline to assess the achievement of critical flux – as a rule of thumb, one may consider critical flux to have been reached when TMPfinal ÷ TMPinitial > 1.5–2.0. Therefore, for stable, robust operation, a TFF microfiltration process needs to be designed to operate below the critical flux.
Now, the membranes that are used for the TFF microfiltration process typically have high intrinsic membrane permeability – > 35–1000 LMH/psi (Figure 3).
Our general experience with TFF microfiltration of a variety of biopharmaceutical fluids such as mammalian cell culture harvest, bacterial cell harvest, bacterial cell lysate, yeast cell harvest, and yeast cell lysate indicates that the critical operating flux ranges between 15–200 LMH. (Stable operating flux ranges between 15–100 LMH.)
Table 1 indicates that in order to obtain operating fluxes in the range of 15–200 LMH with microfiltration membranes (intrinsic membrane permeability of > 35–1000 LMH/psi), very low operating TMPs are needed. Table 1 indicates that the membrane with an intrinsic permeability of 35 LMH/psi would require a TMP of less than 3 psi to maintain a stable flux of 100 LMH. It would be important to understand that it is not easy to achieve and maintain such low TMPs on a production-scale system by controlling the feed pump and retentate valve alone (as it is commonly done with TFF ultrafiltration systems). To understand this better, it would be helpful to look at a typical production scale TFF microfiltration system process flow diagram, as shown in Figure 4.
There are two driving forces for a TFF process: 1) pressure drop, ∆PM, which relates to the cross-flow within
FIGURE 3. Membrane normal water permeability range for various pore sizes.
TABLE 1. TMP requirements as function of process flux and membrane intrinsic permeability.
Membrane Intrinsic Permeability,
LMH/psi
TMP Required, psi
Flux = 35 LMH Flux = 100 LMH
35 1.00 2.9
100 0.40 1.0
400 0.10 0.3
1000 0.04 0.1
FIGURE 4. Schematic for a TFF process.
RP4111EN00

Spring 2012 BioProcessing Journal • • www.bioprocessingjournal.com33
the membrane modules; and 2) the TMP, the motive force responsible for the flux. Now, the TMP is given by:
If we define the following:
Typically, Po = 0 as the discharge is into the atmospheric pressure.
After the simple algebraic substitution of Equations 3 a/b/c in Equation 2, we obtain:
From Equation 4, we notice that the TMP is coupled with the pressure drop across the membrane module (∆PM). Now we can proceed to see the challenges involved in obtaining low TMP (with feed flow and retentate valve control alone).
To achieve a low TMP, the retentate valve needs to be open (≈ ∆Pvalve = 0). For large systems, the frictional pressure drop due to the flow of fluid through piping, fitting, bends, etc. (i.e., Psystem) may be a measurable factor (∆Psystem ≈ 3–5 psi). But for this discussion, we are going to assume that the pressure drop is ∆Psystem ≈ 3 psi.
For open-channel membranes (as are typically used for TFF microfiltration clarification applications), the typical membrane module pressure drop, ∆PM, for the characteristic cross-flow will be in the range of 1–3 psi. Again, for our discussion, we will assume that it is ∆PM ≈ 2 psi.
If the permeate were to free-flow (i.e., Pp = 0 psi) and our desired operating TMP is 4 psi, then we may see from Equation 4 that the minimum obtainable TMP is:
which is greater than the 4 psi we desire.We see that it is not possible to obtain a TMP of
4 psi with these conditions without having a positive permeate pressure. In other words, the permeate needs to be restricted (typically done using a pump, as we will see later) to provide positive permeate pressure. This restriction of the permeate flow (permeate flow control) allows us to obtain and maintain the desired, lower TMP (4 psi in our example) and consequently, the stable lower operating permeate flux required for robust process operation. Figure 5 shows the optimum system design for
a TFF microfiltration process with permeate flux control (using a permeate pump).
Lastly, a TFF microfiltration process is also characterized by the process having a certain maximum throughput or capacity for a given operating condition (i.e., at a certain permeate flux and cross-flow). Capacity may be defined as the volume of fluid filtered (i.e., permeate volume) per unit area of the membrane before a process end-point is reached – it may potentially result from pore plugging due to the presence of small colloidal particles. A process end-point may either be the transmembrane pressure across the membrane filter at constant filtrate flow (commonly observed as shown in Figure 6) or product retention at or above a certain throughput.
FIGURE 5. Schematic for a two-pump TFF process.
FIGURE 6. Maximum throughput or capacity in a TFF microfiltration process.
RP4111EN00

Spring 2012 BioProcessing Journal • • www.bioprocessingjournal.com34
In this sense, the process has similarities to normal
flow filtration (NFF) processes, where capacity and flow-
time play an important role in sizing. This also represents
a behavior where the TFF microfiltration process differs
from a TFF ultrafiltration process. In the latter, the
loading (L/m2) is important from a characterization
perspective, but is typically not seen to be significantly
limiting (so long as the operating conditions are not
widely different).
The capacity is inversely dependent on the operating
flux (i.e., the higher the operating flux, the lower the
capacity). The throughput limitation or process capacity,
which is characteristic of TFF microfiltration process,
introduces a constraint on process sizing (membrane
area requirements) that is not usually a factor in
TFF ultrafiltration sizing. It also has implications for
determining the optimum operating flux for a TFF
microfiltration process as we will see later.
Best Practices Methods for Optimizing a TFF Microfiltration ProcessThe strategy is broadly laid out as:
1. Defining the objectives/success criteria for
the process
2. Membrane selection
3. Operating parameter optimization
4. Sizing
Define the Objectives/Success Criteria for the Process
As the first step, it is important to define and
understand what the TFF microfiltration process must
achieve and what processing goals need to be met.
A good understanding of these objectives will enable
the successful selection of an appropriate membrane
and operating conditions for the process. Important
process objectives to define (and understand) for a TFF
microfiltration process are: 1) feed volume reduction
(e.g., 10-fold); 2) clarification of the feed (removal of
cell and cell debris); and 3) recovery of cells containing
intracellular product.
Next, it would be important to identify and quantify
any criteria by which the success of the operation will
be measured. The primary goals for successful protein
processing are: high product yield, quality, purity, or
product clarity (sterile/column protection, and permeate
turbidity via nephelometric turbidity unit [NTU] or
permeate throughput on a sterile filter). In the end, the
economic objectives for the process must be met and any
constraints such as process time, unit operation size, or
buffer use must be observed.
Membrane Selection“Selection of membrane” refers to the membrane material
itself as well as the membrane module format. Common
membrane materials for microfiltration applications
in the biopharmaceutical industry are polyvinyledene
fluoride (PVDF), polyether sulfone (PES), and regenerated
cellulose (RC) membranes. These different materials
offer alternatives in fouling characteristics, chemical
compatibility, and cleaning strategies. The membrane
materials are available in a number of pore size ratings or
nominal molecular weight limits (NMWLs).
The PVDF membranes are hydrophilized to low
fouling and protein adsorption. They are available in
a range of pore sizes from 0.10–0.65 µ. Their minimal
fouling characteristics and robust structure are why they
have been used in a variety of applications over the years.
Traditional PES membranes tend to adsorb protein
as well as other biological components, leading to
membrane fouling and lowered flux. Recent advances
have resulted in modifications of the PES chemistry to
render the membranes more hydrophilic and thus reduce
protein adsorption and fouling. Depending on the
membrane manufacturer, PES membranes are available
in pore size ratings from 0.10–0.65 µ or NMWLs
from 500–1000 kD. These membranes have wider pH
tolerance (0.1– 0.5 M NaOH) and are also robust with
respect to the use of a variety of aggressive cleaning
solutions (e.g., 400–600 ppm hypochlorite).
Finally, regenerated cellulose membranes also find
use in some microfiltration TFF applications – they
are naturally hydrophilic and tend to be low fouling,
and hence easier to clean. They also have limited pH
tolerance compared to the PES membranes.
Commercial TFF membranes of different materials and
grades are available from Merck Millipore, GE Healthcare,
Pall Life Sciences, and Sartorius Stedim Biotech.
Common module formats in which membranes are used
for TFF microfiltration applications include the flat sheet
and hollow fiber configurations. Typically, the flat sheet
configurations are used in the open channel configurations
(i.e., without screens or using a suspended screen). The
open channel configuration provides the ability to handle
suspended solids and colloids without channel or screen
plugging and also facilitates ease of cleaning.
RP4111EN00

Spring 2012 BioProcessing Journal • • www.bioprocessingjournal.com35
Table 2 summarizes the membrane
pore rating and module configurations
that are commonly used for a variety of
TFF microfiltration applications in the
biopharmaceutical industry.
Operating Parameter Optimization As stated in the previous section, TFF
microfiltration processes are characterized
by a limiting flux called “critical” flux above
which the process becomes unstable. The
critical flux is dependent on feed solution
characteristics as well as operating conditions
such as cross-flow and turbulence of the
membrane device. Therefore, the first step
in process development and optimization is
to determine the critical flux for the given
application. An experiment to determine the
critical flux is described later in the article.
Note that it needs to be performed using
permeate flux control with a permeate pump
(as shown in Figure 5).
The TFF microfiltration process design
is often referred to as a “two-pump process”
with one feed pump for recirculatory or
tangential flow requirements and another
permeate pump for permeate flux control.
TABLE 2. Membrane options for various TFF microfiltration applications.
Cell Type Application Membrane Pore Rating* Examples of Device Format
MammalianCell Clarification 0.65 µ (0.45 µ, 0.22 µ) Prostak†, Pellicon V-Screen†, Hollow Fibers
Cell Harvest 0.65 or 0.45 µ Prostak
E. coliLysate Clarification 500–1000 kD (0.10, 0.22, 0.45 µ) Prostak, Pellicon V-Screen, Hollow Fibers
Cell Harvest 500–1000 kD (0.10, 0.22, 0.45 µ) Pellicon V-Screen for Biomax†
YeastLysate Clarification 0.22 or 0.45 µ Prostak, Pellicon V-Screen, Hollow Fibers
Cell Harvest 0.22 or 0.45 µ Prostak, Pellicon V-Screen, Hollow Fibers
Viral Vaccine (MDCK/Vero/Egg)
Cell Clarification/Egg Debris 500–1000 kD (0.45–0.65 µ) Prostak, Pellicon V-Screen, Hollow Fibers
HCP or Inactivating Agent Removal (UF/DF) 500 kDa Prostak, Pellicon V-Screen, Hollow Fibers
Bacterial Vaccines (Diptheria, Pertussis,
Tetanus, Hib)
Cell Clarification 0.22 or 0.45 µ Prostak, Pellicon V-Screen, Hollow Fibers
Conjugated Vaccine Purification (separation of unconjugated
molecules)300–500 kD Prostak, Pellicon V-Screen, Hollow Fibers
*The most commonly used/tested membrane for the particular application. †Prostak, Pellicon, and Biomax are trademarks of Merck Millipore /EMD Millipore.
TFF microfiltration process design: 1. Use the smallest area module necessary for the experiment.
1.1. Example: 0.17 m2 Prostak or 0.1 m2 Pellicon V-Screen or Hollow fiber.
2. Perform experiments in “total recycle” (permeate back to feed vessel).
3. Develop TMP vs. flux data at a given cross-flow:
3.1. With the permeate pump off, ramp up the feed pump to the desired cross-flow rate (see second note below).
3.2. Slowly ramp permeate pump to the desired flux level. The starting flux for many applications would be in the 5–10 LMH range.
3.3. Record inlet, outlet, and permeate pressures over a 20–30 min period (i.e., at 5 or 10 min intervals).
3.4. Monitor stability of TMP (a rapid increase in TMP indicates membrane fouling). Take samples of feed and permeate at the end of the 20–30 min period and analyze for protein concentration (and rejection).
NOTE 1: While it is easy to describe the TMP instability qualitatively by observing the TMP vs. flux curve, one may need some quantitative guidelines to assess the achievement of critical flux. As a rule of thumb, one may consider critical flux to have been reached when TMPfinal ÷ TMPinitial > 1.5–2.0, where initial and final refer to the beginning and end of the 20–30 min time interval.
3.5. If TMP is stable, ramp flux to the next level (10–15 LMH increments).
3.6. Repeat steps 3–5 at increasing flux settings until the critical flux is obtained.
3.7. Steps 3.1–3.6 may be repeated at a different cross-flow.
NOTE 2: At a minimum, perform steps 3.1–3.6. (Step 3.7 is useful complimentary information.) Further, it is helpful to apply a small amount of pressure on the retentate (by closing the retentate valve) as this will allow for the exploration of a broader range of TMPs. For example, one may begin this step with the following settings for feed and retentate pressures: feed pressure = 9 psi; retentate pressure = 6–7 psi as determined by the cross-flow.
RP4111EN00
Spring 2012 BioProcessing Journal • • www.bioprocessingjournal.com36
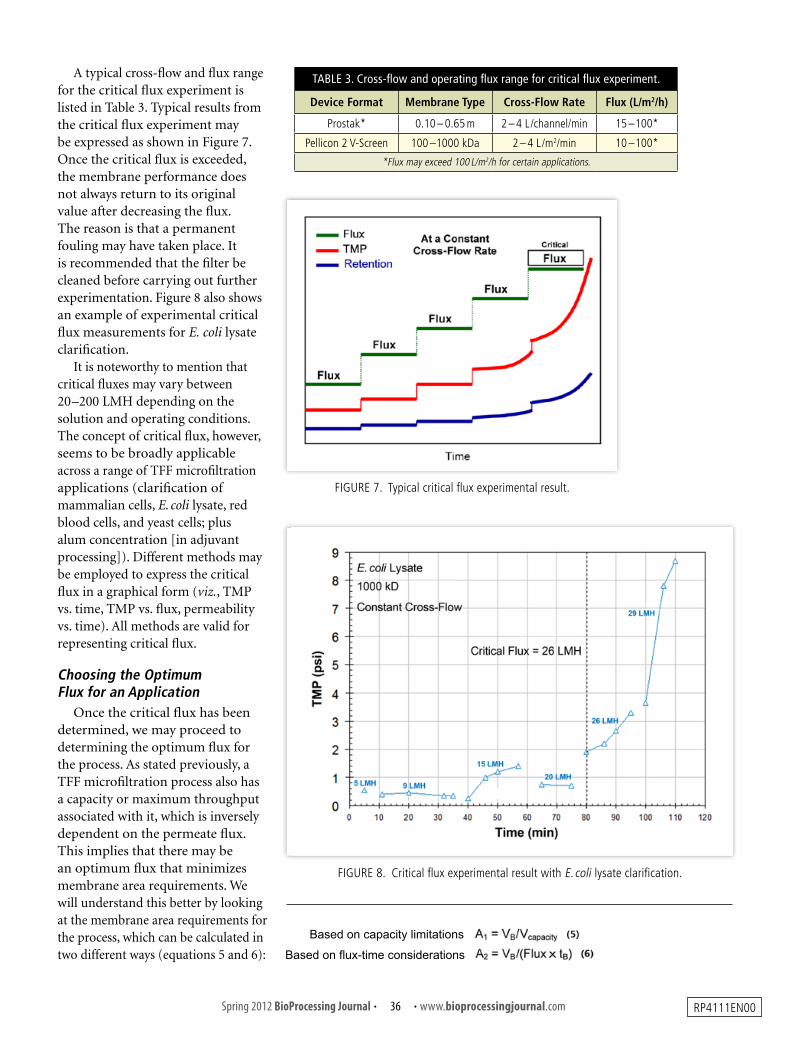
A typical cross-flow and flux range for the critical flux experiment is listed in Table 3. Typical results from the critical flux experiment may be expressed as shown in Figure 7. Once the critical flux is exceeded, the membrane performance does not always return to its original value after decreasing the flux. The reason is that a permanent fouling may have taken place. It is recommended that the filter be cleaned before carrying out further experimentation. Figure 8 also shows an example of experimental critical flux measurements for E. coli lysate clarification.
It is noteworthy to mention that critical fluxes may vary between 20–200 LMH depending on the solution and operating conditions. The concept of critical flux, however, seems to be broadly applicable across a range of TFF microfiltration applications (clarification of mammalian cells, E. coli lysate, red blood cells, and yeast cells; plus alum concentration [in adjuvant processing]). Different methods may be employed to express the critical flux in a graphical form (viz., TMP vs. time, TMP vs. flux, permeability vs. time). All methods are valid for representing critical flux.
Choosing the Optimum Flux for an Application
Once the critical flux has been determined, we may proceed to determining the optimum flux for the process. As stated previously, a TFF microfiltration process also has a capacity or maximum throughput associated with it, which is inversely dependent on the permeate flux. This implies that there may be an optimum flux that minimizes membrane area requirements. We will understand this better by looking at the membrane area requirements for the process, which can be calculated in two different ways (equations 5 and 6):
TABLE 3. Cross-flow and operating flux range for critical flux experiment.
Device Format Membrane Type Cross-Flow Rate Flux (L/m2/h)
Prostak* 0.10 – 0.65 m 2 – 4 L/channel/min 15 – 100*
Pellicon 2 V-Screen 100 – 1000 kDa 2 – 4 L/m2/min 10 – 100*
*Flux may exceed 100 L/m2/h for certain applications.
FIGURE 8. Critical flux experimental result with E. coli lysate clarification.
FIGURE 7. Typical critical flux experimental result.
Based on flux-time considerations
Based on capacity limitations
RP4111EN00

Spring 2012 BioProcessing Journal • • www.bioprocessingjournal.com37
As flux increases, A1 increases (as Vcapacity decreases with the increase in flux), and A2 decreases. Process sizing will be optimum when the area calculated by both methods are equal to one another (i.e., A1 = A2) as shown in Figure 9. In order to determine the optimum operating point (flux), we proceed as follows (note again that the experiments will be carried out with permeate flux control):
FIGURE 9. Determination of optimum operation flux for TFF microfiltration process.
FIGURE 10. Selection of fluxes for optimization experiment.
1. Pick two fluxes below “critical” and determine capacity or throughput.
1.1. Typically, one may select fluxes that are 75% and 50% of critical flux for capacity determination (see Figure 10).
2. At each of the selected fluxes, determine the maximum throughput (or capacity) by carrying out a volume reduction experiment.
2.1. The volume reduction may range between 2 to 10-fold depending on the starting feed solution cell density, packed cell volume, etc. (e.g., mammalian cell cultures may go up to 5 to 10-fold volume reduction, whereas a yeast cell culture volume reduction may be between 1 to 2-fold. In the latter case, diafiltration may need to be resorted to).
2.2. Since the flux is held constant, the process TMP may rise with increasing throughput. The maximum throughput or capacity is considered to be reached when a predetermined maximum TMP value is attained (typically in the range of 5–10 psi).
NOTE: The current approach assumes that the desired product/contaminant passage is constant with volumetric reduction. This is a good first approximation even if there is a mild decrease in the passage of the product/contaminant during volume reduction. An average passage may be used. If the product/contaminant passage is affected significantly, then a more detailed analysis based on a mass flux optimization approach may be required.[15]
2.3. Alternatively, a simpler approach may also be taken in applications where the product/contaminant sieving tends to decrease significantly. In such cases, a limit on allowable observed product/contaminant sieving may determine the maximum throughput or capacity (e.g., if initial product sieving is > 90%, one may set a lower limit for the product sieving of around 50–60%). In this case, maximum throughput or capacity is considered to be achieved if either the lower product sieving limit or higher TMP limit is obtained.
2.4. The experiment is repeated at the second flux condition (after flushing and CIP).
RP4111EN00

Spring 2012 BioProcessing Journal • • www.bioprocessingjournal.com38
FIGURE 11. Maximum throughput or capacity at different selected fluxes.
The results obtained will probably be similar to what is shown in Figure 11. The data may be analyzed to determine the optimum operating point (flux) as illustrated in Example 1.
FIGURE 12. Determination of optimum operating flux to minimize process area requirements.
EXAMPLE 1. A mammalian cell culture batch was clarified using a 0.65 µ open-channel PVDF tangential flow filter. The following information was generated:
Process Information:
• Production-scale batch volume for filtration: Vbatch = 1000 L
• Allowable process/batch time = 3 hrs
Experimental Data:
• Critical flux (CF) was determined to be = 45 LMH
• Volumetric concentration experiments were carried out at two different fluxes, viz., 34 LMH (75% of CF [i.e., 75% of 45 LMH = 34 LMH]) and 22.5 LMH (50% of CF). The capacities that were obtained at these fluxes are:
1) Capacity @ J = 34.0 LMH = 40 L/m2
2) Capacity @ J = 22.5 LMH = 60 L/m2
Optimum Operating Point Determination:
• For Capacity 1 (J = 34.0 LMH):
A1 (area based on capacity) = 1000/40 = 25 m2
A2 (area based on flux-time) = 1000/(34 × 3) = 9.9 m2
• For Capacity 2 (J = 22.5 LMH):
A1 (area based on capacity) = 1000/60 = 17 m2
A2 (area based on Flux-time) = 1000/(22.5 × 3) = 14.8 m2
The calculated results may be plotted as shown in Figure 12. The graphical analysis indicates that the optimum flux is around 21 LMH and the corresponding optimum membrane area is 15.5 m2.
NOTE: In TFF ultrafiltration, it is common to use the flux-time method (indicated by A2 in the sections above) to determine membrane area requirements. In this method, loading or throughput is “projected” to higher values. This method could possibly result in gross errors with over- or under-estimating membrane area requirements when used for TFF microfiltration sizing.
Scale-Up of Microfiltration Processes
Successful scale-up of a TFF microfiltration process is important in ensuring a robust manufacturing or production-scale process operation. Earlier, we discussed that an optimized TFF microfiltration process is characterized by low TMPs, flux-control design, and use of open-channel modules (low ∆Ps). It is important to ensure that these characteristics are maintained during scale-up in order to ensure linearity and consistency with small-scale process development strategies.
RP4111EN00

Spring 2012 BioProcessing Journal • • www.bioprocessingjournal.com39
During scale-up of large-scale operations, one may design the large-scale system to connect the microfiltration TFF modules either in a serial or parallel configuration. In a serial configuration (see Figure 13 A), the modules are stacked sequentially such that the retentate of the first module becomes the feed to the second module, and this flow pattern is repeated until the last module in the series. In contrast, in a parallel configuration, the modules are stacked and/or manifolded (Figure 13 B) so that the total feed flow is equally distributed across each module. Therefore, one significant difference between serial and parallel configurations is that the total flow rate in a parallel configuration is equal to an individual module flow rate times the total number of modules. Whereas, the total flow in a serial configuration is the same or equal to an individual module flow rate.
Therefore, the advantage of serial configuration is that it results in considerably lower cross-flow or tangential flow compared to parallel configuration. However, one downside to the serial configuration is that the total pressure drop across the modules increases (as this is additive). The number of modules in a series needs to be controlled or designed to keep manageably low overall pressure drop across the configuration. This also helps to ensure a more uniform TMP across the different modules in the serial configuration. One question that often gets asked is: “What is the optimum number of membrane modules in series?” For example, if there are N modules (in series) in a configuration, we see from Equation 7 that the TMP difference between the first module and the last module is:
As a rule of thumb, one can seek to maintain a uniform TMP profile within a serial configuration where the TMP difference between the first and the Nth module is designed to not exceed 4–5 psi. (Note that this is a rough approximation based on our general experience with TFF microfiltration in biopharmaceutical applications, and this number may be different for other applications.) Therefore:
The calculation is expressed in Table 4. The overall TMP, as a function of individual module pressure drop and number of modules in series, is shown in Table 5.
FIGURE 13. Large-scale design options: A) series, and B) parallel.
TABLE 4. Maximum number of modules in series as a function of module pressure drop.
∆PM per Module Maximum Number of Modules in Series
0.5 9
1.0 5
2.0 3
3.0 2
4.0 2
5.0 2
TABLE 5. Overall TMP as a function of number of modules in series and individual module pressure drop.
∆PM per Module
TMP in psi (∆Ptotal in psi)
Number of Modules in Series
1 2 5 9
0.5 0.25 (0.50) 0.25 (0.50) 1.25 (2.50) 2.50 (5.00)
1.0 0.50 (1.00) 0.50 (1.00) 2.50 (5.00) 5.00 (10.00)
2.0 1.00 (2.00) 1.00 (2.00) 5.00 (10.00) 10.00 (20.00)
3.0 1.50 (3.00) 1.50 (3.00) 7.50 (15.00) 15.00 (30.00)
4.0 2.00 (4.00) 2.00 (4.00) 10.00 (20.00) 20.00 (40.00)
5.0 2.50 (5.00) 2.50 (5.00) 12.50 (25.00) 25.00 (50.00)
TMP = ∆PM/2 + ∆Pvalve + ∆Psystem - Pp, where ∆Psystem & Pp = 2 psi
Path Length CorrespondenceIn a series configuration, the path length of the fluid is
significantly higher (N-times higher) than the path length used in small-scale studies. To ensure success of scale-up, one typically begins the small-scale development and optimization studies with a single module with the path length, L. Once development and optimization is complete, a paper design is carried out to establish
RP4111EN00

Spring 2012 BioProcessing Journal • • www.bioprocessingjournal.com40
FIGURE 14. A) Pressure drop vs. B) module position in series configuration.
preliminary system configuration and design. For the next step, a process simulation should be carried out with the proposed design configuration to verify process performance.
The scale-up correspondence is shown in Figure 14 (A and B) where the intramodule pressure drop across a single module is ≈ 0.2 psi, but the pressure drop across a series of five modules in a system is ≈ 3.5 psi.
SummaryThe current article highlights
the best practices and methods to develop, optimize, and scale-up a TFF microfiltration process. Some of the distinct characteristics of the TFF microfiltration process, such as critical flux, permeate flux control, and maximum throughput (or capacity) are also explained in this article. Membrane and module selection guidelines are also discussed. A step-by-step methodology is provided to optimize the membrane area requirements for the process. The key elements of scale-up and process configuration are also discussed. It is hoped that the current article will benefit the potential TFF microfiltration user by enabling rapid development and scale-up of their process while avoiding the common pitfalls associated with it.
[1] Zeman LJ, Zydney AL. Microfiltration and ultrafiltration – principles and application, Marcel Dekker, Inc.; 1996.[2] Cheryan M. Ultrafiltration and microfiltration handbook. CRC Press LLC, Florida; 1998.[3] Blatt WF, Dravid A, Michaels AS, Nelson L. Solute polarisation and cake formation in membrane ultrafiltration: causes, consequences and control techniques. In: Membrane Science and Technology, ed. Flynn JE. New York: Plenum Press; 1970. p 47–91.[4] Trettin DR, Doshi MR. Limiting flux in ultrafiltration of macromolecular solutions. Chem Eng Commun, 1980; 4 (4–5): 507.[5] Trettin DR, Doshi MR. Synthetic membranes: volume II, ACS Symposium Series, Vol. 154, Chapter 22,1981. p 373.[6] Wijmans JG, Nakao S, Smolders CA. Flux limitation in ultrafiltration: osmotic pressure model and gel layer model. J Membr Sci, 1984; 20: 115–124.[7] Belfort G, Davis RH, Zydney AL. The behavior of suspensions and macromolecular solutions in crossflow microfiltration. J Membr Sci, 1994; 96: 1–58. [8] Persson KM, Capannelli G, Bottino A, Tragardh G. Porosity and protein
adsorption of four polymeric microfiltration membranes. J Membr Sci, 1993; 76: 61–71.[9] Pitt AM. The nonspecific protein binding of polymeric microporous membranes. J Parenter Sci Technol, 1987; 41:110–113. [10] Drew DA, Schonberg JA, Belfort G. Lateral inertial migration of small sphere in fast laminar flow through a membrane duct. Chem Eng Sci, 1991; 46: 3219–3224.[11] Eckstein EC, Bailey PG, Shapiro AH. Self-diffusion of particles in shear flow of a slurry. J Fluid Mech, 1977; 79: 191–208.[12] Zydney AL, Colton CK. A concentration polarization model for filtrate flux in cross-flow microfiltration of particulate suspensions. Chem Eng Commun, 1986; 47: 1–21.[13] Bacchin P, Aimar P, Field RW. Critical and sustainable fluxes: theory, experiments and applications. J Membr Sci, 2006; 281: 42-69. [14] Beier SP, Gunnar J. Critical flux determination by flux-stepping. AIChE Journal 2010; 56: 1739–1747.[15] Lutz H. Membrane filtration with optimized addition of second liquid to maximize flux. US Patent 5597486, Jan 1997.
REFERENCES
RP4111EN00