best practices for feebate program design and implementation
TRANSCRIPT

Best Practices for Feebate Program Design and Implementation
Feebate Review and Assessment

2 Best Practices for Feebate Program Design and Implementation
www.theicct.org ©April 2010 The International Council on Clean Transportation
Design layout and format by Yulee Kim Printed on 100% recycled paper with soy-based ink
The goal of the International Council on Clean Transportation (ICCT) is to dramatically improve the environmental performance and efficiency of personal, public and goods transportation in order to protect and improve public health, the environment, and quality of life. The Council is made up of leading regulators and experts from around the world that participate as individuals based on their experience with air quality and transportation issues. The ICCT promotes best practices and comprehensive solutions to improve vehicle emissions and efficiency, increase fuel quality and sustainability of alternative fuels, reduce pollution from the in-use fleet, and curtail emissions from international goods movement.
Authors:
John German Program Director, The International Council on Clean Transportation
Dan Meszler Independent Consultant, Meszler Engineering Services
The authors would like to thank our many colleagues around the world that have generously contributed their time and insight in reviewing and commenting on the draft versions of this paper, including Debbie Gordon, David Greene, Steve Plotkin, David Raney, Belinda Chen, and Bob Oliver. We also thank our ICCT colleagues Peter Mock, Anup Bandivadekar, Hui He, Ed Pike, Joe Schultz and Drew Kodjak for their review and constructive comments.
Generous support for this work was provided by the William and Flora Hewlett Foundation and the ClimateWorks Foundation.

3 Executive Summary
EXECUTIVE SUMMARY
Governments around the world have imposed standards for fuel economy and CO2 emissions on new vehicles, in reaction both to transportation's role in forcing climate change and to the threat of oil shortages. Improving vehicle efficiency is an effectual response to both those challenges, and many technologies exist or are nearing production that can substantially reduce fuel consumption and carbon emissions. Performance-based standards are critical to forcing the adoption of those new technologies, but by themselves standards can be limited in their effectiveness.
Led by the European Union, some governments are experimenting with an array of fiscal policies—taxes and incentives—that complement performance-based standards for vehicle efficiency. By improving the design of fiscal policies, and exploiting the synergies with standards, policymakers can be more effective in efforts to reduce carbon emissions on the one hand and demand for oil on the other1.
This paper focuses on one of the most promising incentive types: so-called feebate programs, in which more efficient vehicles receive rebates and less-efficient vehicles are assessed fees. While feebate impacts are influenced by the stringency of any complementary performance standards, feebate programs can confer important benefits even where standards are in place. A properly constructed feebate system, as illustrated in Figure ES1, has five important features:
1. In contrast to standards, which provide no incentive to do more than the required minimum, it creates a continuous incentive for vehicle manufacturers to improve the environmental performance of their vehicles. That is, it pays to further improve even the most efficient vehicle.
2. It incorporates fuel efficiency into consumer decision making and rewards the consumer in a tangible, immediate way for the societal benefits of reduced CO2 emissions and lower oil consumption. The loss-averse nature of consumers and the uncertainty of future fuel savings creates a substantial gap between the value of fuel-efficiency to consumers and to society. Feebates convert the future revenue stream from fuel conservation into an upfront payment, influencing consumer willingness to accept immediate costs of standards. The upfront payment for efficiency also restrains market demand for increasing vehicle performance.
3. It establishes a known, certain price for any future reduction in fuel consumption and CO2 emissions. Manufacturers can thus accurately estimate the benefit of bringing advanced technologies to the market, which creates an environment of business certainty for research and development. The price signal from a feebate program is a more effective incentive for advanced technology development than the uncertain possibility of stricter future standards. Feebate programs also avoid targeting any individual technology, but rather provide equal incentive for all advanced technologies.
4. It should set the benchmark, commonly referred to as the pivot point, so as to balance revenues and fees. This distinguishes a feebate from a tax. It should also reset the pivot point periodically, to reflect changing conditions. This keeps fees in line with rebates, making the program sustainable over the long term. Programs imbalanced toward either fees or rebates can create price signals for efficiency improvements, but
1Global Review and Comparison of Fiscal Policies to Influence Passenger Vehicle CO2 Emissions, ICCT, May 2010.
4 Best Practices for Feebate Program Design and Implementation
are likely not sustainable: revenues from fee-based programs will decline as fleet efficiency improves, and rebate programs will increasingly drain the public coffers.
5. Once adopted, a properly constructed feebate program does not need to be revised, except perhaps to adjust the pivot point for changes in revenue streams.
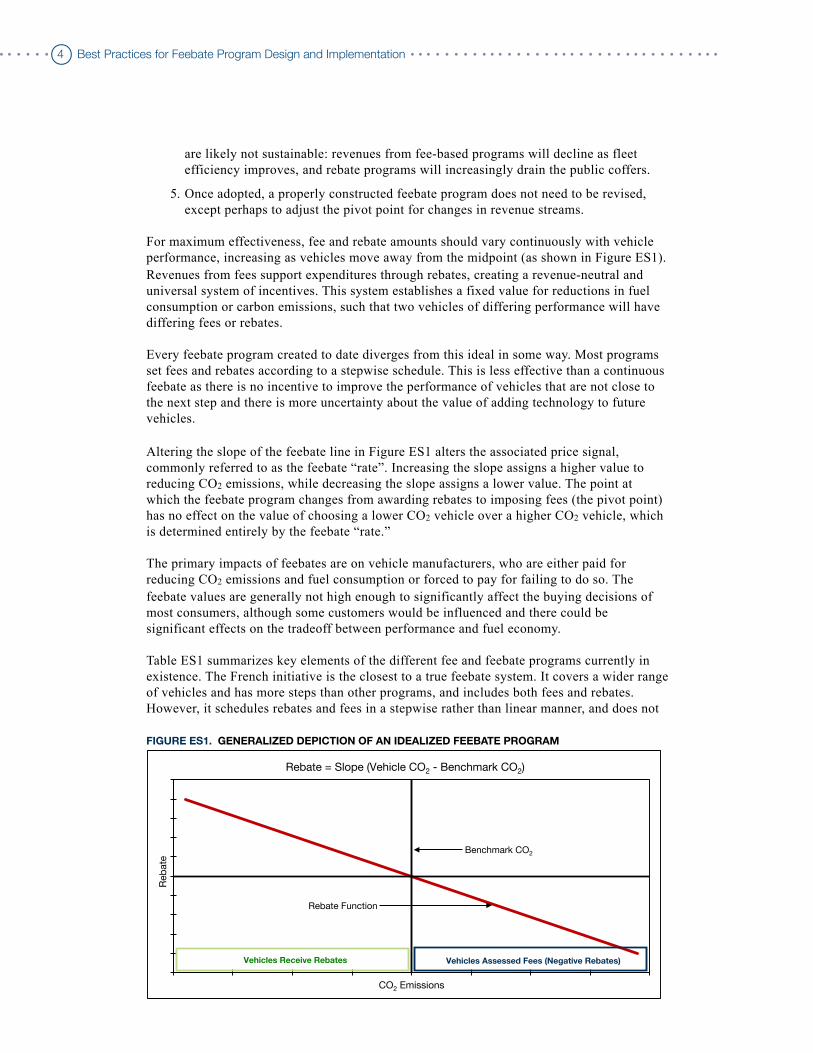
For maximum effectiveness, fee and rebate amounts should vary continuously with vehicle performance, increasing as vehicles move away from the midpoint (as shown in Figure ES1). Revenues from fees support expenditures through rebates, creating a revenue-neutral and universal system of incentives. This system establishes a fixed value for reductions in fuel consumption or carbon emissions, such that two vehicles of differing performance will have differing fees or rebates.
Every feebate program created to date diverges from this ideal in some way. Most programs set fees and rebates according to a stepwise schedule. This is less effective than a continuous feebate as there is no incentive to improve the performance of vehicles that are not close to the next step and there is more uncertainty about the value of adding technology to future vehicles.
Altering the slope of the feebate line in Figure ES1 alters the associated price signal, commonly referred to as the feebate “rate”. Increasing the slope assigns a higher value to reducing CO2 emissions, while decreasing the slope assigns a lower value. The point at which the feebate program changes from awarding rebates to imposing fees (the pivot point) has no effect on the value of choosing a lower CO2 vehicle over a higher CO2 vehicle, which is determined entirely by the feebate “rate.”
The primary impacts of feebates are on vehicle manufacturers, who are either paid for reducing CO2 emissions and fuel consumption or forced to pay for failing to do so. The feebate values are generally not high enough to significantly affect the buying decisions of most consumers, although some customers would be influenced and there could be significant effects on the tradeoff between performance and fuel economy.
Table ES1 summarizes key elements of the different fee and feebate programs currently in existence. The French initiative is the closest to a true feebate system. It covers a wider range of vehicles and has more steps than other programs, and includes both fees and rebates. However, it schedules rebates and fees in a stepwise rather than linear manner, and does not
FIGURE ES1. GENERALIZED DEPICTION OF AN IDEALIZED FEEBATE PROGRAM
Reb
ate
!
CO2 Emissions!
Vehicles Receive Rebates! Vehicles Assessed Fees (Negative Rebates)!
Rebate = Slope (Vehicle CO2 - Benchmark CO2)!
Benchmark CO2!
Rebate Function!

5 Executive Summary
cover the highest and lowest efficiency vehicles. The Irish program establishes significant new vehicle and annual registration fees based on CO2 emissions, but it does not include rebates and, like the French program, features a stepwise schedule of fees. A recent change to Germany’s annual registration fee structure, now based on CO2 emissions and engine displacement, makes it the first program to establish a continuous rather than stepwise incentive. The program also covers the full range of vehicles, from least to most efficient. As with the Irish program, it is a fee system, not a feebate program, and part of the fee is based on engine displacement, which only indirectly correlates with CO2 and is not as good a performance metric. Finally, the German system only affects annual fees, not vehicle purchases.
Figure ES2 provides a comparative overview of the fees assessed under the French, Irish, German, Canadian, and U.S. programs. The U.S. program assesses fees only to high CO2 emitting passenger cars, which severely limits the effectiveness of the program. Canada’s program assesses lower fees to an even smaller subset of high CO2 emitters and provides rebates for another small subset of low CO2 emitting vehicles, but with a very wide zero feebate range that also limits the effectiveness of the program. France’s structure generally results in fees of similar magnitude to the U.S. and Canadian programs, but covers a much wider range of vehicles. Germany assesses fees that are about double those of France for similar emitting gasoline vehicles and nearly double again for similar emitting diesel vehicles. Irish fees are about an order of magnitude higher than U.S. and Canadian fees and about 6 times higher than German fees. Except for the Irish program, the programs fall within a range of 18-30 Euros per gCO2 per kilometer, although this is only for the part of the fleet covered by the program. All programs except Germany would benefit from adopting a continuous system and all systems would benefit from extending rebates to low CO2 emitting vehicles.
TABLE ES1. COMPARISON OF FEEBATE AND FEE SYSTEMS BY COUNTRY
France Ireland Germany United States CanadaType of
programFeebate Fee (tax only) Fee (tax only) Fee (tax only)
Non-continuous feebate
Fleet affected
Light-duty vehicles between 96 mpg (60
gCO2/km) and 25 mpg (300 gCO2/km)
Light-duty vehicles between 49 mpg
(120 gCO2/km) and 28 mpg (225 gCO2/
km)
All Light-duty vehicles
Cars less than 22.5 mpg
Light-duty vehicles with varied mpg
coverage
Structure of feebate schedule
Stepwise Stepwise Linear Stepwise Stepwise
Lifetime equivalent added fuel
cost
$1.04/gal $10.65/gal[1]
$1.30/gal for gasoline vehicles;
$2.10/gal for diesel vehicles[2]
$1.13/gal $1.25/gal
Pivot point[3]
About 42 mpg (140 gCO2/km)
N/A N/A N/AAbout 24 mpg for cars and 22 mpg for others
Deviation from a true
feebate system
Incomplete coverage
Not continuous
Fees only Incomplete
coverage Not continuous
Fees only Annual only Some fees based
on engine size
Fees only Does not cover
majority of fleet Not continuous
Differed feebate schedule by vehicle type
Majority of fleet fall into zero feebate band
Not continuous[1] This is a lifetime impact including both an upfront tax and annual tax[2] This is the combined lifetime impact of annual taxes on displacement and CO2 emissions[3] Pivot point is the benchmark level (fuel consumption or CO2) where the program changes from fee to rebate. This only applies to feebate programs. For “stepped” feebate structures, the pivot point is estimated at the mid point of the zero feebate band.
[1] This is a lifetime impact including both an upfront tax and annual tax[2] This is the combined lifetime impact of annual taxes on displacement and CO2 emissions[3] Pivot point is the benchmark level (fuel consumption or CO2) where the program changes from fee to rebate. This only applies to feebate programs. For “stepped” feebate structures, the pivot point is estimated at the mid point of the zero feebate band.
[1] This is a lifetime impact including both an upfront tax and annual tax[2] This is the combined lifetime impact of annual taxes on displacement and CO2 emissions[3] Pivot point is the benchmark level (fuel consumption or CO2) where the program changes from fee to rebate. This only applies to feebate programs. For “stepped” feebate structures, the pivot point is estimated at the mid point of the zero feebate band.
[1] This is a lifetime impact including both an upfront tax and annual tax[2] This is the combined lifetime impact of annual taxes on displacement and CO2 emissions[3] Pivot point is the benchmark level (fuel consumption or CO2 ) where the program changes from fee to rebate. This only applies to feebate programs. For “stepped” feebate structures, the pivot point is estimated at the mid point of the zero feebate band.
[1] This is a lifetime impact including both an upfront tax and annual tax[2] This is the combined lifetime impact of annual taxes on displacement and CO2 emissions[3] Pivot point is the benchmark level (fuel consumption or CO2 ) where the program changes from fee to rebate. This only applies to feebate programs. For “stepped” feebate structures, the pivot point is estimated at the mid point of the zero feebate band.
[1] This is a lifetime impact including both an upfront tax and annual tax[2] This is the combined lifetime impact of annual taxes on displacement and CO2 emissions[3] Pivot point is the benchmark level (fuel consumption or CO2 ) where the program changes from fee to rebate. This only applies to feebate programs. For “stepped” feebate structures, the pivot point is estimated at the mid point of the zero feebate band.

6 Best Practices for Feebate Program Design and Implementation
The new feebate system introduced in France in January 2008 appears to have had a significant impact on consumer choices:
• CO2 emissions of the new French passenger car fleet decreased by 9 g/km, or about 6 percent, in 2008. This was almost twice the reduction that occurred in the rest of the EU.
• Average engine power decreased by 5 kW and vehicle mass by 32 kg in France, both larger than any reduction since at least 1984.
• Sales of vehicles with CO2 emissions between 101 and 120 g/km, which received a bonus of €700 per vehicle, increased by about 80% in 2008. Vehicle sales fell in every feebate category with emissions between 120 and 250 g/km.
• The French new vehicle market was barely affected by the economic downturn until the end of 2008, supporting the argument that these impacts were likely caused by the feebate system.
Countries that have not adopted fuel economy or greenhouse gas emission standards may find feebates a good alternative first step. Standards require a great deal of knowledge about vehicles, technology, market demographics, and future developments in order to set them properly. This knowledge is much less critical for establishing an effective feebate program, which can be put in place while expertise and information are being developed. Feebates may also be useful for sectors that are more complex and diverse than the light duty sector, such as heavy-duty vehicles.
In general, fiscal policies aimed at encouraging improvements in vehicle efficiency should be based directly and continuously on CO2 emissions. With respect to feebates, the important elements of a best practice program are:
• A continuous and linear feebate rate line, without any breaks or discontinuities. • The pivot point set to make the system self-funding and sustainable, and periodically
adjusted to compensate for changing conditions. • A linear metric, such as CO2 emissions or fuel consumption per unit of distance. • An attribute adjustment (if one is used) based on vehicle size, not any other metric.
FIGURE ES2. FEES ASSESSED UNDER VARIOUS FEEBATE-LIKE PROGRAMS
-35,000!
-30,000!
-25,000!
-20,000!
-15,000!
-10,000!
-5,000!
0!
5,000!
10,000!
0! 50! 100! 150! 200! 250! 300! 350! 400!
Reb
ate
("
) !
CO2 (g/km - EU Cycle)!
France!
Ireland!
Germany Gasoline!
Germany Diesel!
Canada Passenger Cars!
U.S. Passenger Cars!

7 The Case for Government Efficiency and CO2 Programs for Vehicles
THE CASE FOR GOVERNMENT EFFICIENCY AND CO2 PROGRAMS FOR VEHICLES
High fuel prices are an effective tool to reduce the amount of miles driven and to influence customers to buy smaller or lower performance vehicles. The benefits to the customer of choosing a smaller or lower performance vehicle are clear, as the initial cost is lower and there are future fuel savings. Importantly, the benefit to the consumer of installing additional technology to save fuel and reduce carbon is not as clear. The technology raises the cost of the vehicle up front, while the benefits in fuel savings occur only gradually over time.
Consumers consider a multitude of factors when making their purchase decisions in addition to fuel consumption and emissions. Studies of general consumer behavior suggest that most customers are loss averse2 and the more uncertain the benefits of a purchase decision, the more customers will reject the purchase.3 In the case of vehicle technology, the future fuel savings are highly uncertain. Fuel economy varies from vehicle to vehicle and driver to driver, so the actual fuel economy experienced by the individual customer is uncertain. The customer may move or change jobs, changing how much he or she drives. The ownership period is usually uncertain. And fuel prices are highly variable, as evidenced by the oil price increase to $140 per barrel and the drop to $60 per barrel just in the past year. This very high uncertainty in the value of future fuel savings, combined with general loss averse behavior, results in severe discounting of future fuel savings by most customers. Combined with the higher upfront purchase price, most customers are relatively indifferent to efficiency technology gains, even at substantially higher fuel prices.
The loss averse nature of consumers and the larger uncertainty in the future fuel savings creates a substantial gap between the value of fuel savings to consumers and to society, which values full life fuel savings. Standards and incentives are needed to fill in the gap between the value placed on efficiency and CO2 emissions by the average customer and by society.
TABLE 1. CO2 PROGRAMS FOR VEHICLESFactor / EntityFactor / Entity Vehicle Miles
TraveledVehicle EfficiencyVehicle EfficiencyVehicle Efficiency Carbon
Content
Strategy Primarily affects
Vehicle Miles Traveled
Leap-Forward Technology
Technology spread
Smaller vehicles
Alternative fuels
Fuel price (taxes)
Consumers + + + (if fuel price difference)
Land Use & Infrastructure
Consumers +
Technology mandates / incentives
Manufacturers + + (with enough
dollars)Fuel economy standards or
Feebates
Manufacturers ++ (possible but small impact)
Note: Plus indicates a positive influence as opposed to “up” or “increase.” For example, a + (positive) impact on VMT means a decline.
2Loss averse means that most people are more concerned about unexpectedly losing money than gaining a windfall and would decline a 50/50 bet.3Greene, D.L., German, J., and Delucchi, M., “Fuel Economy: The Case for Market Failure”. Reducing Climate Impacts in the Transportation Sector. D. Sperling and J. Cannon, Springer Press, 2008.

Both standards and incentives can effectively fill in this gap and create appropriate societal value for fuel consumption and CO2 emission reductions. The primary effect of both standards and a feebate program is to draw fuel-saving technology into the market. Feebates assign a specific economic value to a given change in vehicle performance, while a fuel economy or CO2 standard mandates a specific level of performance regardless of economic cost. So, feebates fix the amount society is willing to pay for reductions in emissions, but the actual amount of future reductions is uncertain. A standard will provide reasonable certainty of the future emission reductions, but the actual cost (and cost-effectiveness) is uncertain. Both have similar effects on pulling technology into the fleet, but there are also important differences.
The rest of this report discusses feebate program design and the advantages and challenges of implementing a feebate program.
For readers interested in a broader evaluation of all types of fiscal incentives should refer to the ICCT report on global fiscal policies.4
BASIC FEEBATE PROGRAM DESIGN
Before discussing impacts and existing programs, it is important to first define exactly what a feebate program should entail to effectively draw fuel saving technology into the fleet and induce customers to buy more efficient vehicles. “Feebates” simply means a program that imposes a fee on vehicles that perform worse than a specified benchmark and awards a rebate to vehicles that perform better than the specified benchmark. For maximum effectiveness, the magnitude of the fees and rebates vary continuously as vehicle performance moves away from the benchmark and the funds garnered through the imposed fees are transferred to support the awarded rebates – creating effective incentives for all vehicles without creating a net revenue stream.5 In effect, a specific value is assigned to vehicle performance such that two vehicles of differing performance will have differing fees or rebates. Various countries have adopted different pieces of an ideal feebate program, but no existing program fully meets these basic design criteria.6
Figure 1 is a generalized depiction of a continuous feebate program. Rebates (with fees depicted as negative rebates) decline continuously with increasing CO2 emissions.7 This effectively places a fixed value on CO2 emissions and imposes a specific fee on any decision to increase such emissions. It is important to recognize that the point at which the feebate
4Global Review and Comparison of Fiscal Policies that Influence Passenger Vehicle CO2 Emissions, ICCT, May 2010.5Generally, feebate programs are envisioned as imposing a “one-time” price signal at the time of new vehicle purchase. Although there is nothing technically prohibitive in imposing a similar price signal periodically (e.g., as an element of a periodic vehicle registration program), logistical requirements are compounded and associated price signals are potentially confounded as one moves away from an initial new vehicle purchase program.6France has a system of fees and rebates, but it uses step functions. Germany has a continuous, linear system based on CO2, but it applies to annual registration fees, not new vehicle purchases, and it is all fees. Denmark and Norway both have a continuous system of new vehicle fees and rebates based on CO2, but the curves have significant non-linear steps in the feebate rate, the programs are not revenue neutral, and the Norway program has a large zero-band.7A feebate program can be designed around a performance parameter other than CO2 emissions. CO2 emissions is an appropriate parameter, however, as this also incentivizes fuel switching to low carbon energy sources. If a fuel related parameter is desired, fuel consumption (such as liters per 100 km) should be used. Like CO2 emission, fuel consumption is a linear metric, although fuels with higher energy content, such as diesel fuel, receive an artificial benefit. MPG (or km/liter) is the inverse of fuel consumption and is not linear, making it a poor choice.
8 Best Practices for Feebate Program Design and Implementation

program changes from awarding rebates to imposing fees (i.e., the pivot point or benchmark) is irrelevant to the imposed value of CO2 emissions. In other words, the strength of the CO2 price signal is independent of this transition point. Altering the pivot point has no effect on the value of choosing a lower CO2 vehicle over a higher CO2 vehicle.8 Altering the slope of the feebate function alters the associated price signal, commonly referred to as the feebate “rate”. Increasing the slope assigns a higher value to reducing CO2 emissions, while decreasing the slope assigns a lower value.
The pivot point is critical in balancing the rebates awarded and fees assessed. This can be important in distinguishing a feebate program from a tax. Adjusting the pivot point to balance fees and rebates as vehicle efficiency increases in the future also ensure the long-term sustainability of the program. It is entirely possible to create fee-only or rebate-only programs that have the same slope, or rate, with respect to CO2 emissions as a feebate program. This can be visualized as a program in Figure 1 with the pivot point at the end of the feebate line, instead of in the middle. Some examples of fee-only programs will be discussed later in the report. Such programs can provide the same incentive for efficiency and CO2 improvements as a feebate program, but the revenue stream will not be stable. Fee-only (or primarily fee) programs will produce diminishing revenues as vehicle efficiency increases and CO2 emissions decrease. Rebate-only (or primarily rebate) programs will demand increasing revenue from the government each year as vehicle efficiency increases. Neither scenario is likely to be sustainable.
In contrast to the continuous linear function of the feebate program in Figure 1, Figure 2 is a generalized depiction of a noncontinuous linear feebate design with a zero slope range. Almost
FIGURE 1. GENERALIZED DEPICTION OF AN IDEALIZED FEEBATE PROGRAM
Reb
ate
!
CO2 Emissions!
Vehicles Receive Rebates! Vehicles Assessed Fees (Negative Rebates)!
Rebate = Slope (Vehicle CO2 - Benchmark CO2)!
Benchmark CO2!
Rebate Function!
8This can be illustrated by comparing two alternative rebate structures, both with a slope of -$18 per gCO2/mile, but one with a pivot point at 150 g/mi (approximately 36.6 gasoline equivalent mpg) and the other with a pivot point at 300 g/mi (about 18.3 gasoline equivalent mpg). Opting to buy a 40-mpg gasoline vehicle (137.4 gCO2/mi) would result in a rebate of about $227 with the 150 g/mi pivot point [-18(137.4-150)= 227] and $2,927 with the 300 g/mi pivot point [-18(137.4-300)= 2927]. Alternatively, choosing a 15 mpg gasoline vehicle (366.4 gCO2/mi) would result in a fee of about $3,896 with the 150 g/mi pivot point [-18(366.4-150)= -3896] and $1,196 with the 300 g/mi pivot point [-18(366.4-300)= -1196]. Although the specific rebates and fees vary with the choice of program benchmark, the dollar savings associated with the 40 mpg vehicle versus the 15 mpg vehicle is $4,123 in either case [$227-(-$3,896)= $4,123 for the 150 g/mi pivot point and $2,927-(-$1,196)= $4,123 for the 300 g/mi pivot point]. In fact, the pivot point could be set so that all vehicles receive a rebate or all vehicles are assessed a fee and the price signal would remain unchanged. The magnitude of the net revenue stream is, however, what distinguishes a feebate incentive from a tax.
9 Basic Feebate Program Design

all existing feebate (and fee-only) programs have designs that incorporate noncontinuous zero slope elements. The weakness of such zero slope designs is that the value associated with CO2 emissions (or alternative performance parameter) is set to zero over a range of performance (even if the associated feebate value is itself non-zero). Within the zero slope range, vehicles with differing CO2 emission rates receive the same rebate or are assessed the same fee, so there is no incentive to improve.
Note that programs with step-functions are even worse. Programs that assign the same fee or rebate to a range of CO2 emissions create a zero slope range within each emission category, with a step function between each category. Manufacturers have no incentive beyond the willingness of consumers to pay for energy efficiency improvements to install technology on vehicles that are not close to a step function or to install technology beyond that needed to barely reach the step function. Conversely, the step function provides a large incentive to improve efficiency just a little for vehicles close to a step-function change. This promotes gaming of the system.
These disincentives degrade the effectiveness of the program. While such design concessions may be important from a political standpoint, they inherently (and always negatively) affect the assigned feebate value and associated price signal.9
FEEBATE PROGRAM IMPACTS AND IMPLICATIONS
While conceptually simple, a feebate program often faces a significant political hurdle, as those who oppose its adoption generally characterize it as a vehicle performance tax. A true feebate program, however, provides financial incentives to consumers and manufacturers without collecting net revenue. Its purpose is to correct for an externality or other social
FIGURE 2. DEPICTION OF A NON-CONTINUOUS FEEBATE PROGRAM
Reb
ate
!
CO2 Emissions!
Rebate = Slope (Vehicle CO2 - Benchmark CO2)!
Benchmark Fee CO2!
Fee Function!
Rebate Function!
Benchmark Rebate CO2!
No Rebate/No Fee!
Vehicles!Vehicles Receive Rebates!
Vehicles Assessed Fees!
(Negative Rebates)!
9This is universally true since two vehicles of differing CO2 emissions (or alternative performance) have no feebate value differential within the “flat” functional range, but two alternative vehicles with the same CO2 emissions difference outside the “flat” functional range will have a feebate value differential. In effect, the CO2 price signal varies depending on where alternative vehicles are located relative to the benchmark performance level. It is important to note that this same concern would be true for any functional slope change, be it a zero slope or otherwise. Differential slopes and step functions impart differential performance price signals and should be avoided.
10 Best Practices for Feebate Program Design and Implementation

undervaluation in the consumer value of fuel consumption and CO2 emissions and it can be structured such that any fees collected are balanced out by the rebates awarded, without imposing any net tax. Of course, a program can be designed to both send a price signal and generate a positive revenue stream, so it can be difficult to separate the incentive aspects from the tax aspects of government programs.
Feebates design has also suffered from a widespread focus on consumers instead of manufacturers. As discussed later, the primary impact of feebates is to influence manufacturers to introduce vehicle technology.
As a result, although there are a number of existing global programs that include one or more aspects of a feebate program, only recently have programs been created that approach the most effective feebate design. Arguably the best program was enacted in France at the close of 2007, but even this program has aspects that likely compromise the potential effectiveness. While not feebate programs per se, other “feebate-like” programs have been created in other European countries, some of which are more stringent in terms of their inherent CO2 price signals than the French feebate program. Ireland, in particular, is notable for the stringency of its fees. Germany has enacted a continuous system based on CO2 emissions, but it is a fee-only system and it is an annual registration fee, not a new vehicle fee. Since such programs could relatively easily be modified into, or otherwise provide insight into, proper feebate designs, it is important that they be included in any feebate overview and are, accordingly, discussed below.
IMPACT OF FEEBATES ON CONSUMERS AND MANUFACTURERS
Feebates have generally been viewed and structured as a consumer incentive program. While empirical evidence of the relative consumer and manufacturer response to feebate programs continues to be lacking,10 economic studies suggest the dominant effect will be that vehicle manufacturers improve technology across all vehicles. The effect of feebates on consumer purchase decisions will be comparatively minor. For example, studies by Greene et al. and Davis et al. estimated that the impact of feebates on the vehicle model purchased by consumers would account for only five and ten percent of overall feebate program impact respectively.11,12
This makes economic sense, as the feebate price signal is fundamentally nothing more than a performance fee that will be imposed on the vehicle cost. If the cost of technology to improve vehicle performance is less than the associated change in the feebate value, then manufacturers will be paid to implement the technology.13 Manufacturers have an economic interest to maximize profits through the implementation of all technologies that cost less than the associated feebate value.
10The French feebate program, which is structured to send a significant price signal to both consumers and manufacturers, has only been in existence for less than two years. While some preliminary impacts on consumers are presented in this paper, this is too short of a time frame to determine vehicle manufacturer response. This program should provide empirical evidence for analysis over the next several years, after manufacturers have had an opportunity to respond to the feebate signal, but the fact that France is but one component of the overall EU vehicle market may dampen the response compared to a larger EU-wide program.11Greene, D.L., Patterson, P.D., Singh, M., and Li, J., “Feebates, rebates and gas-guzzler taxes: a study of incentives for increased fuel economy,” Energy Policy, Volume 33, Issue 6, Pages 757–775, April 2005.12Davis, W.B., Levine, M.D., Train, K., and Duleep, K.G., “Energy Efficiency in the U.S. Economy, Technical Report Two, Effects of Feebates on Vehicle Fuel Economy, Carbon Dioxide Emissions, and Consumer Surplus,” DOE/PO-0031, U.S. Department of Energy, February 1995.13Note that the average price of all vehicles will increase, as technology is added to all vehicles and the pivot point rises. But a manufacturer that chooses not to install cost-effective technology would still be disadvantaged compared to other manufacturers due to the fees imposed.
11 Feebate Program Impacts and Implications

Layered on top of this fundamental manufacturer response are the benefits of changes in the types of vehicles selected by consumers for purchase; benefits driven by the increased price of poorer performing vehicles. However, most consumers place a large value on features such as performance, features, luxury, utility, and safety. For example, the average midsize car is already thousands of dollars more expensive than the average compact car and uses more gasoline – facts that do not stop consumers from buying far more midsize cars than compact cars. The dollar amounts imposed by the feebate system will be relatively small compared to the price differentials already in effect, which supports that the consumer impacts of feebates are likely to be relatively minor compared to the manufacturer incentive to improve technology. The relative effects on manufacturers and consumers can have important impacts on feebate program design, as discussed below.
ATTRIBUTE ADJUSTMENTS
A more political design consideration is whether or not to use an attribute system (such as vehicle size or weight) to adjust the amount of the feebate. It is important to understand that this does not change the feebate “rate”. A given change in vehicle efficiency will generate the exact same change in the amount of the feebate whether a single pivot point is used for all vehicles or an attribute-based system is used. Thus, the incentive to manufacturers to install additional technology is unchanged.
However, the price signals sent to consumers would be affected. Although the price signal is identical for vehicles within each defined class, it is not identical across all vehicles under an attribute-based system. Two vehicles with identical performance could have substantially differing rebates if their vehicle attributes are different.14 Such non-continuity could confuse customers and could remove most of the incentive for customers to buy a vehicle from a more efficient vehicle class (although incentives to buy lower performance vehicles would remain).
A system that is not adjusted for vehicle attributes and uses a single pivot point for all vehicles will generate the most benefits and comes the closest to efficiently pricing an externality like CO2 emissions. However, political and policy considerations cannot be ignored. Systems without attribute adjustments are frequently characterized as interfering with customer vehicle choice, increasing fatalities (by increasing sales of small cars), and as a wealth transfer from makers of large vehicles to makers of small vehicles. The situation is similar to that of fuel economy and CO2 standards, where most countries have found they need adjustments for size or weight in order to gain support for aggressive standards. Similarly, attribute adjustments may be necessary in order to successfully adopt a feebate system, even though studies have suggested that the use of attribute adjustments may decrease the effectiveness of the program by up to 5 percent (Davis et al. 1995) to 10 percent (Green et al. 2005).
SIZE VERSUS WEIGHT ATTRIBUTE ADJUSTMENT
If an attribute adjustment is used, size-based systems are much more effective than weight-based systems. Weight adjustments would impose a major additional degradation to the effectiveness of the program. One of the primary measures to reduce fuel consumption and CO2 emissions is lightweight materials. Weight-based adjustments would simply reduce the rebate for lighter vehicles, so there is no monetary benefit to the manufacturer for using lightweight materials. Size-based programs preserve the incentive to use lightweight materials and would lead to significantly greater fuel and CO2 reductions.
14For example a program that has a pivot point for sport utility vehicles (SUVs) at 250 gCO2/mi (about 22.0 gasoline equivalent mpg) would assign no fee to a 22 mpg SUV, while a passenger car that emits CO2 at the exact same rate of 250 g/mi would be assessed a fee if passenger cars have a pivot point at 200 gCO2/mi (about 27.5 gasoline equivalent mpg).
12 Best Practices for Feebate Program Design and Implementation

FEEBATE METRIC
A constant price signal requires a linear feebate function. Non-linear designs suffer the same weaknesses as non-continuous functions (i.e., variation in the price signal across the range of vehicle performance). Non-linear designs are easily avoided if the feebate performance parameter is selected carefully. For example, a feebate program based on unit fuel consumption (e.g., gallons per mile) is viable (providing appropriate considerations are made for fundamental differences in the energy content of different vehicle fuels), but a feebate program based on a performance parameter of fuel economy (e.g., miles per gallon) is not. Incremental fuel consumption decreases as fuel economy increases, so that the amount of fuel saved decreases for each successive one-mpg differential in fuel economy. In effect, a feebate program based on fuel economy would assign progressively more value to decreasingly effective fuel saving technologies.15 Thus, proper selection of the vehicle performance parameter is a critical element of an effective feebate program design.
POINT OF ADMINISTRATION
The collection of fees and granting of rebates can be done at either the consumer or the manufacturer level. Consumer based programs include the fee or rebate in the purchase price, at the consumer level. Manufacturer based programs assess the fee or rebate at the manufacturer level. Because feebates have generally been targeted at consumers, not manufacturers, proposals and programs have generally collected fees and given rebates directly to consumers.
Consumer based programs have more impact on consumer purchase choice. However, they also have large administrative costs, as money must be exchanged for millions of vehicle purchases each year. Some systems require customers to apply for rebates from the government, rather than receiving them at the time of purchase. It also can engender major opposition from vehicle dealers, who are concerned about the administrative burden and potential liability the system would place on them, and from customers who have to pay a fee.
Administering the program at the manufacturer level can largely eliminate administrative costs and dealer opposition. The manufacturer would pay the fees and collect the rebates for each vehicle, which could be accumulated and settled on a quarterly or annual basis. A manufacturer-based system can also hide the fees, if there is concern about the feebate program being labeled a tax.
The point of administration has no effect on manufacturer reaction to a feebate system and technology introduction, as the fees and rebates are identical in either case. However, administrating the system at the manufacturer level could reduce the impact on consumer purchase decisions. As discussed, above, this effect is likely to be minor, as consumer responses are only about five to ten percent of the overall impacts. The effect could also be minimized by requiring the amount of the fee or rebate to be included with the pricing information for the vehicle, as is currently done with the Gas Guzzler Tax in the U.S. This
15Take for example a program design with a rebate slope of $10 per mpg. An increase in mpg from 15 to 16 would save 0.4167 gallons of fuel for each 100 miles driven, so that the net rebate value under the program would increase by $10, or $2,400 per gallon saved per mile. Similarly, an increase in mpg from 40 to 41 would also result in a net $10 increase in rebate value. But at these fuel economy levels, the one mpg increase saves only 0.0609 gallons of fuel for each 100 miles driven, which equates to a net rebate value of $16,400 per gallon saved per mile. The reward for a one mpg increase in fuel economy at 40 mpg is nearly seven times higher per unit fuel saved than is the case at 15 mpg. In addition, mpg is a problem for EVs and PHEVs, with potentially very high MPG ratings that do not reflect carbon emissions from electric powerplants, especially in the coal states.
13 Feebate Program Impacts and Implications
would ensure that customers know what the amount of the fee or rebate is for the vehicle, without imposing administrative burdens on customers, dealers, and government revenue agencies.
SETTING THE PIVOT POINT
As indicated earlier, the pivot point should be set such that fees and rebates balance. This is necessary to ensure a sustainable system and self-supporting system. The concept is simple, but it must be administered appropriately.
• For the first year of the program, the pivot point can be estimated either from information on the average fuel consumption or CO2 emissions of the existing fleet or using an existing CO2 or fuel consumption standard.
• A mechanism is needed to handle shortfalls and over-payments. Shortfalls need to be covered so that rebates can continue to be paid or the system needs to be set up such that shortfalls cannot occur. In the former case, the government or some other organization must act as banker and loan the system money until the pivot point can be adjusted. The other option is to set up the system so that slightly more fees are collected than rebates paid. If more fees are collected, some organization needs to bank the overage and apply it to future model years.
• The pivot point must be adjusted as vehicle efficiency improves. If the pivot point is adjusted infrequently, then the pivot point must be set so that net fees are collected in the early years and are available for payment of more rebates as the fleet efficiency improves. Resetting the pivot point annually would allow a much closer match of fees and rebates and avoid banking of large sums of money. The downside is that vehicles that are carried over from one year to the next without any changes will see their rebates decrease or their fees increase due to the change in the pivot point, which may be difficult to explain to customers.
• Setting the new pivot point is a function of how much money has been banked or is on loan and the estimated improvement in vehicle efficiency for the next period. The estimated improvement can be determined from historical rates of improvement or, if they exist, from the rate of improvement required by CO2 or fuel consumption standards.
FEEBATES AND INCENTIVES FOR ADVANCED TECHNOLOGIES
Feebates are not just a policy to promote short-term technology implementation. The constant, known feebate rate provides a long-term signal of the value of developing advanced technologies and technology innovation. This price signal is completely impartial – it applies equally to all technologies.
This constant price signal is perhaps the most significant advantage of feebates over standards. Due to ongoing changes in technology development, consumer purchase decisions, fuel prices, and politics, it is difficult to set standards more than 8 years or so in advance.16 Manufacturers,
16Most efficiency and CO2 standards around the world have been set with no more than 8 years of leadtime. There are a few examples of longer-term standards, but generally the goals were not met and required delays in implementation. For example, the original standards in the U.S. 1975 Energy Policy and Conservation Act required cars to achieve 27.5 mpg by 1985, but were rolled back to 26.0 in 1986 and did not return to 27.5 until 1990. The European Union goal set in 1995 to achieve 140 g CO2/km by 2008 was not met and current requirements only require reductions to 130 g CO2/km by 2015. The original California Zero-Emission Vehicle mandate has been modified a number of times and the goals still have not been met.
14 Best Practices for Feebate Program Design and Implementation

like consumers, are also loss averse. The lack of clarity on standards more than about 8 years in advance can inhibit development of advanced technologies. Feebates set a long-term price signal that will stimulate technology development. Note that this benefit will also occur if a feebate program is added to an existing standard.
However, there may be low carbon technologies that would be better in the long run, but which cannot compete in the short run due to infrastructure or other investment barriers. This suggests that additional, temporary incentives may be needed for advanced technologies. Efforts to promote advanced technologies have frequently led to incentives or mandates for specific technologies. These have rarely been successful in fully commercializing advanced technology, as it is very difficult to determine which technologies will be best in the long term, much less determine when the technology is ready to be pushed with incentives or mandates.
It would be better to create temporary performance incentives that promote all advanced technologies. One potential way to handle incentives for low carbon technologies is to establish a higher feebate rate for low carbon vehicles. This would likely be much more effective than targeted incentives, as it would not attempt to pick winners ahead of time and would provide incentives to introduce all potential advanced technologies. Establishing continuous incentives, even if they are not linear, is very important. Incentive systems with set cut points and steps encourage the development of technologies that most closely meet the cutpoint. Technologies that don’t quite make the cutpoint receive no incentive at all and there is no incentive to develop technologies better than the cutpoint. Establishing an increasing curve works much better than cut points.
It is tempting to simply increase the rebate rate for low carbon vehicles. However, the purpose of the feebate system is to correct for uncertainty/loss aversion bias and address externalities such as oil dependence and greenhouse gas emissions. From a societal or global warming view, it doesn’t matter if the reductions come from pickup trucks or small cars or what technology is used to reduce the carbon emissions. All carbon reductions have the same impact and should be valued the same. A linear feebate system with a constant rate will achieve the maximum carbon reductions at the lowest cost.
Thus, it is desirable for advanced technology incentives to be separate and distinct from the standard feebate system. This would enable them to be ended at some point in the future when the objectives have been achieved, without adversely affecting the feebate system. One possible way to handle additional incentives for advanced technology vehicles is a second, temporary feebate system. The permanent feebate would be linear to promote technology "implementation" and all advanced technologies. The temporary feebate would provide additional rebates for ultra-low carbon technology innovation. Even if the innovation incentives were not linear, at least they would be continuous and open to all potential technologies. The temporary system could be set up to sunset without affecting the standard, linear feebate system.
DEVELOPING COUNTRIES AND COMPLEX PROGRAM STRUCTURES
Japan, Europe, and the U.S. were the early leaders in developing programs to reduce fuel consumption and CO2 emissions from light duty vehicles. In the course of developing programs to reduce emissions and fuel consumption, each area gained considerable experience and expertise in technology and the vehicles sold in their region. Expert systems and models to forecast future vehicle mix and technology development were developed in support of the standards. With the infrastructure to set standards already in place, the relative simplicity of feebates is irrelevant to program design.
15 Developing Countries and Complex Program Structures

For countries where programs do not already exist, or for vehicle types that have not been regulated, feebates offer a quick and relatively easy way to begin reductions in fuel consumption and CO2. Standards require detailed knowledge of the vehicle fleet, current technology composition, future technology development, technology costs and benefits, lead-time, and models to assess the combined impact of all these factors. Feebates only require assessment of four factors: (1) The value placed upon the fuel consumption/CO2 reductions (i.e. the feebate rate); (2) A flat system with a single pivot point, or a system adjusted for vehicle size; (3) A revenue neutral program or one that raises funds or is subsidized; (4) A consumer based or manufacturer based program. An effective system can be designed with far less technical knowledge or expertise. This could be especially important for developing countries, which have not established expertise with technology assessments and modeling.
It could also be useful for sectors that are more complex than the light duty sector. While this paper, and indeed all current feebate research and programs, address light duty vehicles, feebates are a general concept that can be applied any place standards can be applied. In fact, they may be an excellent first step for complex markets, such as heavy-duty vehicles, that have a wide range of products, manufacturers, and duty cycles. Light duty vehicles have a great deal of commonality in operation and use, so there is reasonable consistency in technology types and effectiveness. This is not true for other sectors. For example, urban delivery trucks are used and operated completely differently from long-haul trucks. Special use trucks, such as refuse trucks and utility boom trucks, are even more different. In addition, many heavy-duty trucks are built from three different manufacturers – one each for the drivetrain, the chassis, and the trailer. A consistent set of standards for such a diverse industry will prove challenging. Feebates would allow an effective start before developing expertise in all the different sectors.
COMBINING FEEBATES WITH STANDARDS
As discussed, above, feebates and standards have similar effects. Feebates fix the cost and standards fix the amount of reduction, but both primarily act to draw or push technology into the market. Thus, the argument is often made that feebates are not needed if efficiency or CO2 standards already exist. There are five reasons why feebates are an effective complement to standards.
First, as discussed above, feebates provide a better long-term signal for advanced technology development, due to the inherent uncertainty in what the standards will be 10 to 20 years in advance.
Second, the loss averse nature of consumers and the large uncertainty in the future fuel savings creates a substantial gap between the value of fuel savings to consumers and to society, which values full life fuel savings. If standards are used to fill in this gap, manufacturers are placed in a difficult position. While the benefits to society justify the standards, most new vehicle customers will not value the fuel savings and manufacturers may be forced to try to sell vehicles that consumers do not want. Feebates fix this disconnect, as they monetize the future revenue stream from fuel savings and convert it into an upfront payment. This removes the uncertainty in the future revenue stream and offers immediate value for the higher levels of technology demanded by the standards.
Third, the severe discounting of future fuel savings by consumers has greatly contributed to the steady increase in vehicle performance over the last several decades. Performance improvements are relatively certain and customers can immediately feel the improvement, while fuel savings are highly uncertain and accrue only over time. Feebates convert the future, uncertain fuel savings into an upfront payment to customers who choose efficiency over
16 Best Practices for Feebate Program Design and Implementation

performance. The certainty and immediacy of the payment will restrain market demand for increasing vehicle performance.
Forth, feebates provide incentives for manufacturers to exceed the standard. This is especially important because different manufacturers have different capability and market share. It is very difficult, if not impossible, to design standards so they maximize technology introduction from all manufacturers. There will always be manufacturers that have a more difficult or an easier time meeting the standards. With only a standard, manufacturers will only do the bare minimum to comply. Feebates pay all manufacturers to improve, including going beyond the standards.
Fifth, once a properly constructed feebate program is adopted, it does not need to be revised, except for adjustments in the pivot point. Standards require projections of future technology development, technology cost, and consumer behavior. These are highly uncertain factors, which means that standards have always been set for limited blocks of time in the future and have to be revisited every 5 to 15 years. Feebates can offer continuously incentives for advanced technology, even if revised standards are tied up in politics.
The current efforts to reach 95 g CO2/km in Europe illustrate how feebates can be used to supplement standards. While Europe has a goal to achieve 95 g CO2/km by 2020, the interim standards recently adopted by Europe only mandate about 130 g CO2/km by 2015 and the annual reductions in CO2 must be increased after 2016 to achieve the 95 target in 2020. The 2015 standards were less stringent than originally anticipated due to concerns about the rate of technology development and impacts on domestic European manufacturers. Instead of fighting over the standards, such concerns could be addressed by adopting effective feebate programs. If the technology develops, feebates will pull it into production and help meet the 2020 goal of 95 g CO2/km.
PRELIMINARY ASSESSMENT OF FEEBATE AND FEE-ONLY PROGRAM EFFECTIVENESS IN EUROPE
Assessing the effects of feebate programs with respect to customer purchase decision and manufacturer development strategy is difficult. Most feebate systems have been introduced only recently and sufficient data of subsequent changes – ideally in contrast to a comparison group – is not generally available.
Great Britain has one of the longest experiences with CO2 based feebate systems for passenger vehicles. The annual vehicle tax (Vehicle Excise Duty, or VED) in UK has been based on CO2 emissions since 2001. However, an analysis of the average CO2 emissions of the new vehicle fleet in UK suggests the introduction of the CO2 based VED had only a minor impact. Annual reduction of the fleet average increased from a rate of 1.2% (1995-2000) to 1.3% (2001-2007), while the average annual reduction rate within the EU decreased from 1.7% to 1.0%. Only about 40% of all new passenger cars are affected by the VED feebate system, as about 60% are company cars which are taxed using a different system based on vehicle’s list price and CO2 emissions. Consequently, the current VED feebate system in the UK and also its recent revision in 2008 are criticized by the House of Commons Environmental Audit Committee as not having “a big influence on people’s decisions as to which vehicles to buy”.17
17House of Commons Environmental Audit Committee, “Vehicle Excise Duty as environmental tax – Tenth report of session 2007-08”.
17 Preliminary Assessment of Feebate and Fee-Only Program Effectiveness in Europe

Recent data from the Irish and the French vehicle markets suggest a stronger influence from newly introduced feebate systems.18 New vehicle CO2 emissions in Ireland only decreased by 0.2% per year from 2000 to 2007, well below he European average of 1.0% per year. After introduction of the new tax structure in July 2008, CO2 g/km decreased by 3.6%, above the average European decrease rate of 3.1%. Unfortunately, vehicle sales in Ireland dropped 19% in 2008-2009 due to the economic downturn, making it difficult to tell whether the impact is due to the newly introduced feebate system.
In France, after introduction of the new feebate system in January 2008 average CO2 emissions of the new vehicle fleet dropped by 9 g/km, or approximately 6%, in one year. This is nearly twice the average 3.1% CO2 emission reduction in the EU during the same period. It is also much higher than the average annual reduction of 1.2% from 2000 to 2007 in France. The French vehicle market in 2008 was virtually unaffected by the economic downturn (vehicle sales decreased by only 0.7% from 2007 to 2008) and a bonus program for scrapping old vehicles did not start before December 2008. Fuel prices were at a peak in 2008, but this was for all countries within the EU. Therefore, the drop in CO2 emissions on the French market in 2008 was remarkable and is likely attributable primarily to the new feebate system.
Analyzing the French situation in detail reveals the following points:• There was a strong vehicle sales increase of about 80% in emission category B
(101-120 g/km). Every emission category with emissions between 120 and 250 g/km had a sales volume decrease. This suggests that the bonus of €700 for category B had a significant impact on customer purchase decision for these vehicles.
• Sales also increased for vehicles with emissions below 100 g/km, but there are very few models in these categories and sales were still extremely low.
• Sales decreased for category C, which had a smaller bonus of €200. It is not clear if the bonus for category C was too low to convince additional customers to buy these vehicles, or if the much larger bonus for category B caused more customers to move from category C to category B than moved from higher emission categories to category C.
• No decrease in market share was observed for “luxury category” gasoline vehicles with very high CO2 emissions, above 250 g/km. This suggests that these customers are less sensitive to price than purchasers of lower cost, more efficient vehicles.
• Average engine power and vehicle mass had their largest annual decrease since at least 1984 after the feebate system was implemented in France. Average new vehicle engine power decreased by 5 kW to 75 kW and average curb weight dropped by 32 kg to 1266 kg.
In sum, the French feebate system appears to have had a significant impact on the new passenger vehicle market. France has 14 percent of the EU market share and two major passenger vehicle manufacturers have their headquarters there, so the feebate system could also influence developments in other countries within the EU.
A throughout scientific evaluation of the impacts, especially on vehicle manufacturers and technology introduction, requires more data over several years.
18A detailed discussion of the French and Irish feebate programs is presented in a subsequent section of this report.
18 Best Practices for Feebate Program Design and Implementation

WORLDWIDE EFFORTS TO DEVELOP FEEBATE AND FEEBATE-LIKE INCENTIVE PROGRAMS
OVERVIEW AND COMPARISON OF EXISTING FEEBATE-LIKE PROGRAMS
There are a number of existing global programs that include one or more aspects of a feebate program. Although there are aspects of program structure that make it less than ideal, France, for example, has implemented an actual feebate program. While not feebate programs per se, there are other “feebate-like” programs in effect in several European countries -- some of which are more stringent in terms of their inherent CO2 price signals than the French feebate program. Such programs are generally being implemented throughout the EU as part of that regions commitment to reduce CO2 emissions from vehicles.19 Countries such as Austria, Belgium, Cyprus, Denmark, Finland, Germany, Ireland, Italy, Luxembourg, Malta, The Netherlands, Portugal, Romania, Spain, Sweden, Switzerland, and the United Kingdom tax new vehicle sales and/or annual vehicle registrations in total or partially on the basis of either fuel consumption or CO2.
All EU countries currently impose a Value-Added Tax (VAT) on vehicle sales (analogous to a U.S. sales or excise tax). This includes France, which imposes a 19.6 percent VAT that applies in addition to the feebate requirements described above. The VAT does not alter the magnitude of the price signal of the French feebate system, but is indicative of the degree of government “intervention” in vehicle purchase transactions. In addition, this presents a potential opportunity. All EU countries are expected to move to a CO2 tax basis in support of the EU CO2 standards. If VATs could be converted, at least in part, to feebate programs based on CO2, this could provide major incentives to reduce vehicle CO2 emissions.
Canada, as part of its 2007 budget process, implemented a short term (two year) program that provided rebates for new vehicles achieving a specified level of fuel efficiency (the so-called ecoAUTO Rebate program) in conjunction with a program that levied a tax on inefficient vehicles (the so-called Green Levy program). Taken together, these two programs formed the requisite two sides of a feebate program, but both their temporary nature and certain design aspects of the programs served to limit effectiveness.
In the U.S., various federal feebate bills have been introduced over the years, but none has been adopted. The U.S. has implemented limited tax credits for certain vehicles, but these credits have generally been based on specific technology (e.g., hybrid-electric vehicles) rather than CO2 or fuel efficiency per se. The U.S. does, however, administer an existing gas guzzler statute requiring that manufacturers of passenger cars achieving a CAFE mpg of less than 22.5 pay a fee that varies with the magnitude of deviation from 22.5 mpg. This gas guzzler tax is essentially equivalent to the fee half of a feebate program and could, therefore, serve as an effective foundation upon which to construct a more complete feebate program.
The French, Irish, German, Canadian, and U.S. programs are discussed in more detail below. While programs in the other EU countries are of interest, their large number and variability in design and magnitude of associated tax burden render a detailed discussion of each beyond the scope of this report. However, in order to provide a representative review of their potential
19In 2005 the European Commission proposed that by 2008/09 at least 25% and by 2010/11 at least 50% of all tax revenues from registration and annual circulation taxes should be based on CO2. While this proposal was rejected by the Council of European Union finance ministers in November 2007, at least 16 countries in Europe have adopted policies that comply, at least in part, with the European Commission’s proposal.
19 Worldwide Efforts to Develop Feebate and Feebate-Like Incentive Programs
impacts, the Irish and German programs are of particular interest – Ireland for the magnitude of its tax rates and Germany for the continuous nature of its CO2 taxes.
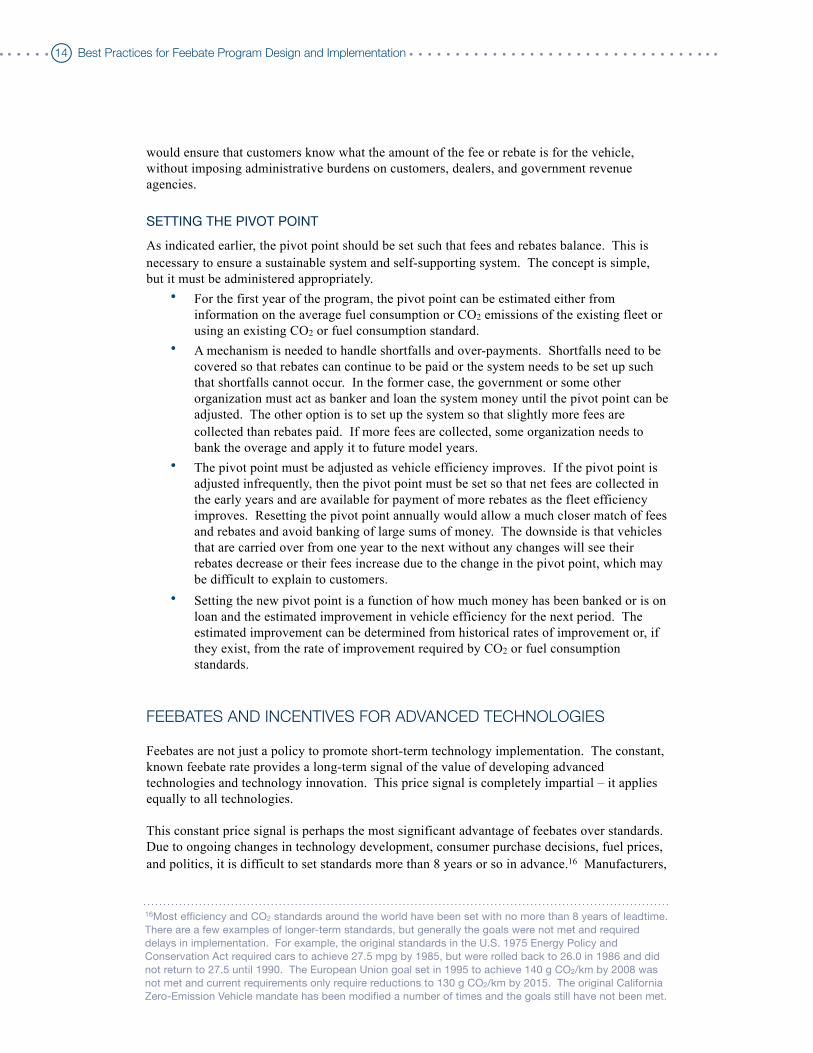
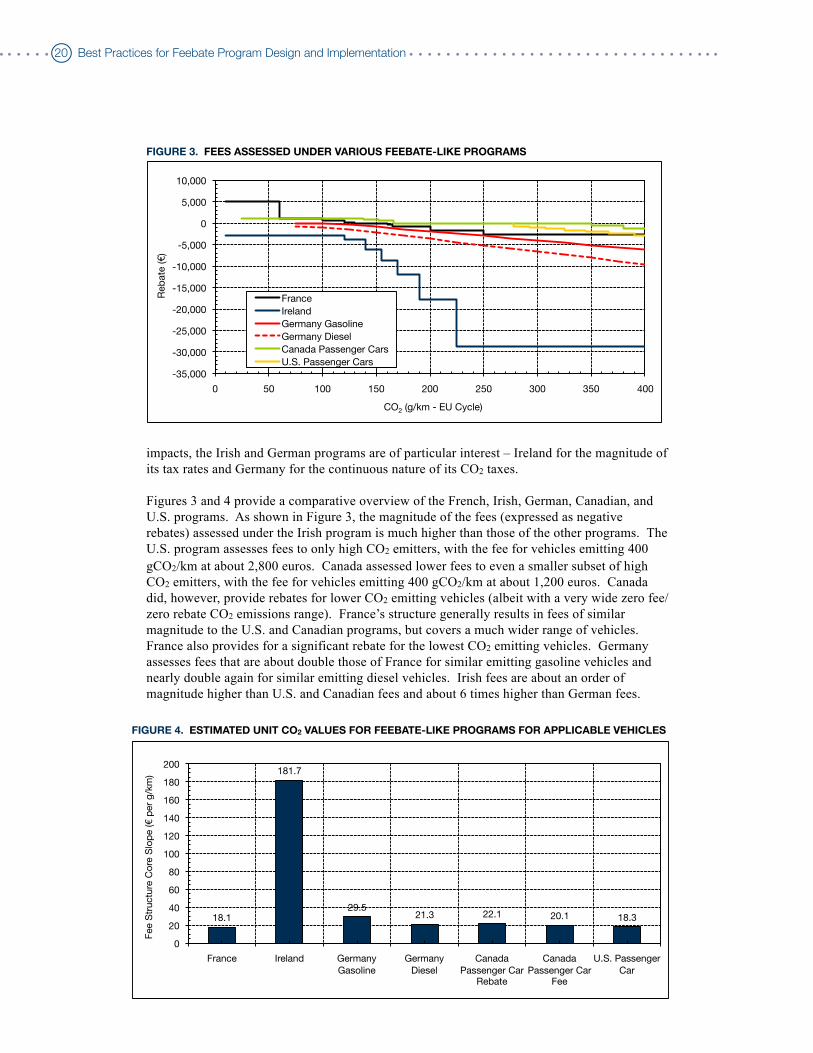
Figures 3 and 4 provide a comparative overview of the French, Irish, German, Canadian, and U.S. programs. As shown in Figure 3, the magnitude of the fees (expressed as negative rebates) assessed under the Irish program is much higher than those of the other programs. The U.S. program assesses fees to only high CO2 emitters, with the fee for vehicles emitting 400 gCO2/km at about 2,800 euros. Canada assessed lower fees to even a smaller subset of high CO2 emitters, with the fee for vehicles emitting 400 gCO2/km at about 1,200 euros. Canada did, however, provide rebates for lower CO2 emitting vehicles (albeit with a very wide zero fee/zero rebate CO2 emissions range). France’s structure generally results in fees of similar magnitude to the U.S. and Canadian programs, but covers a much wider range of vehicles. France also provides for a significant rebate for the lowest CO2 emitting vehicles. Germany assesses fees that are about double those of France for similar emitting gasoline vehicles and nearly double again for similar emitting diesel vehicles. Irish fees are about an order of magnitude higher than U.S. and Canadian fees and about 6 times higher than German fees.
FIGURE 3. FEES ASSESSED UNDER VARIOUS FEEBATE-LIKE PROGRAMS
-35,000!
-30,000!
-25,000!
-20,000!
-15,000!
-10,000!
-5,000!
0!
5,000!
10,000!
0! 50! 100! 150! 200! 250! 300! 350! 400!
Reb
ate
("
) !
CO2 (g/km - EU Cycle)!
France!
Ireland!
Germany Gasoline!
Germany Diesel!
Canada Passenger Cars!
U.S. Passenger Cars!
FIGURE 4. ESTIMATED UNIT CO2 VALUES FOR FEEBATE-LIKE PROGRAMS FOR APPLICABLE VEHICLES
18.1!
181.7!
29.5!21.3! 22.1! 20.1! 18.3!
0!
20!
40!
60!
80!
100!
120!
140!
160!
180!
200!
France! Ireland! Germany
Gasoline!
Germany
Diesel!
Canada
Passenger Car Rebate!
Canada
Passenger Car Fee!
U.S. Passenger
Car!
Fee S
tructu
re C
ore
Slo
pe (" p
er
g/k
m) !
20 Best Practices for Feebate Program Design and Implementation

Due to the step change nature of most of the program designs, it is not possible to calculate an exact value for unit CO2 emissions, but estimated unit CO2 values for the various programs are presented in Figure 4. As indicated, all of the programs generally fall within a range of 18-30 euros per gCO2 per kilometer, with the exception of the Irish program where the unit value of CO2 emissions is an order of magnitude higher. Note that these values are for the affected vehicles and the Canadian and US programs affect only a relatively small part of the fleet, as shown in Figure 3, so their overall effectiveness is much lower than indicated by this comparison. Each of these programs is discussed in more detail below, as are the specific assumptions used to derive the presented relationships.
THE FRENCH FEEBATE PROGRAM
France has implemented a feebate program that is arguably the closest of any existing program to the idealized design features discussed above. Table 2 summarizes the program design, a graphic depiction of which is presented in Figure 5. To maximize utility, Table 2 includes both the official French design units and their approximate definitional U.S. unit equivalents. Graphic depictions of the equivalent U.S. relationships are included in Appendix A (Figures A1 and A2).20
20Readers reviewing Figure A1 should note that it presents the program design in terms of U.S. fuel consumption, rather than fuel economy units, for precisely the reasons noted above -- namely that fuel savings vary linearly with fuel consumption, not fuel economy. Figure A3 (in Appendix A) illustrates this graphically by plotting the feebate design against U.S. gasoline equivalent fuel economy, and it is clearly obvious that the French design is quite properly nonlinear in fuel economy space. For translational convenience, Figure A4 (in Appendix A) depicts the relationship between fuel economy and CO2.21The test cycle correction is taken from “Passenger Vehicle Greenhouse Gas and Fuel Economy Standards: A Global Update,” The International Council of Clean Transportation (ICCT), July 2007 (see “Appendix: Methodology for Adjusting Standards”). It is noted, however, that the corrections in the ICCT reference are nonlinear (they are based on logarithmic regression data). The EU to US correction generally depicts an EU test cycle that is more stringent (i.e., requires greater engine work), but the nonlinear nature of the correction factor construction results in a crossover point (at approximately 62 EU gCO2/km, or 89 US mpg) where the U.S. cycle becomes “more stringent.” This is undoubtedly due to extrapolation beyond the range of performance used to construct the correction curves. To minimize the impact of such extrapolations, the range of the correction factor curve was limited to 100-600 EU gCO2/km (approximately 11-58 US mpg). Below and above this range, corrections were held constant at the predicted values for 100 and 600 EU gCO2/km respectively (which are 1.0489 for 100 EU gCO2/km and 1.2318 for 600 EU gCO2/km). Research should be done to assess the actual relationship between the EU and US cycles at low CO2 emission levels, to determine if there is a physical property that is causing the relatively stringency to change at low consumption levels, or if this is just an artifact of the extrapolation.
TABLE 2. DESIGN OF THE FRENCH FEEBATE PROGRAM
EU CO2
(g/km)
FrenchRebate
(€)
EquivalentRebate(US$)
GasolineEquivalentU.S. mpg
EquivalentU.S. CO2
(g/mi)
≤60 5,000 6,591 ≥96.1 ≤92.1
61-100 1,000 1,318 57.6-96.0 92.2-153.4
101-120 700 923 48.9-57.5 153.5-180.9
121-130 200 264 45.5-48.8 181.0-194.5131-160 0 0 37.7-45.4 194.6-234.8
161-165 -200 -264 36.6-37.6 234.9-241.4
166-200 -750 -989 30.8-36.5 241.5-287.5
201-250 -1,600 -2,109 25.1-30.7 287.4-352.2>250 -2,600 -3,427 <25.1 >352.2
Notes: (1) Equivalent rebates in US$ assume a currency exchange rate of 1.3182 US$ per €. (2) U.S. equivalent fuel economy (mpg) and CO2 emission rates incorporate a regulatory test cycle correction
factor.21
Notes: (1) Equivalent rebates in US$ assume a currency exchange rate of 1.3182 US$ per €. (2) U.S. equivalent fuel economy (mpg) and CO2 emission rates incorporate a regulatory test cycle correction
factor.21
Notes: (1) Equivalent rebates in US$ assume a currency exchange rate of 1.3182 US$ per €. (2) U.S. equivalent fuel economy (mpg) and CO2 emission rates incorporate a regulatory test cycle correction
factor.21
Notes: (1) Equivalent rebates in US$ assume a currency exchange rate of 1.3182 US$ per €. (2) U.S. equivalent fuel economy (mpg) and CO2 emission rates incorporate a regulatory test cycle correction
factor.21
Notes: (1) Equivalent rebates in US$ assume a currency exchange rate of 1.3182 US$ per €. (2) U.S. equivalent fuel economy (mpg) and CO2 emission rates incorporate a regulatory test cycle correction
factor.21
21 Worldwide Efforts to Develop Feebate and Feebate-Like Incentive Programs
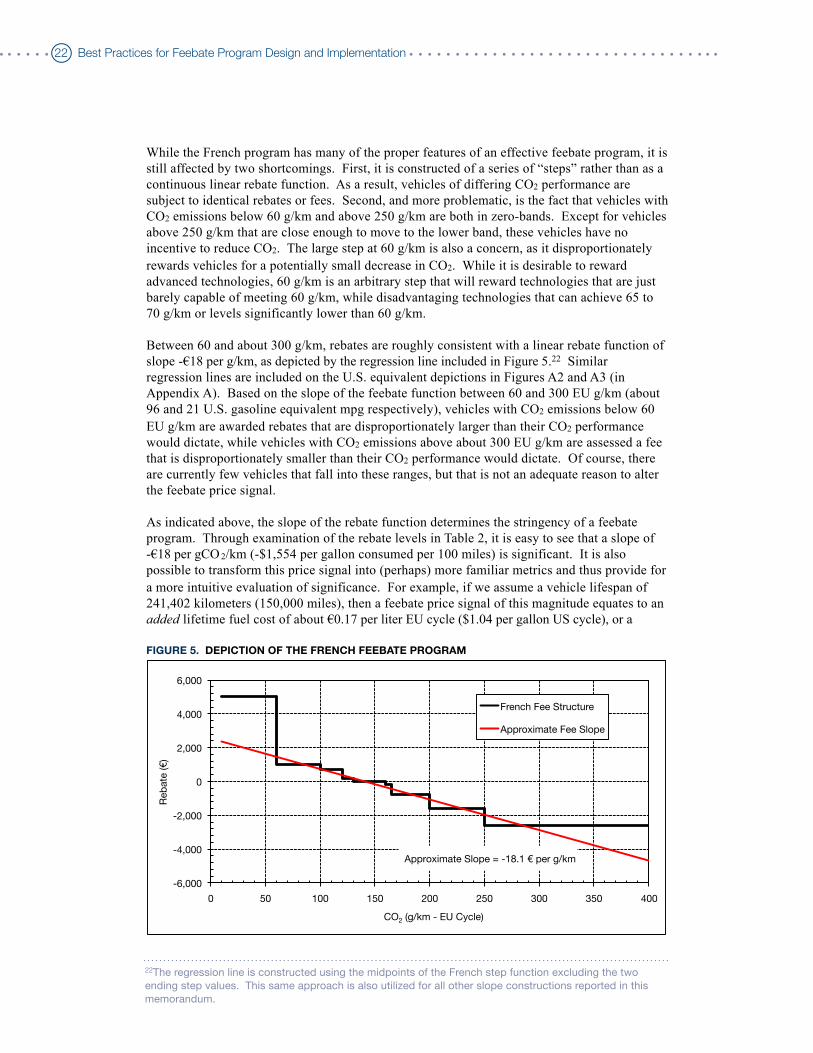
While the French program has many of the proper features of an effective feebate program, it is still affected by two shortcomings. First, it is constructed of a series of “steps” rather than as a continuous linear rebate function. As a result, vehicles of differing CO2 performance are subject to identical rebates or fees. Second, and more problematic, is the fact that vehicles with CO2 emissions below 60 g/km and above 250 g/km are both in zero-bands. Except for vehicles above 250 g/km that are close enough to move to the lower band, these vehicles have no incentive to reduce CO2. The large step at 60 g/km is also a concern, as it disproportionately rewards vehicles for a potentially small decrease in CO2. While it is desirable to reward advanced technologies, 60 g/km is an arbitrary step that will reward technologies that are just barely capable of meeting 60 g/km, while disadvantaging technologies that can achieve 65 to 70 g/km or levels significantly lower than 60 g/km.
Between 60 and about 300 g/km, rebates are roughly consistent with a linear rebate function of slope -€18 per g/km, as depicted by the regression line included in Figure 5.22 Similar regression lines are included on the U.S. equivalent depictions in Figures A2 and A3 (in Appendix A). Based on the slope of the feebate function between 60 and 300 EU g/km (about 96 and 21 U.S. gasoline equivalent mpg respectively), vehicles with CO2 emissions below 60 EU g/km are awarded rebates that are disproportionately larger than their CO2 performance would dictate, while vehicles with CO2 emissions above about 300 EU g/km are assessed a fee that is disproportionately smaller than their CO2 performance would dictate. Of course, there are currently few vehicles that fall into these ranges, but that is not an adequate reason to alter the feebate price signal.
As indicated above, the slope of the rebate function determines the stringency of a feebate program. Through examination of the rebate levels in Table 2, it is easy to see that a slope of -€18 per gCO 2/km (-$1,554 per gallon consumed per 100 miles) is significant. It is also possible to transform this price signal into (perhaps) more familiar metrics and thus provide for a more intuitive evaluation of significance. For example, if we assume a vehicle lifespan of 241,402 kilometers (150,000 miles), then a feebate price signal of this magnitude equates to an added lifetime fuel cost of about €0.17 per liter EU cycle ($1.04 per gallon US cycle), or a
22The regression line is constructed using the midpoints of the French step function excluding the two ending step values. This same approach is also utilized for all other slope constructions reported in this memorandum.
FIGURE 5. DEPICTION OF THE FRENCH FEEBATE PROGRAM
-6,000!
-4,000!
-2,000!
0!
2,000!
4,000!
6,000!
0! 50! 100! 150! 200! 250! 300! 350! 400!
Reb
ate
(") !
CO2 (g/km - EU Cycle)!
French Fee Structure!
Approximate Fee Slope!
Approximate Slope = -18.1 " per g/km!
22 Best Practices for Feebate Program Design and Implementation

lifetime carbon cost of about €75 per tonne of CO 2 avoided EU cycle ($106 per ton of CO2 avoided US cycle).
Clearly, a price signal of such magnitude is significant and will have an immediate impact on consumer purchase decisions. What is less clear is to what extent vehicle manufacturers will consider such a signal in their technology decision-making, as the overall potential of the price signal is muted by the fact that manufacturer decision-making is likely to be controlled by overall EU, rather than French-specific, requirements (i.e., French-only requirements are somewhat analogous to state-level requirements in the U.S., with France being the forth most important car market within the EU). To the extent that other EU countries adopt the French program, or an equivalent, its overall effectiveness as a CO2 control measure is likely to increase in concert with program expansion.
IRISH FEE-ONLY PROGRAMS
Ireland, in particular, offers an interesting review as its tax rates are among the highest in the EU, and the country applies CO2 taxes both at each change of vehicle ownership (new and used vehicle sales) and at each annual registration renewal in addition to the VAT. This results in a particularly large CO2 price signal and, by U.S. standards, a particularly high vehicle tax. Given this situation, it is worth taking a look at the Irish program in a bit more detail, even though these are fee-only programs.
As indicated in Table 3, the Irish new vehicle tax rate varies from 14-36 percent and is applied to the “Open Market Selling Price” of the vehicle, unless that price is below €2,000, in which case the indicated minimum tax applies. The Open Market Selling Price is the “typical” price the vehicle would be expected to command on the open market, not the actual selling price of the vehicle. This is roughly equivalent to the “book value” of a vehicle in the U.S.
Because price not only varies across vehicles, but also generally varies with CO2 emissions (since more expensive vehicles tend to be larger luxury or high performance models with higher CO2 emissions), it is not possible to draw a direct comparison between the French feebate program and the Irish vehicle sales tax. However, using historic sales data for Ireland, it is possible to estimate the average sales price and CO2 emission rate of Irish vehicles, as well as the rate at which average vehicle price varies with CO2 emissions. Using R.L. Polk data for model year 2006, the (sales weighted) average vehicle price and CO2 emission rate in Ireland was estimated to be €21,050 and 165 g/km respectively. These same data indicate that on a sales weighted basis the vehicle price generally rises about €168 per gCO2/km. Using these data, the estimated average vehicle price and average tax rate applied to new vehicle sales were calculated as indicated in Table 3.
TABLE 3. DESIGN OF THE IRISH VEHICLE REGISTRATION PROGRAM
EU CO2
(g/km)
Tax Rate atVehicle Sale
(€)
MinimumTax at
Vehicle Sale(€)
EstimatedVehiclePrice
(€)
EstimatedTax for a
New Vehicle(€)
Tax at AnnualRegistration
(€)
≤120 14% 280 13,490 1,889 104
121-140 16% 320 15,170 2,427 156
141-155 20% 400 18,110 3,622 302
156-170 24% 480 20,630 4,951 447
171-190 28% 560 23,570 6,600 630
191-225 32% 640 28,190 9,021 1,050
>225 36% 720 31,130 11,207 2,100
23 Worldwide Efforts to Develop Feebate and Feebate-Like Incentive Programs
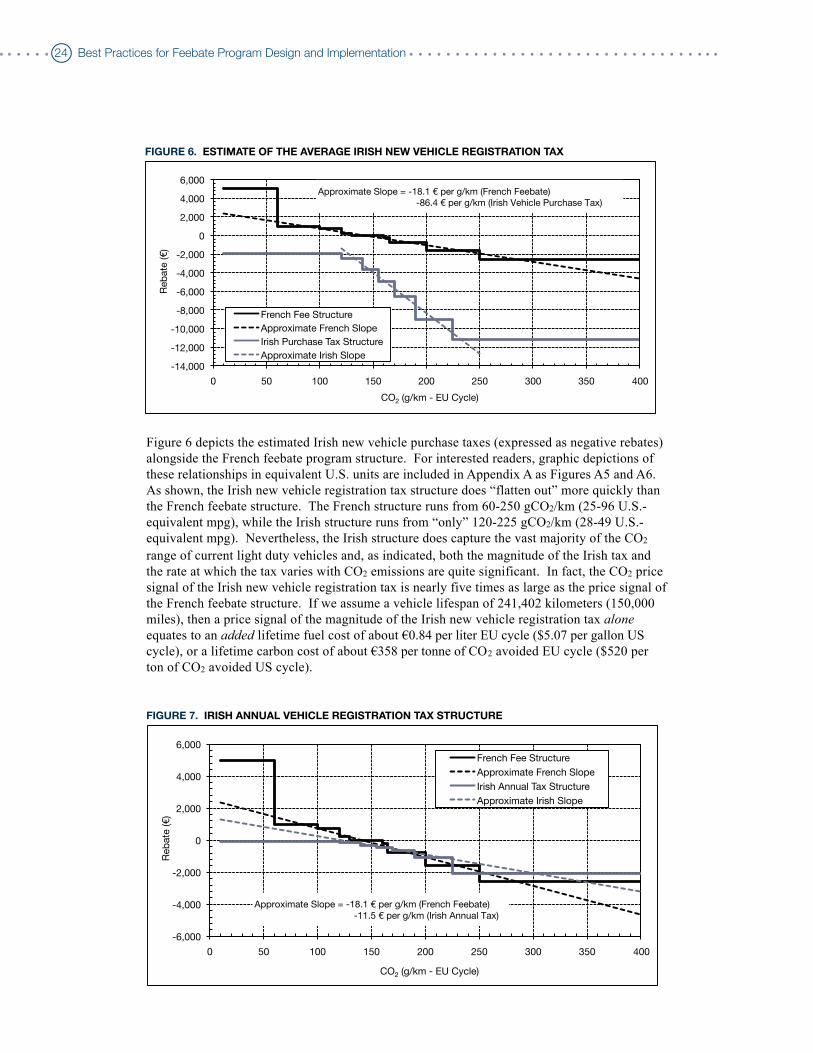
Figure 6 depicts the estimated Irish new vehicle purchase taxes (expressed as negative rebates) alongside the French feebate program structure. For interested readers, graphic depictions of these relationships in equivalent U.S. units are included in Appendix A as Figures A5 and A6. As shown, the Irish new vehicle registration tax structure does “flatten out” more quickly than the French feebate structure. The French structure runs from 60-250 gCO2/km (25-96 U.S.-equivalent mpg), while the Irish structure runs from “only” 120-225 gCO2/km (28-49 U.S.-equivalent mpg). Nevertheless, the Irish structure does capture the vast majority of the CO2 range of current light duty vehicles and, as indicated, both the magnitude of the Irish tax and the rate at which the tax varies with CO2 emissions are quite significant. In fact, the CO2 price signal of the Irish new vehicle registration tax is nearly five times as large as the price signal of the French feebate structure. If we assume a vehicle lifespan of 241,402 kilometers (150,000 miles), then a price signal of the magnitude of the Irish new vehicle registration tax alone equates to an added lifetime fuel cost of about €0.84 per liter EU cycle ($5.07 per gallon US cycle), or a lifetime carbon cost of about €358 per tonne of CO2 avoided EU cycle ($520 per ton of CO2 avoided US cycle).
FIGURE 6. ESTIMATE OF THE AVERAGE IRISH NEW VEHICLE REGISTRATION TAX
-14,000!
-12,000!
-10,000!
-8,000!
-6,000!
-4,000!
-2,000!
0!
2,000!
4,000!
6,000!
0! 50! 100! 150! 200! 250! 300! 350! 400!
Reb
ate
("
) !
CO2 (g/km - EU Cycle)!
French Fee Structure!
Approximate French Slope!
Irish Purchase Tax Structure!
Approximate Irish Slope!
Approximate Slope = -18.1 " per g/km (French Feebate)!
-86.4 " per g/km (Irish Vehicle Purchase Tax)!
FIGURE 7. IRISH ANNUAL VEHICLE REGISTRATION TAX STRUCTURE
-6,000!
-4,000!
-2,000!
0!
2,000!
4,000!
6,000!
0! 50! 100! 150! 200! 250! 300! 350! 400!
Reb
ate
(")!
CO2 (g/km - EU Cycle)!
French Fee Structure!
Approximate French Slope!
Irish Annual Tax Structure!
Approximate Irish Slope!
Approximate Slope = -18.1 " per g/km (French Feebate)!
-11.5 " per g/km (Irish Annual Tax)!
24 Best Practices for Feebate Program Design and Implementation

However, the effective price signal of the Irish program is actually significantly larger as the new vehicle registration tax is supplemented by a recurring annual registration tax that is also based on CO2 emissions. Thus, unlike a typically envisioned feebate design, which sends a one-time price signal to both manufacturers and consumers at the time of new vehicle purchase, the Irish program amplifies an initial purchase price signal through subsequent annual assessments.
The basic parameters of the annual tax are included in Table 3 above. Figure 7 depicts the structure of the annual registration tax23 (expressed as a negative rebate) alongside the French feebate program structure. For interested readers, graphic depictions of these relationships in equivalent U.S. units are included in Appendix A as Figures A7 and A8. As with the new vehicle registration tax, the annual Irish tax structure “flattens out” more quickly than the French feebate structure. The French structure runs from 60-250 gCO2/km (25-96 U.S.-equivalent mpg), while the Irish annual tax structure runs from 120-225 gCO2/km (28-49 U.S.-equivalent mpg).24 Nevertheless, as with the Irish new vehicle tax, the Irish annual tax structure does capture the vast majority of the CO2 range of current light duty vehicles.
On an annual basis, the magnitude of the CO2 price signal associated with the annual Irish tax is quite significant, but substantially lower than that of the Irish new vehicle tax and the French feebate signal. However, since the annual tax accrues each year, compounding the effect of the Irish new vehicle tax, the cumulative Irish CO2 price signal is much larger. Since the tax accrues over time, it is necessary to discount annual tax assessments to derive an estimate of a cumulative new vehicle equivalent price signal.25 Figure 8 depicts the equivalent new vehicle value (expressed as a negative rebate) of the string of lifetime tax assessments associated with the Irish program alongside the French feebate program structure. For interested readers, graphic depictions of these relationships in equivalent U.S. units are included in Appendix A as Figures A9 and A10. Like the component new vehicle and annual registration tax structures, the net effective Irish tax structure “flattens out” more quickly than the French feebate structure, but captures the vast majority of the CO2 range of current light duty vehicles and, as indicated, both the magnitude of the Irish tax and the rate at which the tax varies with CO2 emissions are quite significant.
As indicated in Figure 8, the effective CO2 price signal of the lifetime Irish registration tax on a new vehicle equivalent basis is ten times as large as the price signal of the French feebate structure. If we assume a vehicle lifespan of 241,402 kilometers (150,000 miles), then a price signal of the magnitude of the Irish registration tax equates to an added lifetime fuel cost of about €1.76 per liter EU cycle ($10.65 per gallon US cycle) or a lifetime carbon cost of about
23The “annual registration tax” terminology used here is generally referred to as an “annual circulation tax” in Europe.24Note that EU emissions are influenced by the large number of diesel vehicles on the road, which have significantly lower CO2 emissions than the gasoline vehicles that dominate in the U.S.25 For this paper, an annual discount rate of 8 percent is assumed and applied to an assumed vehicle lifetime of 150,000 miles and 12 years. Such vehicle lifetime assumptions are generally consistent with typical U.S. vehicle usage conditions and were selected to provide consistent comparative assumptions for all of the various programs described in the paper. Local usage patterns may vary, of course, and the effect of such variation will alter derived new vehicle equivalent price signals, but the effect is expected to be relatively modest and such that the actual local price signals are likely to be higher than those presented herein. The reason for this is that while local annual mileage accumulation may be considerably lower than the assumed U.S. average of 12,500 miles per year, the net effect is that vehicle lifetime on an age basis (and thus the associated string of annual registration payouts) is extended relative to the U.S. assumed average of 12 years. For example, the net effect of assuming an annual mileage of 8,700 miles rather than 12,500, while assuming a constant 150,000 mile vehicle lifetime, is an approximate increase of 15 percent in the magnitude of the discounted price signal (cumulative expenditures are discounted at a larger rate but the string of payments is longer).
25 Worldwide Efforts to Develop Feebate and Feebate-Like Incentive Programs

€753 per tonne of CO2 avoided EU cycle ($1,093 per ton of CO2 avoided US cycle). While it is unclear to what extent consumers recognize the implications of the annual components of this price signal in their initial purchase decisions, this is a very significant tax rate and is likely to have significant impacts on purchase decisions. It is far less clear to what extent manufacturers would consider such signals in their technology decision-making, but it is likely (as was the case with the French program) that the overall potential of the Irish signals are muted by the fact that manufacturer decision-making is likely to be controlled by overall EU requirements (Ireland only has about 1% of the EU market share). As with the French feebate program, the impact of the Irish program will increase as it or similar programs expand to cover a wider fraction of the EU fleet.
Finally, while it might be tempting to treat U.S. fuel taxes as an offsetting factor to the annual Irish registration tax, since effective annual fuel taxes assessed on a per gallon basis will vary directly with the fuel efficiency of vehicles, such an offset is not appropriate as Ireland also implements a fuel tax that dwarfs that of the U.S. Fuel taxes in all EU countries range from about €0.3-€0.7 per liter (about $1.50-$3.50 per gallon) and are €0.443 and €0.368 per liter (about $2.20 and $1.85 per gallon) in Ireland for gasoline and diesel fuel respectively. This compares with a typical fuel tax in the U.S. (federal plus state) of about $0.45-$0.50 per gallon. Clearly, the cost of vehicle ownership is significantly higher in the EU, even before programs such as feebates or CO2 taxes are considered.
GERMAN CONTINUOUS CO2 FEES
The program implemented on July 1, 2009 in Germany is also informative, given Germany’s status as a global vehicle manufacturing center and a unique feature of the program. Effective as of that date, Germany revised its annual vehicle registration taxes to include a continuous CO2-based component, the first time a continuous incentive has been adopted.
The revised annual registration taxes are based on both engine displacement and CO2. For vehicles with spark-ignition engines, annual registration taxes are equal to €2 per 100 cubic centimeters (cc) of engine displacement plus €2 for every gCO2/km above 120.26 For vehicles with compression-ignition engines, annual registration taxes are equal to €9.5 per 100cc of
FIGURE 8. NEW VEHICLE EQUIVALENT LIFETIME IRISH TAX STRUCTURE
-40,000!
-35,000!
-30,000!
-25,000!
-20,000!
-15,000!
-10,000!
-5,000!
0!
5,000!
10,000!
15,000!
0! 50! 100! 150! 200! 250! 300! 350! 400!
Reb
ate
("
) !
CO2 (g/km - EU Cycle)!
French Fee Structure!
Approximate French Slope!
Irish Discounted Lifetime Tax Structure!
Approximate Irish Slope!
Approximate Slope = -18.1 " per g/km (French Feebate)!
-181.7 " per g/km (Irish Lifetime Tax)!
26In model years 2012 and 2013, the base emission rate drops to 110 gCO2/km for both spark and compression ignition engines, and subsequently drops again for model year 2014 and later to 95 gCO2/km.
26 Best Practices for Feebate Program Design and Implementation

engine displacement plus €2 for every gCO2/km above 120. The CO2 effectiveness of the engine displacement tax is likely to be lower, as CO2 is only indirectly linked to engine displacement. This linkage can be broken with turbocharging or if alternative fueling options become economically viable in the future, although CO2 is well correlated with engine displacement for current technology vehicles.
Using R.L. Polk data for model year 2006, it is possible to estimate the relationship between engine displacement and CO2 emission rate for German vehicles. From these data, the (sales weighted) average displacement and CO2 emission rate in Germany was 1663cc and 172 g/km respectively for spark ignition vehicles and 2078cc and 169 g/km respectively for compression ignition vehicles, with the following relationships:27
Spark Ignition: cc = 14.605 gCO2/km - 845.227 (r2 = 0.89)Compression Ignition: cc = 12.338 gCO2/km - 18.611 (r2 = 0.81)
Using these relations, it is possible to estimate the overall tax burden for the range of CO2 emission rates reflected in the underlying vehicle fleet (approximately 75 to 400 gCO2/km). As shown in Figure 9, the tax burden ranges from about €5 to €660 for spark ignition vehicles and €85 to €1,030 for compression ignition vehicles, with the displacement related component of these burdens ranging from about €5 to €100 for spark ignition vehicles and from about €85 to €470 for compression ignition vehicles. The direct CO2 component of the burden rises from about €0 to €560 for both spark and compression ignition vehicles. For spark ignition vehicles, the direct CO2 share of the overall tax burden rises from zero percent for low emitters to about
27Note that normally CO2 would be the dependent regression parameter, but for this paper we are trying to predict the nominal displacement for specific levels of CO2 (given an historic fleet of vehicles) to allow the German registration tax to be estimated in terms of CO2 only, rather than in mixed terms of CO2 and displacement. Of course, specific tax levels for individual vehicles will vary about the estimates presented in this paper due to deviations in individual vehicle displacements (relative to those predicted using the indicated expressions), but we expect the presented tax estimates to be accurate on average. Clearly, a true CO2 tax would be based on CO2 alone and not a surrogate (such as displacement in this case). This is not a critique of the German tax structure as there may well be valid reasons for expressing tax burden in terms of displacement, but rather an acknowledgment that the full CO2 relationship of the German tax structure is rendered inherently uncertain by the underlying relationship between CO2 and displacement.
FIGURE 9. ESTIMATE OF THE ANNUAL GERMAN REGISTRATION TAX STRUCTURE
0%!
20%!
40%!
60%!
80%!
100%!
120%!
0!
200!
400!
600!
800!
1,000!
1,200!
0! 50! 100! 150! 200! 250! 300! 350! 400!
Direct
CO
2 P
ort
ion
of
Tota
l Ta
x !
Tax ("
) !
CO2 (g/km - EU Cycle)!
Annual Displacement Tax (Gasoline)!
Annual Displacement Tax (Diesel)!
Annual CO2 Tax (Gasoline and Diesel)!
Annual Total Tax (Gasoline)!
Annual Total Tax (Diesel)!
Direct CO2 Portion of Gasoline Tax!
Direct CO2 Portion of Diesel Tax!
27 Worldwide Efforts to Develop Feebate and Feebate-Like Incentive Programs
CO2
CO2
CO2
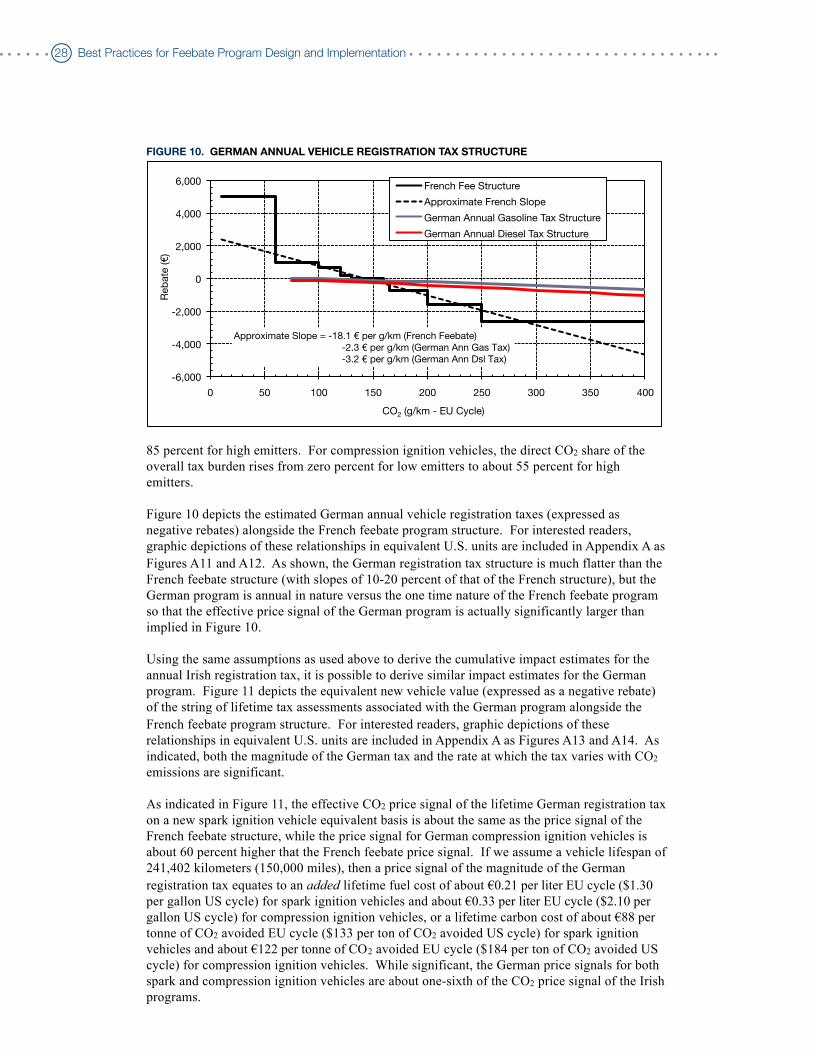
85 percent for high emitters. For compression ignition vehicles, the direct CO2 share of the overall tax burden rises from zero percent for low emitters to about 55 percent for high emitters.
Figure 10 depicts the estimated German annual vehicle registration taxes (expressed as negative rebates) alongside the French feebate program structure. For interested readers, graphic depictions of these relationships in equivalent U.S. units are included in Appendix A as Figures A11 and A12. As shown, the German registration tax structure is much flatter than the French feebate structure (with slopes of 10-20 percent of that of the French structure), but the German program is annual in nature versus the one time nature of the French feebate program so that the effective price signal of the German program is actually significantly larger than implied in Figure 10.
Using the same assumptions as used above to derive the cumulative impact estimates for the annual Irish registration tax, it is possible to derive similar impact estimates for the German program. Figure 11 depicts the equivalent new vehicle value (expressed as a negative rebate) of the string of lifetime tax assessments associated with the German program alongside the French feebate program structure. For interested readers, graphic depictions of these relationships in equivalent U.S. units are included in Appendix A as Figures A13 and A14. As indicated, both the magnitude of the German tax and the rate at which the tax varies with CO2 emissions are significant.
As indicated in Figure 11, the effective CO2 price signal of the lifetime German registration tax on a new spark ignition vehicle equivalent basis is about the same as the price signal of the French feebate structure, while the price signal for German compression ignition vehicles is about 60 percent higher that the French feebate price signal. If we assume a vehicle lifespan of 241,402 kilometers (150,000 miles), then a price signal of the magnitude of the German registration tax equates to an added lifetime fuel cost of about €0.21 per liter EU cycle ($1.30 per gallon US cycle) for spark ignition vehicles and about €0.33 per liter EU cycle ($2.10 per gallon US cycle) for compression ignition vehicles, or a lifetime carbon cost of about €88 per tonne of CO2 avoided EU cycle ($133 per ton of CO2 avoided US cycle) for spark ignition vehicles and about €122 per tonne of CO2 avoided EU cycle ($184 per ton of CO2 avoided US cycle) for compression ignition vehicles. While significant, the German price signals for both spark and compression ignition vehicles are about one-sixth of the CO2 price signal of the Irish programs.
FIGURE 10. GERMAN ANNUAL VEHICLE REGISTRATION TAX STRUCTURE
-6,000!
-4,000!
-2,000!
0!
2,000!
4,000!
6,000!
0! 50! 100! 150! 200! 250! 300! 350! 400!
Reb
ate
("
)!
CO2 (g/km - EU Cycle)!
French Fee Structure!
Approximate French Slope!
German Annual Gasoline Tax Structure!
German Annual Diesel Tax Structure!
Approximate Slope = -18.1 " per g/km (French Feebate)!
-2.3 " per g/km (German Ann Gas Tax)!
-3.2 " per g/km (German Ann Dsl Tax)!
28 Best Practices for Feebate Program Design and Implementation

As with Ireland, it is unclear to what extent consumers recognize the implications of the annual components of the German price signal in their initial purchase decisions and, by extension, to what extent manufacturers consider such signals in their technology decision-making. It is also likely (as was the case with the French and Irish programs) that the overall potential of the German signals is muted by the fact that manufacturer decision-making is likely to be controlled by overall EU requirements. As with other EU programs, the impact of the German program will increase as it or similar programs expand to cover a wider fraction of the EU fleet.28
There is also the interesting question of which is more effective, the annual circulation tax or the vehicle purchase tax. Unfortunately, evaluation of this question is beyond the scope of this report, but it could be an interesting area for further research.
As is the case with all EU countries, there are significant fuel taxes that are also in effect in Germany, so that existing U.S. fuel taxes serve no purpose in comparison to the German CO2 price signal. Fuel taxes in Germany are €0.6545 and €0.4704 per liter (about $3.30 and $2.35 per gallon) for gasoline and diesel fuel respectively, plus an additional 19 percent VAT that is applied to both the pre-tax fuel price and the fuel tax itself. This compares with a typical fuel tax in the U.S. (federal plus state) of about $0.45-$0.50 per gallon.
Note also the large difference in diesel and gasoline fuel taxes in Germany, as well as most other countries in the EU. This has contributed to the rise in market share for diesel vehicles in the EU, as it gives consumers access to the cheaper diesel fuel. The success of diesel vehicles in Europe may not translate to the U.S., given the very different tax structures and the preferences for different fuels.
Finally, it is also worth noting that vehicle taxes in Europe are already very high compared to the carbon costs being contemplated in other economic sectors.
FIGURE 11. NEW VEHICLE EQUIVALENT LIFETIME GERMAN TAX STRUCTURE
-12,000!
-10,000!
-8,000!
-6,000!
-4,000!
-2,000!
0!
2,000!
4,000!
6,000!
0! 50! 100! 150! 200! 250! 300! 350! 400!
Reb
ate
(") !
CO2 (g/km - EU Cycle)!
French Fee Structure!
Approximate French Slope!
German Lifetime Gasoline Tax Structure!
German Lifetime Diesel Tax Structure!
Approximate Slope = -18.1 " per g/km (French Feebate)!
-21.3 " per g/km (German Lifetime Gasoline)!
-29.5 " per g/km (German Lifetime Diesel)!
28It should be noted that the German passenger vehicle market is the largest within the EU, with a 21% market share and with many manufacturers developing and producing new vehicle models there. Therefore the German car market tends to have a significant impact on other markets in the EU.
29 Worldwide Efforts to Develop Feebate and Feebate-Like Incentive Programs

U.S. GAS GUZZLER TAX
Various federal feebate bills have been introduced in the U.S. over the years, including a bill recently introduced by Senator Bingaman,29 but none has been adopted. The U.S. has implemented limited tax credits for certain vehicles, but these credits have generally been based on specific technology (e.g., hybrid-electric vehicles) rather than fuel efficiency per se.
The U.S. does administer an existing gas guzzler statute requiring that manufacturers of passenger cars achieving a CAFE mpg of less than 22.5 pay a fee that varies with the magnitude of deviation from 22.5 mpg. Each passenger car sold is subject to the fee, but all light trucks are exempt. The statute has been in effect since the 1980 vehicle model year and produces millions of dollars in revenue. It has had little effect on vehicle sales, as almost all high volume vehicles are designed to avoid the tax, but it has led to substantial amounts of technology being added to vehicles that are close to threshold of the tax. For example, the Chevrolet Corvette has never been subject to the gas guzzler tax, as General Motors has always added technology to keep it just above the threshold.
The gas guzzler tax is essentially equivalent to the fee half of a feebate program. In addition, the “carbon value” associated with its structure is quite significant, so that the program might serve as an effective foundation upon which to construct a more complete feebate program. It is, therefore, worth looking at the gas guzzler tax structure in a bit of detail.
Figure 12 depicts both the current (1991 and later) tax structure and the structure that was imposed upon implementation of the program with the 1980 model year. For consistency with the preceding EU charts, Figure 12 presents the gas guzzler tax structure in units of euros per EU cycle gCO2/km. A graphic depiction of the structure in its adopted U.S. units is included in Appendix A as Figure A15. Both the range of coverage and the implicit carbon value of the tax
29Senator Bingaman introduced a Feebate bill in the U.S. Senate in August 2009 that included a number of good features. The proposed system included continuous incentives, provided for changing the pivot point as national fuel economy standards increase, and was based on gallons/mile (fuel consumption), not miles per gallon (fuel economy). However, the system also includes a credit multiplier that varies based upon specified efficiency categories, that has the effect of creating several step-functions in the fee and rebate system.
FIGURE 12. BASIC U.S. GAS GUZZLER TAX DESIGN
$0!
$1,000!
$2,000!
$3,000!
$4,000!
$5,000!
$6,000!
$7,000!
0! 100! 200! 300! 400! 500! 600!
Tax ("
)!
CO2 (g/km - EU Cycle)!
1980 Tax Structure!
1991 and Later Tax Structure!
CAFE Standard (through 2010)!
Approximate Slope = -18.3 " per g/km (1991 and Later)! -3.2 " per g/km (1980)!
30 Best Practices for Feebate Program Design and Implementation

(as indicated by the slope of the tax structure) have increased over time.30 The carbon value has increased from about €3.2 to about €18.3 per gCO2/km liter EU cycle ($300 to nearly $1,700 per gallon consumed per 100 miles US cycle), which equates to a carbon tax increase from about €13 to €76 per tonne of CO2 EU cycle ($21 to $116 per ton of CO2 US cycle), or a gasoline tax increase from about €0.03 to €0.18 per liter EU cycle ($0.20 to $1.13 per gallon US cycle) – the current value of which compares quite favorably with the carbon price signal of the French feebate program (as discussed above), although the vehicles covered are completely different. Figure 13 graphically compares the structures of the two programs (and for interested readers, a graphic depiction of these relationships in equivalent U.S. units is included in Appendix A as Figures A16).
The “weakness” of the gas guzzler program is not the magnitude of the price signal, but rather the fact that it is imposed on only a small fraction of the vehicle fleet. As indicated above, light trucks are entirely exempted, but even cars are taxed only if their fuel economy is more than 5 mpg below the current CAFE standard of 27.5 mpg. Thus, the vast majority of passenger cars are effectively exempted as well. While the tax certainly provides an incentive for manufacturers to improve the fuel economy performance of such vehicles, the program generally imposes its price signal only on expensive luxury and performance cars for which the tax is a relatively small percentage of the vehicle price. For example, the $4,500 gas guzzler tax on the Ferrari Scaglietti F1 is less than 1.5 percent of the $319,000 manufacturer’s suggested retail price. The tax has become simply “part of the cost of doing business in the market segment.”
Figure 14 depicts estimates for the fraction of passenger car sales subject to the gas guzzler tax. The estimates are depicted as a range since data on the actual average tax collected per vehicle are not readily available. However, data for total tax collections is available, as presented in Figure 15, and the minimum and maximum taxes per vehicle are defined by the gas guzzler tax structure. Thus, bounding estimates based on all subject vehicles paying either the minimum or maximum tax can be derived. As shown in Figure 14, such estimates indicate that only between 0.3 and 2.6 percent of passenger cars sales (along with zero percent of light truck sales) are subject to the tax.
FIGURE 13. U.S. GAS GUZZLER TAX DESIGN COMPARED TO FRENCH FEEBATE
-8,000!
-6,000!
-4,000!
-2,000!
0!
2,000!
4,000!
6,000!
0! 100! 200! 300! 400! 500! 600!
Reb
ate
(")!
CO2 (g/km - EU Cycle)!
French-Equivalent Fee Structure!
Approximate French Fee Slope!
U.S. Gas Guzzler Tax Structure!
Approximate U.S. Gas Guzzler Tax Slope!
Approximate Slope = -18.1 " per g/km (France),!
-18.3 " per g/km (U.S. Gas Guzzler)!
30 Specifically in a series of annual program revisions implemented with the 1981-1986 model years, followed by a final (to date) revision implemented with the 1991 model year.
31 Worldwide Efforts to Develop Feebate and Feebate-Like Incentive Programs

Somewhat disturbingly, the fraction of vehicle sales subject to the tax appears to be increasing since the late 1990s, following a probable downward trend in gas guzzler sales between 1991 (the model year in which the current tax rates first took effect) and 1998. While it is not possible to draw any definitive conclusions due to the range-nature of the subject vehicle estimates, it is interesting to note that while there were 36 vehicle configurations subject to the tax in model year 1998, there were 92 in model year 2006, and at least 98 in model year 2009.31 It seems clear that sales in the gas guzzler segment have been rising, a trend that signals the increasing presence of consumer preferences for luxury and high performance vehicles.
Despite its weaknesses, the gas guzzler program could serve as a basis for phasing in a full fledged feebate program. Extending the program at its current carbon value across the full range of available passenger cars and light trucks would immediately impose a very significant carbon price signal on the U.S. market. However, to ensure fiscal viability as well as to
FIGURE 14. ESTIMATE OF THE FRACTION OF CARS TAXED AS GAS GUZZLERS
0.0%!
0.5%!
1.0%!
1.5%!
2.0%!
2.5%!
3.0%!
3.5%!
1980! 1985! 1990! 1995! 2000! 2005! 2010!
Fra
ctio
n o
f P
asseng
er
Car
Sale
s T
axed!
Assuming All Guzzlers Pay Minimum Tax!
Assuming All Guzzlers Pay Maximum Tax!
FIGURE 15. MAGNITUDE OF GAS GUZZLER TAX COLLECTED ANNUALLY
0!
50!
100!
150!
200!
250!
300!
1980! 1985! 1990! 1995! 2000! 2005! 2010!
Gas G
uzzle
r Tax C
olle
cte
d (m
illio
ns)!
Current Year Dollars!
Constant 2006 Dollars!
31It is not generally possible to assume any definitive relationship between numbers of configurations and sales volume. Nevertheless, the directional relationship between the two (with regard to the phenomena discussed here) is obvious.
32 Best Practices for Feebate Program Design and Implementation
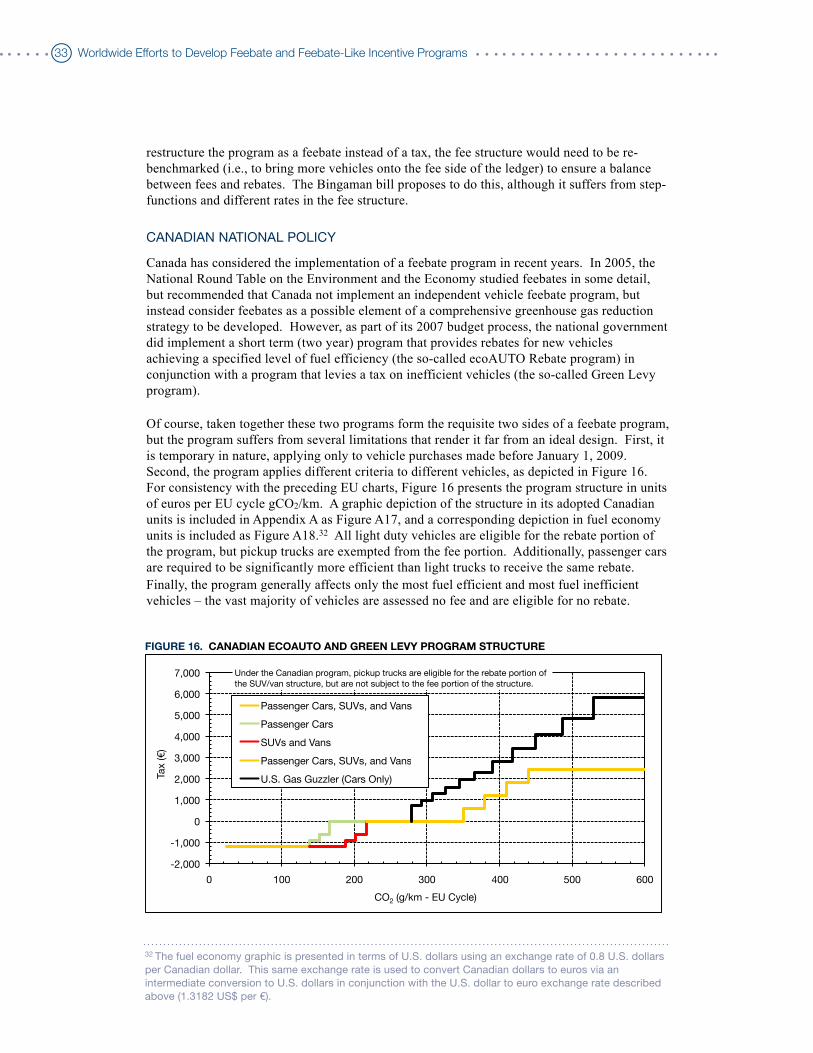
restructure the program as a feebate instead of a tax, the fee structure would need to be re-benchmarked (i.e., to bring more vehicles onto the fee side of the ledger) to ensure a balance between fees and rebates. The Bingaman bill proposes to do this, although it suffers from step-functions and different rates in the fee structure.
CANADIAN NATIONAL POLICY
Canada has considered the implementation of a feebate program in recent years. In 2005, the National Round Table on the Environment and the Economy studied feebates in some detail, but recommended that Canada not implement an independent vehicle feebate program, but instead consider feebates as a possible element of a comprehensive greenhouse gas reduction strategy to be developed. However, as part of its 2007 budget process, the national government did implement a short term (two year) program that provides rebates for new vehicles achieving a specified level of fuel efficiency (the so-called ecoAUTO Rebate program) in conjunction with a program that levies a tax on inefficient vehicles (the so-called Green Levy program).
Of course, taken together these two programs form the requisite two sides of a feebate program, but the program suffers from several limitations that render it far from an ideal design. First, it is temporary in nature, applying only to vehicle purchases made before January 1, 2009. Second, the program applies different criteria to different vehicles, as depicted in Figure 16. For consistency with the preceding EU charts, Figure 16 presents the program structure in units of euros per EU cycle gCO2/km. A graphic depiction of the structure in its adopted Canadian units is included in Appendix A as Figure A17, and a corresponding depiction in fuel economy units is included as Figure A18.32 All light duty vehicles are eligible for the rebate portion of the program, but pickup trucks are exempted from the fee portion. Additionally, passenger cars are required to be significantly more efficient than light trucks to receive the same rebate. Finally, the program generally affects only the most fuel efficient and most fuel inefficient vehicles – the vast majority of vehicles are assessed no fee and are eligible for no rebate.
32 The fuel economy graphic is presented in terms of U.S. dollars using an exchange rate of 0.8 U.S. dollars per Canadian dollar. This same exchange rate is used to convert Canadian dollars to euros via an intermediate conversion to U.S. dollars in conjunction with the U.S. dollar to euro exchange rate described above (1.3182 US$ per €).
FIGURE 16. CANADIAN ECOAUTO AND GREEN LEVY PROGRAM STRUCTURE
-2,000!
-1,000!
0!
1,000!
2,000!
3,000!
4,000!
5,000!
6,000!
7,000!
0! 100! 200! 300! 400! 500! 600!
Tax (") !
CO2 (g/km - EU Cycle)!
Passenger Cars, SUVs, and Vans!
Passenger Cars!
SUVs and Vans!
Passenger Cars, SUVs, and Vans 2!
U.S. Gas Guzzler (Cars Only)!
Under the Canadian program, pickup trucks are eligible for the rebate portion of
the SUV/van structure, but are not subject to the fee portion of the structure.!
33 Worldwide Efforts to Develop Feebate and Feebate-Like Incentive Programs

For comparative purposes, the structure of the U.S. gas guzzler program is also depicted in Figure 16, illustrating the rather limited applicability of the tax portions of the Canadian program. As indicated, the U.S. program applies a tax to a wider range of vehicles -- affecting vehicles with CO2 emissions greater than about 278 gasoline equivalent g/km EU cycle versus about 350 gasoline equivalent g/km EU cycle under the Canadian program (equivalent to a fuel economy of less than 22.5 mpg for the U.S. program versus about 18.2 mpg under the Canadian program). Additionally, the gas guzzler tax is generally about twice as large as the Canadian tax for similar emitting vehicles. However, it should also be recognized that the U.S. program only applies to passenger cars, while the Canadian program also includes SUVs and vans. The slopes of the U.S. and Canadian structures are similar, with the U.S. program exhibiting a slope of about €18.3 per gCO2/km liter EU cycle as compared to about €20.1 per gCO2/km liter EU cycle for the Canadian program ($1,699 per gallon consumed per 100 miles US cycle for the U.S. program as compared to about $1,882 per gallon consumed per 100 miles US cycle for the Canadian program) -- with each affecting only a small subset of vehicles.
Figure 16 also shows that only passenger cars with CO2 emissions less than about 166 gasoline equivalent g/km EU cycle (about 36.2 mpg US cycle) and light trucks with CO2 emissions less than about 216 gasoline equivalent g/km EU cycle (about 28.3 mpg US cycle) are eligible for a rebate. In model year 2008, this included only 15 passenger car configurations and 14 light truck configurations. The majority of vehicles -- passenger cars between 166 and 278 gasoline equivalent g/km EU cycle (18.2 and 36.2 mpg US cycle) and light trucks between 216 and 278 gasoline equivalent g/km EU cycle (18.2 and 28.3 mpg US cycle) – were assessed no fee and were eligible for no rebate. So while the Canadian program, like the U.S. gas guzzler program could serve as a basis for phasing in a full fledged feebate program, the scope of the program would need to be extended across the full range of available passenger cars and light trucks.
From a practical standpoint, the Canadian program did illustrate the effectiveness of incentives on manufacturers. The rebate cut point was set such that the 2007 Toyota Yaris received a rebate, but the 2007 Honda Fit missed the cutoff by a few tenths of a mpg. While it is not possible to redesign a vehicle to add technology within a year, Honda made some quick changes to reduce the performance of the vehicle slightly – just enough for the 2008 Fit to qualify for the rebate. This also illustrates why a continuous feebate function is preferable, as cut points (reflected as step changes in a feebate function) cause manufacturers to design vehicles to just barely exceed the threshold and no more.
ONTARIO, CANADA TAX FOR FUEL CONSERVATION
Ontario, Canada has administered a new vehicle “Tax for Fuel Conservation” since 1992, which is often cited as an example of a functioning feebate program. However, this program suffers from many of the same issues that limit the effectiveness of the U.S. gas guzzler tax. On the plus side, the Ontario program does apply to SUVs as well as passenger cars, and does offer small rebates to certain passenger cars.
Figure 17 depicts the design parameters of the Ontario program. For consistency with the preceding EU charts, Figure 17 presents the program structure in units of euros per EU cycle gCO2/km. Unlike the U.S. gas guzzler tax and CAFE, which are based on unadjusted test values, the Ontario program is based on adjusted highway fuel consumption (as measured in Canada in units of liters per 100 kilometers). Although Canada utilizes the same CAFE test procedures as the U.S., adjusted fuel consumption estimates are increased to better reflect real world fuel consumption. In Canada, the highway fuel consumption adjustment factor is 1.1765 (1/0.85).33 On an effective stringency basis, the adjusted highway program metric is generally within about 10 percent of an unadjusted combined (city/highway) CAFE program metric such
34 Best Practices for Feebate Program Design and Implementation

as that of the U.S. gas guzzler tax.34 For these reasons, Figure 17 represents an approximation of the Ontario program in units equivalent to those used in the EU charts above.35 A graphic depiction of the structure in its adopted units is included in Appendix A as Figure A19, and a corresponding depiction in fuel economy units is included as Figure A20.
As indicated, there are differing fee schedules for passenger cars and SUVs, with SUV fees for high fuel consumption vehicles generally being lower than those of passenger cars with the same fuel consumption by 50 percent or more (the fees for the two vehicle types are the same or similar at or below about 275 gasoline equivalent g/km composite EU cycle or above about 25 adjusted highway miles per U.S. gallon, as depicted in Figure 17). Pickup trucks and vans are not covered by the tax. In model year 2008, such vehicles represented about 13% of the light duty vehicle configurations (not sales) certified for sale in Canada.
Of the passenger cars and SUVs covered by the tax, fully 71% of the vehicle configurations (not sales) certified for sale in Canada were subject to no tax (5%), a tax of C$75 (62%), or a rebate of C$100 (4%). If the exempted pickup trucks and vans are included as zero tax vehicles, this percentage increases to 75% of all light duty vehicle configurations. The complete distribution of tax assessments for model year 2008 vehicles is presented in Figure 18. As indicated, only about 9% of configurations are subject to a tax exceeding C$500. Thus,
FIGURE 17. DESIGN OF ONTARIO TAX FOR FUEL CONSERVATION
-500!
0!
500!
1,000!
1,500!
2,000!
2,500!
3,000!
3,500!
4,000!
4,500!
0! 100! 200! 300! 400! 500! 600!
Tax (") !
CO2 (g/km - EU Cycle)!
Passenger Vehicles!
SUVs!
33 The adjustment factor is different than the highway adjustment of 1.2821 (1/0.78) used in the U.S. through vehicle model year 2007 for the adjusted highway fuel economy value displayed on a vehicle’s fuel economy label.34Unadjusted highway fuel consumption is generally on the order of about 78 percent of unadjusted combined fuel consumption, so that adjusted highway fuel consumption is about 0.78 × 1.18, or 92 percent of unadjusted combined fuel consumption. Viewed in the inverse, the adjusted Ontario highway fuel economy is generally about 8.5 percent higher than unadjusted combined (city/highway) Canadian and U.S. fuel economy.35 To produce the depicted statistics, Canadian dollars were converted to U.S. dollars at an exchange rate of 0.8 U.S. dollars per Canadian dollar and subsequently converted to euros using an exchange rate of 1.3182 US$ per €. Adjusted highway fuel consumption was converted to unadjusted CAFE fuel consumption using a factor of 0.9227 (unadjusted CAFE = adjusted Canadian highway × 0.9227), derived as described in the preceding discussion. Conversion of CAFE fuel consumption to EU-equivalent CO2 emissions is based on the test cycle relations described above in the discussion associated with the French feebate program.
35 Worldwide Efforts to Develop Feebate and Feebate-Like Incentive Programs

like the U.S. gas guzzler tax, the overwhelming majority of vehicles are exempted or subject to a relatively flat tax (totally flat at $0 in the U.S., and varying from $60 to -$80 in Canada).
Even for the very high fuel consumption vehicles that are subject to the more stringent tax levels of the program, the Ontario structure has a relatively modest slope when compared to either the French feebate or U.S. gas guzzler structure. Figure 19 depicts the approximate slope of the Ontario program fee structures alongside those of the French feebate program and U.S. gas guzzler programs. For interested readers, a corresponding graphic in equivalent U.S. units is presented in Appendix A as Figure A21.36 The Ontario passenger car slope is about 50% lower than that of the French program, while the slope for the SUV structure is only about 20% of the French program slope.
FIGURE 18. ONTARIO TAX FOR FUEL CONSERVATION FOR 2008 MODELS
3%
!
18%
!
55%
!
3%
!
3%
! 9%
!
1%
! 6%
!
0%
!
2%
!
0%
!
0%!
10%!
20%!
30%!
40%!
50%!
60%!
70%!
80%!
90%!
-$100! $0! $75! $200! $250! $400! $800! $1,200! $1,600! $2,400! $4,400!
Fra
ctio
n o
f V
ehic
le C
onfig
ura
tio
ns.!
Tax for Fuel Conservation (Canadian $)!
Passenger Cars!
SUVs!
Passenger Cars & SUVs!
All Light Duty Vehicles!
36To produce the depicted statistics, Canadian dollars were converted to U.S. dollars at an exchange rate of 0.8 U.S. dollars per Canadian dollar and adjusted highway fuel consumption was converted to unadjusted CAFE fuel consumption using a factor of 0.9227 (unadjusted CAFE = adjusted Canadian highway × 0.9227), derived as described in the preceding discussion. The conversions for the French program (i.e., € to US$ and EU CO2 emission rate to CAFE fuel economy) are described in the discussion of the French feebate program.
FIGURE 19. ONTARIO TAX STRUCTURE COMPARED TO FRENCH FEEBATE
-8,000!
-6,000!
-4,000!
-2,000!
0!
2,000!
4,000!
6,000!
0! 100! 200! 300! 400! 500! 600!
Reb
ate
(")!
CO2 (g/km - EU Cycle)!
U.S. Gas Guzzler Tax Structure!
French-Equivalent Fee Structure!
Approximate French Fee Slope!
Ontario PC Fee Structure!
Approximate Ontario PC Fee Slope!
Ontario SUV Fee Structure!
Approximate Ontario SUV Fee Slope!
Approximate Slope = -18.1 " per g/km (France),!
-9.1 " per g/km (Ontario Passenger Car)!
-3.2 " per g/km (Ontario SUV)!
36 Best Practices for Feebate Program Design and Implementation

In total, the Ontario program suffers from: (1) a limited range of coverage, (2) differing price signals for vehicles that are covered (as reflected in the differing slopes of the tax structures for passenger cars and SUVs), and (3) price signals that are substantially lower than the French feebate program (which covers all vehicles) and the U.S. gas guzzler program (which covers only a small fraction of vehicles). Like the U.S. gas guzzler program, the Ontario program could serve as the basis for a robust feebate program, but several adjustments would be required to alleviate the described issues.
NEW CALIFORNIA FEEBATE STUDY
Finally, it important to note that California is currently conducting a detailed feebate study in response a provision of California Assembly Bill AB32, which requires the state to implement alternative provisions that will provide emission reductions equal to or greater than the state’s adopted greenhouse gas emission standards for light duty vehicles, if those standards are not allowed to take effect. The study is expected to evaluate feebates as both a potential alternative and a potential supplement to the greenhouse gas standards, and is expected to be completed in 2010. Preliminary results suggests immediate additional emissions reduction of approximately 5% for a California-only feebate and 15% for a nationwide feebate. Feebates can significantly increase the market success of advanced technology vehicles (such as hybrids) over and above the effect of fuel economy standards once the technology becomes cost effective.37 Figure 20 depicts the proposed study tasks and their interrelationships (as defined by the proposed study contractor team). Given the primacy of California in U.S. motor vehicle greenhouse gas emission reduction efforts, the study will provide significant insights into the effects of adding feebates to existing efficiency standards.
FIGURE 20. CALIFORNIA 2009 FEEBATE STUDY TASKS
37 Greene, D.L., presentation on "Fiscal Incentives for GHG Mitigation: Feebates", March 8, 2010. http://www.theicct.org/documents/0000/1414/Greene_ORNL_Feebates.pdf
37 Worldwide Efforts to Develop Feebate and Feebate-Like Incentive Programs

BEST PRACTICES FOR FEEBATE DESIGN
In conclusion, the important components for an effective and sustainable feebate system are:• A continuous and linear feebate rate line, without any breaks or discontinuities. This
provides a consistent incentive to improve efficiency of all vehicles and creates a fixed, known, long-term value for reductions in CO2 emissions and fuel consumption.
• Balance of fees and rebates with adjustments in the pivot point over time as vehicle efficiency improves to make the system self-funding. Systems that do not adjust the pivot point, including systems that are all fees or all rebates, do not have a stable revenue stream and are not sustainable.
• A system that treats all vehicles equitably, without any attribute adjustments. If an attribute adjustment is adopted it should be based on vehicle size, not weight or some other attribute. Vehicle size adjustments preserve incentives for weight and performance reduction and minimize the loss in program effectiveness.
• A linear metric, such as CO2 emissions or fuel consumption (liters/km). Non-linear metrics, such as MPG, create different incentives for different types of vehicles and lead to less cost-effective investments by manufacturers and consumers.
RECOMMENDATIONS
Adoption of feebate programs has been negatively affected by a number of misconceptions about how the program works. Thus, it is important to understand and emphasize the following points whenever feebates are discussed:
• Most of the impact of a feebate system is a longer-term manufacturer response. Feebates pay manufacturers to install more efficiency technology and bring advanced technologies to market. Feebates also influence customer purchase decisions, but this effect is generally an order of magnitude smaller than the manufacturer effect.
• The effectiveness of a feebate program is determined solely by the feebate rate. The steeper the rate, the more manufacturers are paid to introduce efficiency technology and customers are paid to buy more efficient vehicles.
• Discontinuities and step functions always reduce the effectiveness of a feebate system.
• The pivot point has almost no impact on the effectiveness of the program. It has no impact at all on how much manufacturers are paid to introduce new technology. It might have some impact on customers, but this is a small percent of a small portion of the overall impact. The role of the pivot point is simply to balance fees and rebates. This is important for the long-term sustainability of the program, but not for decreasing CO2 emissions and fuel consumption.
• A feebate program is a “transfer”, not a “tax”. Those who choose to buy higher CO2 emitting vehicles pay fees, which are used to give rebates to those who buy lower emitting vehicles.
38 Best Practices for Feebate Program Design and Implementation

APPENDIX A SUPPLEMENTAL FIGURES
FIGURE A1. FRENCH FEEBATE DESIGN IN U.S. FUEL CONSUMPTION UNITS
-8,000!
-6,000!
-4,000!
-2,000!
0!
2,000!
4,000!
6,000!
8,000!
0! 1! 2! 3! 4! 5! 6! 7!
Reb
ate
(U
S$) .!
Fuel Consumption (gasoline equivalent gal/100 miles - US Cycle)!
French-Equivalent Fee Structure!
Approximate Fee Slope!
Approximate Slope = -1554 $ per gal/100mi!
FIGURE A2. FRENCH FEEBATE DESIGN IN U.S. CO2 EMISSIONS UNITS
-8,000!
-6,000!
-4,000!
-2,000!
0!
2,000!
4,000!
6,000!
8,000!
0! 100! 200! 300! 400! 500! 600!
Reb
ate
(U
S$)!
Equivalent CO2 (g/mi - US Cycle)!
French-Equivalent Fee Structure!
Approximate Fee Slope!
Approximate Slope = -17.6 $ per g/mi!
FIGURE A3. FRENCH FEEBATE DESIGN IN U.S. FUEL ECONOMY UNITS
-4,000!
-2,000!
0!
2,000!
4,000!
6,000!
8,000!
10! 20! 30! 40! 50! 60! 70! 80! 90! 100!
Reb
ate
(U
S$) .!
Fuel Economy (gasoline equivalent mpg - US Cycle)!
French-Equivalent Fee Structure!
39 Appendix A

FIGURE A4. RELATIONSHIP BETWEEN FUEL ECONOMY AND CO2 EMISSIONS
10!
20!
30!
40!
50!
60!
70!
80!
90!
100!
0! 100! 200! 300! 400! 500! 600!
Fuel E
co
no
my (m
pg
) !
Gasoline-Equivalent CO2 (g/mi)!
FIGURE A5. AVERAGE IRISH NEW VEHICLE REGISTRATION TAX IN U.S. UNITS
-20,000!
-15,000!
-10,000!
-5,000!
0!
5,000!
10,000!
0! 1! 2! 3! 4! 5! 6! 7!
Reb
ate
(U
S$
) !
Fuel Consumption (gasoline equivalent gal/100 miles - US Cycle)!
French-Equivalent Fee Structure!
Approximate French Slope!
Irish-Equivalent Tax Structure!
Approximate Irish Slope!
Approximate Slope = -1554 $ per gal/100mi (French Feebate)! -7604 $ per gal/100mi (Irish Vehicle Purchase Tax)!
FIGURE A6. AVERAGE IRISH NEW VEHICLE TAX IN FUEL ECONOMY UNITS
-20,000!
-15,000!
-10,000!
-5,000!
0!
5,000!
10,000!
10! 20! 30! 40! 50! 60! 70! 80! 90! 100!
Reb
ate
(U
S$
) !
Fuel Economy (gasoline equivalent mpg - US Cycle)!
French-Equivalent Fee Structure!
Irish-Equivalent Tax Structure!
40 Best Practices for Feebate Program Design and Implementation

FIGURE A7. IRISH ANNUAL VEHICLE REGISTRATION TAX IN U.S. UNITS
-8,000!
-6,000!
-4,000!
-2,000!
0!
2,000!
4,000!
6,000!
8,000!
0! 1! 2! 3! 4! 5! 6! 7!
Reb
ate
(U
S$) !
Fuel Consumption (gasoline equivalent gal/100 miles - US Cycle)!
French-Equivalent Fee Structure!
Approximate French Slope!
Irish-Equivalent Tax Structure!
Approximate Irish Slope!
Approximate Slope = -1554 $ per gal/100mi (French Feebate)! -1008 $ per gal/100mi (Irish Annual Tax)!
FIGURE A8. IRISH ANNUAL VEHICLE TAX IN FUEL ECONOMY UNITS
-4,000!
-2,000!
0!
2,000!
4,000!
6,000!
8,000!
10! 20! 30! 40! 50! 60! 70! 80! 90! 100!
Reb
ate
(U
S$
)!
Fuel Economy (gasoline equivalent mpg - US Cycle)!
French-Equivalent Fee Structure!
Irish-Equivalent Tax Structure!
FIGURE A9. NEW VEHICLE EQUIVALENT IRISH TAX STRUCTURE IN U.S. UNITS
-60,000!
-50,000!
-40,000!
-30,000!
-20,000!
-10,000!
0!
10,000!
20,000!
30,000!
0! 1! 2! 3! 4! 5! 6! 7!
Reb
ate
(U
S$) !
Fuel Consumption (gasoline equivalent gal/100 miles - US Cycle)!
French-Equivalent Fee Structure!
Approximate French Slope!
Irish-Equivalent Discounted Lifetime Tax Structure!
Approximate Irish Slope!
Approximate Slope = -1,554 $ per gal/100mi (French Feebate)! -15,981 $ per gal/100mi (Irish Lifetime Tax)!
41 Appendix A
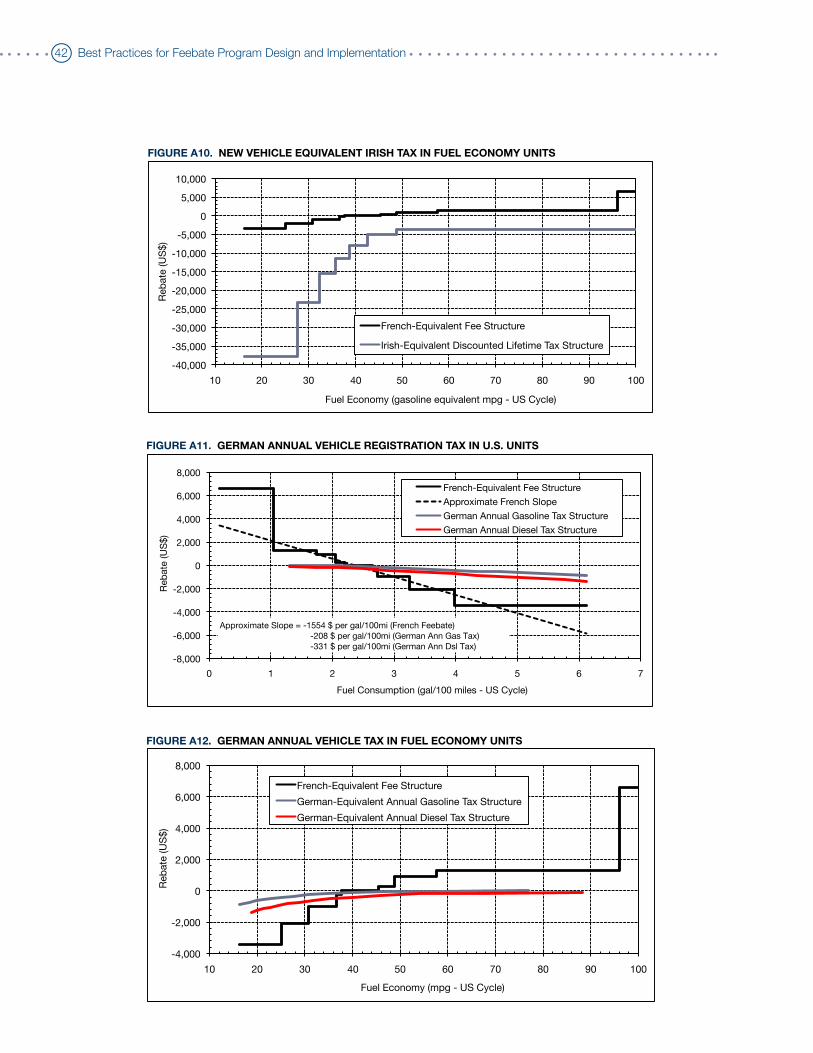
FIGURE A10. NEW VEHICLE EQUIVALENT IRISH TAX IN FUEL ECONOMY UNITS
-40,000!
-35,000!
-30,000!
-25,000!
-20,000!
-15,000!
-10,000!
-5,000!
0!
5,000!
10,000!
10! 20! 30! 40! 50! 60! 70! 80! 90! 100!
Reb
ate
(U
S$) !
Fuel Economy (gasoline equivalent mpg - US Cycle)!
French-Equivalent Fee Structure!
Irish-Equivalent Discounted Lifetime Tax Structure!
FIGURE A11. GERMAN ANNUAL VEHICLE REGISTRATION TAX IN U.S. UNITS
-8,000!
-6,000!
-4,000!
-2,000!
0!
2,000!
4,000!
6,000!
8,000!
0! 1! 2! 3! 4! 5! 6! 7!
Reb
ate
(U
S$
) !
Fuel Consumption (gal/100 miles - US Cycle)!
French-Equivalent Fee Structure!
Approximate French Slope!
German Annual Gasoline Tax Structure!
German Annual Diesel Tax Structure!
Approximate Slope = -1554 $ per gal/100mi (French Feebate)! -208 $ per gal/100mi (German Ann Gas Tax)! -331 $ per gal/100mi (German Ann Dsl Tax)!
FIGURE A12. GERMAN ANNUAL VEHICLE TAX IN FUEL ECONOMY UNITS
-4,000!
-2,000!
0!
2,000!
4,000!
6,000!
8,000!
10! 20! 30! 40! 50! 60! 70! 80! 90! 100!
Reb
ate
(U
S$) !
Fuel Economy (mpg - US Cycle)!
French-Equivalent Fee Structure!
German-Equivalent Annual Gasoline Tax Structure!
German-Equivalent Annual Diesel Tax Structure!
42 Best Practices for Feebate Program Design and Implementation

FIGURE A14. NEW VEHICLE EQUIVALENT GERMAN TAX IN FUEL ECONOMY UNITS
-15,000!
-10,000!
-5,000!
0!
5,000!
10,000!
10! 20! 30! 40! 50! 60! 70! 80! 90! 100!
Reb
ate
(U
S$) !
Fuel Economy (mpg - US Cycle)!
French-Equivalent Fee Structure!
German-Equivalent Lifetime Gasoline Tax Structure!
German-Equivalent Lifetime Diesel Tax Structure!
FIGURE A13. NEW VEHICLE EQUIVALENT GERMAN TAX STRUCTURE IN U.S. UNITS
-15,000!
-10,000!
-5,000!
0!
5,000!
10,000!
0! 1! 2! 3! 4! 5! 6! 7!
Reb
ate
(U
S$) !
Fuel Consumption (gal/100 miles - US Cycle)!
French-Equivalent Fee Structure!
Approximate French Slope!
German Lifetime Gasoline Tax Structure!
German Lifetime Diesel Tax Structure!
Approximate Slope = -1554 $ per gal/100mi (French Feebate)! -1940 $ per gal/100mi (German Lifetime Gasoline)! -3084 $ per gal/100mi (German Lifetime Diesel)!
FIGURE A15. BASIC U.S. GAS GUZZLER TAX DESIGN IN U.S. UNITS
$0!
$1,000!
$2,000!
$3,000!
$4,000!
$5,000!
$6,000!
$7,000!
$8,000!
$9,000!
0! 5! 10! 15! 20! 25! 30! 35! 40! 45! 50!
Tax !
CAFE Combined Fuel Economy (mpg)!
1980 Tax Structure!
1991 and Later Tax Structure!
CAFE Standard (through 2010)!
Approximate Slope = -1699 $ per gal/100mi (1991 and Later)! -306 $ per gal/100mi (1980)!
43 Appendix A
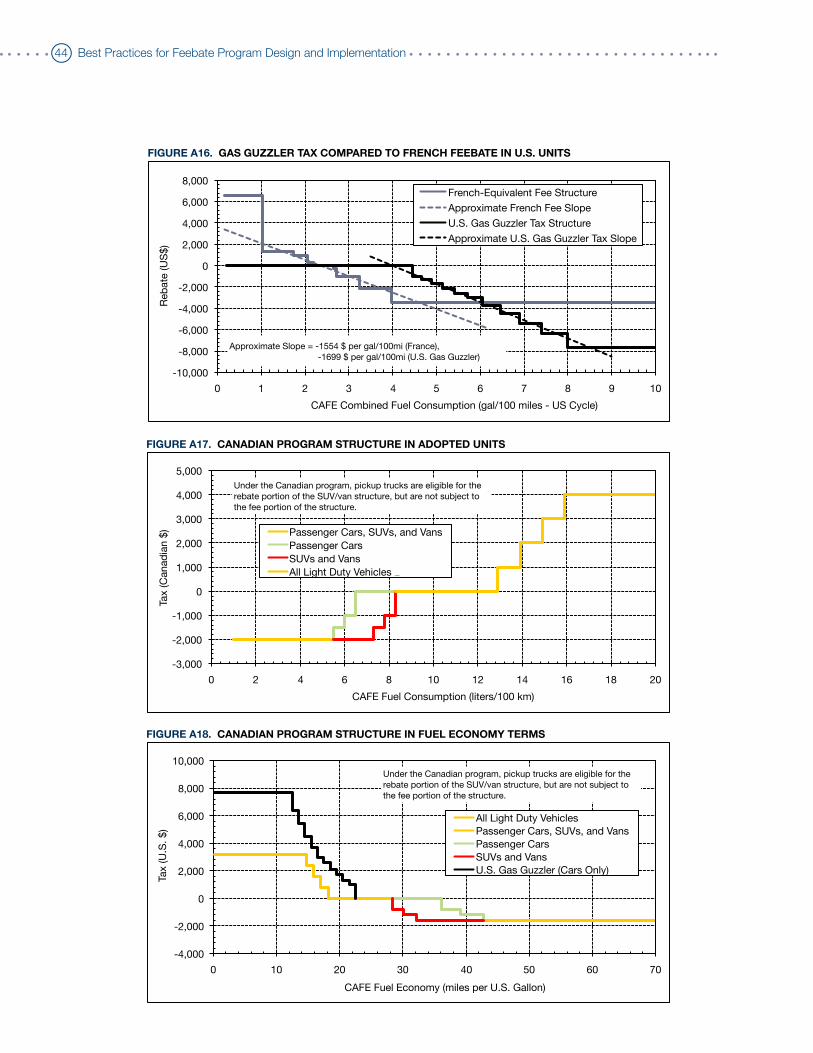
FIGURE A17. CANADIAN PROGRAM STRUCTURE IN ADOPTED UNITS
-3,000!
-2,000!
-1,000!
0!
1,000!
2,000!
3,000!
4,000!
5,000!
0! 2! 4! 6! 8! 10! 12! 14! 16! 18! 20!
Tax (C
anad
ian $
) !
CAFE Fuel Consumption (liters/100 km)!
Passenger Cars, SUVs, and Vans!
Passenger Cars!
SUVs and Vans!
All Light Duty Vehicles 2!
Under the Canadian program, pickup trucks are eligible for the rebate portion of the SUV/van structure, but are not subject to the fee portion of the structure.!
FIGURE A16. GAS GUZZLER TAX COMPARED TO FRENCH FEEBATE IN U.S. UNITS
-10,000!
-8,000!
-6,000!
-4,000!
-2,000!
0!
2,000!
4,000!
6,000!
8,000!
0! 1! 2! 3! 4! 5! 6! 7! 8! 9! 10!
Reb
ate
(U
S$) !
CAFE Combined Fuel Consumption (gal/100 miles - US Cycle)!
French-Equivalent Fee Structure!
Approximate French Fee Slope!
U.S. Gas Guzzler Tax Structure!
Approximate U.S. Gas Guzzler Tax Slope!
Approximate Slope = -1554 $ per gal/100mi (France),! -1699 $ per gal/100mi (U.S. Gas Guzzler)!
FIGURE A18. CANADIAN PROGRAM STRUCTURE IN FUEL ECONOMY TERMS
-4,000!
-2,000!
0!
2,000!
4,000!
6,000!
8,000!
10,000!
0! 10! 20! 30! 40! 50! 60! 70!
Tax (U
.S. $)!
CAFE Fuel Economy (miles per U.S. Gallon)!
All Light Duty Vehicles!Passenger Cars, SUVs, and Vans!Passenger Cars!SUVs and Vans!U.S. Gas Guzzler (Cars Only)!
Under the Canadian program, pickup trucks are eligible for the rebate portion of the SUV/van structure, but are not subject to the fee portion of the structure.!
44 Best Practices for Feebate Program Design and Implementation

FIGURE A20. ONTARIO TAX STRUCTURE IN FUEL ECONOMY TERMS
-1,000!
0!
1,000!
2,000!
3,000!
4,000!
5,000!
6,000!
7,000!
8,000!
0! 10! 20! 30! 40! 50! 60! 70!
Tax (C
anad
ian $
) !
Adjusted Highway Fuel Economy (miles per U.S. Gallon)!
Passenger Vehicles!
SUVs!
FIGURE A19. ONTARIO TAX STRUCTURE IN ADOPTED UNITS
-1,000!
0!
1,000!
2,000!
3,000!
4,000!
5,000!
6,000!
7,000!
8,000!
0! 2! 4! 6! 8! 10! 12! 14! 16! 18! 20!
Tax (C
anad
ian $
)!
Adjusted Highway Fuel Consumption (liters/100 km)!
Passenger Vehicles!
SUVs!
FIGURE A21. ONTARIO PROGRAM COMPARED TO FRENCH FEEBATE IN U.S. UNITS
-10,000!
-8,000!
-6,000!
-4,000!
-2,000!
0!
2,000!
4,000!
6,000!
8,000!
0! 1! 2! 3! 4! 5! 6! 7! 8! 9! 10!
Reb
ate
(U
S$) !
Unadjusted Composite Fuel Consumption (U.S. gal/100 miles - US Cycle)!
U.S. Gas Guzzler Tax Structure!French-Equivalent Fee Structure!Approximate French Fee Slope!Ontario PC Fee Structure!Approximate Ontario PC Fee Slope!Ontario SUV Fee Structure!Approximate Ontario SUV Fee Slope!
Approximate Slope = -1554 $ per gal/100mi (France),! -833 $ per gal/100mi (Ontario PC),! -293 $ per gal/100mi (Ontario SUV)!
45 Appendix A

REFERENCES
Davis, W.B., Levine, M.D., Train, K., and Duleep, K.G., “Energy Efficiency in the U.S. Economy, Technical Report Two, Effects of Feebates on Vehicle Fuel Economy, Carbon Dioxide Emissions, and Consumer Surplus,” DOE/PO0031, U.S. Department of Energy, February 1995.
“Global Review and Comparison of Fiscal Policies that Influence Passenger Vehicle CO2 Emissions,” The International Council on Clean Transportation (ICCT), May 2010.
Greene, D.L., presentation on “Fiscal Incentives for GHG Mitigation: Feebates”, March 8, 2010. http://www.theicct.org/documents/0000/1414/Greene_ORNL_Feebates.pdf
Greene, D.L., German, J., and Delucchi, M., “Fuel Economy: The Case for Market Failure”. Reducing Climate Impacts in the Transportation Sector. D. Sperling and J. Cannon, Springer Press, 2008.
Greene, D.L., Patterson, P.D., Singh, M., and Li, J., “Feebates, rebates and gas-guzzler taxes: a study of incentives for increased fuel economy,” Energy Policy, Volume 33, Issue 6, Pages 757–775, April 2005.
House of Commons Environmental Audit Committee, “Vehicle Excise Duty as environmental tax – Tenth report of session 2007-08”.
“Passenger Vehicle Greenhouse Gas and Fuel Economy Standards: A Global Update,” The International Council of Clean Transportation (ICCT), July 2007 (see “Appendix: Methodology for Adjusting Standards”).
46 Best Practices for Feebate Program Design and Implementation


San Francisco One Post Street, Suite 2700 San Francisco, California 94104 USA +1 (415) 399-9019
Washington DC 1225 Eye Street NW, Suite 900 Washington, District of Columbia 20005 USA +1 (202) 534-1600
www.theicct.org