best practice sampling methods, assay techniques, … · best practice sampling methods, assay...
TRANSCRIPT
Introduction
The exploration and exploitation of platinumgroup element (PGE) deposits is extremelychallenging due to the very low ore grades,which can approach the detection limits of theassay techniques, as well as factors such asthe significant nugget effect. This emphasizesthe need for a good understanding of thegeology of the deposits and the reef mineral-ization in order to choose appropriateexploration techniques, and the application ofindustry standard sampling and assaytechniques when developing these projects ormines.
The foundation of mineral resourceestimation is a geological model and validdata. The data that form the basis of anestimate includes geological logs, boreholecollar positions, downhole surveys, and assaydata. Where underground data is utilized, facesampling data would be used and would havethe same characteristics as drilling data i.e.
position of the cut, the associated geology, andthe assay data. The data is interpreted andused to develop a geological model. The rawdata is examined, various statistical analysisundertaken to understand it, and possiblerelationships between the assay data and thegeology considered before being incorporatedinto a mineral resource estimation. Thisestimate relies on the well-establishedunderstanding of the geology and therecognition of the economic horizons,continuity of the mineralization, controls onthe mineralization, and ore genesis.
A mineral resource estimate for a PGEdeposit has many aspects in common withother deposits, but also has its own uniqueaspects. Notably the estimate relies on thedetermination of a mineralization zone ormining cut because the grade is dispersedvertically across a number of horizontallystacked stratigraphic units and lithologies.Thus the determination of the marginal gradecut-off and the optimization of the mining cutmust be considered in the light of ’the realisticexpectation of eventual economic extraction’(SAMREC, 2009). This constitutes an integralstep towards the mineral resource estimate andis informed by the methodology and protocolof the sampling. Inappropriate sampling couldproduce a poor mineral resource estimateresult.
Introduction to the geology of PGEdeposits of southern Africa
PGE-dominated deposits occur in large layeredintrusions, such as the Bushveld Complex(South Africa), the Stillwater Complex (USA),and the Great Dyke (Zimbabwe).
Best practice sampling methods, assaytechniques, and quality control with referenceto the platinum group elements (PGEs)by K. Lomberg*
SynopsisIn this paper the process of sampling and assaying as it relates inparticular to the platinum group elements (PGEs) is presented. Adiscussion of the geology of PGE deposits is included to provide anunderstanding of the mineralization that is considered necessaryprior to sampling, as this has a direct bearing on the mineral resourceestimate and also the selection of an appropriate mining cut. Thediscussion includes the selection of the sampling technique (drillingor face sampling), the size of the sample relating to the requirementsof the laboratory, the potential mining cut, as well as a reference tosampling theory. The selection of an assay technique that isappropriate and will yield the optimal result based on sampleturnaround, precision, accuracy, and cost is then considered.Examples are drawn from work undertaken on the Bushveld Complex(Merensky Reef, UG2 Chromitite Layer, Platreef) and Great Dyke(Main Sulphide Zone). A discussion of the appropriate QA/QCprogramme includes the chain of custody, CRM selection and theQA/QC process.
Keywordssampling, assaying, QA/QC, platinum group elements.
* Coffey Mining SA Pty Ltd.© The Southern African Institute of Mining and
Metallurgy, 2014. ISSN 2225-6253. This paperwas first presented at the, Sampling and analysis:Best-practice in African mining Conference, 4–6 June 2013, Misty Hills Country Hotel andConference Centre, Cradle of Humankind,Muldersdrift, South Africa.
53The Journal of The Southern African Institute of Mining and Metallurgy VOLUME 114 JANUARY 2014 ▲

Best practice sampling methods, assay techniques, and quality control
Bushveld Complex
The mafic rocks of the Critical Zone of the Bushveld Complexhost layers rich in PGEs, chromium, and vanadium, andconstitute the world’s largest known resource of these metals. The Merensky Reef, which is developed near the topof the Critical Zone (Figure 1), can be traced along strike for280 km and is estimated to contain 60 000 t of PGEs to adepth of 1 200 m below surface. The pyroxenitic Platreefmineralization north of Mokopane contains a wide zone ofmore disseminated style platinum mineralization, along withhigher grades of nickel and copper than those occuring in therest of the Bushveld Complex.
The Critical Zone also hosts all the chromitite layers of theBushveld Complex, up to 14 of which have been identified.The most important of the chromite cycles for PGE mineral-ization is the upper unit, the UG2 Chromitite Layer, whichaverages 1 m in thickness.
PGE mineralizationThe Merensky Reef has historically been the most importantAu, PGE (Pt, Pd, Rh, Ru, Os and Ir) and base metal (Cu andNi) producing layer in the Bushveld Complex. The MerenskyReef varies considerably in its nature, but can be broadlydefined as a mineralized zone within, or closely associatedwith, the ultramafic cumulate at the base of the Merenskycyclic unit.
In addition to the PGE mineralization associated with theMerensky Reef, all chromitites in the Critical Zone at timescontain elevated concentrations of PGEs. The UG2 ChromititeLayer is the only chromitite layer that is significantlyexploited for PGEs at present.
Merensky ReefThe Merensky Reef is typically a feldspathic pegmatoidalpyroxenite, bounded top and bottom by thin chromititelayers. The chromite layers have variable thicknesses up tosome 5 cm with one being generally thinner or absent. Thepegmatoidal feldspathic pyroxenite (pegmatoid) containsinterstitial subhedral pyrrhotite and chalcopyrite blebs. Thepegmatoid consists of cumulus bronzite crystals, typically10–20 mm in diameter. The plagioclase feldspar is interstitial.
The immediate hangingwall is a feldspathic pyroxenite(bronzite) typically 1–2.25 m thick, which grades upwardsinto a norite. Phenocysts of diopside (±20 mm) are presentwithin the feldspathic pyroxenite. The hangingwall typicallycontains sulphides (pyrrhotite and chalcopyrite) for some 50 cm from its basal contact with the Merensky Reef. Thefootwall characteristics are variable because of the variousnoritic, anorthositic, and harzburgitic footwall lithologies.
The grade profile is concentrated around the pegmatoidalfeldspathic pyroxenite with the highest PGE concentrationassociated with the chromitites (Figure 2). The grade is notrestricted to a single lithology or to a stratigraphic unit but isdispersed over a number of units, although typically centredaround the chromitites and pegmatoidal felspathic pyroxeniteof the Merensky Reef. The rocks immediately adjacent to thepegmatoidal pyroxenite are mineralized with PGEs. The tenortypically decreases further from the chromitite stringers andpegmatoidal pyroxenites.
Sulphide mineralization extends into both the immediatehangingwall and footwall. In some cases the PGE mineral-
ization characteristics of the Merensky Reef can be correlatedwith the nature of the footwall. For instance, where thefootwall is noritic, the PGE mineralization does not typicallyextend more than a few centimetres into the footwall,whereas when the footwall is an anorthosite, fine-grainedsulphides with good PGE mineralization are frequentlypresent for approximately 40 cm and more erratically to abouta metre below the lower chromite layer. The PGEsencountered in this horizon are predominantly PGE-ironalloys and PGE-sulphides. A number of schematic gradeprofiles are presented in Figure 2.
The importance of the sampling protocol applied is todefine the grade profile from which a mining cut can beinterpolated.
UG2 Chromitite Layer
The UG2 Chromitite Layer typically consists of a basalpegmatoidal feldspathic pyroxenite (up to 0.5 m thick) whichfrequently contains chromite stringers and which is overlainby the Main Chromite Layer (30–140 cm thick). A middlingpyroxenite of a few centimetres to 6 m separates the MainChromite Layer from the alternating chromitite andpyroxenite layers commonly referred to as the leaders ortriplets.
The PGEs are associated with sulphides that areinterstitial to the chromite grains. The mineralized zone itselfis defined by the sharp basal contact with the footwallpyroxenite and the sharp contact at the top of the mainchromitite layer. The grade profile typically peaks at the baseand top contacts (Figure 3).
▲
54 JANUARY 2014 VOLUME 114 The Journal of The Southern African Institute of Mining and Metallurgy
Figure 1—Generalized stratigraphic column of the Rustenburg LayeredSuite, Bushveld Complex
after Viljoen and Schürmann, 1998

The mineralization is generally associated with the MainChromitite Layer. However, the mining method generallyrequires mining of the leaders as the lack of cohesionbetween the chromitite and pyroxenite typically results infalls of ground, which are both dangerous and also dilute themining cut. A pragmatic approach is to mine the overlyingleaders at the same time. The sampling protocol allows thedetermination of the grade profile for the mining package andprovides important information on which strategic miningdecisions are made.
PlatreefIn the Northern Limb, the Platreef occurs proximal to the
basal contact of the Bushveld Complex with the country rock,typically as a thicker zone (up to 30 m wide) containingdisseminated sulphides and mineralized (Figure 4). Wherethe Bushveld Complex is in contact with the Archaean graniteand sediments of the Transvaal Supergroup floor rocks, thePlatreef is developed. The contact between the RustenburgLayered Suite and footwall rocks in the northern limb istransgressive, with the Platreef in contact with progressivelyolder rocks of different lithologies from south to north.
The Platreef is a series of pyroxenites and norites,containing xenoliths/rafts of footwall rocks. It is irregularlymineralized with PGEs, Cu, and Ni. The Platreef (sensostricto) has a strike extent of some 30 km, whereas Platreef-
Best practice sampling methods, assay techniques, and quality control
55The Journal of The Southern African Institute of Mining and Metallurgy VOLUME 114 JANUARY 2014 ▲
Figure 2—Schematic grade histograms of the Merensky Reef
Figure 3—Schematic grade histograms of the UG2 Chromitite Layer (courtesy of Anglo Platinum Corporation Limited)

Best practice sampling methods, assay techniques, and quality control
style mineralization occurs over the 110 km strike length ofthe northern limb (Kinnaird et al., 2005). The Platreef variesfrom 400 m thick in the south of the northern limb to <50 min the north. The overall strike is NW or N, with dips 40–45°to the W at surface with the dip becoming shallower down-dip. The overall geometry of the southern Platreef appears tohave been controlled by irregular floor topography.
Similar to the Merensky Reef, the importance of thesampling protocol applied is to define the grade profile fromwhich a mining cut can be interpolated (Figure 4).
The Great Dyke
The significant mineralized zone of The Great Dyke is theMain Sulphide Zone (MSZ). The Dyke is divided verticallyinto an ultramafic sequence, dominated from the baseupwards by cyclic repetitions of dunite, harzburgite, andpyroxenite, as well as an upper mafic sequence consistingmainly of gabbro and gabbronorite (Wilson and Prendergast,1989; Prendergast and Wilson, 1989).
Contained within the ultramafic sequence is the P1pyroxenite, directly below the mafic-ultramafic contact. TheP1 pyroxenite in turn hosts economically exploitablequantities of PGEs in the MSZ, which is generally 10 to 50 mfrom the top of the ultramafic sequence.
The MSZ is a lithologically continuous layer, typicallybetween 2 m and 3 m thick, that forms an elongated basin. It generally contains iron-nickel-copper sulphides, whileelevated PGE concentrations occur towards its base (Figure 5). Peak values for the PGEs and base metals arecommonly offset, while the ratio between platinum andpalladium also varies vertically. It is often difficult to visuallyidentify mineralization in the MSZ. As a result, the identifi-cation of the MSZ is reliant on the identification of thegeochemical signature and the identification of the base ofthe MSZ (BMSZ). This point can be identified by lookingdown the sequence for where the sulphide mineralizationceases. The geochemistry reflects this with sudden drops insulphur and associated base metal mineralization.
The optimal mineralized part of the MSZ is very difficultto identify. Therefore the application of a suitable protocol tothe sampling can allow the identification of the MSZ and theinterpolation of the optimal mining cut.
History of sampling and grade control
The protocols currently considered industry standard arebased on the work done by a number of geologists workingfor the two major mining houses – Anglo Platinum andImpala Holdings – during the last 50 years. Considering thatuntil the early 1980s very little information was disseminatedby JCI and Gencor, the companies that predated AngloPlatinum and Impala, the methodologies developed wereremarkably similar. The current best practice guideline isvirtually the same with variations in sample length,numbering, and assay technique being the most significantdifferences.
The practices have been developed with both mining andexploration in mind. On the operating mines, the mining cutinstruction requires that the mining cut for the MerenskyReef be determined. This is based on the sampling of the
▲
56 JANUARY 2014 VOLUME 114 The Journal of The Southern African Institute of Mining and Metallurgy
Figure 4—Typical geochemical traces of the Merensky Reef
Source: Wilson and Chunnett, 2006
Figure 5—Schematic geochemical profiles of the MSZ
Source: Brown (2008)

underground excavations. The determination of the miningcut for the UG2 Chromitite Layer is not required as themining cut is typically defined based on the lithology ratherthan the grade alone. An additional criterion is thegeotechnical analysis of the hangingwall. The final miningcut therefore considers the grade, metal content, and thegeotechnical aspects of the chromite layers in thehangingwall. These are sampled as they are grade-bearing,albeit lower than the main chromitite layer, and areassociated with a weak hangingwall due to the lack ofcoherence between the pyroxenite and chromite. Thisgeotechnical phenomenon is generally unsafe and as a resultthe layers of leader chromitites are mined together with themain chromitite layer. However, in the project phase thedetails of the grades of these leaders need to be understoodprior to the application of the mining factors.
Mineralogy
Merensky Reef
The PGE mineralogy is associated with the base metalsulphide mineralogy. These sulphides, which constitute about1-5% of the rock, consist of pyrrhotite (FeS1-x) (40%),pentlandite ((Fe,Ni)9S8) (30%), and chalcopyrite (CuFeS2)(15%). In addition, trace amounts of millerite (NiS), troilite(FeS), pyrite (FeS2), and cubanite (Cu5FeS4) are also present.The major platinum group minerals (PGMs) are cooperite(PtS), braggite ((Pt,Pd)NiS), sperrylite (PtAS2), and PGEalloys, although in some areas minerals such as laurite(RuS2) can be abundant (Schouwstra et al., 2000). On theWestern Bushveld Joint Venture (WBJV) nearly 40% of thetotal PGMs are sulphides larger than 1000 μm2 in size(Muller, 2010)
UG2 Chromitite Layer
The UG2 Chromitite Layer consists predominantly of chromite(60–90% by volume) with lesser silicate minerals (5–30%pyroxene and 1–10% plagioclase) (Schouwstra et al., 2000).Other minerals present in minor concentrations includephlogopite and biotite, ilmenite, rutile, magnetite, and basemetal sulphides. The PGMs present in the UG2 ChromititeLayer are characterized by the presence of abundant PGEsulphides, They consist predominantly of laurite (RuOsIr),cooperite (PtS), braggite (Pt, Pd, NiS), and an unnamedPtRhCuS. The PGMs reach an average size of only approxi-mately 12 μm, with particles larger than 30 μm beingextremely rare (Schouwstra et al., 2000). They occur inassociation with the base metal sulphides and silicates. Onlythe mineral laurite exhibits a preferred association with thechromite grains.
Platreef
The major PGMs consist of PGE tellurides, platinumarsenides, and platinum sulphides (Schouwstra et al., 2000).There appears to be a link between the rock type and the typeof PGMs, with serpentinites being characterized by a relativeenrichment in sperrylite (PtAs2), and the upper pyroxenitesbeing characterized by more abundant PGE sulphides andalloy. PGE alloys generally dominate mineralization closer tothe floor rocks (Schouwstra et al., 2000). Common basemetal sulphides include pyrrhotite, pentlandite, chalcopyrite,
and pyrite, and with the PGMs frequently occurring enclosedin or on grain boundaries of these base metal sulphides(Schouwstra et al., 2000).
Main Sulphide Zone
The MSZ contains between 0.5% and 10% sulphides,represented mainly by pyrrhotite, pentlandite, andchalcopyrite in about equal proportions, as well assubordinate pyrite. The PGMs are typically included inpyrrhotite or chalcopyrite, sometimes in pentlandite, or theymay occur at sulphide/sulphide or sulphide/silicate contacts,or within silicates. PGMs intergrown with pyrite areextremely rare. The suite of PGMs found in the MSZ includes(Pt,Pd)-bismuthotellurides (50.1%), sperrylite (19.0%),cooperite/braggite (8.5%), the PGE-sulpharsenides holling-worthite (RhAsS), platarsite (PtAsS), irarsite (IrAsS), andruarsite (RuAsS) (11.9%), laurite (RuS2) (5.0%), Pt–Fe alloy(2.4%), as well as some less common PGMs (Oberthur et al.,2012). Grain sizes range from < 5 to 50 μm in general, butmay reach up to 480 μm in the longest dimension (Oberthuret al., 2012).
Sampling methodology
Borehole core
The sampling protocol is determined by the requirement ofthe sampling. The sample sizes and intervals must beappropriate for the deposit and the grain size of the materialbeing sampled as well as the intention of the samplingprogramme. The need to provide standard ’support’, in ageostatistical sense, needs to be considered when designing asampling programme, especially as compositing based onsample length can be expected in the estimation. Equalizingsample length is not the only criterion for standardizingsample support. Factors such as angle of intersection of thesampling to mineralization, sample type, borehole diameter,drilling conditions, recovery, sampling/sub-samplingpractices, and laboratory practices all affect the ‘support’ ofthe sample. Typically sampling is undertaken to support amineral resource estimate or to define an optimal mining cut.
Sampling is generally undertaken on half core with asample size of 15–25 cm in length from BQ (36.4 mmdiameter) or NQ (47.63 mm diameter) core. The taking ofsamples of varying length is unavoidable due the nature ofthe intersections and the variability of the mineralizedstratigraphy or lithology. Sample lengths of up to a metre aregenerally used to confirm the lack of mineralization oroccasionally to sample a complete lithological unit.
The sampling procedure begins with the drilling of thecore. Complete core recovery over the sampling zone isrequired. This is not always possible as a result of the naturalfractures in the core. Recovery of over 95% is generallyacceptable and should form part of the commercial agreementwith the drilling contractor. The core must be transportedfrom the rig site to the core yard. It is imperative that coresamples are not unduly damaged during transit. The chain ofcustody should be properly documented
At the core yard, the core should be checked and markedaccording to the drill depths. Thereafter the core must belogged according to industry logging standards. The logsshould include descriptions of the lithotype, major and minor
Best practice sampling methods, assay techniques, and quality control
The Journal of The Southern African Institute of Mining and Metallurgy VOLUME 114 JANUARY 2014 57 ▲

Best practice sampling methods, assay techniques, and quality control
fractures (including infilling), and the presence of sulphidemineralization (including the prominent sulphide mineraltypes). The logging detail should be at the level required forthis type of mineralization. Once the core is logged, thesampling protocol is applied and the samples marked out.
Samples should be taken so that they are justified to themajor lithological contacts with on average an overlap of 2 cmof material being taken in the footwall and hangingwall ofeconomic zones or mining cut. The exact sample size andfrequency must take cognisance of suitable geochemical andgeological knowledge of the deposit and mineralized horizon.A number of samples are taken into the footwall andhangingwall of economic zones or mining cut as the grade isdistributed into the hangingwall and footwall. Sample breaksare made on the basis of geology, and where possible, naturalbreaks in the core are used to separate samples if they areapproximately perpendicular to the core axis.
The core is then split along its length through the lowpoint of the contact dip using a diamond saw, by anappropriately trained assistant, in preparation for bagging.Half core samples are cut to length, and half of the core isthen bagged and sealed with its sample number ticket bothinside the bag and attached to the outside. There is a debateas to whether natural breaks be used in preference to cutbreaks. The debate includes consideration for the loss ofmaterial when cut or the understanding that differentsamples lengths constitute different support whenundertaking a mineral resource estimate. The remaining halfcore should be suitably marked and kept in the core tray forfuture reference (Figure 6). Heavy-duty plastic sample bagsmust be used, and these should be discarded by thelaboratory after sample preparation. Sample bags must not bere-used. Once properly labelled, sealed, and documented thesamples can be dispatched to the laboratory.
Once the sampling has been completed, it is advisable tophotograph the core while both wet and dry. This should bemandatory when whole sampling is necessary. Core shouldbe retained to allow comparison of the assay data with thegeology, for other geological studies (density, magneticsusceptibility, structural etc), for additional sampling (1/4core), and as a record of the drilling. This is invaluable as itallows consideration for aspects of the mineralization thatneed to be understood and communicated to the miningengineers and process engineers.
Sampling of the Merensky Reef
For the Merensky Reef, the potential mining cut as well asthe amount of hangingwall or footwall in the cut needs to bedetermined. Sampling is extended from well above to wellbelow the reef in order to completely close off the mineral-ization. The smaller the sample length the better definitioncan be made, as the result is that the effective decision-making is being made at the edge of the mining cut wherethe grade is lowest and closet to the detection limit.
The Merensky Reef is measured from just above theupper chromitite stringer to just below the lower chromititestringer. The interval is then divided into even samples ofapproximately 20 cm in length; although individual samplethickness may range from 15 cm to 25 cm. All chromiteassociated with the upper and lower chromitite stringers isincluded in the top and bottom samples of the Merensky
Reef. The sample interval is frequently widened further awayfrom the Merensky Reef proper.
Sampling of the UG2 Chromitite Layer
Sampling of the UG2 Chromitite Layer is dependent on thecharacter of the reef encountered. The reef is measured fromthe top chromitite contact (top of leader) to the base of themain chromitite layer and divided into fairly even sampleintervals of approximately 20 cm (again these may rangefrom 15 cm to 25 cm). Where a leader layer is present, it istreated as a separate sample if the leader and pyroxeniteparting are of suitable thicknesses – approximately 15 cmeach. If the leader and parting are thin, they are includedtogether in a single sample. A parting will therefore either besampled separately or included with the leader, and is neverincluded with the main chromitite layer. Where additionalpyroxenite lenses are developed in the UG2 Chromitite Layer,these are sampled separately if of significant thickness (>15cm). Finely disseminated chromite grains and chromititestringers in the immediate footwall to the main chromititelayer should be included with the basal sample (these oftencarry extremely high grades). Sampling is extended well intothe footwall of the UG2 Chromitite Layer.
A comparison undertaken by Platinum Australia (S.Hunns, personal communication) on the UG2 ChromititeLayer showed that there was little difference in the grade overthe stratigraphic unit. The advantage of this approach is thatit provides the grade directly and the overall cost will be lessbecause fewer assays are required. However, where someoptimization or decision-making with respect to the cut ismade, the use of smaller sample intervals is best.
Sampling of the Platreef
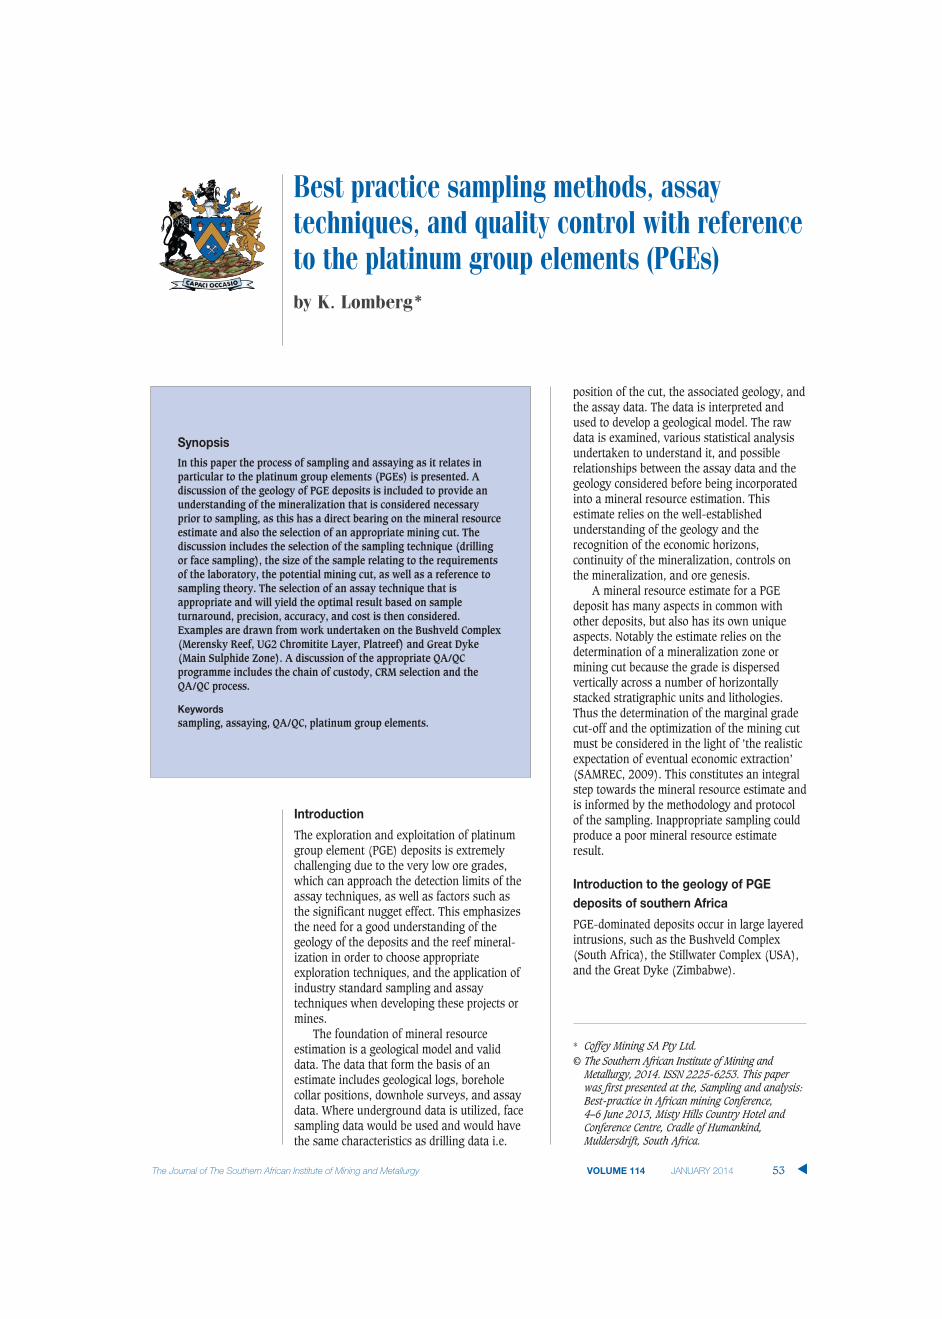
The grade profile of the Platreef may be difficult to determine(Figure 7). As a result, sampling tends to be extensive toidentify the mineralized horizon and allow for the optimalmining cut.
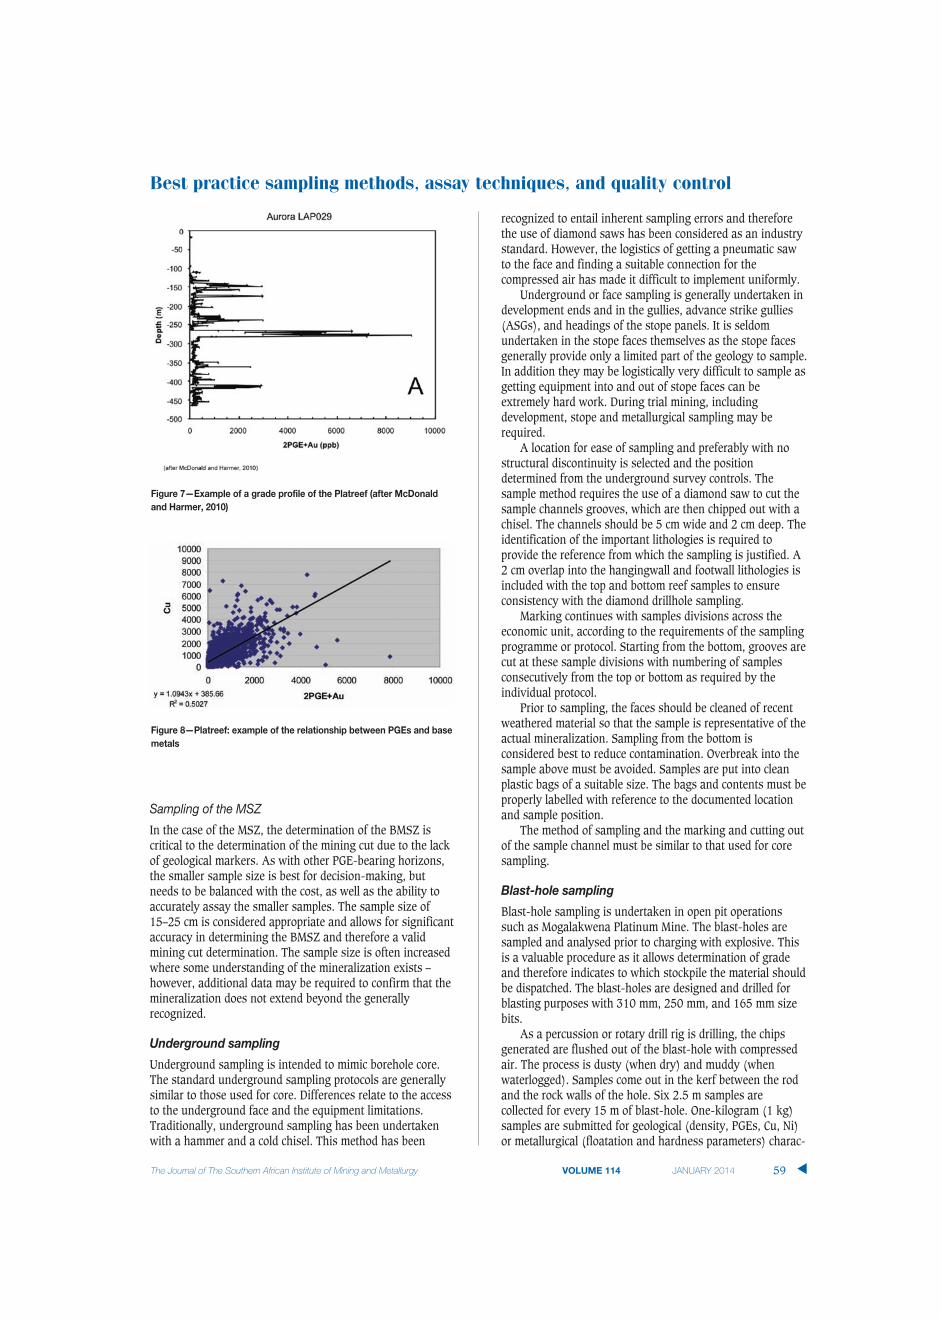
A common way to assist and to try and keep assay costsdown is to use an indicator element. Commonly the basemetals (Cu or Ni) are used. However, this correlation,although understood academically, needs to be proven ordemonstrated before being used (Figure 8).
▲
58 JANUARY 2014 VOLUME 114 The Journal of The Southern African Institute of Mining and Metallurgy
Figure 6—Photograph of wet core with samples marked out on core
(Source: Kameni Platinum Holdings Ltd)
Sampling of the MSZ
In the case of the MSZ, the determination of the BMSZ iscritical to the determination of the mining cut due to the lackof geological markers. As with other PGE-bearing horizons,the smaller sample size is best for decision-making, butneeds to be balanced with the cost, as well as the ability toaccurately assay the smaller samples. The sample size of15–25 cm is considered appropriate and allows for significantaccuracy in determining the BMSZ and therefore a validmining cut determination. The sample size is often increasedwhere some understanding of the mineralization exists –however, additional data may be required to confirm that themineralization does not extend beyond the generallyrecognized.
Underground sampling
Underground sampling is intended to mimic borehole core.The standard underground sampling protocols are generallysimilar to those used for core. Differences relate to the accessto the underground face and the equipment limitations.Traditionally, underground sampling has been undertakenwith a hammer and a cold chisel. This method has been
recognized to entail inherent sampling errors and thereforethe use of diamond saws has been considered as an industrystandard. However, the logistics of getting a pneumatic sawto the face and finding a suitable connection for thecompressed air has made it difficult to implement uniformly.
Underground or face sampling is generally undertaken indevelopment ends and in the gullies, advance strike gullies(ASGs), and headings of the stope panels. It is seldomundertaken in the stope faces themselves as the stope facesgenerally provide only a limited part of the geology to sample.In addition they may be logistically very difficult to sample asgetting equipment into and out of stope faces can beextremely hard work. During trial mining, includingdevelopment, stope and metallurgical sampling may berequired.
A location for ease of sampling and preferably with nostructural discontinuity is selected and the positiondetermined from the underground survey controls. Thesample method requires the use of a diamond saw to cut thesample channels grooves, which are then chipped out with achisel. The channels should be 5 cm wide and 2 cm deep. Theidentification of the important lithologies is required toprovide the reference from which the sampling is justified. A2 cm overlap into the hangingwall and footwall lithologies isincluded with the top and bottom reef samples to ensureconsistency with the diamond drillhole sampling.
Marking continues with samples divisions across theeconomic unit, according to the requirements of the samplingprogramme or protocol. Starting from the bottom, grooves arecut at these sample divisions with numbering of samplesconsecutively from the top or bottom as required by theindividual protocol.
Prior to sampling, the faces should be cleaned of recentweathered material so that the sample is representative of theactual mineralization. Sampling from the bottom isconsidered best to reduce contamination. Overbreak into thesample above must be avoided. Samples are put into cleanplastic bags of a suitable size. The bags and contents must beproperly labelled with reference to the documented locationand sample position.
The method of sampling and the marking and cutting outof the sample channel must be similar to that used for coresampling.
Blast-hole sampling
Blast-hole sampling is undertaken in open pit operationssuch as Mogalakwena Platinum Mine. The blast-holes aresampled and analysed prior to charging with explosive. Thisis a valuable procedure as it allows determination of gradeand therefore indicates to which stockpile the material shouldbe dispatched. The blast-holes are designed and drilled forblasting purposes with 310 mm, 250 mm, and 165 mm sizebits.
As a percussion or rotary drill rig is drilling, the chipsgenerated are flushed out of the blast-hole with compressedair. The process is dusty (when dry) and muddy (whenwaterlogged). Samples come out in the kerf between the rodand the rock walls of the hole. Six 2.5 m samples arecollected for every 15 m of blast-hole. One-kilogram (1 kg)samples are submitted for geological (density, PGEs, Cu, Ni)or metallurgical (floatation and hardness parameters) charac-
Best practice sampling methods, assay techniques, and quality control
The Journal of The Southern African Institute of Mining and Metallurgy VOLUME 114 JANUARY 2014 59 ▲
Figure 7—Example of a grade profile of the Platreef (after McDonaldand Harmer, 2010)
Figure 8—Platreef: example of the relationship between PGEs and basemetals
Best practice sampling methods, assay techniques, and quality control
terization. These results are used to determine the nature ofthe direct feed and/or stockpiling destinations for the blastedmuck.
In the last couple of years, Mogalakwena has beenreplacing blast-hole drilling with reverse circulation (RC)drilling. Beyond 2013, all production sampling atMogalakwena will be from RC drilling. RC drilling involvesusing a sampling rig to drill for samples independent of blast-holes and thus entails an extra cost.
RC drilling involves blowing chips from the bit face andtransporting them through the centre of the rods (in an innertube) and out to a sampling unit on the side of the rig. Thesampling unit is a basically a series of cyclones to settle thechips and dust before dropping them down an auto-splittersystem. RC drilling samples are always dry as the designallows compressed air to hold back the water even inwaterlogged situations.
The quality of samples with the RC drilling method(minimum contamination, minimum human interference, andautomatic splitting) justifies the extra drilling cost whencompared to blast-hole sampling. RC sampling also goesbeyond just one bench (15 m) although the 2.5 m samplinginterval is maintained
RC drilling is significantly faster (time) than and costssignificantly less than diamond drilling. Diamond drilling isstill used for exploration drilling only.
Sample size
The weight of the sample should be 230–420 g (BQ core) or410–710 g (NQ core). The weight is important as it relates tothe applicability of sampling theory as well as the practicalrequirements of the laboratory and the specified analyticaltechnique. The recommendation is always to utilize as muchsample as possible for fire assay and hence wherever possiblea 50 g aliquot is recommended. Other duplicates are requiredas well as backup pulp samples in case issues occur with theassay or as a requirement for duplicate analysis of everysample.
An aspect to be considered is the ’nugget effect’.Geostatistical theory assumes that there should be nodifference between a sampled value and a potential repeatsample at the same location (Clark, 2010). Included in thevariation of the grade between contiguous samples areaspects of the mineralization, geological features, grain size,etc. as well as any ‘random’ sampling variation that mightoccur due to the method by which the sample was taken, theadequacy of the sample size, the assaying process, etc.Platinum deposits typically have high nuggets effects i.e. twosamples taken close to each other are likely to have differentPGE concentrations, probably due to the very small grain sizeof the platiniferous mineral, the random distribution of thesulphide mineralization in the host rocks, and the lowconcentration of the precious metals. The normal approach tounderstanding the level of the nugget effect is to ensuresufficient sampling. The sampling protocols adopted routinelyin the industry have over time been demonstrated not tointroduce a bias or influence in relation to the nugget effect.
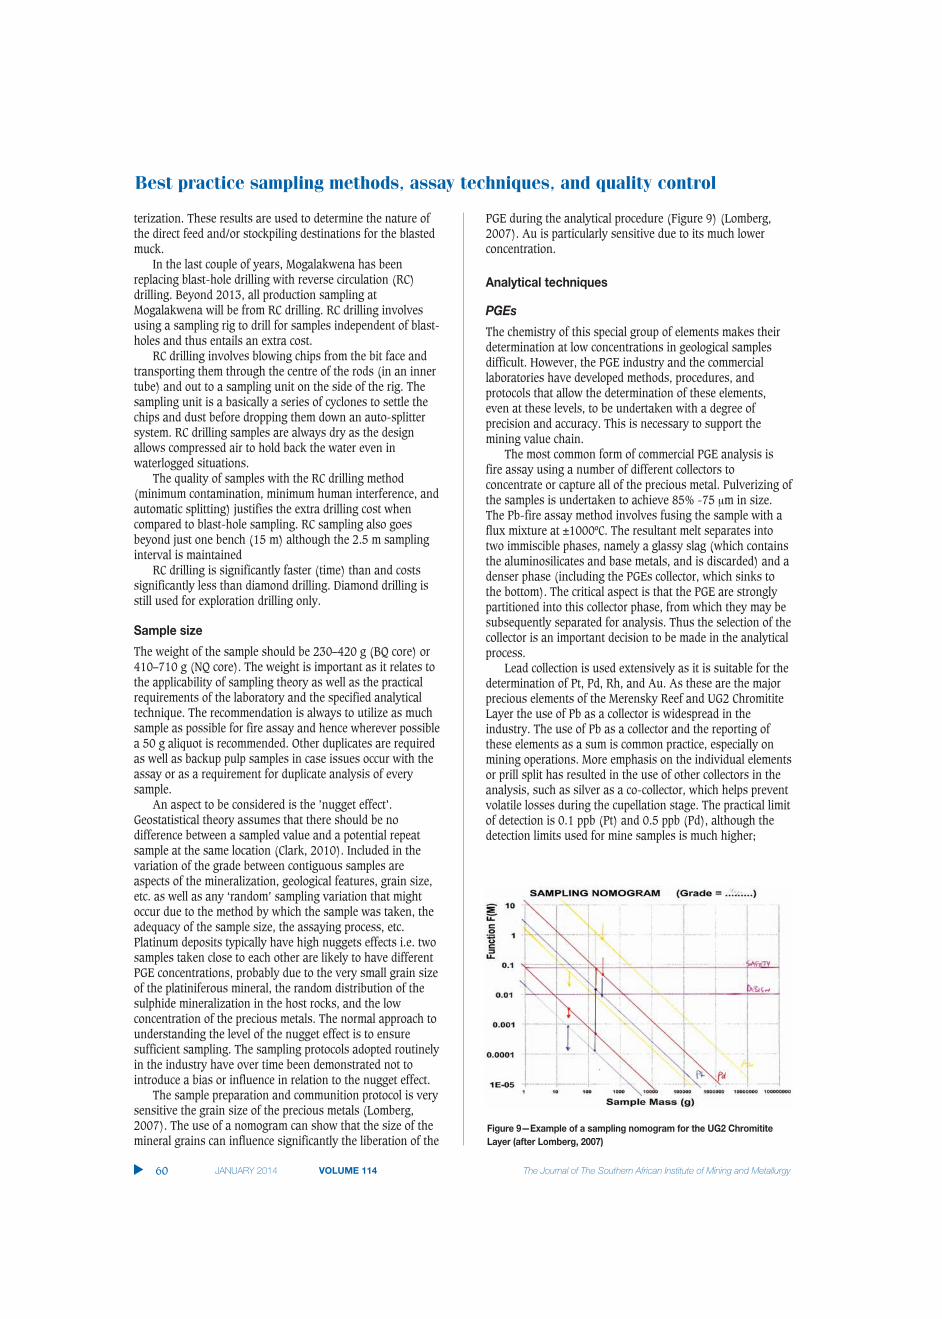
The sample preparation and communition protocol is verysensitive the grain size of the precious metals (Lomberg,2007). The use of a nomogram can show that the size of themineral grains can influence significantly the liberation of the
PGE during the analytical procedure (Figure 9) (Lomberg,2007). Au is particularly sensitive due to its much lowerconcentration.
Analytical techniques
PGEs
The chemistry of this special group of elements makes theirdetermination at low concentrations in geological samplesdifficult. However, the PGE industry and the commerciallaboratories have developed methods, procedures, andprotocols that allow the determination of these elements,even at these levels, to be undertaken with a degree ofprecision and accuracy. This is necessary to support themining value chain.
The most common form of commercial PGE analysis isfire assay using a number of different collectors toconcentrate or capture all of the precious metal. Pulverizing ofthe samples is undertaken to achieve 85% -75 μm in size.The Pb-fire assay method involves fusing the sample with aflux mixture at ±1000ºC. The resultant melt separates intotwo immiscible phases, namely a glassy slag (which containsthe aluminosilicates and base metals, and is discarded) and adenser phase (including the PGEs collector, which sinks tothe bottom). The critical aspect is that the PGE are stronglypartitioned into this collector phase, from which they may besubsequently separated for analysis. Thus the selection of thecollector is an important decision to be made in the analyticalprocess.
Lead collection is used extensively as it is suitable for thedetermination of Pt, Pd, Rh, and Au. As these are the majorprecious elements of the Merensky Reef and UG2 ChromititeLayer the use of Pb as a collector is widespread in theindustry. The use of Pb as a collector and the reporting ofthese elements as a sum is common practice, especially onmining operations. More emphasis on the individual elementsor prill split has resulted in the use of other collectors in theanalysis, such as silver as a co-collector, which helps preventvolatile losses during the cupellation stage. The practical limitof detection is 0.1 ppb (Pt) and 0.5 ppb (Pd), although thedetection limits used for mine samples is much higher;
▲
60 JANUARY 2014 VOLUME 114 The Journal of The Southern African Institute of Mining and Metallurgy
Figure 9—Example of a sampling nomogram for the UG2 ChromititeLayer (after Lomberg, 2007)

0.1–0.5 ppm. The practical reasons are the cost, the volumeof analyses required, and the use of the results on a minewhere the in situ grades are >3 g/t 3PGE+Au.
The best alternative until relatively recently was the NiScollector and fire assay. The technique was used moreextensively in the metallurgical environment due to the accuracy required. Geological samples were until the 1990srarely submitted to NiS-fire assay. The method differs fromPb-fire assay as all the PGEs are collected in the nickelsulphide. The advantages are that there is complete collectionof the entire range of PGE and that there is no cupellationstep in which some PGEs may be lost. As a result the methodis widely considered to provide slightly higher total PGEresults. The limits of detection for PGEs provided bycommercial laboratories are typically in the range of 0.02 ppm to 0.005 ppm. The analytical detection limit may be0.1 ppb (Pt) and 0.5 ppb (Pd) if required. However, the thedeposit would not economic at grades that low, and so thehigher detection limit is a realistic approach given samplevolumes and cost.
The fire assay method has the following advantages (Raoand Reddi, 2000):
➤ Ease of handling large sample weights, which can dealwith low analyte concentrations and address non-homogeneity and the ‘nugget effect'
➤ Assurance of quantitative collection of all the PGEs(NiS-fire assay) and their complete separation frombase metals and other matrix elements.
The few disadvantages of the fire assay procedures are:
➤ Large reagent blanks due to the presence of PGEs inthe chemicals utilized during sample decompositionand solution preparation (e.g., nickel powder is knownto contain appreciable amounts of PGEs and so blankfusions are performed on a regular basis to check forthis)
➤ Selection of suitable flux composition is an importantaspect and the tendency to generalize flux weightsoften lead to erroneous results
➤ The experience of the assayer has a critical role insuccessful assaying and the technique thereforerequires skilled personnel.
Despite this, NiS-fire assay is probably the preferred pre-concentration method for analysis of PGEs in geological andrelated materials because of its versatility and broad range.Recently other collectors have been used to providealternatives to NiS-fire assay. The reason for the use of othercollectors relates to the difficulties of NiS-fire assay, and thecost and the time required. These collectors have allowed thereporting of good (precise and accurate) results and so aremore widely available with some commercial laboratories.
Base metals
The emphasis of this paper is on the PGEs. However, basemetals (Cu, Ni, and Co) are important components of themineralization. They contribute to the revenue and so need tobe assessed in an appropriate manner. For the sake ofcompleteness some discussion is included here. The level ofbase metal that is being considered is an order of magnitudelower than that in a primary base metal deposit. Thereforethe analytical method must have a lower level of detection.
Below is a list of analytical methods used for the determi-nation of the base metals. The list is not exhaustive as theanalytical technique chosen should be considered based onits applicability to the task at hand. The selection of theanalytical method should include consideration of accuracyand precision, detection limits, expected concentration, andsample matrix.
➤ Pressed pellet and X-ray fluorescence (XRF)—XRF is anon-destructive analytical technique used to determinea full range of light to heavy elements by pressed pelletdisc. This technique is suitable for large numbers ofsamples (usually at ppm levels) where the matrix of thematerial is generally consistent, such as Cu and Nidetermination for the Merensky Reef, UG2 ChromititeLayer, and Platreef
➤ Aqua regia leach—Aqua regia will digest chalcophileelements in particular, although elements associatedwith silicates and more refractory minerals may be onlypartially digested. The concentration may bedetermined by atomic absorption spectrometry (AAS)or inductively coupled plasma-optical emissionspectroscopy (ICP-OES)
➤ Four-acid digestions—Four-acid digestion provides atotal dissolution of most elements except for a few suchas Cr, V, and Ti. The concentration may be determinedby ICP-OES or inductively coupled plasma-massspectroscopy (ICP-MS).
➤ Sodium peroxide fusion—Sodium peroxide fusion withan ICP-OES finish provides total analyses of basemetals but at the expense of higher detection limits andlower precision due to the high sodium salts insolution. Generally detection limits are in the region of20 to 50 ppm
➤ Wet chemistry consists of titrimetric and gravimetrictechniques, and is more suited to concentrates orpercentage-level base metals.
It is also important to consider the sulphide-soluble Cu orNi as well as the total concentration. This is especially true asNi commonly substitutes into olivines and so is notrecoverable. A partial leach (such as acetic acid) that does notmobilize silicate-hosted material reporting sulphide Cu and Niwould be appropriate.
Quality assurance/quality control
The current investment environment requires the reporting ofexploration results against the international reporting codes(SAMREC, JORC, etc.). Owners, promoters, investors, andother interested stakeholders require that the results of theexploration be reported with confidence. Mineral explorationand mining companies have to de-risk their projects frominception right through to production. Investment risk can belowered and confidence in the results promoted by theimplementation of quality assurance and quality control(QA/QC) programmes (Lomberg, 2013).
The application of a QA/QC procedure aims to confirmboth the precision and accuracy of assays and is used toensure that they can be confidently relied upon and thusreduce the risk of a project. The QA/QC programme identifiesvarious aspects of the results that could negatively influencethe precision or accuracy of the assay data.
Best practice sampling methods, assay techniques, and quality control
The Journal of The Southern African Institute of Mining and Metallurgy VOLUME 114 JANUARY 2014 61 ▲

Best practice sampling methods, assay techniques, and quality control
In order to do this, control samples are inserted into thesampling stream. The control samples recommended shouldcomprise two different certified reference materials (CRMs), ablank, and a duplicate within every 20 samples submitted.The CRMs are reference samples with a known (stastically)element abundance. The CRMs should have a composition(matrix) similar to the range of rock types being analysed toensure that the quality control programme is valid (Méndez,2011). When choosing which standards to use, themethodology being employed by the laboratory to analyse thesamples should be identical to the method used to certify thestandard. Finally, the CRMs should include one that hasanalyte concentrations close to the anticipated averageconcentration of the deposit and one at or close to themarginal or cut-off grade. A blank is a standard with anabundance of the elements of interest below the level ofdetection of the analytical technique. The duplicate is asecond split of a sample taken at a particular stage of thesampling process; e.g. field or pulp duplicate. The intendedaim is 5% coverage for each of the control sample types. Theinserted quality controls should allow the identification andreporting of ‘non-conformance’ or ‘out of control’ processesduring the analytical process (Noppe, 2008). Further controlon data integrity is required through submittal of pulps to areferee laboratory at a recommended frequency of 1 in 10(10%). These check assays are compared with those of theprimary laboratory and any bias monitored and eliminated aswell as potential analytical errors at the principal laboratoryidentified. It is very important to remember that exactly thesame assay methodology must be employed by the umpirelaboratory to ensure an accurate comparison and thatstandards also be submitted within the real samples to ensurethe accuracy of the umpire laboratory. To maximize thecomparison between the two laboratories, the pulp residuessubmitted should be chosen at random from the data-set andcover the entire grade range being reported. QA/QC samplesshould be inserted as per the protocols adopted for thesampling programme. The quality control data should beanalysed on an ongoing basis and queries addressed to thelaboratory.
By using this density of QC samples, it is possible toidentify samples that had been swapped, missing samples,and incorrect labelling among other aspects. The value of agood QA/QC programme is that it identifies potentialweaknesses in the sampling procedure or sampling errors andallows the geologist to correct or minimize them before theycan adversely influence the assay data. These errors mayinclude incorrect sampling, poor sub-sampling methods, anderrors due to the sampling equipment (e.g. core cutting,invalid splitting methods etc).
Conclusion
The use of the appropriate sampling methodology can ensurethat valid data is collected that allows the estimation of amineral resource and the selection of a mining cut for a PGEdeposit. These methodologies have been established over anextended period and proven to be practical and pragmatic
The basis for an appropriate sampling regime is athorough understanding of the deposit and its mineralization.Related to this is the appreciation of the anticipatedexploration methods, mining methods, and metallurgicalprocess flow sheet.
Acknowledgements
I would like to acknowledge the contributions of KevinFerguson and Steve Hunns (Platinum Australia), BarendMeulenbeld (Kameni Holdings), Anglo American Platinum(Trust Muzondo), Setpoint Laboratories (Kevin Gerber), andThys Botha (Platinum Group Metals).
References
BROWN, R.T. 2008. A Brief Summary of the Great Dyke of Zimbabwe.Unpublished Report.
CLARK, I. 2010. Statistics or geostatistics? Sampling error or nugget effect?Journal of the Southern African Institute of Mining and Metallurgy, vol. 110. pp. 307–312.
KINNAIRD, J.A., WHITE, J.A., and SCHURMANN, L.W. 2005. Multiphase emplacementof the Platreef, northern Bushveld, South Africa. (Abstract.) 10thPlatinum Symposium, Oulu, Finland, 7–9 August 2005.
LOMBERG, K.G. 2007. Construction and use of a nomogram for the UG2Chromitite Layer. University of the Witwatersrand. Sampling Theory andMethods course assignment.
LOMBERG, K.G. and MCKINNEY, R.L. 2013. Quality Control and Quality AssuranceCase Studies for the Analysis of Precious and Base Metals. SymposiumSeries S75. Southern African Institute of Mining and Metallurgy,Johannesburg. pp. 95–112.
MCDONALD, I. and HARMER, R.E. 2010. The nature of PGE mineralization in theAurora Project Area, Northern Bushveld Complex, South Africa. 11thInternational Platinum Symposium, June 21–24 2010. Ontario GeologicalSurvey, Miscellaneous Release–Data 269.
MÉNDEZ, A.S. 2011. A discussion on current quality-control practices. MineralExploration, Applications and Experiences of Quality Control. Ivanov, O(ed.). InTech, Rijeka, Croatia.
MULLER, C.J. 2010. Technical Report on Project 3 Resource Cut Estimation of theWestern Bushveld Joint Venture (WBJV) located on the Western Limb ofthe Bushveld Igneous Complex, South Africa. Western Bushveld JointVenture. Prepared for Platinum Group Metals Ltd.
NOPPE, M. 2008. Notes on data QA/QC requirements.http://www.ebah.com.br/content/ABAAAAHTQAH/quality-assurance-and-control
OBERTHÜR T., MELCHER, F,, BUCHHOLZ, P., and LOCMELIS, M. 2012. The oxidizedores of the Main Sulphide Zone, Great Dyke, Zimbabwe: turning resourcesinto minable reserves – mineralogy is the key. 5th International PlatinumConference ‘A Catalyst for Change’, Sun City, South Africa, 18–20September 2012. Symposium Series S72. Southern African Institute ofMining and Metallurgy, Johannesburg. pp. 647–672.
PRENDERGAST, M.D. and WILSON, A.H. 1989. The Great Dyke of Zimbabwe - II:mineralization and mineral deposits 5th Magmatic Sulphides FieldConference, Harare, Zimbabwe. Prendergast, M.D. and Jones, M.J. (eds.),Institute of Mining and Metallurgy, London. pp. 21–42.
SAMREC. 2009. South African Mineral Resource Committee. The South AfricanCode for Reporting of Exploration Results, Mineral Resources and MineralReserves (the SAMREC Code). 2007 Edition as amended July 2009.http://www.samcode.co.za/downloads/SAMREC2009.pdf.
SCHOUWSTRA, R.P., KINLOCH, E.D., and LEE, C.A. 2000. A short geological reviewof the Bushveld Complex. Platinum Metals Review, vol. 44. pp. 33–39.
VILJOEN, M.J. and SCHÜRMANN, L.W. 1998. Platinum group metals. The MineralResources of South Africa. Wilson, M.G.C. and Anhaeusser, C.R. (eds.).Handbook 16. Council for Geoscience, Pretoria, pp. 532- 568.
WILSON, A. and CHUNNETT, G. 2006. Trace element and platinum group elementdistributions and the genesis of the Merensky Reef, Western BushveldComplex, South Africa. Journal of Petrology, vol. 47. pp. 2369–2403.
WILSON, A.H. and PRENDERGAST, M.D. 1989. The Great Dyke of Zimbabwe - I:Tectonic setting, stratigraphy, petrology, structure, emplacement andcrystallization. 5th Magmatic Sulphides Field Conference, Harare,Zimbabwe. Prendergast, M.D. and Jones, M.J. (eds.), Institute of Miningand Metallurgy, London. pp. 1–20. ◆
▲
62 JANUARY 2014 VOLUME 114 The Journal of The Southern African Institute of Mining and Metallurgy