best management practices of oil palm cultivation on peatland
TRANSCRIPT

BEST MANAGEMENT PRACTICES OF OIL
PALM CULTIVATION ON PEATLAND
MPOB
20 January 2011

Introduction
Review on management practices
Water management
Water table
Peat subsidence rate
Growth and Yield of Oil Palm
Conclusion and recommendations
Contents

In the past, agronomic studies were carried out focusing on
activities that increase yield, without factoring in practices
related to GHG emission.
INTRODUCTION
In temperate regions, proper water-table management, as
in the East Anglian fens, has been successful in reducing
peat subsidence (Dawson et al., 2010).
In the Malaysia, a study on water-table management was
carried out on shallow and deep peat at MPOB Research
Station, Sessang, Sarawak. A high groundwater table
management was designed to slow down peat
decomposition, reduce CO2 emission, minimize peat drying
and protect the oil palm fronds against desiccation.

Compaction of the peat is recommended because the denser
soil greatly improves the palm growth and yield.
REVIEW ON BEST MANAGEMENT PRACTICES
OF OIL PALM CULTIVATION ON PEAT

Establishment of good cover crop to improve soil moisture
fertility status.

Unidirectional leaning of palms
Unidirectional leaning of palms to
minimize the negative impacts of
leaning palms

Very high water-table
Very low water-table
Good Water Management ?
The current practice is to maintain water-table at 60 to 80 cm

Good water management
The most promising mitigation measure to control peat
subsidence and reduce CO2 emission is by practising optimal
ground water-table management.

To get high and sustainable yield
i. Avoid irreversible drying
ii. Minimise nutrient leaching
To reduce CO2 emission
i. Minimise peat oxidation
ii. Minimise subsidence


Field Drain
Width x Depth 1.0 m x 0.5 m
Density
Every 4 planting rows:600 m/ha
Every 8 planting rows: 300 m/ha
PurposeConnect to collectiondrain for in-field water reticulation
Specifications

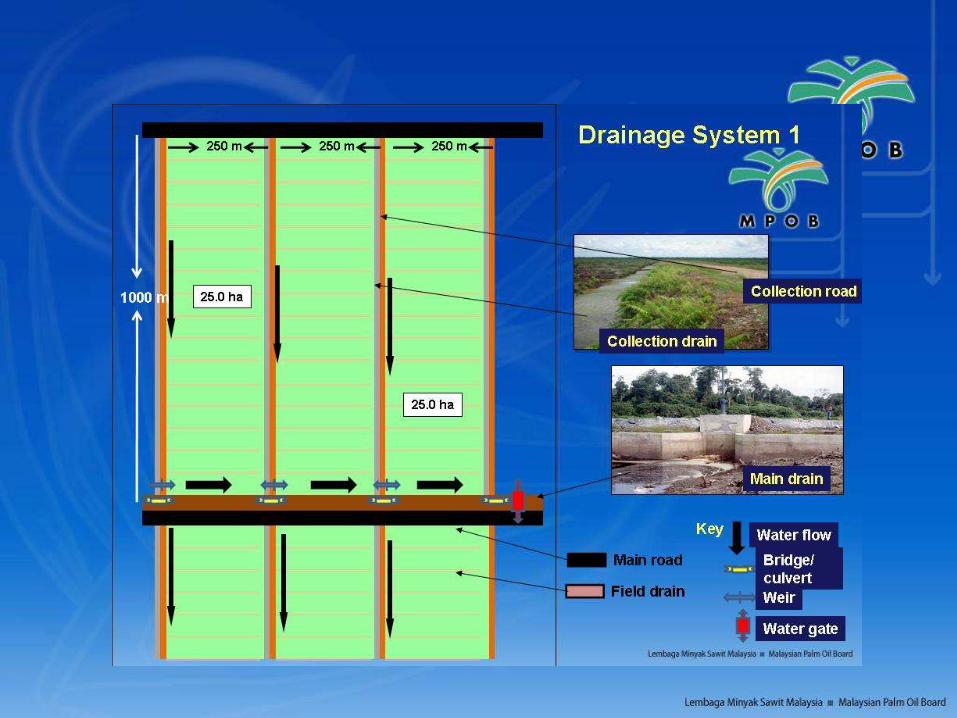
Collection Drain
Width xDepth 2.0 m x 1.0 m
Density
Spaced 200 m apart:40 m/ha
Spaced 250 m apart:50 m/ha
Purpose Connect to main drainfor in-block water reticulation
Specifications

Main Drain
Width xDepth 4.0 m x 2.0 m
Density
Spaced 1000 m apart: 15 m/ha
Spaced 2000 m apart: 7.5 m/ha
Purpose
To channel excess waterfrom plantation area to overflow water-gate or to canal
Specifications

Drainage System – Watergate
To maintain sufficient water in the canal and drain at all
times especially during dry season
Density: one water-gate for every 25 to 50 ha

Maintenance works to increase the efficiency of water
management system
Cleaning the canal and drains from debris such as fruit
bunches, loose fruits and fertilizer bags
Conservation of suitable ground covers along the canal
to minimise erosion of canal and drain bunds
To improve water management

Maintain water table in the field between
30 and 50 cm
Water tables were measured
using piezometer
Water levels were monitored
at the main drain

Peat Subsidence Measurement
Blk 14B, Palm age 13
Subside 47cm in 8 yrs
21 yrs after development
(Sep 1988 to Sep 2009)
Subside 154 cm

Year
2 4 6 8 10 12 14 16
Bul
k D
ensi
ty (
gm/c
c)
0.00
0.05
0.10
0.15
0.20
0.25
0.30
Y= 0.0532 + 0.0149yr - 0.0002yr2
R2 = 0.956
MSE = 0.0007
Deep peat initial soil bulk density of drained peat is low with an
average of 0.09 gm cc-1
Over the years of development, it had increased to 0.20 gm cc-1
Changes in Bulk Density

15 years after oil palm planting. Groundwater table at 40 – 50 cm

SR = 10.605 – 0.899 Yr + 0.018 Yr 2 + 0.026 WT
n=47; R2 = 0.604
Water Table and Peat Subsidence

5.0
10.0
15.0
20.0
25.0
30.0
35.0
1 2 3 4 5 6 7 8 9 10 11
Year of Harvest
FF
B t
/ha
Shallow
Deep
Average
FFB Yield

Groundwater Estimated
Table CO2 Emission
cm t/ha/yr
30 20 Murayama & Bakar 1996
40 30 Murayama & Bakar 1996
50 25 Jauhiainen 2004
60 58 Melling 2005
80 58 Murayama & Bakar 1996
80 80 Ali 2006
80 100 Wosten & Ritzema 2001
(Hoojier’s Regression: CO2 E = 91 x WT m ( R2=.71)

Estimated CO2 Emission from Peat with Different Groundwater Depths
at 7 to 12 Years of Development

Optimum water table in the field of between 30 and 50
cm will
i. Minimise peat oxidation
ii. Minimise subsidence
iii. Avoid peat burning/fire
iv. Reduce CO2 emission
CONCLUSIONS

At the same time, it will
i. Avoid irreversible drying
ii. Increase nutrient efficiency
iii. Sustain high yield
A high groundwater table would slow down peat
decomposition, minimizes peat drying (protects the oil
palm fronds against desiccation).

Further study is needed to quantify GHG emission from
peatland.
RECOMMENDATION
Maintaining the water level in the collection drain at 40 to 60 cm
(groundwater table in the field of between 30 and 50 cm).
The most promising mitigation measure to control peat
subsidence is by practising optimal ground water-table
management.

Thank You