best laid plans - ed
TRANSCRIPT

Best Laid PlansThe Unfulfilled Promise of Public Higher Education in California

Cover Photo: Sather Tower, University of California-Berkeley, U.S. National Register of Historic Places

Best Laid Plans
a report by the American Council of Trustees and Alumni
June 2012
The Unfulfilled Promise of Public Higher Education in California

Acknowledgments
This report on the 32 public four-year undergraduate institutions in the state of California was pre-
pared by the staff of the American Council of Trustees and Alumni, primarily Dr. Michael Poliakoff and
Armand Alacbay, Esq., with the assistance of Chrisanna Waldrop, Esq., the Pacific Research Institute
(PRI), and the Foundation for Individual Rights in Education (FIRE). We thank the Arthur N. Rupe Foun-
dation for its generous support.
The American Council of Trustees and Alumni (ACTA) is an independent non-profit dedicated to
academic excellence, academic freedom, and accountability at America’s colleges and universities.
Since its founding in 1995, ACTA has counseled boards, educated the public, and published reports
about such issues as good governance, historical literacy, core curricula, the free exchange of ideas,
and accreditation. ACTA has previously published The Diffusion of Light and Education: Meeting the Chal-
lenges of Higher Education in Virginia; Prepared in Mind and Resources?: A Report on Public Higher Education
in South Carolina; Made in Maine: A State Report Card on Public Higher Education; Here We Have Idaho: A
State Report Card on Public Higher Education; At a Crossroads: A Report Card on Public Higher Education in
Minnesota; For the People: A Report Card on Public Higher Education in Illinois; Show Me: A Report Card on
Public Higher Education in Missouri; Shining the Light: A Report Card on Georgia’s System of Public Higher
Education; and Governance in the Public Interest: A Case Study of the University of North Carolina System,
among other state-focused reports.
For further information, please contact:
American Council of Trustees and Alumni1726 M Street, NW, Suite 802Washington, DC 20036Phone: 202.467.6787 • Fax: [email protected]

CONTENTS
Executive Summary 1
General Education
1. What are students learning? 6
Intellectual Diversity
2. Do schools promote a free exchange of ideas? 12
Cost & Effectiveness
3. How much are students paying? 20
4. How does tuition compare to family income? 23
5. Where is the money going? 26
6. Are students graduating and doing so on time? 35
Governance 7. How are the governing boards structured? 40
8. What have boards done to improve academic quality? 43
9. What have boards done to control costs and increase efficiency? 46
10. What should governing boards do now? 53
End Notes 56
Appendices
Appendix A: Criteria for Core Courses 68
Appendix B: School Evaluation Notes for Core Courses 70
I look to the diffusion of light and education as the resource to be relied on for ameliorating the condition, promoting the virtue, and advancing the happiness of man.
Thomas JeffersonOctober 1822

A REPO
RT BY THE A
MERICA
N CO
UN
CIL OF TRU
STEES AN
D A
LUM
NI
1
Executive Summary
A general diffusion of knowledge and intelligence being essential to the preservation of the rights and liberties of the people, the Legislature shall encourage by all suitable means the promotion of intellectual, scientific, moral, and agricultural improvement.
– Constitution of the State of California, Article 9, Section 1
Echoing the words and thoughts of Thomas Jefferson, California’s state constitution em-braces the noblest of principles in its vision for public higher education. Over the decades,
California public higher education has dominated policy discussions as a model of access and excellence and a powerful engine of economic growth. Indeed, it would be hard to overstate the scale, significance, and potential of California’s public universities.
Since 1960, higher education policy has been guided by the California Master Plan for Higher Education, an unprecedented system designed simultaneously to support world-class research universities, regionally based undergraduate teaching universities, and open-access community colleges, with coordinated structures for transfer among these sectors. Stanford president John Hennessy called it the envy of the world. In its original vision, the Master Plan articulated California’s ideal of providing tuition-free higher education for California residents. It called for “scrupulous policy planning to realize the maximum value from the tax dollar,” more recently summarized as including “fuller use of facilities and better coordination among educational institutions.”1
According to the Master Plan, the California Community Colleges would admit any student capable of benefiting from instruction. The top one-third of high school graduating classes would be eligible for admission to the universities of the California State system, whose primary mission was defined as undergraduate and master’s level graduate education, with research as appropriate for a primary teaching mission. The University of California campuses would func-tion as high-level research universities, selecting high school students from the top 12.5% of the graduating classes and placing strong emphasis on doctoral degrees and professional programs in law, medicine, and dentistry.
There have been many achievements of which California can be proud. The University of California system has received more U.S. patents than any university in the world. Berkeley alone can boast of having among its current and emeriti faculty nine Nobel Laureates, 32 MacArthur Fellows, 141 members of the National Academy of Sciences, and four Pulitzer Prize winners. Cal State is one of the largest multi-campus BA and MA programs in the world. Since 1961, it has awarded more than 2.6 million degrees. The third pillar of California public higher
EXECUTIVE SUMMARY

BEST
LA
ID P
LAN
S T
HE
UN
FULF
ILLE
D P
ROM
ISE
OF
PUBL
IC H
IGH
ER E
DU
CATI
ON
IN C
ALI
FORN
IA
2
EXECUTIVE SUMMARY
education, the California Community Colleges, is now the largest higher education system in the nation, serving 2.6 million students annually. As of 2008, a total FTE of 586,057 students were enrolled in degree programs in California’s public four-year and graduate institutions, and another 741,622 in degree or certificate programs in its community colleges.2
But California’s best laid plans for higher education are now in serious danger. Many attri-bute the threat to the reduction in public funding and the dire financial situation throughout California. The financial difficulties are formidable indeed. However, this report shows the real threat to the preeminence of California’s higher education is not a lack of funds, although it is a serious issue. Rather, the real danger is a fundamental failure by today’s trustees and system leaders to apply the same creativity and thoughtfulness that informed the Master Plan to a new world of reduced resources and a shrinking tax base. Unless there is a paradigm shift in the thinking of California’s educational leadership, the promise of accessibility and quality will be lost.
There are major problems that require urgent attention:
Dramatic hikes in cost to students and obstacles to university access
• Overafive-yearperiod,tuitionhasrisenonaverage73.1%atUCcampuses,and83.8%at Cal State campuses.3
• The expectation of admission to a California public university for thousands of California Community College graduates is unfulfilled.4
Inadequate attention to educational quality and outcomes
• Onaverage,only52.4%offirst-time,full-timefreshmengraduatefromCalStatecampuses within six years. Only 17.2% graduate within four years.5
• Californiastudentsaregraduatingwithvastgapsintheirskillsandknowledge.Students—especially at UC—can graduate without ever having exposure to U.S. history, economics, and other key subjects.
• UCtrusteeshavedelegatedtheirimportantoversightofcentralacademicmattersto the faculty, which has not taken effective steps to improve academic quality and accountability.
• Meanwhile,UCschoolsrefusetousenationallynormedandvalidatedassessmentstodetermine whether undergraduates are getting the education they need—and whether the public is making a good investment.
A REPO
RT BY THE A
MERICA
N CO
UN
CIL OF TRU
STEES AN
D A
LUM
NI
3
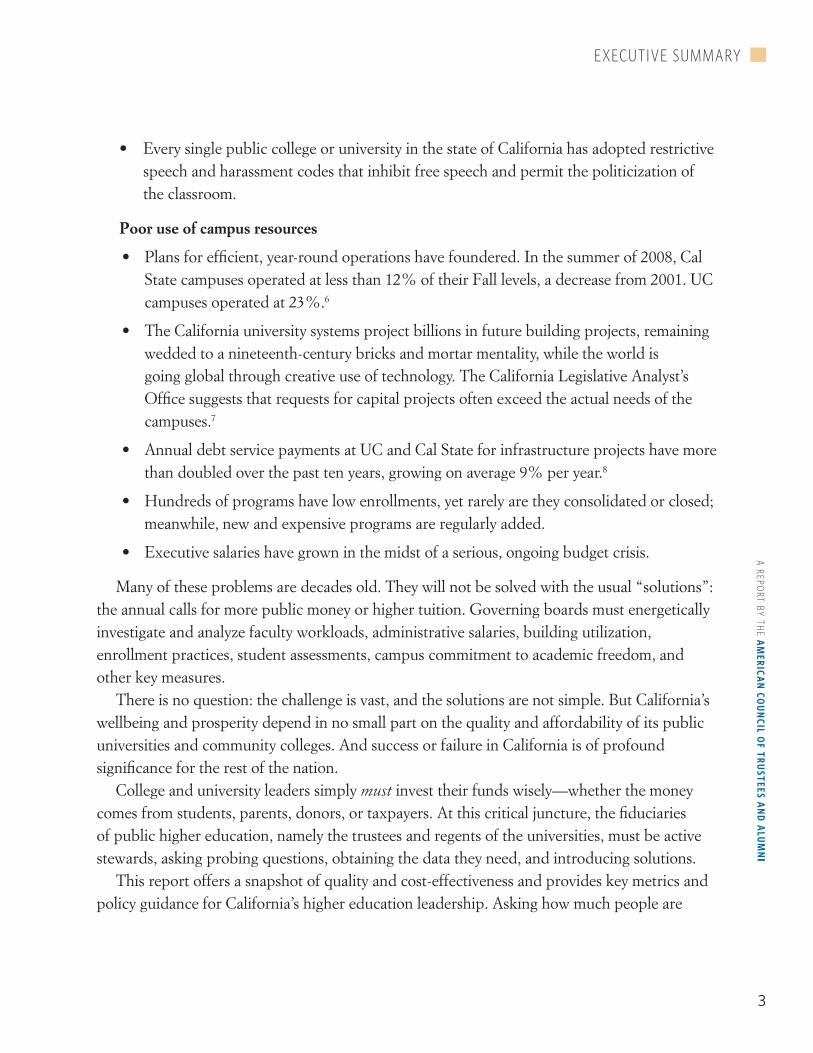
• EverysinglepubliccollegeoruniversityinthestateofCaliforniahasadoptedrestrictivespeech and harassment codes that inhibit free speech and permit the politicization of the classroom.
Poor use of campus resources
• Plansforefficient,year-roundoperationshavefoundered.Inthesummerof2008,CalState campuses operated at less than 12% of their Fall levels, a decrease from 2001. UC campuses operated at 23%.6
• TheCaliforniauniversitysystemsprojectbillionsinfuturebuildingprojects,remainingwedded to a nineteenth-century bricks and mortar mentality, while the world is going global through creative use of technology. The California Legislative Analyst’s Office suggests that requests for capital projects often exceed the actual needs of the campuses.7
• AnnualdebtservicepaymentsatUCandCalStateforinfrastructureprojectshavemorethan doubled over the past ten years, growing on average 9% per year.8
• Hundredsofprogramshavelowenrollments,yetrarelyaretheyconsolidatedorclosed;meanwhile, new and expensive programs are regularly added.
• Executivesalarieshavegrowninthemidstofaserious,ongoingbudgetcrisis.
Many of these problems are decades old. They will not be solved with the usual “solutions”: the annual calls for more public money or higher tuition. Governing boards must energetically investigate and analyze faculty workloads, administrative salaries, building utilization, enrollment practices, student assessments, campus commitment to academic freedom, and other key measures.
There is no question: the challenge is vast, and the solutions are not simple. But California’s wellbeing and prosperity depend in no small part on the quality and affordability of its public universities and community colleges. And success or failure in California is of profound significance for the rest of the nation.
College and university leaders simply must invest their funds wisely—whether the money comes from students, parents, donors, or taxpayers. At this critical juncture, the fiduciaries of public higher education, namely the trustees and regents of the universities, must be active stewards, asking probing questions, obtaining the data they need, and introducing solutions.
This report offers a snapshot of quality and cost-effectiveness and provides key metrics and policy guidance for California’s higher education leadership. Asking how much people are
EXECUTIVE SUMMARY

BEST
LA
ID P
LAN
S T
HE
UN
FULF
ILLE
D P
ROM
ISE
OF
PUBL
IC H
IGH
ER E
DU
CATI
ON
IN C
ALI
FORN
IA
4
paying to attend these schools, how the schools are spending that money, and what students get in return, this report outlines 12 key steps that those responsible for quality and cost—the trustees, working with faculty and administrators—must take to ensure that California’s great schools remain great.
Finally, this report is an invitation to a vigorous dialogue about issues that are critical for California and the nation as a whole.
EXECUTIVE SUMMARY

General Education

BEST
LA
ID P
LAN
S T
HE
UN
FULF
ILLE
D P
ROM
ISE
OF
PUBL
IC H
IGH
ER E
DU
CATI
ON
IN C
ALI
FORN
IA
6
Around the nation, a consensus is building that college students must acquire certain core skills and knowledge to be ready for the responsibilities of citizenship and for
the challenges of today’s ever-changing workplace. In August 2011, Roper Public Affairs & Corporate Communications administered a national survey on ACTA’s behalf. Seventy percent responded that colleges and universities should require all students to take basic classes in core subjects such as writing, math, science, economics, U.S. history, and foreign language. The strongest support for the core curriculum (80%) came from respondents age 25-34—including those who have recently transitioned from college into today’s demanding workplace.9
Surveys of employers and business leaders underscore these findings. In a 2009 survey conducted by the Hart Research Associates for the American Association of Colleges and Universities, employers registered their strong desire for colleges and universities to place moreemphasisonconceptsandnewdevelopmentsinscienceandtechnology(70%);writtenandoralcommunication(89%);theabilitytoworkwithnumbersandunderstandstatistics(63%);civicknowledge,participation,andengagement(52%);democraticinstitutionsandvalues(40%);andproficiencyinaforeignlanguage(45%).Ofthehundredsofbusinessleaderssurveyed, 26% complained that recent graduates of four-year institutions were deficient in writing skills.10
According to the Bureau of Labor Statistics, between the ages of 18 and 44, a person can anticipate changing jobs on average 11 times. In these challenging economic times, a well-constructed and well-taught core curriculum offers significant advantages: General surveys of major fields give students a broader, more comprehensive education than narrowly-focused classes, and thus prepare them for a dynamic workplace where they will need multiple skill sets and wide-ranging knowledge. Indeed, the catalogs of California’s public universities themselves recognize the essential role played by a core curriculum.11
A robust collegiate core curriculum—also known as general education—ensures a solid basis of common skills and knowledge outside of the major for all students, whatever their preparation. And requiring standard classes in foundational subjects is a far more cost-effective model than offering a large list of esoteric courses.
WHAT ARE STUDENTS LEARNING?
1. What are students learning?

A REPO
RT BY THE A
MERICA
N CO
UN
CIL OF TRU
STEES AN
D A
LUM
NI
7
We assessed general education at 31 public universities in the California State University and University of California systems. Using the most recent publicly available catalogs, we examined whether these institutions require their students to take general education courses in seven key subjects: Composition, Literature, intermediate-level Foreign Language, U.S. Government or History, Economics, Mathematics, and Natural or Physical Science.
To receive credit in this report, a course must be a true general education course—broad in scope, exposing the student to the rich array of material that characterizes the subject. Further, a course must truly be a requirement. Many California universities seem to have a core curriculum because they require students to take courses in subject areas other than their major—often called “distribution requirements.” But these are “requirements” in name only, typically giving students dozens or even hundreds of courses from which to choose. For further details on our criteria, please see Appendix A.
As the following charts show, the Cal State and UC systems differ markedly in their approaches to general education. In the Cal State system, 17 universities require four or more corecourses;commendably,all22oftheCalStateinstitutionsreceivecreditforScienceand19 for Composition. With but one exception, every university in the California State University system, guided by Title 5 of the California Code of Regulations, section 40404, has an explicit requirement for a foundational course in American history and government.12
California Polytechnic State University-San Luis Obispo is an example of curricular excellence, meeting six of the seven core requirements on top of a demanding set of science requirements. Three other Cal State institutions—Sonoma State, Cal State-San Bernardino, and Cal State-San Marcos—meet five of the seven requirements. Cal State-Dominguez Hills, Cal State-East Bay, Cal State-LA, and San Francisco State notably require students to take two semesters of basic composition courses. To graduate, students must also pass either an upper-level writing course or a writing skills examination.13
Compared to Cal State campuses, the UC universities do a poor job of ensuring a comprehensive general education. The Berkeley and Davis campuses do not require even one ofthesevencoresubjectslistedabove;Irvine,Riverside,andSantaCruzrequireameretwo;and UCLA, Merced, San Diego, and Santa Barbara require three. Not a single University of California campus requires a foundational course in U.S. history or government.
The number and variety of courses that satisfy existing distribution requirements make it easy for students to avoid core subjects and still fulfill their graduation requirements. For example, at UC-Davis, students can take one of hundreds of course sections to satisfy the Arts and Humanities requirement, while at UCSB, nearly 200 courses fulfill the Social Science requirement. At UC-Berkeley, students can take courses from any of 19 different
WHAT ARE STUDENTS LEARNING?

BEST
LA
ID P
LAN
S T
HE
UN
FULF
ILLE
D P
ROM
ISE
OF
PUBL
IC H
IGH
ER E
DU
CATI
ON
IN C
ALI
FORN
IA
8
departments to satisfy (one semester’s worth of) the Reading and Composition requirement. A perplexing array of topics often stands in lieu of a clear, focused requirement. At UC-Davis, for example, 162 courses offered during the Fall 2011 quarter satisfied the “Quantitative Literacy” requirement, including “Techniques and Practices of Fish Culture” and “Animal Communication.” One course, “Landscape Meaning,” could be used during the Fall quarter of 2011 to satisfy any of nine general education requirements, including Arts and Humanities, Oral Literacy, Quantitative Literacy, Science and Engineering, Scientific Literacy, Social Sciences, Visual Literacy, World Cultures, and Writing Experience.14
WHAT ARE STUDENTS LEARNING?

A REPO
RT BY THE A
MERICA
N CO
UN
CIL OF TRU
STEES AN
D A
LUM
NI
9
GENERAL EDUCATION REQUIREMENTS
AT CALIFORNIA STATE UNIVERSITY INSTITUTIONS*
INSTITUTION Comp Lit LangGov/ Hist Econ Math Sci
California Polytechnic State University-San Luis Obispo ● ● ● ● ● ●
California State Polytechnic University-Pomona ● ● ●
California State University-Bakersfield ● ● ● ●
California State University-Channel Islands ● ●
California State University-Chico ● ● ●
California State University-Dominguez Hills ● ● ● ●
California State University-East Bay ● ● ● ●
California State University-Fresno ● ● ● ●
California State University-Fullerton ● ● ● ●
California State University-Long Beach ● ● ● ●
California State University-Los Angeles ● ● ● ●
California State University-Monterey Bay ● ● ●
California State University-Northridge ● ● ● ●
California State University-Sacramento ● ● ● ●
California State University-San Bernardino ● ● ● ● ●
California State University-San Marcos ● ● ● ● ●
California State University-Stanislaus ● ● ●
Humboldt State University ● ● ● ●
San Diego State University ● ● ● ●
San Francisco State University ● ● ● ●
San Jose State University ● ● ● ●
Sonoma State University ● ● ● ● ●
*See Appendix B for school evaluation notes on core courses. Based on the technical mission of California Maritime Academy, it is excluded from this portion of the study.
WHAT ARE STUDENTS LEARNING?

BEST
LA
ID P
LAN
S T
HE
UN
FULF
ILLE
D P
ROM
ISE
OF
PUBL
IC H
IGH
ER E
DU
CATI
ON
IN C
ALI
FORN
IA
10
*See Appendix B for school evaluation notes on core courses.
GENERAL EDUCATION REQUIREMENTS
AT UNIVERSITY OF CALIFORNIA INSTITUTIONS*
INSTITUTION Comp Lit LangGov/ Hist Econ Math Sci
University of California-Berkeley
University of California-Davis
University of California-Irvine ● ●
University of California-Los Angeles ● ● ●
University of California-Merced ● ● ●
University of California-Riverside ● ●
University of California-San Diego ● ● ●
University of California-Santa Barbara ● ● ◒ ◒
University of California-Santa Cruz ● ●
WHAT ARE STUDENTS LEARNING?
Intellectual Diversity

BEST
LA
ID P
LAN
S T
HE
UN
FULF
ILLE
D P
ROM
ISE
OF
PUBL
IC H
IGH
ER E
DU
CATI
ON
IN C
ALI
FORN
IA
12
There are few campus locations more famous than UC-Berkeley’s Sproul Plaza, across from the Mario Savio Steps. Credited with leading the campus free speech movement in the
late ‘60s, Mario Savio is honored today with a prominent plaque, a memorial lecture fund, and a library archive detailing students’ efforts to secure their right to free speech and academic freedom.
The university should indeed be a place where free expression of diverse views is the first and most sacred principle, even when those viewpoints are perceived as unwelcome or offensive. This principle lies at the heart of a university education and undergirds the statement issued in 2006 by the Association of American Colleges and Universities—a national organization whose members include virtually every school in the California State and University of California systems: “In any education of quality, students encounter an abundance of intellectual diversity.”15
To make this possible, AAC&U maintains, students should learn to think critically—so that they understand “the inappropriateness and dangers of indoctrination . . . see through the distortions of propaganda, and . . . assess judiciously the persuasiveness of powerful emotional appeals.” In this spirit, the California legislature passed a law in 2006 expressly precluding the state’s public colleges and universities from subjecting students to discipline for speech that would be protected off campus.16
Both the UC and Cal State systems have published broad policy statements outlining rights to free expression. The University of California Policy on Speech and Advocacy states that the “University is committed to assuring that all persons may exercise the constitutionally protected rights of free expression, speech, assembly, and worship.” California State University institutions have similar policies at the campus level. Note, for example, the policy at Cal State-San Bernardino: “There shall be no restrictions on legal free speech activity based on the content of such speech or expression or on the political, religious, or other affiliations of speakers.” Cal State-Channel Islands makes a similar promise: “The University will protect the rights of freedom of speech, expression, petition, and peaceful assembly as set forth in the U.S. Constitution.”17
Yet despite these broad promises, California institutions are some of the worst offenders when it comes to policies that punish so-called “offensive” speech or restrict expression to
DO SCHOOLS PROMOTE A FREE EXCHANGE OF IDEAS?
2. Do schools promote a freeexchange of ideas?

A REPO
RT BY THE A
MERICA
N CO
UN
CIL OF TRU
STEES AN
D A
LUM
NI
13
designated “free speech zones.” A close review of California schools by the Foundation for Individual Rights in Education (FIRE) has found that—in both the Cal State and UC systems—schools are failing to protect legitimate expression and free speech and are actively discouraging a robust exchange of ideas.
Dedicated to defending and sustaining individual rights at America’s colleges and universities, FIRE examines speech codes and assigns a “red light,” “yellow light,” or “green light” rating to indicate whether a given school protects or restricts freedom of expression. According to FIRE, every one of the 32 four-year undergraduate institutions in the Cal State and UC systems has restrictive policies in place. Fourteen schools earned “yellow light” warnings for endangering free speech, including eight Cal State schools and six UC schools. Meanwhile, 18 schools are on the “red light” list for clear and substantial restrictions of free speech.18 (See the charts on the following pages.)
When he assumed the UC presidency, Mark Yudof rejected the multiple standards and definitions of discriminatory harassment, often found in speech codes, on the UC campuses. And he issued a firm directive in October 2009, requiring campuses to have a single definition, consistent with U.S. Supreme Court precedent. His directive was intended to bring UC into compliance with the “Davis Standard,” which the Court articulated in its 1999 ruling on Davis v. Monroe County Board of Education.
President Yudof’s directive defines harassment as:
[C]onduct that is so severe and/or pervasive, and objectively offensive, and that so substantially impairs a person’s access to University programs or activities, that the person is effectively denied equal access to the University’s resources and opportunities on the basis of his or her race, color, national or ethnic origin, alienage, sex, religion, age, sexual orientation . . . or perceived membership in any of these classifications.19
But President Yudof’s directive has not been faithfully followed. The University of California’s system-wide policy encourages students to report to campus police any “general communication not directed toward a particular individual, which disparages a group of people on the basis of some characteristic.” At UCSB, “personal jokes or negative comments about you personally or about you as a female or male” are subject to prosecution. UCSB’s code is so broad as to capture a great range of speech. It is precisely such broad-brushed threats to free expression that the U.S. Supreme Court declared unconstitutional.20
DO SCHOOLS PROMOTE A FREE EXCHANGE OF IDEAS?

BEST
LA
ID P
LAN
S T
HE
UN
FULF
ILLE
D P
ROM
ISE
OF
PUBL
IC H
IGH
ER E
DU
CATI
ON
IN C
ALI
FORN
IA
14
SPEECH CODES AT CALIFORNIA STATE UNIVERSITY INSTITUTIONS*
l California Maritime Academy l California Polytechnic State University-San Luis Obispo
l California State Polytechnic University-Pomona l California State University-East Bay
l California State University-Bakersfield l California State University-Northridge
l California State University-Channel Islands l California State University-San Bernardino
l California State University-Chico l California State University-San Marcos
l California State University-Dominguez Hills l San Diego State University
l California State University-Fresno l San Jose State University
l California State University-Fullerton l Sonoma State University
l California State University-Long Beach
l California State University-Los Angeles
l California State University-Monterey Bay
l California State University-Sacramento
l California State University-Stanislaus
l Humboldt State University
l San Francisco State University
RED LIGHT SCHOOLS
15 out of 23
Speech codes impose clear and substantial restrictions on free speech.
YELLOW LIGHT SCHOOLS
8 out of 23
Speech codes clearly endanger free speech.
GREEN LIGHT SCHOOLS
0 out of 23
Speech codes do not seriously imperil free speech.
*Research and evaluation for this chart completed by The Foundation for Individual Rights (FIRE), www.thefire.org.
DO SCHOOLS PROMOTE A FREE EXCHANGE OF IDEAS?

A REPO
RT BY THE A
MERICA
N CO
UN
CIL OF TRU
STEES AN
D A
LUM
NI
15
SPEECH CODES AT UNIVERSITY OF CALIFORNIA INSTITUTIONS*
l University of California-Irvine l University of California-Berkeley
l University of California-San Diego l University of California-Davis
l University of California-Santa Cruz l University of California-Los Angeles
l University of California-Merced
l University of California-Riverside
l University of California-Santa Barbara
RED LIGHT SCHOOLS
3 out of 9
Speech codes impose clear and substantial restrictions on free speech.
YELLOW LIGHT SCHOOLS
6 out of 9
Speech codes clearly endanger free speech.
GREEN LIGHT SCHOOLS
0 out of 9
Speech codes do not seriously imperil free speech.
*Research and evaluation for this chart completed by The Foundation for Individual Rights (FIRE), www.thefire.org.
DO SCHOOLS PROMOTE A FREE EXCHANGE OF IDEAS?
BEST
LA
ID P
LAN
S T
HE
UN
FULF
ILLE
D P
ROM
ISE
OF
PUBL
IC H
IGH
ER E
DU
CATI
ON
IN C
ALI
FORN
IA
16
Like so many things in life, speech and sensitivity codes emerge because of good intentions. Assomethinkinggoes,weshouldnotoffend;weshouldnotmakepeopleuncomfortable.We need to get along. But in mounting this argument, those who look favorably toward speech codes miss an important point: speech codes create a chilling atmosphere, effectively empowering the institution to silence students and faculty on the grounds that a person, or even a group, has been “offended.” When faced with speech codes or harassment policies (whatever the name and whatever the guise), students will hold back from expressing controversial opinions or making forceful arguments, worried that they might face administrative or disciplinary repercussions for constitutionally protected speech.
Speech codes are not a simple matter of civility and sensitivity. They are of special concern to all of us in a democratic society that depends upon citizens evaluating multiple perspectives in order to determine what is in the country’s best interest.
Of course, developing that ability comes from a robust exchange of ideas—especially in the classroom—with assurance of professional responsibility and the maintenance of academic standards. Here again, Cal State and UC profess strict adherence to these important principles. At California State University:
[T]he academic freedom of students rests first upon their access to a high quality education and their right to pursue a field of study that they deem appropriate and desirable . . . . [and supports] an environment where students as well as faculty are free to express the widest range of viewpoints within the standards of scholarly inquiry and professional ethics.21
The University of California Policy on Course Content similarly states: “Misuse of the classroom by, for example, allowing it to be used for political indoctrination, for purposes other than those for which the course was constituted, or for providing grades without commensurate and appropriate student achievement, constitutes misuse of the University as an institution.” That policy goes on:
It should be understood that the Board of Regents has always recognized the importance of an “open forum policy” on the campuses, of a free exchange of ideas, and of pursuit of the truth wherever it may lead—popular or unpopular though that may be. . . . It is the Regents’ responsibility to the very concept of a University to protect the institution from the misuse of the classroom and to ensure the rights of all to teaching and learning.22
Yet here again, California schools fail to practice what they preach. In 2003 the faculty and administrators at the University of California illustrated how far they had wandered
DO SCHOOLS PROMOTE A FREE EXCHANGE OF IDEAS?

A REPO
RT BY THE A
MERICA
N CO
UN
CIL OF TRU
STEES AN
D A
LUM
NI
17
from their professed dedication to academic excellence and academic freedom when, for the first time in nearly 70 years, the university changed its policy on academic freedom in the classroom. The old policy had emphasized that professors teaching controversial subjects must be“dispassionate”and“giveplaytointellectratherthantopassion”;thenewpolicymerelyrequires them to express conclusions—however passionately held—which are reached by “professional standards of inquiry” in their disciplines. The new regulations, subtly different from the old, give faculty a dangerous new power to indoctrinate students.23
To see why, consider the occasion for the revisions. In Fall 2002, Berkeley offered a writing course entitled “The Politics and Poetics of Palestinian Resistance.” The course advocated the Palestinian perspective of the Israel-Palestine conflict, saw no need to incorporate alternative views, and even went so far as stating, in its official course description, that “Conservative thinkers are encouraged to seek other sections.” That last statement was removed under public pressure, but the course retained a deeply one-sided political slant.24
Under the old regulations, this course and others like it were vulnerable to the objection that they violated the requirement of objectivity and dispassionate analysis. The new regulations make it far easier to defend such courses, for they allow the professor to be as biased as he or she will, so long as the teaching falls within the professor’s area of scholarly “competence.”
In the face of the faculty’s resolution to weaken its commitment to objective and dispassionate teaching, the regents took no action. But the late Martin Trow, former UC-Berkeley professor of public policy, understood—and courageously addressed—the muddled state of academic freedom at his university. He spoke up eloquently against the change, prescribing academic freedom as a faculty right and a responsibility necessitated by the academy’s obligation, in the words of the original 1934 regulation on academic freedom and faculty conduct in the classroom, to “seek and transmit knowledge and to train students in the processes whereby truth is to be made known.”25
As with other issues, he predicted the consequences of such a change—and his prediction remains “must reading” for all those who are currently troubled by the lack of intellectual diversity:
If the university gives to this politically unrepresentative body of academics the right to teach their political views without the necessity to present alternative perspectives if only they are “urgently committed to a definite point of view,” and are “competent” to hold those views, then people outside the university might be inclined to suspect that in some academic subjects and departments there may be more indoctrination and conversion than teaching going on. The costs to the university of its breaking of that treaty, and of the trust on which it is founded,
DO SCHOOLS PROMOTE A FREE EXCHANGE OF IDEAS?

BEST
LA
ID P
LAN
S T
HE
UN
FULF
ILLE
D P
ROM
ISE
OF
PUBL
IC H
IGH
ER E
DU
CATI
ON
IN C
ALI
FORN
IA
18
may be slow in coming. But the consequences of breaking that treaty can be seen in other societies that have withdrawn their trust from the universities, and govern them more directly according to the preferences of the governments of the day. And that is a very high price—maybe the highest price—that universities can be asked to pay for their own arrogance . . . .26
In keeping with Trow’s prediction, there has been growing public concern about indoctrination in the classroom and a lack of intellectual diversity.27
As the intellectual health of a university is dependent on the free exchange of ideas and the freedom to explore any topic, schools must foster an atmosphere of free inquiry. A recent exhaustive report by the National Association of Scholars outlined politicization of academic work at the University of California. Although UC president Mark Yudof publicly acknowledged that there is truth in the charge, when asked if he would send a memo to UC chancellors concerning such behavior, President Yudof responded, “I don’t know if it would do much good.” Judging from local media reaction, which called upon him to demonstrate bold leadership, the public is losing patience.28
DO SCHOOLS PROMOTE A FREE EXCHANGE OF IDEAS?

Cost & Effectiveness

BEST
LA
ID P
LAN
S T
HE
UN
FULF
ILLE
D P
ROM
ISE
OF
PUBL
IC H
IGH
ER E
DU
CATI
ON
IN C
ALI
FORN
IA
20
The cost of higher education has gone up all over the country, but it has exploded at colleges and universities in California. Nationwide, during the five-year period ending in 2011-12,
inflation-adjusted published tuition and required fees for in-state students at four-year public colleges increased by an average of 28%. In California, however, the numbers are even more stark: Across the UC system, tuition/fees increased 32% in 2009 alone and Cal State raised tuition twice in 2011, first 12%, then another 9%. Both increases sparked student protests. Seventy percent of Californians now agree that “the price of a college education keeps students who are qualified and motivated to go to college from doing so,” with six out of ten calling the affordability of higher education a “big problem.”29
Both the Cal State and UC governing boards set a uniform system-wide base tuition, which accountsforthebulkofannualstudentcharges;however,eachcampusexecutivehastheauthority to charge campus-specific fees in certain limited categories.30
The charts on the following pages show the tuition and fees at Cal State and UC campuses for 2006-07 and 2011-12 in constant 2011 dollars, along with the percent change over those years. For reference, the leftmost column shows tuition and fees for 2001-02, also expressed in constant 2011 dollars. Over the five-year period from 2006-07 to 2011-12, tuition has risen on average 73.1% at UC campuses, and 83.8% at Cal State campuses. The five-year trend is stark—all schools increased tuition by a minimum of 63%, even after adjusting for inflation. At three schools—Cal State-East Bay, Long Beach State, and Humboldt State—tuition and fees increased over 95% in five years. To make matters worse: Across 30 campuses, tuition also rose by an average of 47% during the five years before 2006-07, with Cal Poly-San Luis Obispo leading the pack at 76.1%.
HOW MUCH ARE STUDENTS PAYING?
3. How much are studentspaying?

A REPO
RT BY THE A
MERICA
N CO
UN
CIL OF TRU
STEES AN
D A
LUM
NI
21
INSTITUTION 2001-02 2006-07 2011-125-Year
% Change*
California Maritime Academy $2,787 $3,878 $6,536 68.5%
California Polytechnic State University-San Luis Obispo 2,755 4,852 7,911 63.0
California State Polytechnic University-Pomona 2,280 3,364 6,106 81.5
California State University-Bakersfield 2,287 3,779 6,682 76.8
California State University-Channel Islands** N/A 3,325 6,316 90.0
California State University-Chico 2,629 3,807 6,890 81.0
California State University-Dominguez Hills 2,318 3,360 6,095 81.4
California State University-East Bay 2,237 3,287 6,414 95.1
California State University-Fresno 2,238 3,391 6,263 84.7
California State University-Fullerton 2,348 3,358 6,120 82.2
California State University-Long Beach 2,215 3,196 6,240 95.3
California State University-Los Angeles 2,263 3,437 6,095 77.4
California State University-Monterey Bay 2,356 3,350 5,963 78.0
California State University-Northridge 2,304 3,394 6,488 91.2
California State University-Sacramento 2,397 3,662 6,573 79.5
California State University-San Bernardino 2,385 3,450 6,518 88.9
California State University-San Marcos 2,281 3,450 6,596 91.2
California State University-Stanislaus 2,381 3,395 6,582 93.9
Humboldt State University 2,364 3,543 7,062 99.3
San Diego State University 2,256 3,526 6,578 86.6
San Diego State University-Imperial Valley Campus*** N/A 2,961 5,706 92.7
San Francisco State University 2,319 3,533 6,276 77.7
San Jose State University 2,425 3,678 6,828 85.7
Sonoma State University 2,581 4,070 6,862 68.6
TRENDS IN UNDERGRADUATE TUITION & FEESCALIFORNIA STATE UNIVERSITY SYSTEM
Source: Integrated Postsecondary Education Data System (IPEDS)Note: 2001-02 and 2006-07 dollar amounts are expressed in 2011 inflation-adjusted numbers.* Five-year change is from 2006-07 to 2011-12. ** California State University-Channel Islands accepted its first freshman class in Fall 2003. *** San Diego State University-Imperial Valley Campus began offering four-year programs in 2007.
HOW MUCH ARE STUDENTS PAYING?

BEST
LA
ID P
LAN
S T
HE
UN
FULF
ILLE
D P
ROM
ISE
OF
PUBL
IC H
IGH
ER E
DU
CATI
ON
IN C
ALI
FORN
IA
22
TRENDS IN UNDERGRADUATE TUITION & FEESUNIVERSITY OF CALIFORNIA SYSTEM
Source: IPEDSNote: 2001-02 and 2006-07 dollar amounts are expressed in 2011 inflation-adjusted numbers.* Five-year change is from 2006-07 to 2011-12. ** University of California-Merced was not in operation until Fall 2005.
INSTITUTION 2001-02 2006-07 2011-125-Year
% Change*
University of California-Berkeley $5,237 $7,424 $12,834 72.9%
University of California-Davis 5,836 8,453 13,860 64.0
University of California-Irvine 5,787 7,581 13,122 73.1
University of California-Los Angeles 5,379 7,277 12,686 74.3
University of California-Merced** N/A 7,423 13,070 76.1
University of California-Riverside 5,554 7,353 12,924 75.8
University of California-San Diego 5,531 7,462 13,200 76.9
University of California-Santa Barbara 5,462 7,822 13,595 73.8
University of California-Santa Cruz 5,460 7,829 13,416 71.4
HOW MUCH ARE STUDENTS PAYING?
Source: IPEDSNote: Unweighted average of Cal State and UC tuition.
0
2,000
4,000
6,000
8,000
10,000
12,000
$14,000
2011-20122010-20112009-20102008-20092007-20082006-2007
AVERAGE IN-STATE TUITION AND FEES (2011 $’s)
Cal State Average UC Average
($3,529)
($6,485)
($7,625)
($13,190)

A REPO
RT BY THE A
MERICA
N CO
UN
CIL OF TRU
STEES AN
D A
LUM
NI
23
Increases in college costs place a heavy burden on families that, in many cases, are already straining to pay mortgages and put food on the table. The charts on the following pages illus-
trate the problem by showing the rise in tuition and fees as a percentage of California’s median household income. Over the five-year period studied, undergraduate tuition and required fees at all of the colleges and universities in this study demanded an increasing percentage of house-hold income. While the rate of increase was consistently high across all schools—from 44.8% up to 72.5%—the share of income demanded by the “sticker price” tuition and fees at UC schoolsismarkedlyhigherthanthatforitsCalStatecounterparts;atnearlyeveryUCcampus,the full price of one year’s tuition and required fees would now consume at least one-fifth of median household income.
California’s Cal Grants program, administered by the California Student Aid Commission, attempts to mitigate the impact of high tuition costs on families with financial need. In its most comprehensive form, Cal Grants cover all Cal State and UC system-wide fees for qualifying resident undergraduate students. However, students must meet strict qualifications to receive grants: Out of the 646,836 students enrolled in the Cal State and UC systems in 2010, only 150,197 received Cal Grant assistance. Cal Grants, institutional grants, and federal scholarship funds create robust student aid packages. On average, however, they leave net prices for the actual cost of attendance that are high and rising, especially for students who are not eligible for full aid packages. For example, in 2010-11, a UC-Berkeley student from a family making be-tween $75,001 and $110,000 owed an average net price of $22,388. Students who do not qual-ify for comprehensive scholarship aid will leave college with debt that may take many years to pay, calling into question the much-vaunted income dividend of a college degree. The Federal Reserve Bank of New York reports that over 12 million individuals 40 or older still owe money on student loans. Astonishingly, almost 2 million individuals 60 and over still owe money. The recessionhascreatedhardtimesthroughoutthenation;Californiacollegesanduniversitiesneed to develop cost efficiencies that meet the demands of the economy’s “new normal.”31
HOW DOES TUITION COMPARE TO FAMILY INCOME?
4. How does tuition compareto family income?

BEST
LA
ID P
LAN
S T
HE
UN
FULF
ILLE
D P
ROM
ISE
OF
PUBL
IC H
IGH
ER E
DU
CATI
ON
IN C
ALI
FORN
IA
24
UNDERGRADUATE TUITION & FEES AS APERCENTAGE OF MEDIAN HOUSEHOLD INCOME
CALIFORNIA STATE UNIVERSITY SYSTEM
INSTITUTION 2000-01 2005-06 2010-11
5-YearChange in% Points*
5-Year% Change*
California Maritime Academy 4.6% 6.7% 9.7% 3.1% 46.0%
California Polytechnic State University-San Luis Obispo 4.6 8.2 11.9 3.7 45.1
California State Polytechnic University-Pomona 3.8 5.8 8.8 3.0 52.0
California State University-Bakersfield 3.8 6.4 9.8 3.3 52.2
California State University-Channel Islands** N/A 5.8 9.3 3.6 61.7
California State University-Chico 4.3 6.5 10.3 3.8 58.5
California State University-Dominguez Hills 3.7 5.8 8.9 3.1 54.1
California State University-East Bay 3.7 5.6 9.3 3.7 65.9
California State University-Fresno 3.7 5.8 9.0 3.2 55.3
California State University-Fullerton 3.9 5.8 8.9 3.1 54.4
California State University-Long Beach 3.7 5.5 8.8 3.3 59.6
California State University-Los Angeles 3.7 5.9 8.9 3.0 51.8
California State University-Monterey Bay 4.0 5.8 8.7 2.9 49.6
California State University-Northridge 3.9 5.9 9.3 3.5 58.9
California State University-Sacramento 4.0 5.9 9.5 3.6 60.7
California State University-San Bernardino 3.7 6.0 9.3 3.3 55.2
California State University-San Marcos 3.6 5.9 9.3 3.3 56.5
California State University-Stanislaus 3.9 5.9 9.7 3.9 66.3
Humboldt State University 4.0 6.1 10.6 4.4 72.5
San Diego State University 3.8 6.0 9.6 3.5 58.5
San Diego State University-Imperial Valley Campus*** N/A 5.1 8.2 3.1 59.8
San Francisco State University 3.9 6.0 9.2 3.2 52.3
San Jose State University 4.0 6.4 9.9 3.5 55.0
Sonoma State University 4.3 7.0 10.1 3.1 44.8
Source: IPEDS and U.S. Census Bureau* Five-year change is from 2005-06 to 2010-11, to capture the most recent federal data on median household income in California. ** California State University-Channel Islands accepted its first freshman class in Fall 2003. *** San Diego State University-Imperial Valley Campus began offering four-year programs in 2007.
HOW DOES TUITION COMPARE TO FAMILY INCOME?

A REPO
RT BY THE A
MERICA
N CO
UN
CIL OF TRU
STEES AN
D A
LUM
NI
25
UNDERGRADUATE TUITION & FEES AS APERCENTAGE OF MEDIAN HOUSEHOLD INCOME
UNIVERSITY OF CALIFORNIA SYSTEM
INSTITUTION 2000-01 2005-06 2010-11
5-YearChange in% Points*
5-Year% Change*
University of California-Berkeley 8.6% 12.6% 20.1% 7.5% 59.7%
University of California-Davis 8.7 14.4 22.0 7.5 52.4
University of California-Irvine 8.5 13.1 20.6 7.5 57.7
University of California-Los Angeles 7.9 12.6 19.8 7.2 57.5
University of California-Merced** N/A 12.9 20.3 7.4 57.6
University of California-Riverside 8.2 12.7 20.3 7.5 59.0
University of California-San Diego 8.2 12.9 20.8 7.8 60.7
University of California-Santa Barbara 8.2 13.5 21.5 7.9 58.7
University of California-Santa Cruz 9.1 13.4 21.1 7.7 57.3
Source: IPEDS and U.S. Census Bureau* Five-year change is from 2005-06 to 2010-11, to capture the most recent federal data on median household income in California. ** University of California-Merced was not in operation until Fall 2005.
HOW DOES TUITION COMPARE TO FAMILY INCOME?

BEST
LA
ID P
LAN
S T
HE
UN
FULF
ILLE
D P
ROM
ISE
OF
PUBL
IC H
IGH
ER E
DU
CATI
ON
IN C
ALI
FORN
IA
26
Across the country a changing economy, demographic shifts, and a declining fiscal base present challenges to state governments. California’s challenges are among the most
serious in the nation. As Dominic Brewer and William Tierney, professors in the Rossier School of Education at the University of Southern California, observe, per-student state funding at theUniversityofCaliforniahasdropped40%since1990;inthatyear,thestatecontributed$15,860 per student, a figure that dropped to $9,650 in constant dollars.32
Despite recent declines, California currently funds higher education at a rate above the national average when measured by appropriations per FTE and by appropriations of state tax funds for operating expenses of higher education as a percentage of gross domestic product.33 Yet there is little guarantee that this trend will continue.
The decline in state support comes at a time when many California local governments are strapped and some even face bankruptcy. And over the long-term, the aging of California’s population will reduce the tax base available to fund postsecondary education. Moreover, the long-term health of California’s retirement system looks grim. A 2011 study by the Stanford Institute for Economic Policy Research estimated that CalPERS—the retirement system for most state employees, including those at the California State University—has an 82% chance of being unable to meet its obligations within the next 16 years. The same study estimated that the University of California Retirement Plan had a 70% chance of being unable to meet its obligations within the same period.34
Nationwide, a growing share of school funds is going to pay for layers and layers of administration. Some support staff are integral to the process of instruction. However, the long-term trend nationwide—and in California—is simply unsustainable. From 1976-2005, the ratio of non-instructional staff to instructional staff in American colleges and universities more than doubled. A recent study of higher education costs at 198 leading colleges and universities showed a 39.3% increase in expenditures per student for instruction, a 37.8% increase for expenditures in research and service, but a 61.2% increase per student for administration from 1993-2007.35 While California schools have taken recent steps to combat these trends, more must be done.
WHERE IS THE MONEY GOING?
5. Where is the moneygoing?

A REPO
RT BY THE A
MERICA
N CO
UN
CIL OF TRU
STEES AN
D A
LUM
NI
27
WHERE IS THE MONEY GOING?
Administrative Spending
The charts on the following pages gather data submitted by California’s public universities to the U.S. Department of Education. They demonstrate a marked difference in trends at the Cal State and UC systems. In the five-year period ending in 2009-10, the most recent year for which financial data are publicly available, instructional spending grew faster than administrative spending (or decreased at a slower rate than administrative spending) at 14 out of 23 Cal State institutions. Commendably, two schools—Cal State-San Bernardino and San Francisco State—cut administrative spending (adjusted for inflation) by over 25%. On the other hand, fourCalStateinstitutionseachraisedadministrativespendingby40%ormore;twoofthesesimultaneously decreased instructional spending over the same period.
In the UC system, six schools grew instructional spending faster than administrative spending (or decreased it at a slower rate): UC-Berkeley, UC-Irvine, UCLA, UC-Riverside, UCSB, and UCSD. However, only two—UC-Irvine and UCSB—cut administrative spending over the five-year period.
Differences between the two systems become particularly stark when one analyzes trends in administrative spending as a share of Educational and General (E&G) expenditures—a key indicator of the size of administrative spending relative to the rest of the institution’s budget. At the California State University, administrative spending ranged from 8.4% to 20% of E&G expenditures. However, most schools in the Cal State system appear to be moving in the right direction. While administrative shares at four schools increased by 22% or more, over half of the campuses decreased administrative spending relative to E&G expenditures by at least 10%. Sonoma State particularly stands out, decreasing the administrative share of its budget by 2.6% while also increasing the instructional share by 23%. Trends such as this reflect a clear and promising shift of priorities.
At the University of California, on average, administrative spending represents 8% of E&G expenditures, with half of the schools decreasing that share over the five-year period. The numbers on a per-student basis, however, tell a different story. Long Beach State spends $6,924 per student on instruction and $1,040 on administration—a ratio of 6.7 to 1. Meanwhile, UC-Riverside spends $10,433 per student on instruction and $2,149 on administration—a ratio of 4.9 to 1. Given overall state appropriations, the disparity is especially significant.
In 2011-12, the UC system, which has a research and graduate education mission along with its undergraduate role, received over $270 million more in general fund support than did the Cal State system, even though it serves less than two-thirds the number of undergraduates as Cal State.36

BEST
LA
ID P
LAN
S T
HE
UN
FULF
ILLE
D P
ROM
ISE
OF
PUBL
IC H
IGH
ER E
DU
CATI
ON
IN C
ALI
FORN
IA
28
In 2008, the University of California Office of the President embarked on an administrative restructuring plan intended to cut spending by $52 million and staff by 400 members.37 While the plan achieved some cost savings, its impact was focused on the system president’s office, and many units simply moved to other areas within the university. It did not address the individual campuses, which continue to employ large numbers of administrators. The financial impact has not been lost on students. As one UC-Davis law student recently wrote:
While students face tuition hikes and professors see class sizes expand, administrators preside over an almost sacrosanct collection of programs that are best described as wasteful irrelevancies. The traditional model of faculty-run universities has gradually given way to a vast apparatus of lawyers, administrators and generic bureaucrats who have expanded overhead functions while prolifically fabricating new roles for themselves.38
At a time when many qualified students are denied a place in California public higher education, growing ranks of administrators with little tie to academic priorities cannot be justified.
WHERE IS THE MONEY GOING?

A REPO
RT BY THE A
MERICA
N CO
UN
CIL OF TRU
STEES AN
D A
LUM
NI
29
INSTRUCTIONAL VS. ADMINISTRATIVE SPENDINGCALIFORNIA STATE UNIVERSITY SYSTEM
INSTITUTION 2004-05 FY
Expenditures 2009-10 FY
Expenditures $ Change % ChangeCalifornia Maritime Academy Instruction Administration
$11,216,5566,795,951
$13,253,3456,151,466
$2,036,789 -644,485
18.2%-9.5
California Polytechnic State Instruction University-San Luis Obispo Administration
142,741,01830,611,952
144,423,476 27,798,044
1,682,459 -2,813,908
1.2-9.2
California State University- Instruction Pomona Administration
128,149,526 18,353,272
116,992,67325,692,405
-11,156,853 7,339,133
-8.7 40.0
California State University- Instruction Bakersfield Administration
51,949,36114,849,169
44,572,19712,268,802
-7,377,164 -2,580,367
-14.2 -17.4
California State University- Instruction Channel Islands Administration
23,816,4046,533,079
32,970,8719,590,174
9,154,467 3,057,095
38.446.8
California State University- Instruction Chico Administration
109,110,62119,534,718
99,925,93020,845,855
-9,184,692 1,311,137
-8.4 6.7
California State University- Instruction Dominguez Hills Administration
68,917,897 13,588,521
62,043,02710,594,860
-6,874,870 -2,993,661
-10.0-22.0
California State University- Instruction East Bay Administration
90,055,340 27,179,382
79,884,03721,517,130
-10,171,302 -5,662,252
-11.3 -20.8
California State University- Instruction Fresno Administration
137,187,73516,591,243
133,040,94228,671,629
-4,146,793 12,080,385
-3.0 72.8
California State University- Instruction Fullerton Administration
163,459,823 31,459,441
169,595,040 44,656,238
6,135,218 13,196,797
3.841.9
California State University- Instruction Long Beach Administration
206,056,09532,723,420
208,912,784 31,387,551
2,856,689 -1,335,869
1.4 -4.1
California State University- Instruction Los Angeles Administration
123,601,115 28,936,155
115,251,959 28,918,532
-8,349,156 -17,623
-6.8 -0.1
California State University- Instruction Monterey Bay Administration
36,900,109 9,639,248
31,796,377 12,302,553
-5,103,732 2,663,305
-13.8 27.6
California State University- Instruction Northridge Administration
181,633,10040,358,716
174,884,947 32,877,684
-6,748,153 -7,481,032
-3.7 -18.5
California State University- Instruction Sacramento Administration
173,716,680 37,685,980
158,071,046 31,651,148
-15,645,635 -6,034,832
-9.0 -16.0
California State University- Instruction San Bernardino Administration
85,977,066 29,284,777
87,351,77621,926,076
1,374,710 -7,358,702
1.6 -25.1
California State University- Instruction San Marcos Administration
47,575,57917,836,256
54,867,103 16,489,157
7,291,524 -1,347,100
15.3 -7.6
California State University- Instruction Sanislaus Administration
50,234,515 16,019,190
53,566,79712,697,880
3,332,282 -3,321,310
6.6-20.7
Humboldt State University Instruction Administration
60,758,079 15,420,175
55,054,996 17,216,944
-5,703,083 1,796,770
-9.4 11.7
San Diego State University Instruction Administration
218,479,39536,356,651
202,163,947 31,299,328
-16,315,447 -5,057,323
-7.5 -13.9
San Diego State University- Instruction Imperial Valley Campus* Administration
N/A N/A
N/A N/A
N/A N/A
N/A N/A
San Francisco State University Instruction Administration
196,681,494 54,605,191
180,857,456 39,075,870
-15,824,038 -15,529,322
-8.0 -28.4
San Jose State University Instruction Administration
175,107,401 28,159,287
178,036,859 29,513,673
2,929,458 1,354,386
1.7 4.8
Sonoma State University Instruction Administration
52,779,956 16,362,819
55,748,628 13,685,032
2,968,672 -2,677,787
5.6 -16.4
Source: IPEDSNote: Data are reported in 2011 inflation-adjusted numbers, and are for the most recent five-year span of data available.* San Diego State University-Imperial Valley Campus data were reported combined with that of the main campus.
WHERE IS THE MONEY GOING?

BEST
LA
ID P
LAN
S T
HE
UN
FULF
ILLE
D P
ROM
ISE
OF
PUBL
IC H
IGH
ER E
DU
CATI
ON
IN C
ALI
FORN
IA
30
INSTRUCTIONAL VS. ADMINISTRATIVE SPENDINGUNIVERSITY OF CALIFORNIA SYSTEM
INSTITUTION 2004-05 FY
Expenditures 2009-10 FY
Expenditures $ Change % ChangeUniversity of California-Berkeley Instruction Administration
$627,658,402 119,381,998
$680,829,018 122,878,343
$53,170,616 3,496,345
8.5%2.9
University of California-Davis Instruction Administration
662,545,97679,965,874
713,694,85487,910,293
51,148,878 7,944,419
7.7 9.9
University of California-Irvine Instruction Administration
521,352,397 41,927,486
564,585,493 36,202,118
43,233,096 -5,725,368
8.3-13.7
University of California-Los Angeles Instruction Administration
1,315,752,638124,939,385
1,534,470,515 145,268,757
218,717,877 20,329,373
16.616.3
University of California-Merced* Instruction Administration
N/A N/A
35,530,03926,046,484
N/A N/A
N/A N/A
University of California-Riverside Instruction Administration
168,994,801 38,744,522
198,444,812 40,866,831
29,450,011 2,122,309
17.4 5.5
University of California-San Diego Instruction Administration
602,565,021 95,076,916
744,535,015 109,469,258
141,969,994 14,392,341
23.6 15.1
University of California-Santa Barbara Instruction Administration
245,053,715 38,919,567
236,539,447 35,616,014
-8,514,268 -3,303,553
-3.5 -8.5
University of California-Santa Cruz Instruction Administration
153,581,30030,706,734
154,114,83231,197,695
533,532 490,962
0.3 1.6
Source: IPEDSNote: Data are reported in 2011 inflation-adjusted numbers, and are for the most recent five-year span of data available.* University of California-Merced was not in operation until Fall 2005.
WHERE IS THE MONEY GOING?

A REPO
RT BY THE A
MERICA
N CO
UN
CIL OF TRU
STEES AN
D A
LUM
NI
31
WHERE IS THE MONEY GOING?
Athletic Spending
And what about athletic spending? Universities are not required to report their athletic departments’ expenditures to the Department of Education as a separate item, so it’s harder to see what exactly is going on. However, based on information obtained by USA Today through a Freedom of Information Act request, it appears that 14 of the 15 California schools in Division I of the NCAA have allowed their athletic spending to grow at a faster rate than their instructional spending. Student athletic fees also continue to rise—in some cases more than threefold in a five-year period. (See the charts on the following pages.) In other words, athletic budgets are rising relative to educational spending, and in many cases drawing significant support from general university funds. Students, meanwhile, are being forced to shoulder an even greater burden of the cost. 39
The Berkeley athletic department, according to UC-Berkeley professor of computer science Brian Barksy, spent $88.4 million in campus funds between 2003 and 2011 to balance its budget, drawing fierce criticism from the faculty. Since that time, the demand for funds has only grown bigger as UC faces $321 million in stadium renovations, much of which will be used to address earthquake safety issues. Initial hopes of finding private funding for the renovations have weakened with only $31 million out of an expected $270 million in hand so far from the sale of seats. A substantial number of non-binding pledges will undoubtedly augment resources for the stadium project, but the bottom line is, so far, rather bleak. The athletic project not only puts academic program funds at risk but also threatens to escalate student fees even higher.40

BEST
LA
ID P
LAN
S T
HE
UN
FULF
ILLE
D P
ROM
ISE
OF
PUBL
IC H
IGH
ER E
DU
CATI
ON
IN C
ALI
FORN
IA
32
WHERE IS THE MONEY GOING?
TRENDS IN ATHLETIC SPENDINGCALIFORNIA STATE UNIVERSITY SYSTEM
INSTITUTION 2004-05 2009-10* % Change 2004-05 2009-10* % Change
California Maritime Academy N/A N/A N/A N/A N/A N/A
California Polytechnic State University-San Luis Obispo $4,930,626 $6,541,867 32.7% $13,597,161 $21,844,857 60.7%
California State Polytechnic University-Pomona N/A N/A N/A N/A N/A N/A
California State University-Bakersfield 657,535 1,986,596 202.1 5,986,119 9,064,657 51.4
California State University-Channel Islands N/A N/A N/A N/A N/A N/A
California State University-Chico N/A N/A N/A N/A N/A N/A
California State University-Dominguez Hills N/A N/A N/A N/A N/A N/A
California State University-East Bay N/A N/A N/A N/A N/A N/A
California State University-Fresno 423,333 1,648,797 289.5 30,186,780 27,984,636 -7.3
California State University-Fullerton 1,781,904 2,209,582 24.0 9,444,382 10,234,725 8.4
California State University-Long Beach 1,826,986 1,668,833 -8.7 13,473,521 13,947,071 3.5
California State University-Los Angeles N/A N/A N/A N/A N/A N/A
California State University-Monterey Bay N/A N/A N/A N/A N/A N/A
California State University-Northridge 1,859,929 1,887,274 1.5 9,657,426 9,671,357 0.1
California State University-Sacramento 3,535,118 4,710,108 33.2 13,160,946 17,495,912 32.9
California State University-San Bernardino N/A N/A N/A N/A N/A N/A
California State University-San Marcos N/A N/A N/A N/A N/A N/A
California State University-Stanislaus N/A N/A N/A N/A N/A N/A
Humboldt State University N/A N/A N/A N/A N/A N/A
San Diego State University 6,312,593 10,716,301 69.8 29,981,538 34,211,727 14.1
San Diego State University-Imperial Valley Campus N/A N/A N/A N/A N/A N/A
San Francisco State University N/A N/A N/A N/A N/A N/A
San Jose State University 850,219 4,910,187 477.5 16,705,278 21,793,519 30.5
Sonoma State University N/A N/A N/A N/A N/A N/A
Student Fees
Source: USA Today (http://www.usatoday.com/sports/college/ncaa-finances.htm) Note: USA Today study covered only those schools in NCAA Division I. 2004-05 and 2009-10 dollar amounts are expressed in 2011 inflation-adjusted numbers. * 2009-10 is the most recent year of data available from the USA Today study.
Total Operating Expenses

A REPO
RT BY THE A
MERICA
N CO
UN
CIL OF TRU
STEES AN
D A
LUM
NI
33
TRENDS IN ATHLETIC SPENDINGUNIVERSITY OF CALIFORNIA SYSTEM
INSTITUTION 2004-05 2009-10* % Change 2004-05 2009-10* % Change
University of California-Berkeley $2,275,273 $2,250,472 -1.1% $61,651,672 $72,708,205 17.9%
University of California-Davis 10,044,667 17,271,148 71.9 18,205,534 26,839,976 47.4
University of California-Irvine 8,995,464 4,086,276 -54.6 12,695,250 14,631,763 15.3
University of California-Los Angeles 2,768,965 2,883,840 4.1 54,788,661 64,875,616 18.4
University of California-Merced N/A N/A N/A N/A N/A N/A
University of California-Riverside 3,195,609 3,367,057 5.4 8,097,493 13,534,674 67.1
University of California-San Diego N/A N/A N/A N/A N/A N/A
University of California-Santa Barbara 6,789,245 8,947,803 31.8 11,513,894 14,053,136 22.1
University of California-Santa Cruz N/A N/A N/A N/A N/A N/A
Source: USA Today (http://www.usatoday.com/sports/college/ncaa-finances.htm) Note: USA Today study covered only those schools in NCAA Division I. 2004-05 and 2009-10 dollar amounts are expressed in 2011 inflation-adjusted numbers. * 2009-10 is the most recent year of data available from the USA Today study.
WHERE IS THE MONEY GOING?
Student Fees Total Operating Expenses

BEST
LA
ID P
LAN
S T
HE
UN
FULF
ILLE
D P
ROM
ISE
OF
PUBL
IC H
IGH
ER E
DU
CATI
ON
IN C
ALI
FORN
IA
34
WHERE IS THE MONEY GOING?
Facilities Utilization
In 2013, a Cal State enrollment freeze, along with a shortage of places at UC, could turn away 25,000 students or more. Newspapers feature stories of unhappy students whose dreams of higher education opportunity are thwarted. Under-utilized classrooms are a serious part of the problem. But as students clamor for access, data show that many classroom seats go unused and empty.41
In 1970, the California Legislature set high expectations for use of classrooms to ensure wide access to public higher education and full use of public funding. Rooms were to be scheduled for use 75% of the time between the hours of 8:00 a.m. and 10:00 p.m., Monday through Friday, with the further expectation that two-thirds of the seats would be filled during those hours. In accordance with further legislation passed in 1973, institutions seek to meet a minimum standard of 20 laboratory station hours per week (which typically need to take place during the daytime, 8:00 a.m. to 5:00 p.m.).42
The utilization data reported by the universities, however, shows how very far they fall below expectations. In the most recent publicly available data on space utilization at California institutions, only one school—UC-Santa Cruz—met California’s minimum standards for average weekly classroom contact of 35 hours per station per week. In the UC system, these averages range from a low of 20.8 hours at UC-Merced to 35.9 hours per week at UC-Santa Cruz. At Cal State, the range is 17.0 hours per week (California Maritime Academy) to 34.1 hours (Cal State-San Luis Obispo), with a system-wide average of 28.9 hours per week. At UCLA, large lecture halls are vacant the majority of the time on Friday afternoons.43
Average student contact hours for laboratory stations—typically among the most expensive spaces on a college campus—range from 16.8 hours at UC-Merced to 24.0 hours at UC-San Diego, among the UC campuses, and from 10.7 hours per week (Cal State-East Bay) to 28.8 hours (Cal State-Monterey Bay) among the Cal State campuses, with a system-wide average of 18.4 hours. Even allowing for new safety standards that reduce the number of stations that can be used at one time, these usage statistics are unacceptable.44
In 2000, both the University of California and California State University conducted feasibility studies on expanding services to support year-round operations (YRO), with Cal State finding that a YRO program would allow the university to “meet its master plan goals of providing access to up to 43,000 FTEs in spite of limited capital construction resources.” However, as of 2008, summer enrollment at Cal State remained at only 12% of Fall levels while UC was at less than 23%.45
California is a state devoted to sustainability—but, ironically, its colleges are wasting resources that would enable them to educate thousands more students while also saving money. As Clayton Christensen and Henry Eyring, who have analyzed “disruptive innovation” in education, argue, year-round scheduling is a crucial and feasible way to serve more students—both in-state and “destination” students who pay out-of-state tuition—at reduced cost.46
California must do better.

A REPO
RT BY THE A
MERICA
N CO
UN
CIL OF TRU
STEES AN
D A
LUM
NI
35
ARE STUDENTS GRADUATING AND DOING SO ON TIME?
Nationally, less than 58% of the full-time students who begin college earn a degree from that school in six years: 54.9% of the students in public institutions and 64.6% of the
students in private, non-profit colleges and universities. Even allowing for students who transfer and finish at another institution, these low rates put the U.S. behind global competitors. Despite spending more per student on higher education than any other Organization for Economic Co-operation and Development (OECD) country, the U.S. ranks 16th in the percentage of young adults who have completed college. Students who enter college but do not graduate represent a failed investment, with consequences for the student, the institution, and taxpayers.47
The charts on the following pages show the four- and six-year graduation rates in California for the cohort that entered in 1999 and the cohort that entered in 2004. We measured and reported the percentage of change in the graduation rates between these two cohorts. California State University overall did not fare so well as the national average: Out of 23 Cal State schools, only seven—Maritime Academy, Cal State-Channel Islands, Chico State, San Diego State, Sonoma State, and both Cal Poly campuses—surpassed it.48 The University of California,asawhole,performedbetterthanthenationalaverage;theeightschoolsthatadmitted undergraduate students for the latest cohort averaged a six-year graduation rate of 81.6%.
Retention rates for freshmen are a strong predictor of eventual success in graduation and this pattern holds true for California. Eight Cal State campuses had freshman retention rates below the national average of 79.5%. All nine of the University of California undergraduate campusesexceededthenationalaverageforfreshmenretention;fourUCcampuseshadfreshman retention rates of 95% or above.49
Of course, a baccalaureate degree is supposed to take only four years, not six. Students who entered in 2004 should have graduated in 2008 and moved forward with careers or further training. But if we look at four-year graduation rates in California institutions, only six out of 32 schools surveyed graduate more than half of their students in four years. Only two institutions—UC-Berkeley and UCLA—graduate more than 64% of students in four years, a figure that, if it were a grade, would denote a “D.” In other words, more than three-quarters
6. Are students graduating anddoing so on time?

BEST
LA
ID P
LAN
S T
HE
UN
FULF
ILLE
D P
ROM
ISE
OF
PUBL
IC H
IGH
ER E
DU
CATI
ON
IN C
ALI
FORN
IA
36
ARE STUDENTS GRADUATING AND DOING SO ON TIME?
of California’s public four-year universities fail to graduate at least half of first-time full-time students in four years.
Admittedly, some students take longer to graduate because of financial or family obligations that they must balance against progress toward degree completion. Still, the need for remedial coursework, poor academic advising, and inefficient class scheduling are also obstacles to timely graduation.
One of the successes of California higher education is the high graduation rate of the California Community College graduates who transfer to California public universities. Of the CCC students who transferred to Cal State in 2003, for example, 71.2% finished with baccalaureate degrees by 2009.50 With the far-sighted goal of increasing the rate of college completion, the Master Plan provided for the smooth progression of CCC graduates to California public universities, and subsequent legislation has attempted to enhance that process.
California’s SB 1440, passed unanimously in 2010 by both chambers of the Assembly and signed into law by Governor Schwarzenegger, guarantees CCC students who complete the 60 credit hour transfer degree a place at a Cal State university. It also promises students that they can complete their baccalaureate degrees within 60 hours without having to repeat courses similar to those already taken at the community college.51 The program is new, and only a few hundred students have so far qualified through its provisions, but even for these CCC graduates, only eight of the 23 Cal State campuses have places.
Six UC campuses (Davis, Irvine, Merced, Riverside, Santa Barbara, and Santa Cruz) have a Transfer Admission Guarantee (TAG). In a disturbing lack of cooperation, however, UC-San Diego terminated its Transfer Admission Guarantee, citing “capacity and budget issues.”52

A REPO
RT BY THE A
MERICA
N CO
UN
CIL OF TRU
STEES AN
D A
LUM
NI
37
ARE STUDENTS GRADUATING AND DOING SO ON TIME?
BACCALAUREATE GRADUATION RATES FORFIRST-TIME, FULL-TIME FRESHMEN
CALIFORNIA STATE UNIVERSITY SYSTEM
INSTITUTION 4-Year 6-Year 4-Year 6-Year 4-Year 6-Year
California Maritime Academy 25.0% 50.0% 48.0% 61.0% 23.0% 11.0%
California Polytechnic State University-San Luis Obispo 21.0 69.0 26.0 73.0 5.0 4.0
California State Polytechnic University-Pomona 9.0 46.0 19.0 57.0 10.0 11.0
California State University-Bakersfield 13.0 38.0 17.0 43.0 4.0 5.0
California State University-Channel Islands* N/A N/A 25.0 58.0 N/A N/A
California State University-Chico 15.0 52.0 20.0 62.0 5.0 10.0
California State University-Dominguez Hills 6.0 35.0 5.0 31.0 -1.0 -4.0
California State University-East Bay 17.0 44.0 15.0 45.0 -2.0 1.0
California State University-Fresno 13.0 43.0 17.0 51.0 4.0 8.0
California State University-Fullerton 14.0 48.0 16.0 51.0 2.0 3.0
California State University-Long Beach 11.0 46.0 12.0 54.0 1.0 8.0
California State University-Los Angeles 9.0 32.0 8.0 37.0 -1.0 5.0
California State University-Monterey Bay 10.0 32.0 13.0 41.0 3.0 9.0
California State University-Northridge 9.0 36.0 14.0 48.0 5.0 12.0
California State University-Sacramento 9.0 41.0 11.0 42.0 2.0 1.0
California State University-San Bernardino 10.0 42.0 13.0 44.0 3.0 2.0
California State University-San Marcos 9.0 35.0 13.0 44.0 4.0 9.0
California State University-Stanislaus 21.0 52.0 23.0 49.0 2.0 -3.0
Humboldt State University 12.0 45.0 9.0 37.0 -3.0 -8.0
San Diego State University 14.0 53.0 30.0 66.0 16.0 13.0
San Diego State University-Imperial Valley Campus** N/A N/A N/A N/A N/A N/A
San Francisco State University 9.0 40.0 14.0 48.0 5.0 8.0
San Jose State University 7.0 41.0 8.0 48.0 1.0 7.0
Sonoma State University 19.0 48.0 31.0 57.0 12.0 9.0
1999 CohortGraduation Rate
2004 CohortGraduation Rate
Change in % points
Source: IPEDSNote: Original data were reported without decimal places.* California State University-Channel Islands accepted its first freshman class in Fall 2003. ** San Diego State University-Imperial Valley Campus began offering four-year programs in 2007.
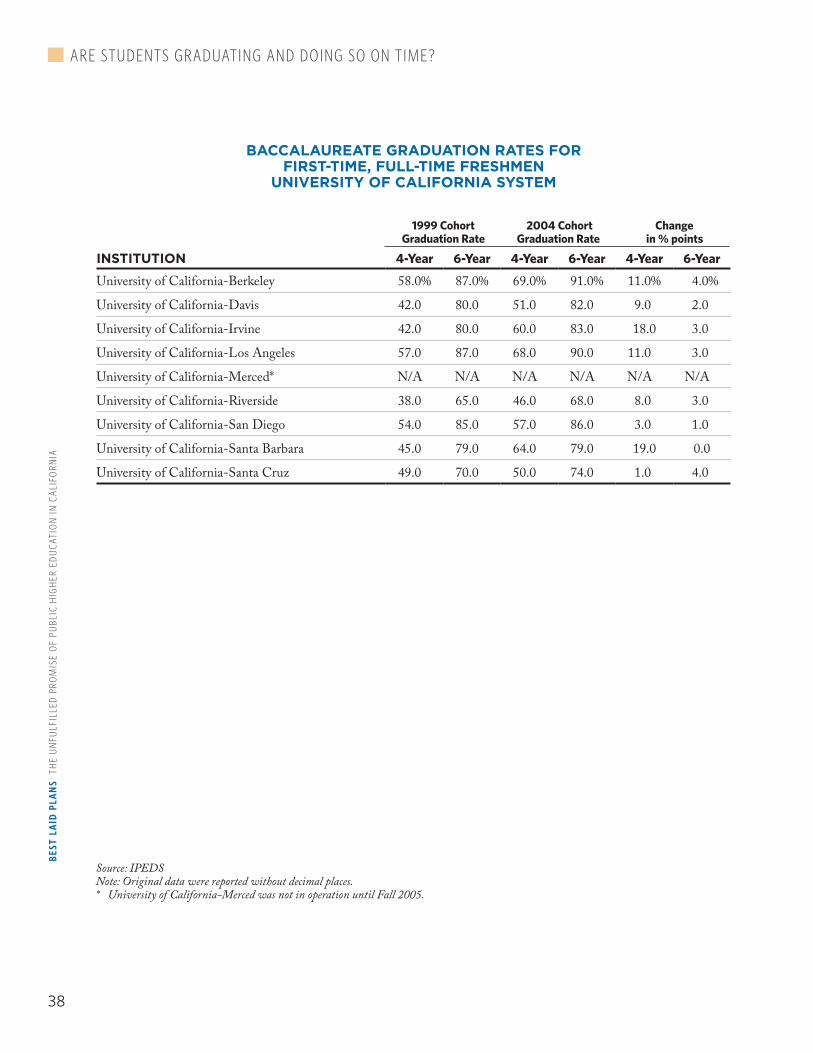
BEST
LA
ID P
LAN
S T
HE
UN
FULF
ILLE
D P
ROM
ISE
OF
PUBL
IC H
IGH
ER E
DU
CATI
ON
IN C
ALI
FORN
IA
38
ARE STUDENTS GRADUATING AND DOING SO ON TIME?
BACCALAUREATE GRADUATION RATES FORFIRST-TIME, FULL-TIME FRESHMEN
UNIVERSITY OF CALIFORNIA SYSTEM
INSTITUTION 4-Year 6-Year 4-Year 6-Year 4-Year 6-Year
University of California-Berkeley 58.0% 87.0% 69.0% 91.0% 11.0% 4.0%
University of California-Davis 42.0 80.0 51.0 82.0 9.0 2.0
University of California-Irvine 42.0 80.0 60.0 83.0 18.0 3.0
University of California-Los Angeles 57.0 87.0 68.0 90.0 11.0 3.0
University of California-Merced* N/A N/A N/A N/A N/A N/A
University of California-Riverside 38.0 65.0 46.0 68.0 8.0 3.0
University of California-San Diego 54.0 85.0 57.0 86.0 3.0 1.0
University of California-Santa Barbara 45.0 79.0 64.0 79.0 19.0 0.0
University of California-Santa Cruz 49.0 70.0 50.0 74.0 1.0 4.0
1999 CohortGraduation Rate
2004 CohortGraduation Rate
Change in % points
Source: IPEDSNote: Original data were reported without decimal places.* University of California-Merced was not in operation until Fall 2005.

Governance

BEST
LA
ID P
LAN
S T
HE
UN
FULF
ILLE
D P
ROM
ISE
OF
PUBL
IC H
IGH
ER E
DU
CATI
ON
IN C
ALI
FORN
IA
40
HOW ARE THE GOVERNING BOARDS STRUCTURED?
In 1960, a joint committee of the California State Board of Education and the Regents of the University of California authored the Master Plan, the recommendations of which became
the foundation of the Donahoe Higher Education Act. The Act and subsequent modifying legislation established the current three-tiered system of higher education, each with separate governing bodies.
Under the Master Plan, the University of California is the state’s “primary academic research institution” and provides undergraduate, graduate, and professional education. With limited exceptions, UC also has exclusive jurisdiction to offer doctoral degrees. California State University offers “undergraduate and graduate education through the master’s degree” and, under the original plan, could offer joint doctoral degrees with UC. In 2005, Cal State was granted authority to offer its own Doctor of Education (Ed.D.) program and subsequently gained authority independently to offer doctorate programs in nursing and physical therapy. The California Community College system offers “lower-division instruction that is transferable to four-year colleges, provide[s] remedial and vocational training, and grant[s] associate degrees and certificates.”53
Under the Master Plan, UC was to select from the top one-eighth (12.5%) of graduating California high school seniors, while Cal State would select from the top one-third (33.3%) of the class. The community colleges would “admit any student capable of benefiting from instruction.” California law states that transfer from community colleges to the UC and Cal Stateschoolsisa“centralinstitutionalpriorityofallsegmentsofhighereducation”;bothsystems are directed to maintain a lower-to-upper division ratio of 40:60 to facilitate transfer.54
University of California
The University of California is governed by a Board of Regents, an entity established under Article IX, Section 9 of the Constitution of the State of California. It consists of 26 voting members, 18 of whom are appointed by the governor of California (with Senate approval) for 12-yearterms,withthepossibilityofreappointment;oneisaUCstudent,appointedbytheregents;andsevenareex officio members: the Governor, Lieutenant Governor, Speaker of the Assembly, Superintendent of Public Instruction, president and vice president of the Alumni Associations of UC and the UC president. Two faculty members—the chair and vice chair of
7. How are the governing boardsstructured?

A REPO
RT BY THE A
MERICA
N CO
UN
CIL OF TRU
STEES AN
D A
LUM
NI
41
the Academic Council—serve as non-voting board members with a minimum period of service of one year.
The regents have “full powers of organization and government” over the University, subject to statutes regarding the security of funds, compliance with the terms of endowments, and competitive bidding. Under university bylaws, the regents have ten standing committees under whichmostmattersaregoverned.Theirareasare:ComplianceandAudit;Compensation;EducationalPolicy;Finance;Governance;GroundsandBuildings;HealthServices;Investments;LongRangePlanning;andOversightoftheDepartmentofEnergyLaboratories.Any matter may bypass committee and be put to the full board by a two-thirds vote of theboard;otherwise,amatterwillfirstbeplacedincommittee,whichwillthenmakearecommendation to the board.55
California State University
The California State University Board of Trustees consists of 24 voting members, 16 of whom are appointed by the governor with Senate confirmation, for eight-year terms. In addition, the governor appoints one faculty trustee from nominees proposed by the Statewide Academic Senate, and two student trustees from nominees proposed by the California State Student Association. One trustee is selected by the CSU Statewide Alumni Council. Finally, five members serve ex officio: the Governor, Lieutenant Governor, Speaker of the Assembly, State Superintendent of Public Instruction, and the Chancellor.56
University trustees hold all “powers, duties, and functions with respect to the management, administration, and control” of the California State University, and have the power to adopt rules and regulations for the government of the University. Cal State’s board has ten standingcommittees,includingAudit;CampusPlanning,BuildingsandGrounds;CollectiveBargaining;EducationalPolicy;Finance;GovernmentalRelations;InstitutionalAdvancement;OrganizationandRules;andUniversityandFacultyPersonnel.Thetenthcommittee,theCommittee of the Whole, “is responsible for all other matters to come before the board that are not otherwise assigned to another standing committee.” The board may consider any matter not before a standing committee by a two-thirds vote.57
The board’s website states the scope of its power and duties: “The Board has authority over curricular development, use of property, development of facilities, and fiscal and human resources management.” The Board’s Standing Orders also delegate to the Chancellor such responsibilities as “establishment and oversight of all academic programs . . . development and oversight of the budget, including the capital outlay program . . . appointment of personnel, development and enforcement of personnel programs and discipline and termination of personnel.”58
HOW ARE THE GOVERNING BOARDS STRUCTURED?

BEST
LA
ID P
LAN
S T
HE
UN
FULF
ILLE
D P
ROM
ISE
OF
PUBL
IC H
IGH
ER E
DU
CATI
ON
IN C
ALI
FORN
IA
42
California Postsecondary Education Commission
The California Postsecondary Education Commission (CPEC) was an independent agency consisting of 16 commissioners appointed by the executive and legislative branches, along with others representing the California Community Colleges, the California State University, the University of California, the independent colleges and universities, and the California State Board of Education. It was discontinued in 2011.
CPEC’s responsibilities included gathering data on student enrollment, educational outcomesandothereducationalpolicyissues;long-rangeplanningforcollegeanduniversitycampuses;reviewingproposeddegreeprograms;evaluatinginstitutions’budgetrequests;developingpolicyrecommendationsregardingfinancialaidprograms;andotherstrategicissues.59
* * *
It is important to clarify what it means to be a California trustee or regent. Trustees of public universities must be stewards of the public interest, helping their institutions provide a high-quality education at an affordable price. They must support their institutions but be prepared to question the status quo. While trusting the chancellor or president, they are empowered to seek other sources of information. Shared governance is important, but the board is ultimately responsible for both the academic and financial health of the institution, as well as for maintaining an appropriate campus environment. These are fiduciary responsibilities that boards cannot delegate away, and they must not confuse efforts and extensive discussions with effective action. To quote Henry Clay, “Government is a trust, and the officers of the governmentaretrustees;andboththetrustandtrusteesarecreatedforthebenefitofthepeople.”60
In what follows, we analyze board outcomes at the University of California and California State University, with particular emphasis on academic quality and fiscal accountability. The analysis covers board actions from January 2010 through January 2012, although actions prior to 2010 are discussed when necessary to give context to current initiatives. Board agendas, minutes, bylaws, and other publicly available governance documents were consulted, as were media reports. Requests for supporting or clarifying information were sent to each system’s governing board.
HOW ARE THE GOVERNING BOARDS STRUCTURED?

A REPO
RT BY THE A
MERICA
N CO
UN
CIL OF TRU
STEES AN
D A
LUM
NI
43
State law articulates “the intent of the Legislature that quality classroom instruction be continually improved and that courses required for normal progress to a baccalaureate
degree be provided in sufficient numbers.”61 As noted above, both UC and Cal State boards have full authority to effect necessary changes and improvements and to discharge their statutory duty to improve instruction and ensure efficient access toward degree completion.
University of California
Despite broad statutory authority over academic affairs, the UC regents play virtually no role in setting academic priorities or overseeing academic quality. Through Standing Order 105.2, they delegated their authority to the faculty and, since that time, the Academic Senate has interpreted the delegation as essentially removing the regents from any significant role in academic policy. The board, explains the Berkeley Academic Senate, has empowered the faculty to “determine academicpolicy;setconditionsforadmissionandthegrantingofdegrees;authorizeandsupervisecoursesandcurricula;andadvisetheadministrationonfacultyappointments,promotions, and budgets.” In what might be considered an understatement: “This delegated authority makes the UC Academic Senate unique among faculty governments.”62
The regents’ Educational Policy committee has recently investigated areas such as online instruction, faculty retention, and undergraduate admissions profiles. And in 2009, the regents charged a Commission on the Future, comprised of faculty, students, staff, alumni, and university leaders, with recommending ways to “maintain quality and lower educational delivery costs.”63 However, given the Academic Senate’s delegated authority in academic matters, it is perhaps no surprise that on the few occasions regents have tried to address academic matters, their efforts have been limited and even blocked.
Policy 2107 requires the system president to report periodically to the board the status of plans “for strengthening general education in the University.” The UC-Berkeley student paper itself editorialized that the school should “rethink whether its liberal arts education fulfills its promise: a comprehensive education.” Yet there is little evidence that this matter has commanded significant attention from the board.64
WHAT HAVE BOARDS DONE TO IMPROVE ACADEMIC QUALITY?
8. What have boards done to improve academic quality?
BEST
LA
ID P
LAN
S T
HE
UN
FULF
ILLE
D P
ROM
ISE
OF
PUBL
IC H
IGH
ER E
DU
CATI
ON
IN C
ALI
FORN
IA
44
Regents’ interest in tracking educational outcomes has had little traction. In response to a regent’s inquiry at a 2009 meeting of the board’s Long Range Planning committee, the vice provost called the inclusion of standardized student learning assessment data in the Accountability Report “controversial” and “politically loaded.” And to emphasize the point, the faculty representative to the board went on record in a letter to his fellow trustees the next year, saying that “faculty should retain responsibility for assessing student learning outcomes” and arguing “that assessment be discipline-specific and campus based.” The regents did not take executive action to implement standardized assessments, and the Accountability Report only includes self-reported measures of student learning outcomes. Meanwhile, the UC faculty has taken no steps to use standardized tests to measure student learning outcomes, notwithstanding UC president Mark Yudof’s clear support of the Voluntary System of Accountability during his time as chancellor of the University of Texas system.65
California State University
The California State University Board of Trustees has taken notable steps toward improving academic quality, one of which is the Graduation Initiative, aimed at raising system-wide graduation rates by eight percentage points by 2015-16. University administrators are charged with analyzing university-wide trends, identifying best practices for improving student engagement, and implementing campus programs.
Minutes from the board’s Educational Policy committee show active engagement by trustees, with board members asking questions about the program scope and methodology.
Similarly, trustees have taken an active role in launching Cal State’s Early Start Program, an initiative designed to address English and mathematics remediation needs. Under the new program, Cal State campuses must identify incoming freshmen for a summer remediation program designed to help students achieve college readiness in English and mathematics before they begin college-level work.66
Unlike the UC regents, Cal State’s board has remained highly active in academic policy oversight despite delegating significant authority to its chancellor for “[e]stablishment and oversight of all academic programs.” The board’s Educational Policy committee annually reviews the system’s Academic Master Plan, “a comprehensive list of campus academic plans that guide program, faculty, and facility development.” The Master Plan includes a list of new degree programs approved by trustees for development. Committee meeting minutes reflect not only a thorough review of program effectiveness, but also an ongoing dialogue among trustees, university administrators, and academic departments to ensure the process does not impose unduly burdensome reporting obligations.67
WHAT HAVE BOARDS DONE TO IMPROVE ACADEMIC QUALITY?

A REPO
RT BY THE A
MERICA
N CO
UN
CIL OF TRU
STEES AN
D A
LUM
NI
45
In notable contrast to UC, the Cal State board has for many years encouraged careful assessment of the campuses’ academic effectiveness. All 23 Cal State institutions have joined the Voluntary System of Accountability developed by the Association of Public and Land-grant Universities (APLU), and all but three have posted outcomes on assessments of students’ core collegiate skills on APLU’s College Portrait site. The assessment instrument used by most Cal State campuses is the Collegiate Learning Assessment, the same test that informed Richard Arum and Josipa Roksa’s pathbreaking 2011 study, Academically Adrift. Since 2008, board policy has also required each Cal State campus to define general education outcomes based on the “Essential Learning Outcomes” framework of the Association of American Colleges and Universities (AAC&U). These are more subjective indicators, but in combination with the CLA, they provide an additional starting point for curricular discussions.68
WHAT HAVE BOARDS DONE TO IMPROVE ACADEMIC QUALITY?

BEST
LA
ID P
LAN
S T
HE
UN
FULF
ILLE
D P
ROM
ISE
OF
PUBL
IC H
IGH
ER E
DU
CATI
ON
IN C
ALI
FORN
IA
46
In the past five years, tuition increases have skyrocketed, and tens of thousands of community college graduates have been denied the transfer to campuses that they would
easily have received four or five years ago. Outrage and frustration are evident in strikes and demonstrations and in legislative interest in radical solutions such as closing campuses deemed too expensive to maintain. Both systems have had to deal with a $750 million budget cut in 2011. And the challenge of sharp state reductions is hardly over: “trigger cuts” in state budgets still loom with the potential for very large reductions in the future. Both university systems must find ways to reduce significantly their operating expenses. Each has taken some steps toward that goal, but they are woefully inadequate to the task.69
Administrative Expenditures
The regents have taken note of UC-Berkeley’s Operational Excellence initiative, involving a seriesofprojectsdesignedtoincreaseefficiencythroughstreamliningadministrativeprocesses;however, long-term savings are not expected to accrue until 2013 at the earliest. At the system level, the university’s Working Smarter initiative in part seeks to decrease administrative costs over five years by “moving toward common, integrated financial and payroll systems, time and attendance systems, fund accounting, data warehousing, asset management, e-procurement, energy and climate solutions, indirect cost-recovery, library efficiency strategies, and risk management.” As of May 2012, the program had achieved economies of $157 million towards its goal of $500 million. The magnitude of real savings in the future is still unclear and may be substantially above $500 million. According to the university website, for example, one source of savings will come from “opportunity cost avoidance,” which the website describes as “not recorded in accounting books” and which “does not have a direct budgetary effect.”70
Anticipating a massive reduction in state funding, in 2011 the California State University Board of Trustees directed campus presidents to amass at least $250 million in savings from such measures as hiring freezes and cutting non-essential travel.71
Executive Compensation
Six years ago, UC president Robert Dynes apologized to a California State Senate panel for the university’s failure of accountability in handling executive compensation. The state legislature
WHAT HAVE BOARDS DONE TO CONTROL COSTS AND INCREASE EFFICIENCY?
9. What have boards done to control costs and increase efficiency?

A REPO
RT BY THE A
MERICA
N CO
UN
CIL OF TRU
STEES AN
D A
LUM
NI
47
WHAT HAVE BOARDS DONE TO CONTROL COSTS AND INCREASE EFFICIENCY?
echoed in its statements the public’s outrage that UC executives received millions of dollars in bonuses and perquisites in violation of public disclosure rules, even as the university was sharply raising fees. During the four-hour hearing, legislators recalled similar hearings more than ten years earlier concerning excessive compensation packages for departing executives. Later, the Senate Majority Leader remarked that “executive pockets were padded while students’ pockets were picked.”72
The regents promptly instituted reforms, but the public image of both UC and Cal State continues to suffer from compensation policies out of step with the harsh economic realities that California taxpayers and college students face. While California families are hurting financially, both systems have recently considered increasing executive compensation, as described below. Admittedly, the cost of living in California’s major urban regions exceeds the national average, and there is significant competition for talented executives. But current executive salaries are already adequate.
Nationwide, the median salary of a CEO of a doctoral-level institution is $392,150. At the nine UC schools surveyed, 44 employees earned more than the typical institution head in 2010, even after excluding medical faculty and personnel. Twenty-six Cal State staff earned salaries above $265,000, the median salary of a CEO of a master’s degree-granting institution.73
Expanding compensation packages is simply unjustifiable at a time when many Californians are feeling the effects of a long recession.
Cal State shouldered criticism in 2011, including sharp words from the governor, when the board approved a 12% tuition increase alongside a $400,000 salary for the incoming president at San Diego State University, $100,000 more than his predecessor. Compensation increases in general have, not surprisingly, been controversial. California state senator Ted Lieu, for example, wrote to Cal State chancellor Charles Reed, observing that “CSU leadership has utterly failed to ask the first and relevant question, which is whether CSU’s budget and California could afford . . . gigantic raises for CSU executives.”74
The Regents of the University of California likewise provoked criticism in 2011 by commissioning a study to review the university’s executive compensation practices with the stated concern that UC’s top executive salaries were not competitive. Newspaper coverage captured the irony: “As the university struggles with tough economic times, the UC Board of Regents met Wednesday to discuss studying recruitment of top administrators at the same time as lower-paid workers asserted that their current wages put them in poverty.”75
Under current board policy, newly appointed members of the Senior Management Group are compensated within a university-wide salary range based on positional grade and market analysis. UC system executives (president and chancellors) also receive “suitable housing as their primary residence to perform the administrative, ceremonial, and social duties required of their respective positions.” Executive officers may make up to $25,000 in capital improvements

BEST
LA
ID P
LAN
S T
HE
UN
FULF
ILLE
D P
ROM
ISE
OF
PUBL
IC H
IGH
ER E
DU
CATI
ON
IN C
ALI
FORN
IA
48
to their residence or office, without prior approval by the UC system regents, if approved by the Senior Vice President and Chief Compliance and Audit Officer. Plans for chancellors’ residences, such as the proposed $10.5 million restoration of the UC-San Diego residence, have properly drawn close attention from the regents, even when funded by private sources.76
Adding to public ire, some of UC’s top earners have vigorously resisted any accommodations to ease the financial crisis of the university. Arguing that the University has a “legal, moral, and ethical obligation” to increase the pension benefits to include payments on the portion of salary income over $245,000 (which is the federal limit), the 36 top executives have threatened a lawsuit to achieve their goal. If the demand proves successful, an executive with a $400,000 salary would see his or her pension rise from $183,750 per year to $300,000. The increased pensions could cost well over $50 million in retroactive payments, plus an ongoing increase in the university’s pension liability of $5.5 million per year. President Yudof and the regents firmly rejected the demand, but the case is still pending. The incident surely debases the University of California’s reputation and alienates the public whose tax dollars support it.77
WHAT HAVE BOARDS DONE TO CONTROL COSTS AND INCREASE EFFICIENCY?
San Diego State UniversityUC-Berkeley
$451,006
$197,300
$299,435
$128,200
Source: Chronicle of Higher EducationNote: These figures are for the 2010-2011 fiscal year. The Chronicle notes that the faculty compensation is not directly comparable to presidential compensation because the faculty data include more categories of benefits.
PRESIDENTIAL VS. FULL PROFESSOR COMPENSATION2010-2011: A Snapshot
Presidential Compensation
Average Full Professor Compensation

A REPO
RT BY THE A
MERICA
N CO
UN
CIL OF TRU
STEES AN
D A
LUM
NI
49
Capital Expenditures
Despite times of immense economic uncertainty, Cal State and UC (in particular) are indulging in a building-boom mentality.
Under University of California policy, the regents’ Committee on Grounds and Buildings is responsible for overseeing capital projects and recommending capital improvements to the full board. From 2010 to 2012, the committee approved several large projects, including $193 million for the UC-Berkeley Lower Sproul project (including $95.3 million paid for by student fees and $84.7 million in campus funds). The committee also approved $5.6 million for design plans for UC-Berkeley’s Art Museum and Pacific Film Archive, after spending $11.8 million in donor funds on project plans that will not be pursued. Overall, the University of California’s Consolidated State & Non-State Capital Financial Plan projects $2.5 billion in construction costs overthenextdecadeinordertoaccommodatepriorenrollmentgrowth;theCaliforniaStateUniversity expects to spend $2.3 billion in state funds over the next five years on new facilities, to gain the capacity for an additional 20,491 FTE in enrollment. Between 2002-03 and 2012-13, debt service payments for UC, the Hastings School of Law, and Cal State will have grown from approximately $300 million to an estimated $708 million, an average annual increase of nearly 9%. This rate of increase in debt service payments could spike even higher depending upon the number of future capital projects that the legislature approves.78
California State University’s Committee on Campus Planning, Buildings, and Grounds “is responsible for planning, development, and construction of all California State University facilities and for land use within the California State University.” Major projects approved for committee recommendation include: San Diego State’s Aztec Center Student Union project, whose $90.2 million bond would be paid by future student fees, and $56.6 million for a new recreation center at Cal Poly Pomona—which would be paid by increasing the student fee “from $269 to $832 per year starting in Fall 2014.”79
Given California’s fiscal situation, investing in new buildings and new campuses is an increasingly questionable strategy. Data show existing buildings are not even used to full capacity (see pg. 34, Facilities Utilization). The California Legislative Analyst’s Office suggests that capital requests exceed actual need. Twice, the California Postsecondary Education Commission (CPEC) recommended in vain against building a new law school at UC-Irvine, arguing that the four publicly funded law schools already in existence sufficed. Most recently, UC’s renowned Hastings Law School announced it was cutting its enrollment by 20%. Hastings’ dean, Frank Wu, was quite clear about the reasons: “I’ll say what most law deans won’t: Legal education is [in] crisis. . . . We’re at a crossroads, and unless we collectively reboot this thing, we’re in real trouble. Every law school should be thinking about this.”80
WHAT HAVE BOARDS DONE TO CONTROL COSTS AND INCREASE EFFICIENCY?

BEST
LA
ID P
LAN
S T
HE
UN
FULF
ILLE
D P
ROM
ISE
OF
PUBL
IC H
IGH
ER E
DU
CATI
ON
IN C
ALI
FORN
IA
50
The building of California’s 10th research university, UC–Merced, which opened in 2005, was a highly disputable decision particularly in the context of competing needs for research and teaching, and the critical need for increased undergraduate access to higher education. Patrick Callan, president of the National Center for Public Policy and Higher Education stated, “I don’t think there’s much evidence that California or the nation needed any more research universities.”81 While seismic upgrading is an unavoidable cost for many existing buildings, new construction is a matter of choice, and it is arguable that a traditional bricks-and-mortar solution to a shortage of space at California public universities is neither financially nor environmentally sound or sustainable.82 Throughout the nation, distance education is addressing problems of higher education access, cost, and quality. Particularly noteworthy is the growth of the online consortium Western Governors University and online programs at Stanford and MIT. California public universities have not, so far, been in the vanguard of online offerings, though the Cal State system has announced quite dramatic plans for online growth.83
In 2012 the system announced Cal State Online, which will serve as a gateway for online offerings from all 23 campuses. Set to launch in Spring 2013, the goal is ultimately to enroll over 250,000 students and so resolve the Cal State system’s grave capacity and access problems. The plan includes incentives for faculty to participate, including salary perks and recognition in promotion and tenure evaluations.84
The UC system has not to date developed any significant online plans. The regents initiated an Undergraduate Online Instruction Pilot Project in 2010, focusing on a limited number of high-demand courses described as “oversubscribed.” The university’s website reflects a roster of about three dozen courses now being offered online, but progress toward robust online programs has been slow. When Berkeley’s law school dean proposed modest experiments in online education, he encountered vehement objections.85
Program Prioritization and Productivity
When it comes to university budgets, the cost drivers are academic programs. The proliferation of programs is, therefore, an immense contributor to costs, and any efforts to reduce costs and enhance productivity must include prioritization and, where appropriate, the closing of programs. In Prioritizing Academic Programs and Services, former University of Northern Colorado president Robert C. Dickeson describes the problem: “[F]or the most part, adding academic programs results in a substantial diminution of resources for existing programs,” and the “price for academic bloat for all is impoverishment of each.” Dickeson recommends that governing boards take the lead in the important job of academic prioritization.86
WHAT HAVE BOARDS DONE TO CONTROL COSTS AND INCREASE EFFICIENCY?

A REPO
RT BY THE A
MERICA
N CO
UN
CIL OF TRU
STEES AN
D A
LUM
NI
51
The Cal State system has, in general, been a much better money manager than UC. For some time, Cal State’s board has limited the proliferation of new programs. All proposed new programs must be thoroughly reviewed, with pilot programs undergoing two board review processes, five years apart, before being approved for regular status. These are promising signs, though Cal State must increase its efforts when it comes to program elimination. In 2011, the board approved 19 new programs for planning status while discontinuing 15. There are a number of low enrollment programs, often duplicating resources at one or more campuses. In 2010-11, across the Cal State system, there were 512 degree programs with fewer than ten graduates (246 bachelor’s, 254 master’s, 12 doctorate). In 2011, eight campuses had fewer than ten graduates in their undergraduate philosophy programs, while 14 Cal State campuses had fewer than ten graduates from their “Physics, General” majors. In some cases, especially at the doctoral level, low enrollment programs are appropriate. But in these hard times, they deserve careful scrutiny.87
A more controversial Cal State initiative is the addition of doctoral programs offered independently of the UC system. When the Master Plan was launched, UC was vested with the authority to award doctoral degrees. Cal State was originally authorized to deliver doctoral programs only in partnership with UC campuses. In 2005, amidst significant controversy, Cal State obtained from the legislature authority to offer independently a doctorate in education. CPEC—before it was closed—questioned this initiative, arguing that the degree was already available from UC schools and California’s private institutions. But CPEC’s skepticism was ignored and Cal State now maintains doctoral programs, which are available elsewhere, in education and other fields.88
Although the Cal State board has done well in actively reviewing new programs, the mission creep into doctoral-level programs is a serious concern. Cal State needs to optimize its capacity to provide undergraduate and master’s-level education as envisioned in the Master Plan.
As a general matter, compared to Cal State, University of California regents have not taken an active role in overseeing academic program priorities. Across the system, there are 792 degree programs (172 bachelor’s, 314 master’s, 306 doctorate) with ten or fewer graduates per year. Five UC campuses together graduated a total of 14 undergraduate students in their Geophysics and Seismology programs, while a total of 45 students received master’s degrees in Political Science and Government from six different campuses. Board minutes note that “elimination of major programs does not occur often.”89
Prioritizing academic programs would allow for efficiencies in staffing. In 2011, the administration estimated that decreasing tenure-track faculty by 10.5% would save $100 million in salaries and benefits while maintaining the same number of overall faculty, a strategy
WHAT HAVE BOARDS DONE TO CONTROL COSTS AND INCREASE EFFICIENCY?

BEST
LA
ID P
LAN
S T
HE
UN
FULF
ILLE
D P
ROM
ISE
OF
PUBL
IC H
IGH
ER E
DU
CATI
ON
IN C
ALI
FORN
IA
52
highly compatible with academic program prioritization. The cost savings plan was not embraced. One regent even argued—wrongly—that such matters “are properly in the domain of the faculty” and outside the scope of the governing board’s purview. Faculty, meanwhile, have not been effective in cutting costs and increasing efficiency.90
A highly promising strategy to address this issue is the formation of academic consortia among institutions so that shared faculty can offer common lower-enrollment academic programs. The California Legislative Analyst’s Office specifically recommended this approach, which has already been modeled in a number of states.91 And it is one that offers possible partnerships not only with state schools but for-profits as well. Board minutes for the UC and Cal State systems suggest that neither governing board has yet taken the initiative to participate in this process—even though both universities host a number of academic programs that few students complete.
Obtaining Data for Decision-making
At the end of the day, it does not appear that trustees at either UC or Cal State have obtained all of the fine-grained data needed for decision-making. Existing reports do cover certain basic metrics such as graduation rates, but they fail to include such key information as department-by-department data on the number of courses each professor teaches and student credit hours generated by tenured, tenure-track, and non-tenure-track faculty.
In this context, it is important to note that UC’s regents have had a long—and tragic—history of failing to procure information necessary to exercise their fiduciary responsibilities. Intent on obtaining information, some have even personally conducted their own studies. In 2003, John Moores commissioned and published a study of enrollment practices. Several years later, Richard Blum released his own paper on dynamic strategy, frustrated by his desire to restructure the central administration and president’s office at a time of bloated administration. Rather than seriously examining the issues Moores raised, the board censured him. Blum was blamed by the regional accrediting team, the higher ed press, and faculty for supposedly overstepping his bounds. Fortunately, the regents later adopted a by-law authorizing their chief of staff to undertake “substantive research and analysis, planning, preparation and support and review” for the board.92
WHAT HAVE BOARDS DONE TO CONTROL COSTS AND INCREASE EFFICIENCY?

A REPO
RT BY THE A
MERICA
N CO
UN
CIL OF TRU
STEES AN
D A
LUM
NI
53
Given the challenges outlined in the report, urgent action is necessary. Trustees and regents have the authority to take such action. They must be bold in their discussions and
innovative in their solutions. Listed below are 12 key initiatives designed to address quality, access, and cost effectiveness in California public higher education.
1. Exercise fiduciary responsibilities over academic policy, assessment and accountability, capital projects, and student life. Specifically, UC regents should rescind their delegation of academic oversight to the Academic Senate. Trustees should work in partnership with faculty and administrators but must not hand over their fiduciary responsibility to them.
2. Establish and publicize clear measures of cost effectiveness and productivity. To do so, every stakeholder needs to know, department by department, the number of courses taught and student credit hours generated by each tenured, tenure-track, and non-tenure-track professor. Every stakeholder needs to know the number of hours each week that classrooms and teaching laboratories are used and the percentage of seats or stations used each week. This information needs to show usage by day of the week and hour of the day.
3. Re-conceptualize the delivery model. Do California’s public universities really need to expand traditional campuses by building more classrooms, parking structures, dorms, recreational facilities, and student unions? Across the globe, teaching and learning take place in virtual classrooms. The UC system, in particular, is woefully behind. It is time to catch up for reasons of both cost and quality.
4. Re-examine and re-prioritize the academic mission of every public institution. In these difficult times, does California need ten institutions with Carnegie classifications of “very high research activity”?93 To what extent do doctoral level programs and increased research advance the core mission of the Cal State system and serve the needs of California? It is time to re-evaluate the role of research within the UC and Cal State systems.
WHAT SHOULD GOVERNING BOARDS DO NOW?
10. What should governing boardsdo now?

BEST
LA
ID P
LAN
S T
HE
UN
FULF
ILLE
D P
ROM
ISE
OF
PUBL
IC H
IGH
ER E
DU
CATI
ON
IN C
ALI
FORN
IA
54
5. Focus on the essential. With tuition and fees skyrocketing, it is hard to justify any substantial use of institutional funds or student fees for athletic teams. Extracurricular activities are just that, and they cannot be allowed to supplant the core mission. Focus on teaching and learning.
6. Restore the core curriculum. It is too easy for students—particularly at UC—to leave college with major gaps in their education. Core requirements equip all graduates to meet the challenges of career and community. In addition, multiple sections of fundamental core courses are far less costly to staff than an array of highly specialized “distributional” options.
7. Incentivize and reward teaching. The Master Plan can only be successful if California students who have earned admission to a California public university are assured of their access to a high quality undergraduate education. Commitment to excellent teaching and, as appropriate, teaching a larger number of courses each term, should be encouraged and rewarded.
8. Assess core collegiate skills and value added. Cal State campuses should be commended for using the Collegiate Learning Assessment to test for value added in critical reasoning and writing skills. University of California campuses need to do the same. Both systems should test cohorts large enough to yield meaningful results for all of their undergraduate degree programs.
9. Leverage resources and staff for maximum efficiency. In an age of interactive video and high-tech “smart” classrooms, maintaining redundant, low enrollment programs at multiple campuses is an unjustifiable cost. UC and Cal State are well positioned to form academic consortia that will maintain student opportunities to pursue a broad array of majors while keeping institutional costs low.
10. Protect academic freedom and intellectual diversity. Boards should repeal speech codes that restrict the freedom of speech guaranteed by the U.S. Constitution, and insist that classrooms be rich in intellectual diversity and the free exchange of ideas.
11. Put a stop to mounting executive salaries and administrative bloat. Ever-increasing executive pay and perks, especially in an era of major tuition hikes, are unnecessary, unsustainable, and damaging to the institutions’ reputations.
WHAT SHOULD GOVERNING BOARDS DO NOW?

A REPO
RT BY THE A
MERICA
N CO
UN
CIL OF TRU
STEES AN
D A
LUM
NI
55
12. Recognize that the paradigm of higher education has changed. Institutions that cling to outdated practices will not be able to fulfill their missions of teaching and learning. Governing boards must direct the process of change, steering their institutions away from the interest groups that will inevitably seek to maintain the status quo.
In 1960, California came forth with a plan to fulfill, on an unprecedented scale, the state’s need for higher education. Now, California finds itself in the throes of a deep financial crisis. While the financial and political challenges are immense, there is simply no turning back. The same vision and energy that informed the Master Plan can—and must—inform the delivery of quality and affordable higher education in the face of a new economic reality. California’s education leaders have the urgent opportunity to set a model for the nation by rethinking those best laid plans and demanding a new paradigm of productive and innovative higher education.
WHAT SHOULD GOVERNING BOARDS DO NOW?

BEST
LA
ID P
LAN
S T
HE
UN
FULF
ILLE
D P
ROM
ISE
OF
PUBL
IC H
IGH
ER E
DU
CATI
ON
IN C
ALI
FORN
IA
56
End Notes
1. University of California, Office of the President, “California Master Plan for Higher Education – Major Features,” accessed April 20, 2012 <http://ucfuture.universityofcalifornia.edu/documents/ca_masterplan_summary.pdf>;LiaisonCommitteeoftheStateBoardofEducationandTheRegentsoftheUniversityofCalifornia, A Master Plan for Higher Education in California 1960-1975 (Sacramento, CA: California State DepartmentofEducation,1960),146<http://www.ucop.edu/acadinit/mastplan/MasterPlan1960.pdf>;Kathleen Maclay, “Clark Kerr’s legacy: 1960 Master Plan transformed higher education,” UC Berkeley News, December 3, 2003 <http://berkeley.edu/news/media/releases/2003/12/03_master.shtml>Steve Boilard, The Master Plan at 50: Assessing California’s Vision for Higher Education (Sacramento, CA: Legislative Analyst’s Office, 2009), 3 <http://www.lao.ca.gov/2009/edu/master_plan_intro/master_plan_intro_111209.pdf>.
2. University of California, Technology Transfer Annual Report 2011 (Oakland, CA: University of California, 2011),8<http://www.ucop.edu/ott/genresources/documents/IASRptFY11.pdf>;UniversityofCalifornia,Berkeley,“Awardsheldbyfaculty,”accessedMay22,2012<http://berkeley.edu/about/honors.shtml>;California State University, “President’s Message | Alumni Council,” accessed April 9, 2012 <http://www.calstate.edu/alumni/council/presidents-message.shtml>;CaliforniaCommunityCollegeChancellor’sOffice,“Community Colleges,” accessed April 9, 2012 <http://www.cccco.edu/communitycolleges/tabid/830/Default.aspx>;CaliforniaPostsecondaryEducationCommission,“CustomDataReports,”accessedApril9,2012 <http://www.cpec.ca.gov/OnLineData/OnLineData.asp>.
3. See pages 21-22 for data on tuition and fee increases.
4. Josh Keller, “Facing New Cuts, California’s Colleges are Shrinking Their Enrollments,” Chronicle of Higher Education, January 13, 2011 <http://chronicle.com/article/Facing-New-Cuts-Californias/125945/>;KellyPuente and Neil Nisperos, “Cal State University closes admission for spring 2013,” San Bernardino County Sun, March 19, 2012 <http://www.sbsun.com/education/ci_20209308/cal-state-university-closes-admission-spring-2013>.
5. California State University, “CSU | Analytic Studies | FTF Graduation Rates,” accessed April 10, 2012 <http://www.asd.calstate.edu/gradrates/ftf.shtml>. Data reported for the most recent cohort for which both four- and six-year data are available.
6. Legislative Analyst’s Office, Higher Education: Answers to Frequently Asked Questions. What Has Happened with Year-Round Operations? (Sacramento, CA: Legislative Analyst’s Office, 2009) <http://www.lao.ca.gov/sections/higher_ed/FAQs/Higher_Education_Issue_11.pdf>.
7. University of California, Consolidated State & Non-State Capital Financial Plan 2011-21 (Oakland, CA: University of California Office of the President, 2011), 16 <http://budget.ucop.edu/capital/201121/2011-21ConsolidatedState&Non-StateCapitalFinancialPlan.pdf>;CaliforniaStateUniversity,Capital Outlay Program 2012/2013 (Long Beach, CA: California State University Office of the Chancellor, 2012), 233 <http://www.calstate.edu/cpdc/Facilities_Planning/2012-13-Five-Year-Cap-Improvement-Prg-Bk.pdf>;SteveD. Boilard et al., The 2012-13 Budget: Analysis of the Governor’s Higher Education Proposal (Sacramento, CA: Legislative Analyst’s Office, 2012), 21 <http://www.lao.ca.gov/analysis/2012/highered/higher-ed-020812.pdf>;MarkWhitaker,A Ten-Year Perspective: California Infrastructure Spending (Sacramento, CA: Legislative Analyst’s Office, 2011) <http://lao.ca.gov/reports/2011/stadm/infrastructure/infrastructure_082511.aspx>.
8. Steve D. Boilard et al., The 2012-13 Budget: Analysis of the Governor’s Higher Education Proposal, 22.
9. GfK Roper Public Affairs & Media, “Memo RE: ACTA survey findings,” 2, accessed March 28, 2012 <http://www.whatwilltheylearn.org/public/pdfs/RoperFindings.pdf>.
10. Hart Research Associates, Raising the Bar: Employers’ Views On College Learning In The Wake Of The Economic Downturn (Washington, DC: Association Of American Colleges And Universities, 2009), 9 <http://www.aacu.org/leap/documents/2009_EmployerSurvey.pdf>;JillCasner-LottoandMaryWrightBenner,Are They Really Ready To Work?: Employers’ Perspectives on the Basic Knowledge and Applied Skills of New Entrants to the 21st Century U.S. Workforce (New York, NY and Washington, DC: The Conference Board, Inc., The Partnership for 21st Century Skills, Corporate Voices for Working Families, and the Society for Human Resource Management, 2006), Table 8 <http://www.p21.org/storage/documents/FINAL_REPORT_PDF09-29-06.pdf>.
END NOTES

A REPO
RT BY THE A
MERICA
N CO
UN
CIL OF TRU
STEES AN
D A
LUM
NI
57
11. Bureau of Labor Statistics, Number of Jobs Held, Labor Market Activity, and Earnings Growth Among the Youngest Baby Boomers: Results From a Longitudinal Survey (Washington, DC: U.S. Department of Labor, USDL-10-1243, 2010) <http://www.bls.gov/news.release/pdf/nlsoy.pdf>;UniversityofCalifornia,Berkeley,“A Liberal Arts Education | College of Letters & Science,” accessed April 13, 2012 <http://ls.berkeley.edu/about-college/liberal-arts-education>;UniversityofCalifornia,LosAngeles,General Catalog 2010-11 (Los Angeles, CA: University of California, Los Angeles, 2010), 73 <http://www.registrar.ucla.edu/archive/catalog/2010-11/uclageneralcatalog10-11.pdf>;UniversityofCalifornia,Davis,“UCDavisGeneralCatalog|General Education Requirement,” accessed April 13, 2012 <http://registrar.ucdavis.edu/UCDWebCatalog/ugraded/gereqt.html>.
12. Title 5 of the California Code of Regulations, section 40404, stipulates that “[t]o qualify for graduation each student shall demonstrate competence by completing courses ...or by passing examinations” in American history and American government. These subjects are defined by the statute as “including the historical development of American institutions and ideals, the Constitution of the United States and the operation of representative democratic government under that Constitution, and the processes of state and local government.”
13. California State University, Dominguez Hills, “General Education Courses,” accessed March 28, 2012 <http://www.csudh.edu/UAC/GE-Courses.shtml>;CaliforniaStateUniversity,DominguezHills,“GraduationWritingExam,”accessedMarch28,2012<http://www.csudh.edu/testing/GWE>;CaliforniaState University, Los Angeles, “Bachelor’s Degree: Bachelor’s Degree Requirements,” accessed April 14, 2012 <http://ecatalog.calstatela.edu/content.php?catoid=4&navoid=72>;CaliforniaStateUniversity,LosAngeles,“The General Education Program,” accessed April 14, 2012 <http://ecatalog.calstatela.edu/preview_program.php?catoid=4&poid=1284>;CaliforniaStateUniversity,EastBay,“BaccalaureateDegreeInformation,”accessedApril14,2012<http://www20.csueastbay.edu/ecat/general-info/bacc-degree-info.html>;SanFrancisco State University, “Undergraduate Graduation Requirements: SF State Bulletin 2011-2012,” accessed April14,2012<http://www.sfsu.edu/bulletin/gradreq.htm#wepr>;SanFranciscoStateUniversity,“GeneralEducation: Segments I and II,” accessed April 14, 2012 <http://www.sfsu.edu/bulletin/ge.htm>.
14. UC Davis Office of the University Registrar, “UC Davis General Catalog | General Education Courses | Arts and Humanities,” accessed March 28, 2012 <http://registrar.ucdavis.edu/UCDWebCatalog/GEAH.html>; University of California, Santa Barbara, “UC Santa Barbara General Catalog – Area D Course List,” accessedMarch28,2012<http://my.sa.ucsb.edu/Catalog/Current/UndergraduateEducation/AreaD.aspx>;University of California, Berkeley, “General Catalog – Undergraduate Education – Undergraduate Degree Requirements,”accessedMarch28,2012<http://berkeley.edu/catalog/undergrad/requirements.html>;UCDavis Office of the University Registrar, “General Education Courses - Summer Session 2, 2012,” accessed April13,2012<http://registrar4.ucdavis.edu/courses/GE_courses/index.cfm>;UniversityofCalifornia,Davis: Office of the University Registrar, General Catalog, 2010-2011, 2011-2012, Course Supplements and Policies to Requirements Addendum (Davis, CA: Office of the University Registrar, University of California, 2011), 100, 148, 170 <http://registrar.ucdavis.edu/upload/GenCatArchive/GenCatSupp20102012/GenCatSupp1012_1.8.pdf>.
15. Association of American Colleges and Universities, Academic Freedom and Educational Responsibility (Washington, DC: Association of American Colleges and Universities, 2006), 2 <http://www.aacu.org/about/statements/documents/academicfreedom.pdf>;AssociationofAmericanCollegesandUniversities,“AAC&UMembers,” accessed April 2, 2012 < http://www.aacu.org/membership/list.cfm>.
16. Association of American Colleges and Universities, Academic Freedom and Educational Responsibility,2-3;Cal.Edu.Code§66301(a);Cal.A.B.2581(2006).Thelawprohibitsschoolsfrommakingorenforcing“a rule subjecting a student to disciplinary sanction solely on the basis of conduct that is speech or other communication that, when engaged in outside a campus of those institutions, is protected from governmental restriction by the First Amendment to the United States Constitution or Section 2 of Article I of the California Constitution.”
17. University of California Office of the President, “30.00 Policy on Speech and Advocacy,” accessed March 28, 2012<http://www.ucop.edu/ucophome/coordrev/ucpolicies/aos/uc30.html>;CaliforniaStateUniversity,San Bernardino, “Policies and Procedures – Speech and Advocacy,” accessed April 16, 2012 <http://policies.csusb.edu/speechadvocacy.htm>;CaliforniaStateUniversity,ChannelIslands,“SA.07.006-PolicyonFreeSpeech and Assembly,” accessed April 16, 2012 <http://policy.csuci.edu/SA/07/SA.07.006.htm>. See also note 21.
END NOTES

BEST
LA
ID P
LAN
S T
HE
UN
FULF
ILLE
D P
ROM
ISE
OF
PUBL
IC H
IGH
ER E
DU
CATI
ON
IN C
ALI
FORN
IA
58
18. Foundation for Individual Rights in Education, “Institutions in California,” accessed April 2, 2012 <http://thefire.org/spotlight/states/CA.html>.
19. University of California, “Changes to Sections 102.09 and 102.11, Grounds for Discipline, University of California Policies Applying to Campus Activities, Organizations, and Students,” 4, October 15, 2009 <http://gsa.ucsd.edu/sites/gsa.ucsd.edu/files/pacaos10209.pdf>.
20. University of California, “Campus Climate,” accessed May 25, 2012 <https://ucsystems.ethicspointvp.com/custom/ucs_ccc/default.asp>. For examples of the University of California’s policy, see Foundation for Individual Rights in Education, “University of California, Los Angeles: Restrictions on Expressive Rights,” accessedMarch21,2012<http://thefire.org/spotlight/codes/223.html>;FoundationforIndividualRightsinEducation, “University of California, Berkeley: Restrictions on Expressive Rights,” accessed March 21, 2012 <http://thefire.org/spotlight/codes/220.html>;FoundationforIndividualRightsinEducation,“UniversityofCalifornia, Davis: Restrictions on Expressive Rights,” accessed March 21, 2012 <http://thefire.org/spotlight/codes/221.html>. For UCSB’s policy, see Foundation for Individual Rights in Education, “University of California, Santa Barbara: Restrictions on Expressive Rights,” accessed April 9, 2012 <http://thefire.org/spotlight/codes/227.html>.
21. California State University Academic Senate, “Academic Freedom for Students,” accessed April 2, 2012 <http://www.calstate.edu/AcadSen/Records/Resolutions/2003-2004/2676.shtml>. This policy appears to have originated at the campus senate level.
The same adherence to these principles is outlined in the statement of the Association of American Colleges and Universities (AAC&U):
In any education of quality, students encounter an abundance of intellectual diversity—new knowledge, different perspectives, competing ideas, and alternative claims of truth. . . . Liberal education, the nation’s signature educational tradition, helps students develop the skills of analysis and critical inquiry with particular emphasis on exploring and evaluating competing claims and different perspectives. . . . Building such intellectual and personal capacities is the right way to warn students of the inappropriateness and dangers of indoctrination . . . .”
Association of American Colleges and Universities, Academic Freedom and Educational Responsibility (Washington, DC: Association of American Colleges and Universities, 2006), 2 <http://www.aacu.org/about/statements/documents/academicfreedom.pdf>;AssociationofAmericanCollegesandUniversities,“AAC&UMembers,” accessed April 2, 2012 <http://www.aacu.org/membership/list.cfm>.
22. Regents of the University of California, “Regents Policy 2301: Policy on Course Content,” accessed April 2, 2012 <http://www.universityofcalifornia.edu/regents/policies/2301.html>.
23. Martin Trow, Californians Define Academic Freedom (Berkeley, CA: Center for Studies in Higher Education, 2005), 1-2, 6 <http://cshe.berkeley.edu/publications/docs/ROP.Trow.AcademicFreedom.3.05.pdf>.
24. Ibid., 3.
25. Ibid., 1.
26. Ibid., 7-8.
27. See John M. Ellis, Charles L. Geshekter, Peter W. Wood, Stephen H. Balch, A Crisis of Competence: The Corrupting Effect of Political Activism in the University of California (Princeton, NJ: National Association of Scholars, 2012), 10-11 <http://www.nas.org/images/documents/A_Crisis_of_Competence.pdf>:
We should note the categorical sweep of the last sentence [of the UC system’s Policy on Course Content of the Regents]: use of the classroom for political indoctrination violates the fundamental institutional character of a university. . . .
Essentially this same position can be found in the California state constitution and in the still binding policy directives of a series of UC presidents over the years. For example, Article IX, Section 9 of the constitution of the state of California provides that “The university shall be entirely independent of all political or sectarian influence and kept free therefrom.”
American Council of Trustees and Alumni: Institute for Effective Governance, Protecting the Free Exchange of Ideas: How Trustees Can Advance Intellectual Diversity on Campus (Washington, DC: American Council of Trustees and Alumni: Institute for Effective Governance, 2009) <https://www.goacta.org/publications/downloads/ProtectingFreeExchangeofIdeas.pdf>.
END NOTES

A REPO
RT BY THE A
MERICA
N CO
UN
CIL OF TRU
STEES AN
D A
LUM
NI
59
28. See John M. Ellis et al., A Crisis of Competence: The Corrupting Effect of Political Activism in the University of California; Chico Enterprise-Record Editorial Board, “Change starts with bold vision,” Chico Enterprise-Record, April 24, 2012 <http://www.chicoer.com/opinion/ci_20466377/editorial-change-starts-bold-vision>.
29. Sandy Baum and Jennifer Ma, Trends in College Pricing 2011 (New York, NY: The College Board, 2011), 15 <http://trends.collegeboard.org/downloads/College_Pricing_2011.pdf>. Until policy changes in 2010 at the UC and Cal State systems, the term of in-state “tuition” was somewhat of a misnomer. The California Master Plan for Higher Education, the committee report upon which the current higher education structure is predicated, reaffirmed a “principle of tuition-free education to residents of the state.” As such, prior to 2010, UC and Cal State schools used the term “educational fees” or “state university fees” to describe what is now referred to as tuition. See The Regents of the University of California, “Regents Policy 3101: The University of California Student Tuition and Fee Policy,” November 18, 2010 <http://www.universityofcalifornia.edu/regents/policies/3101.html>;TheCaliforniaStateUniversity,“CalStateFeePolicy—ExecutiveOrderNo.1054|CaliforniaStateUniversity,”January14,2011<http://www.calstate.edu/eo/EO-1054.html>;AlanDuke, “University of California students protest 32 percent tuition increase,” CNN.com, November 19, 2009 <http://www.cnn.com/2009/US/11/19/california.tuition.protests/index.html>;CarlaRivera,“CalStatetrustees raise tuition 12%,” Los Angeles Times, July 13, 2011, <http://articles.latimes.com/2011/jul/13/local/la-me-calstate-20110713>;NanetteAsimov,“CalStatetrusteesraisetuition9%asstudentsprotest,”San Francisco Chronicle, November 17, 2011 <http://www.sfgate.com/cgi-bin/article.cgi?f=/c/a/2011/11/16/BA2L1M001V.DTL>;MarkBaldassareetal.,PPIC Statewide Survey: Californians & higher education (San Francisco, CA: Public Policy Institute of California, 2011), 18, 9 <http://www.ppic.org/content/pubs/survey/S_1111MBS.pdf>.
30. The Regents of the University of California, “Regents Policy 3101: The University of California Student Tuition and Fee Policy,” November 18, 2011 <http://www.universityofcalifornia.edu/regents/policies/3101.html>;CaliforniaStateUniversity,“Authority,ProcessandAccountability|FeePolicy|StudentFees|Budget| Cal State,” accessed March 26, 2012 <http://www.calstate.edu/budget/student-fees/fee-policy/categories.shtml>.
31. For example, to qualify for the Cal Grant “A” program, a student from a family of four must have no more than $80,100 in total annual income, along with a minimum GPA requirement. Legislative Analyst’s Office, “Summary of LAO Findings and Recommendations on the 2012-13 Budget,” accessed May 2, 2012 <http://www.lao.ca.gov/laoapp/budgetlist/PublicSearch.aspx?Yr=2012&KeyCol=480>;CaliforniaPostsecondaryEducation Commission, “Custom Data Reports,” accessed April 13, 2012 <http://www.cpec.ca.gov/OnLineData/OnLineData.asp>;CaliforniaStudentAidCommission,2010-11 Cal Grant Program Recipients (Rancho Cordova, CA: California Student Aid Commission, 2010-2011), 6 <http://www.csac.ca.gov/pubs/forms/grnt_frm/2010-11_calgrantprogramrecipients.pdf>;NCES.ed.gov,“CollegeNavigator:Universityof California—Berkeley,” accessed May 2, 2012 <http://nces.ed.gov/collegenavigator/?q=berkeley&s=CA&l=5+7+8+9+10+17+18+19&ct=1&ic=1&id=110635#netprc>;AndrewMartinandAndrewW.Lehren,“A Generation Hobbled by the Soaring Cost of College,” New York Times, May 12, 2012 <http://www.nytimes.com/2012/05/13/business/student-loans-weighing-down-a-generation-with-heavy-debt.html>;Meta Brown et al., “Grading Student Loans,” Federal Reserve Bank of New York, March 5, 2012 <http://libertystreeteconomics.newyorkfed.org/2012/03/grading-student-loans.html>.
32. Ben Wildavsky et al., eds. Reinventing Higher Education: The Promise of Innovation (Cambridge, MA: Harvard Educational Publishing Group, 2011), 12.
33. Steve D. Boilard et al., The 2012-13 Budget: Analysis of the Governor’s Higher Education Proposal (Sacramento, CA: Legislative Analyst’s Office, 2012), 8 <http://www.lao.ca.gov/analysis/2012/highered/higher-ed-020812.pdf>.
34. Ben Wildavsky et al., eds. Reinventing Higher Education: The Promise of Innovation, 13; Joe Nation, Pension Math: How California’s Retirement Spending is Squeezing the State Budget (Stanford, CA: Stanford Institute for Economic Policy Research, 2011), 21 <http://siepr.stanford.edu/system/files/shared/Nation_Statewide_Report.pdf>.
35. Richard Vedder, Over Invested and Over Priced: American Higher Education Today (Washington, D.C.: Center for College Affordability and Productivity, 2007), 9 <http://www.cpec.ca.gov/CompleteReports/ExternalDocuments/CCAP_Report.pdf>;JayGreene,BrianKisida,andJonathanMills,Administrative Bloat at American Universities: The Real Reason for High Costs in Higher Education (Phoenix, AZ: Goldwater Institute, 2010), 9 <http://www.immagic.com/eLibrary/ARCHIVES/GENERAL/GLDWTRUS/G100817G.pdf>.
END NOTES

BEST
LA
ID P
LAN
S T
HE
UN
FULF
ILLE
D P
ROM
ISE
OF
PUBL
IC H
IGH
ER E
DU
CATI
ON
IN C
ALI
FORN
IA
60
36. Data compiled from National Center for Education Statistics, “College Navigator,” accessed March 23, 2012 <http://nces.ed.gov/collegenavigator/> and IPEDS. Steve D. Boilard et al., The 2012-13 Budget: Analysis of the Governor’s Higher Education Proposal (Sacramento, CA: Legislative Analyst’s Office, 2012), 10, 12 <http://www.lao.ca.gov/analysis/2012/highered/higher-ed-020812.pdf>.
37. University of California, “Proposed streamlining of UC Office of the President would cut spending 20 percent, reduce central work force,” Universityofcalifornia.edu, March 9, 2008 <http://www.universityofcalifornia.edu/news/article/17507>;UniversityofCalifornia,“UCOPUpdateforWeekofAugust31,” accessed April 10, 2012 <http://www.universityofcalifornia.edu/future/documents/lapp083109.pdf>.
38. Sam Hoel, “Knowing your enemy,” The California Aggie, January 10, 2012 <http://www.theaggie.org/2012/01/10/guest-opinion-knowing-your-enemy>.
39. Jodi Upton and Jack Gillum, “What NCAA schools spend on athletics,” USA Today, April 2, 2012 <http://www.usatoday.com/sports/college/ncaa-finances.htm>.
40. UC Berkeley Budget Crisis, “Intercollegiate Athletics,” Budgetcrisis.berkeley.edu, October 24, 2011 <http://budgetcrisis.berkeley.edu/?page_id=16>;RachelBachman,“Cal’sFootball-StadiumGamble,”Wall Street Journal, April 20, 2012 <http://online.wsj.com/article/SB10001424052702304432704577350214257041598.html>;KatieMarzullo,“UCBerkeleyDefendsMemorialStadiumRenovationPlan,”Abclocal.go.com, April 20, 2012 <http://abclocal.go.com/kgo/story?section=news/local/east_bay&id=8626025>.
41. Carla Rivera, “Cal State plans to freeze enrollment next spring at most campuses,” Los Angeles Times, March 20,2012<http://articles.latimes.com/2012/mar/20/local/la-me-cal-state-20120320>;CharlieSmith,“Reportfinds declining enrollment at UC and CSU related to budget cuts,” The Daily Californian, May 10, 2012 <http://www.dailycal.org/2012/05/10/report-finds-declining-enrollment-at-uc-and-csu-related-to-budget-cuts/>.
42. For classrooms, this results in an average of 35 contact hours each week with students for every seat or workstation. California State University, Fall 2009 Classroom and Teaching Laboratory Utilization Report (Long Beach, CA: California State University Office of the Chancellor), 1-3 <http://www.calstate.edu/budget/fybudget/legislative-reports/1011-Report-on-Utilitization-of-Facilities.pdf>.
43. University of California, Fall 2008 Classroom and Teaching Laboratory Utilization (Oakland, CA: University of California Office of the President, 2009), Table U-1C <http://budget.ucop.edu/legreports/0809/documents/2009-utilization-classrooms-teaching-labs.pdf>;CaliforniaStateUniversity,Fall 2009 Classroom and Teaching Laboratory Utilization Report, Table U-1C.
44. University of California, Fall 2008 Classroom and Teaching Laboratory Utilization,TableU-1T;CaliforniaStateUniversity, Fall 2009 Classroom and Teaching Laboratory Utilization Report, Table U-1T.
45. University of California, The Feasibility of Year-Round Instruction Within the University of California (Oakland, CA: University of California Office of the President, 2000) <http://www.ucop.edu/planning/documents/yrroundrpt2000.pdf>;CaliforniaStateUniversity,Feasibility Study on Year-Round Operations, (Long Beach, CA: California State University Office of the Chancellor, 2000) <http://www.calstate.edu/YearRoundOps/April_2000FinalReport.pdf>; Legislative Analyst’s Office, Higher Education: Answers to Frequently Asked Questions. What Has Happened with Year-Round Operations? (Sacramento, CA: Legislative Analyst’s Office, 2009) <http://www.lao.ca.gov/sections/higher_ed/FAQs/Higher_Education_Issue_11.pdf>.
46. Clayton M. Christensen and Henry J. Eyring, The Innovative University: Changing the DNA of Higher Education From the Inside Out (San Francisco, CA: Jossey-Bass, 2011), 256-57.
47. Susan Aud, William Hussar, et al., The Condition of Education 2011 (Washington, DC: National Center forEducationStatistics,2011),226<http://nces.ed.gov/pubs2011/2011033.pdf>;OrganizationforEconomic Co-operation and Development, Education at a Glance 2011: OECD Indicators (Paris, France: OECD Publishing, 2011), 218, 63 <http://www.oecd.org/dataoecd/61/2/48631582.pdf>. The Beginning Postsecondary Students Longitudinal Study gives somewhat higher national graduation rates, since it includes not only first-time, full-time freshmen who graduate from the same institution, but also students who transfer and receive a baccalaureate degree from another four-year institution. Alexandria Walton Radford et al., Persistence and Attainment of 2003–04 Beginning Postsecondary Students: After 6 Years (Washington, DC: National Center for Education Statistics, 2010), Table 3 <http://nces.ed.gov/pubs2011/2011151.pdf>.
48. An important caveat must be mentioned for the Cal State system graduation rates: The chart on page 37 reports graduation rates for first-time, full-time freshmen. A significant portion of Cal State’s student
END NOTES

A REPO
RT BY THE A
MERICA
N CO
UN
CIL OF TRU
STEES AN
D A
LUM
NI
61
population is comprised of students who initially transferred from the California Community College (CCC) system. In Fall 2011, Cal State admitted 37,911 students transferring from the CCC system, which is more than two-thirds of the number of first-time freshmen it also admitted. A large cohort of CCC students, moreover, seeks spring admission to Cal State campuses. The cohort graduation rates for Cal State freshmen who advance to the junior year are very similar to those of students who enter via CCC transfer. Of students who entered Cal State as first-time freshmen in Fall 2003 and advanced to junior year status, 69.9% graduated within six years of first entering college (i.e., by 2009). Among CCC transfer students who entered Cal State as sophomores and above in 2003, 71.2% graduated by 2009). California State University, “Statistical Reports: California Community College Transfers by Campus, Division, Ethnicity, and Sex, Fall 2011,” <http://www.calstate.edu/as/stat_reports/2011-2012/fccct01.htm>;CaliforniaStateUniversity,“TotalNewStudentEnrollmentbyCampus,Fall2011”<http://www.calstate.edu/as/stat_reports/2011-2012/fnse01.htm>;California State University, “CSU | Analytic Studies | Comparison,” accessed March 26, 2012 <http://www.asd.calstate.edu/gradrates/comparison.shtml>;CaliforniaStateUniversity,“CSU|AnalyticStudies|CCCTGraduation Rates in the CSU,” accessed April 18, 2012 <http://www.asd.calstate.edu/gradrates/ccct.shtml>.
49. CollegeMeasures.org, “Performance Scorecard – National,” accessed March 14, 2012 <http://collegemeasures.org/4-year_colleges/reporting/national/sm/default.aspx>. Data compiled from National Center for Education Statistics, “College Navigator,” accessed March 23, 2012 <http://nces.ed.gov/collegenavigator/> and IPEDS.
50. California State University, “CSU | Analytic Studies | CCCT Graduation Rates in the CSU,” accessed April 18, 2012 <http://www.asd.calstate.edu/gradrates/ccct.shtml>.
51. California Community Colleges Chancellor’s Office, “SB 1440 – Associate Degrees for Transfer,” accessed May20,2012<http://www.sb1440.org/>;JudyHeimanandPaulSteenhausen,Reforming the State’s Transfer Process: A Progress Report on Senate Bill 1440 (Sacramento, CA: Legislative Analyst’s Office, 2012), 3-5 <http://www.lao.ca.gov/reports/2012/edu/progress-sb-1440/progress-sb-1440-051112.pdf>.
52. Kathryn Baron, “Community colleges hurt by CSU freeze: Enrollment cuts further clog the pipeline,” svefoundation.org, March 21, 2012 <http://toped.svefoundation.org/2012/03/21/community-colleges-hurt-by-csu-freeze/>;WilliamC.FischerandRichGrosch,“LettertoChancellorMaryeAnnFoxofUniversityofCalifornia, San Diego,” San Diego and Imperial Counties Community Colleges Association, April 16, 2012 <http://www.insidehighered.com/sites/default/server_files/files/UCSD%20Alliance%20TAG%20Letter.pdf>.
53. University of California, “Major Features of the California Master Plan for Higher Education,” accessed April 9,2012<http://www.ucop.edu/acadinit/mastplan/mpsummary.htm>;SteveBoilard,The Master Plan at 50: Assessing California’s Vision for Higher Education (Sacramento, CA: Legislative Analyst’s Office, 2009), 4 <http://www.lao.ca.gov/2009/edu/master_plan_intro/master_plan_intro_111209.pdf >.
54. University of California Office of the President, “Major Features of the California Master Plan for Higher Education,” accessed March 26, 2012 <http://www.ucop.edu/acadinit/mastplan/mpsummary.htm>;Cal. Edu. Code §§ 66730, 66731, 66737.
55. Calif.Const.art.IX,§9;RegentsoftheUniversityofCalifornia,“BYLAW5.CompositionandPowersoftheCorporation,”accessedApril14,2012<http://www.universityofcalifornia.edu/regents/bylaws/bl5.html>;TheRegents of the University of California, “Bylaw 10 – Committees of The Board of Regents,” accessed March 26, 2012 <http://www.universityofcalifornia.edu/regents/bylaws/bl10.html#bl10.1>.
56. California State University, “Overview: Board of Trustees,” accessed March 23, 2012 <http://www.calstate.edu/bot/overview.shtml>.Thetwostudenttrusteesservestaggeredone-yearterms;onlytheearlier-appointedof the two may vote.
57. Cal.Edu.Code§§66606,89030;CaliforniaStateUniversity:BoardofTrustees,“RulesGoverningtheBoardof Trustees of the California State University,” revised January 25, 2012 <http://www.calstate.edu/bot/documents/rules_of_procedure.pdf>.
58. California State University, “Overview: Board of Trustees,” accessed March 23, 2012 <http://www.calstate.edu/bot/overview.shtml>;CaliforniaStateUniversity,“StandingOrdersoftheBoardofTrusteesoftheCalifornia State University,” adopted March 15, 2006 <http://www.calstate.edu/bot/documents/standing_orders.pdf>.
59. California Postsecondary Education Commission, “Commission History,” accessed March 26, 2012 <http://www.cpec.ca.gov/SecondPages/CommissionHistory.asp>;CaliforniaPostsecondaryEducationCommission,
END NOTES

BEST
LA
ID P
LAN
S T
HE
UN
FULF
ILLE
D P
ROM
ISE
OF
PUBL
IC H
IGH
ER E
DU
CATI
ON
IN C
ALI
FORN
IA
62
California Postsecondary Education Commission to Close Doors on November 18 (Sacramento, CA: California Postsecondary Education Commission, 2011) <http://www.cpec.ca.gov/PressRelease/CPEC_Final_Release.pdf>.
60. John Bartlett, Familiar Quotations, 10th ed, rev. and enl. by Nathan Haskell Dole(Boston:Little,Brown,1919;Bartleby.com, 2000), no. 5391 <http://www.bartleby.com/100/348.2.html>.
61. Cal. Edu. Code § 66015.5(a).
62. University of California, Berkeley, “UC Berkeley Academic Senate,” accessed April 14, 2012 <http://academic-senate.berkeley.edu/about-senate>. See, for example, UC-Merced, “Undergraduate Council (UGC),” accessed May 22, 2012 <http://senate.ucmerced.edu/committees/undergraduate-council-ugc>.
63. The Commission recommended strengthening academic program review to facilitate program consolidation, but also had troubling suggestions to reexamine curriculum requirements and policies to ensure that they are not overly burdensome. University of California, University of California Commission on the Future Final Report (Oakland, CA: University of California, 2010), 32 <http://ucfuture.universityofcalifornia.edu/presentations/cotf_final_report.pdf>;UniversityofCalifornia,“CommissionontheFuture-EducationandCurriculum,” accessed March 26, 2012 <http://ucfuture.universityofcalifornia.edu/education.html>.
64. Regents of the University of California, “Regents Policy 2107: UNDERGRADUATE EDUCATIONAL POLICY,”accessedApril10,2012<http://www.universityofcalifornia.edu/regents/policies/2107.html>;Daily Californian Senior Editorial Board, “Becoming balanced,” The Daily Californian, September 2, 2011 <http://www.dailycal.org/2011/09/02/becoming-balanced>.
65. Regents of the University of California, “Committee on Long-Range Planning, Minutes,” July 15, 2009, 6<http://www.universityofcalifornia.edu/regents/minutes/2009/lrp7.pdf>;HenryC.Powelletal.,“Re:Report of the Undergraduate Educational Effectiveness Task Force,” February 10, 2010 <http://www.universityofcalifornia.edu/senate/reports/hp2lp_ueetf_2.10.10.pdf>;AnneGrossodeLeon,“TheCollegiateLearning Assessment: A Tool for Measuring the Value Added of a Liberal Arts Education,” Carnegie Results (New York, NY: Carnegie Corporation of New York, 2007), 7 <http://carnegie.org/fileadmin/Media/Publications/PDF/carnegie_results_fall07.pdf>;DougLederman,“U.ofCaliforniaCatchesUponAccountability,” Inside Higher Ed, September 22, 2008 <http://www.insidehighered.com/news/2008/09/22/uc>.
66. California State University, “Welcome to the Cal State Graduation Initiative,” accessed March 26, 2012 <http://graduate.csuprojects.org.>;CaliforniaStateUniversityBoardofTrustees,“CommitteeonEducationalPolicy–January27,2010,”7,March16,2010<http://www.calstate.edu/bot/agendas/mar10/EDPOL.pdf>;California State University Board of Trustees, “Committee on Educational Policy – March 16-17, 2010,” May11,2010<http://www.calstate.edu/bot/agendas/may10/edu-policy.pdf>;CaliforniaStateUniversity,“Cal State Freshmen to Get an Early Start on Critical Skills,” May 11, 2010 <http://www.calstate.edu/pa/News/2012/Release/earlystart.shtml>.
67. California State University, “Standing Orders of the Board of Trustees of the California State University,” adoptedMarch15,2006<http://www.calstate.edu/bot/documents/standing_orders.pdf>;CaliforniaState University, “CSU Academic Master Plan: Campus Academic Plans 2011-2012” (Long Beach, CA: California State University Board of Trustees, 2011) <http://www.calstate.edu/app/programs/amp/index.shtml>;CaliforniaStateUniversity,“CaliforniaStateUniversityAcademicMasterPlan,”accessedApril20,2012<http://www.calstate.edu/app/programs/amp/1112/csu_masterplan.pdf>;CaliforniaStateUniversity,“Committee on Educational Policy – March 16, 2010,” March 16, 2010, esp. Agenda Item 3, p. 6 <http://www.calstate.edu/bot/agendas/mar10/EDPOL.pdf>;CaliforniaStateUniversity,“CommitteeonEducationalPolicy – March 22, 2011,” March 22, 2011 <http://www.calstate.edu/bot/agendas/mar11/EdPol.pdf>. The commitment to continuous academic improvement is evident in the academic review process, of which Cal Poly Pomona can serve as an example:
The purpose of academic program review (APR) is to encourage excellence in the instructional program. Areas of the academic programs that are reviewed include: curriculum, instruction, assessment of student learning, advising, faculty professional development and service, and student involvement and satisfaction. In addition, there should be an examination of the program’s financial and physical resources.
California State Polytechnic University, Pomona, “Program Review,” accessed March 27, 2012 <http://www.csupomona.edu/~academic/programs/programreview>.
END NOTES

A REPO
RT BY THE A
MERICA
N CO
UN
CIL OF TRU
STEES AN
D A
LUM
NI
63
68. California State University, “Committee on Educational Policy – September 19, 2007,” November 13, 2007<http://www.calstate.edu/bot/agendas/nov07/EdPol.pdf>;CollegePortraitofUndergraduateEducation,“InstitutionsinCalifornia,”accessedMarch27,2012<http://www.collegeportraits.org/CA>;California State University, “General Education Breadth Requirements – Executive Order No. 1033,” June 18, 2008 <http://www.calstate.edu/eo/EO-1033.html>.
69. Malia Wollan and Tamar Lewin, “Students Protest Tuition Increases,” New York Times, November 20,2009<http://www.nytimes.com/2009/11/21/us/21tuition.html?_r=1>;NanetteAsimov,“CSUtuition could go up again without state aid,” San Francisco Chronicle, November 9, 2011 <http://www.sfgate.com/cgi-bin/article.cgi?f=/c/a/2011/11/08/BA3E1LRRFF.DTL>;JustinBertonandNanetteAsimov, “Huge protest at UC Berkeley – vote to set up camp,” San Francisco Chronicle, November 16, 2011<http://www.sfgate.com/cgi-bin/article.cgi?f=/c/a/2011/11/15/MN7V1LVH5N.DTL>;JoshKeller, “Facing New Cuts, California’s Colleges Are Shrinking Their Enrollments,” Chronicle of Higher Education,January13,2011<http://chronicle.com/article/Facing-New-Cuts-Californias/125945>;WyattBuchanan, “State Senate hearing on all-cuts budget solution,” San Francisco Chronicle, April 8, 2011 <http://www.sfgate.com/cgi-bin/article.cgi?f=/c/a/2011/04/07/BANG1ISFBN.DTL>;AngelaRuggiero,“One cost-cutting option for UC: close some campuses,” Capitol Weekly, July 30, 2009 <http://www.capitolweekly.net/article.php?xid=y5qkop44pmhi70>;VanessaRomo,“California’srevisedbudget:Public higher education faces continued budget crunch,” KPCC, May 15, 2012 <http://www.scpr.org/blogs/education/2012/05/15/6122/public-higher-education-california-faces-continued/>;CaliforniaStateUniversity, “Public Affairs: Governor’s May Revision Avoids Direct Cuts to California State University,” May 14, 2012 <http://www.calstate.edu/pa/News/2012/Release/mayrevise.shtml>.
70. Regents of the University of California, “Committee on Finance – March 24, 2010,” 3, March 24, 2010 <http://www.universityofcalifornia.edu/regents/minutes/2010/fin3.pdf>;UCBerkeley,“UCBerkeleyOE–Vision–Approach”accessedMarch28,2012<http://oe.berkeley.edu/vision/approach.shtml>;University of California, “Projects | Working Smarter,” accessed March 28, 2012 <http://workingsmarter.universityofcalifornia.edu/projects>;UniversityofCalifornia,“FiscalImpact|WorkingSmarter,”accessed May 29, 2012 <http://workingsmarter.universityofcalifornia.edu/fiscal-impact>.
71. California State University Board of Trustees, “Committee on Finance – May 9-10, 2011”, 3-4, Attachment A, May 10, 2011 <http://www.calstate.edu/bot/agendas/may11/Finance.pdf>.
72. Carolyn Jones, “Dynes quitting as head of UC – presided over compensation scandal,” San Francisco Chronicle, August 14, 2007 <http://www.sfgate.com/cgi-bin/article.cgi?f=/c/a/2007/08/14/MNVNRHPJA.DTL&ao=all>;RebeccaTrounson,“UCExecutivePayIssueDrawsChief’sApology,”Los Angeles Times, February9,2006<http://articles.latimes.com/2006/feb/09/local/me-uc9>;UniversityofCalifornia,“UCPresidentAnnouncesExecutiveCompensationReforms;RecommendsAdditionalChanges,”September20,2006 <http://www.universityofcalifornia.edu/news/article/20478>.
73. Chronicle of Higher Education, “Median Salaries of Senior College Administrators by Job Category and Type of Institution, 2011-12,” February 27, 2012 <http://chronicle.com/article/Median-Salaries-of-Senior/130897>;Sacramento Bee, “State Worker Salary Search,” February 2, 2012 <http://www.sacbee.com/statepay>.
At this time, California public universities remain in a relatively favorable position for faculty compensation levels. UCLA’s average salary is drawn upward by the large number of medical faculty, but other UC campuses are also in the upper quartile nationally. At UC-Berkeley, the average faculty salary of $154,000 for a full professor ranked in the 89th percentile of doctoral institutions, while UCSB’s average of $138,600 still ranked in the 76th percentile. The average base salary of a professor at California State University was $95,652 in 2010;however,over1,000employeesalsoparticipateintheschool’sFacultyEarlyRetirementProgram,whichallows members to work part-time and collect both salary and pension benefits. Chronicle of Higher Education, “What Professors Make – Labor & Work-Life Issues, University of California at Berkeley,” accessed April 9,2012<http://chronicle.com/article/faculty-salaries-data-2012/131431#id=110635>;Chronicle of Higher Education, “What Professors Make – Labor & Work-Life Issues, University of California at Santa Barbara,” accessed April 9, 2012 <http://chronicle.com/article/faculty-salaries-data-2012/131431#id=110705> California State University, “Salary | CSU Faculty | Employee Profiles | HR | CSU,” accessed April 9, 2012 < http://www.calstate.edu/hr/employee-profile/2010/faculty/salary.shtml>;TimothySandoval,“PayforretiredCSU professors seen as ‘double dip’,” Orange County Register, November 23, 2011 <http://www.ocregister.com/articles/csu-328504-ferp-faculty.html>.
END NOTES

BEST
LA
ID P
LAN
S T
HE
UN
FULF
ILLE
D P
ROM
ISE
OF
PUBL
IC H
IGH
ER E
DU
CATI
ON
IN C
ALI
FORN
IA
64
74. Carla Rivera, “Cal State trustees raise tuition 12%,” Los Angeles Times, July 13, 2011 <http://articles.latimes.com/2011/jul/13/local/la-me-calstate-20110713>;TedW.Lieu,“Sen.Lieusaysexecutivecompensationplanfacing CSU vote Wednesday flies in face of fairness, economic reality,” California State Senate, January 23, 2012 <http://sd28.senate.ca.gov/news/2012-01-23-sen-lieu-says-executive-compensation-plan-facing-csu-vote-wednesday-flies-face-fairn>.
Current Cal State policy bases executive compensation on “periodic market comparison” against similar institutions, with a provision limiting the compensation of new campus presidents to “no more than 10 percent above the previous incumbent’s base pay.” Campus presidents also receive between $50,000 and $60,000 in an annual housing allowance, along with a $1,000 per month vehicle allowance.
The board recently resolved to freeze state-funded pay for new presidents but to allow college foundations to boost their salaries by up to 10% above the salary of their predecessors. This drew the sharp criticism of Lt. Governor Gavin Newsom, who serves as a Cal State trustee.
California State University, “Special Committee on Presidential Selection and Compensation: Policy on Presidential Compensation - January 24-25, 2012,” May 7-9, 2012 <http://www.calstate.edu/exec_comp/documents/compensation_policy_updates_bot.pdf>;CaliforniaStateUniversity,“Housing&AutoAllowances,” accessed March 27, 2012 <http://www.calstate.edu/exec_comp/documents/housing_auto_allowance.doc>;CarlaRivera,“CalStatepanelOKspresidentialpayfreeze,lettinggroupschipin,”Los Angeles Times, May 9, 2012 <http://www.latimes.com/news/local/la-me-0509-calstate-20120509,0,5543959.story>;JackStriplingandAndreaFuller,“PresidentialPayisStillaPotentialPoliticalTarget:Onepublicsystem struggles to recruit the best amid scrutiny,” Chronicle of Higher Education, May 20, 2012 <http://chronicle.com/article/Presidents-Pay-Remains-a/131914/?sid=at&utm_source=at&utm_medium=en>.
75. Regents of the University of California, “Committee on Compensation – September 14-15, 2011,” 1-2, September14-15,2011<http://www.universityofcalifornia.edu/regents/minutes/2011/comp9.pdf>;JessicaRossoni, “Regents intend to study chancellor compensation,” The Daily Californian, September 9, 2011 <http://www.dailycal.org/2011/09/14/regents-intend-to-study-chancellor-compensation>
76. University of California, “Senior Management Group Salary and Appointment,” September 16, 2010, <http://www.universityofcalifornia.edu/regents/policies/7701.pdf>. Regents must also approve any cash compensation package above $275,000, regardless of management group status. University of California, “Report on Compensation Policies and Practices,” 7, February 3, 2009 <http://www.universityofcalifornia.edu/news/compensation/comppolpracfeb09.pdf>;RegentsoftheUniversityofCalifornia,“RegentsPolicy7708,”February9,2009<http://www.universityofcalifornia.edu/regents/policies/7708.pdf>;MattPotter,“UCSD Proposes To Spend $10.5 Million on Chancellor’s Mansion,” San Diego Reader, July 14, 2011 <http://www.sandiegoreader.com/weblogs/news-ticker/2011/jul/14/ucsd-proposes-to-spend-105-million-on-chancellors-/>.
77. Nanette Azimov, “Highest-paid UC execs demand millions in benefits,” San Francisco Chronicle, December 29,2010<http://www.sfgate.com/cgi-bin/article.cgi?f=/c/a/2010/12/29/MNDC1GUSCT.DTL&ao=3>;UCLA Faculty Association Blog, “Will There Be a Pension Lawsuit Over the Cap for the Highly Paid?,” March 17, 2012 <http://uclafacultyassociation.blogspot.com/2012/03/will-there-be-pension-lawsuit-over-cap.html>.
78. Regents of the University of California, “12.4 Committee on Grounds and Buildings,” accessed March 28, 2012<http://www.universityofcalifornia.edu/regents/bylaws/bl12.html#bl12.4>; Regents of the University of California, “Committee on Grounds and Buildings – November 28, 2011,” 2-4, November 28, 2011 <http://www.universityofcalifornia.edu/regents/minutes/2011/gb11.pdf>;RegentsoftheUniversityof California, “Committee on Grounds and Buildings – May 19, 2010,” 4, 6-7, May 19, 2010 <http://www.universityofcalifornia.edu/regents/minutes/2010/gb5.pdf>; University of California, Consolidated State & Non-State Capital Financial Plan 2011-21 (Oakland, CA: University of California Office of the President, 2011), 16 <http://budget.ucop.edu/capital/201121/2011-21ConsolidatedState&Non-StateCapitalFinancialPlan.pdf>;CaliforniaStateUniversity,Capital Outlay Program 2012/2013 (Long Beach, CA: California State University Office of the Chancellor, 2012), 233 <http://www.calstate.edu/cpdc/Facilities_Planning/2012-13-Five-Year-Cap-Improvement-Prg-Bk.pdf>;SteveD.Boilardetal.,The 2012-13 Budget: Analysis of the Governor’s Higher Education Proposal (Sacramento, CA: Legislative Analyst’s Office, 2012), 22 <http://www.lao.ca.gov/analysis/2012/highered/higher-ed-020812.pdf>.
79. California State University, “Rules Governing the Board of Trustees of the California State University,” January25,2012,<http://www.calstate.edu/bot/documents/rules_of_procedure.pdf>;CaliforniaState
END NOTES

A REPO
RT BY THE A
MERICA
N CO
UN
CIL OF TRU
STEES AN
D A
LUM
NI
65
University, “Committee on Campus Planning, Buildings and Grounds – May 11-12, 2010,” Agenda Item 1,May11,2010<http://www.calstate.edu/bot/agendas/may10/CPBG.pdf>;CaliforniaStateUniversity,“Committee on Campus Planning, Buildings and Grounds – September 21-22, 2010,” Agenda Item 2, September21,2010<http://www.calstate.edu/bot/agendas/sep10/CPBG.pdf>;CaliforniaStateUniversity,“Committee on Campus Planning, Buildings and Grounds – March 21-22, 2011,” Agenda Item 1, March 22, 2011 <http://www.calstate.edu/bot/agendas/mar11/CPBG.pdf>.
80. Steve D. Boilard et al., The 2012-13 Budget: Analysis of the Governor’s Higher Education Proposal (Sacramento, CA: Legislative Analyst’s Office, 2012), 21 <http://www.lao.ca.gov/analysis/2012/highered/higher-ed-020812.pdf>;CaliforniaPostsecondaryEducationCommittee,“ReviewofaProposaltoEstablishaSchool of Law at the University of California, Irvine,” March, 2007 <http://www.cpec.ca.gov/completereports/2007reports/07-01.pdf>;VelmaMontoya,“Wedon’tneedanotherlawschool,”San Diego Union-Tribune, February9,2007<http://www.utsandiego.com/uniontrib/20070209/news_lz1e9montoya.html>;KarenSloan,“Hastings College cutbacks a response to legal education’s ‘crisis’,” National Law Journal, April 30, 2012 <http://www.law.com/jsp/nlj/PubArticleNLJ.jsp?id=1202550750392>.
81. Charlotte Allen, “Boondoggle U.,” The Weekly Standard, April 23, 2012 <http://www.weeklystandard.com/articles/boondoggle-u_637015.html>.
82. It is a positive sign that the proposal UCLA presented at the March 28, 2012 meeting of the Board of Regents to build a $162 million hotel and conference center encountered scrutiny and skepticism. In unusually focused questioning, the regents challenged the high cost per room and why alternatives such as buying an existing nearby hotel were not explored. According to a member of the UCLA Faculty Association, the project’s original design was “grandiose,” and information was not given to the regents in a timely manner. Regents of the University of California, “Amendment of the budget and approval of external financing and standby financing,” University of California – Committee on Grounds and Buildings, March 28, 2012 <http://www.universityofcalifornia.edu/regents/regmeet/mar12/gb1.pdf>;AndraLim,“Regentsexpressdoubt over funding model for UCLA conference center, hotel,” Daily Bruin, April 3, 2012 <http://www.dailybruin.com/index.php/blog/timestamp/2012/03/regents_express_doubt_over_funding_model_for_ucla_conference_center_hotel>;UCLAFacultyAssociationBlog,“TheStorySoFar:Part2–HotelProvesHighlyEmbarrassing for UCLA,” March 28, 2012 <http://uclafacultyassociation.blogspot.com/2012/03/story-so-far-part-2-hotel-proves-highly.html>.
83. Western Governors University, “Western Governors University Enrollment Tops 25,000,” May 17, 2011 <http://www.wgu.edu/about_WGU/enrollment_tops_25000_5-17-11>;SteveKolowich,“OpenCourseWare2.0: Stanford’s open courses raise questions about true value of elite education,” Inside Higher Ed, December 13, 2011 <http://www.insidehighered.com/news/2011/12/13/stanfords-open-courses-raise-questions-about-true-value-elite-education>;MarcParry,“MITWillOfferCertificatestoOutsideStudentsWhoTakeItsOnline Courses,” Chronicle of Higher Education, December 19, 2011 <http://chronicle.com/article/article-content/130121/>.
84. Steve Kolowich, “Cal State’s Online Plan,” Inside Higher Ed, March 5, 2012 <http://www.insidehighered.com/news/2012/03/05/california-state-rolls-out-plan-centralized-online-learning-portal>.
85. University of California Office of the President, “Courses Selected for Development,” March 2, 2012 <http://www.ucop.edu/appc/online-instruction/details/selected-courses.html>;SteveKolowich,“CaliforniaDreamer,” Inside Higher Ed, August 3, 2010 <http://www.insidehighered.com/news/2010/08/03/california>.
86. Robert C. Dickeson, Prioritizing Academic Programs and Services: Reallocating Resources to Achieve Strategic Balance (San Francisco, CA: Jossey-Bass, 2010), 17, 23, 27-29.
87. California State University Board of Trustees, “Committee on Educational Policy – Academic Planning and Program Review – March 21-22, 2011”, Agenda Item 1, March 22, 2011 <http://www.calstate.edu/bot/agendas/mar11/EdPol.pdf>. Data on program enrollment was compiled from National Center for Education Statistics, “College Navigator,” accessed March 23, 2012 <http://nces.ed.gov/collegenavigator/>.
88. California Postsecondary Education Commission, The Production and Utilization of Education Doctorates for Administrators in California’s Public Schools: A Report in Response to Assembly Bill 1279 (Sacramento, CA: California Postsecondary Education Commission, 2000), 5-8 <http://www.ucop.edu/acadinit/mastplan/edd/cpec_education_doctorates_report_00-09.pdf>;JuliusZelmanowitz,“LettertoDr.WarrenH.Fox,ExecutiveDirector, California Postsecondary Education Commission,” September 28, 2000 <http://www.ucop.edu/acadinit/mastplan/edd/uccpecedd.htm>;CaliforniaStateUniversity,Meeting California’s Need for the
END NOTES

BEST
LA
ID P
LAN
S T
HE
UN
FULF
ILLE
D P
ROM
ISE
OF
PUBL
IC H
IGH
ER E
DU
CATI
ON
IN C
ALI
FORN
IA
66
Education Doctorate: A Report Examining California’s Needs for More Holders—and Suppliers—of Education Doctorates (Long Beach, CA: CSU Office of the Chancellor, 2001) 2 <http://www.ucop.edu/acadinit/mastplan/edd/2108EddReport.pdf>.
89. Data on program enrollment was compiled from National Center for Education Statistics, “College Navigator,” accessed March 23, 2012 <http://nces.ed.gov/collegenavigator/>. Regents of the University of California, “Committee on Finance – March 24, 2010,” 4, March 24, 2010 <http://www.universityofcalifornia.edu/regents/minutes/2010/fin3.pdf>.
90. Regents of the University of California, “Committee on Finance – March 16-17, 2011,” 22, 28, March 16-17, 2011 <http://www.universityofcalifornia.edu/regents/minutes/2011/fin3.pdf>.
91. Paul Steenhausen, The Master Plan at 50: Using Distance Education to Increase College Access and Efficiency (Sacramento, CA: Legislative Analyst’s Office, 2010), 19 <http://www.lao.ca.gov/reports/2010/edu/distance_ed/distance_ed_102510.pdf>;Chronicle of Higher Education, “5 Private Liberal-Arts Colleges Will Share a Professor,” March 7, 2012 <http://chronicle.com/blogs/ticker/5-private-liberal-arts-colleges-will-share-a-professor/41231?sid=at&utm_source=at&utm_medium=en>;MichaelSewall,“Pennsylvania’sStateSystemUrges Collaborative Degrees Across Its Campuses,” Chronicle of Higher Education, June 15, 2010 <http://chronicle.com/article/Pennsylvanias-State-System/65953/?sid=at&utm_source=at&utm_medium=en>;JeffSelingo, “A Liberal-Arts Consortium Experiments With Course Sharing,” Chronicle of Higher Education, April 4, 2012 < http://chronicle.com/blogs/next/2012/04/04/a-liberal-arts-consortium-looks-into-course-sharing/?sid=pm&utm_source=pm&utm_medium=en>.
92. Ward Connerly, “Trustee Out, Diversity In?,” Minding the Campus: Reforming Our Universities, December 13,2007<http://www.mindingthecampus.com/originals/2007/12/ucs_latest_diversity_con.html>;DougLederman, “At U. of California, a Systematic Governance Crisis,” Inside Higher Ed, March 3, 2008 <http://www.insidehighered.com/news/2008/03/03/uc>. The report of the WASC Special Visit Team, October 23-24, 2007, criticized Chairman Blum for “individual rather than collective action” and the board for being “unnecessarily harsh in their treatment of UC administrators, faculty, and staff.” John T. Casteen III et al., Report of the WASC Special Visit Team to the University of California Office of the President and Board of Regents (Alameda, CA: Western Association of Schools and Colleges, 2007) 13, 15 <http://www.universityofcalifornia.edu/future/WASC%20special%20visit%20team%20report.pdf>;EleanorYangSu,“Moores suddenly quits UC regents board,” San Diego Union-Tribune, November 13, 2007 <http://www.utsandiego.com/uniontrib/20071113/news_1n13uc.html>;EleanorYangSu,“UCregents’chairissuescolleagues a ‘call to action’,” San Diego Union-Tribune, August 23, 2007 <http://www.utsandiego.com/uniontrib/20070823/news_1n23regents.html>.
93. The newest UC institution, UC-Merced, moreover, does not yet have a Carnegie classification, but its stated mission is to be “consistent with our sister campuses such as UCLA and UC Berkeley.” University of California, Merced, “About UC Merced,” accessed April 10, 2012 <http://www.ucmerced.edu/about-uc-merced>.
END NOTES

Appendices

BEST
LA
ID P
LAN
S T
HE
UN
FULF
ILLE
D P
ROM
ISE
OF
PUBL
IC H
IGH
ER E
DU
CATI
ON
IN C
ALI
FORN
IA
68
Appendix A
CRITERIA FOR CORE COURSES
Distribution requirements on most campuses today permit students to pick from a wide range of courses that often are narrow or even outside the stated field altogether. Accordingly, to determine whether institutions in fact have a solid core curriculum, ACTA defines success in each of the seven subject areas as follows:
CompositionAn introductory college writing class focusing on grammar, clarity, argument, and appropriate expository style. Remedial courses and SAT/ACT scores may not be used to satisfy a composition requirement. University-administered exams or portfolios are acceptable only when they are used to determine exceptional pre-college preparation for students. Writing-intensive courses, “writing across the curriculum” seminars, and writing for a discipline are not acceptable unless there is an indication of clear provisions for multiple writing assignments, instructor feedback, revision and resubmission of student writing, and explicit language concerning the mechanics of formal writing, including such elements as grammar, sentence structure, coherence, and documentation.
LiteratureA comprehensive literature survey or a selection of courses of which a clear majority are surveys and the remainder are literature courses that may be based on a single-author or organized by theme. Freshman seminars, humanities sequences, or other specialized courses that include a substantial literature survey component count.
Foreign LanguageCompetency at the intermediate level, defined as at least three semesters of college-level study in any foreign language. No distinction is made between B.A. and B.S. degrees, or individual majors within these degrees, when applying the Foreign Language criteria.
U.S. Government or HistoryA survey course in either U.S. government or history with enough chronological and topical breadth to expose students to the sweep of American history and institutions. Narrow, niche courses do not count for the requirement, nor do courses that only focus on a limited chronological period or a specific state or region. State- or university-administered, and/or state-mandated, exams are accepted for credit on a case-by-case basis.
EconomicsA course covering basic economic principles, preferably an introductory micro- or macroeconomics course taught by faculty from the economics or business department.
APPENDIX A

A REPO
RT BY THE A
MERICA
N CO
UN
CIL OF TRU
STEES AN
D A
LUM
NI
69
MathematicsA college-level course in mathematics. Specific topics may vary, but must involve study beyond the level of intermediate algebra and cover topics beyond those typical of a college-preparatory high school curriculum. Remedial courses or SAT/ACT scores may not be used as substitutes. Courses in formal or symbolic logic, computer science with programming, and linguistics involving formal analysis count.
Natural or Physical ScienceA course in astronomy, biology, chemistry, geology, physical geography, physics, or environmental science, preferably with a laboratory component. Overly narrow courses, courses with weak scientific content, and courses taught by faculty outside of the science departments do not count. Psychology courses count if they are focused on the biological, chemical, or neuroscientific aspects of the field.
Half-CreditIf a requirement exists from which students choose between otherwise qualifying courses within two subjectareas(e.g.,mathorscience;historyoreconomics,etc.),one-halfcreditisgivenforbothsubjects.
APPENDIX A

BEST
LA
ID P
LAN
S T
HE
UN
FULF
ILLE
D P
ROM
ISE
OF
PUBL
IC H
IGH
ER E
DU
CATI
ON
IN C
ALI
FORN
IA
70
Appendix B
SCHOOL EVALUATION NOTES FOR CORE COURSES
Below we explain why we did not count certain courses that might appear, at first glance, to meet core requirements. The colleges are listed alphabetically.
California State Polytechnic University-Pomona. No credit given for Composition because the “Written Communication” section of the “Communication and Critical Thinking” requirement may be satisfied by a course that does not focus on composition and writing instruction.
California State University-Bakersfield. No credit given for Literature because it is one of five areas of the “Arts and Humanities” requirement from which students need only choose three. No credit given for Foreign Language because the requirement may be satisfied by elementary-level study. No credit given for Economics because it is one of five areas of the “Social and Behavioral Sciences” requirement from which students need only choose three.
California State University-Channel Islands. No credit given for Composition because the “English Writing” requirement may be satisfied by courses that do not focus primarily on composition and writing instruction. No credit given for Literature because the Literature requirement may be satisfied by niche courses or courses narrow in scope. No credit given for Foreign Language because students may fulfill the requirement with elementary-level study. No credit given for Mathematics because the “Mathematics and Applications” and “Computers and Information Technology” requirements may be satisfied by courses with little college-level math content.
California State University-Chico. No credit given for Literature because literature and foreign language are folded into the “Languages and Literature” requirement, and students may avoid literature by taking a language course. No credit given for Foreign Language because literature and foreign language are folded into the “Languages and Literature” requirement, and students may avoid foreign language by taking a literature course. Furthermore, students may fulfill the requirement with elementary-level study. No credit given for Mathematics because the “Quantitative Reasoning” requirement may be satisfied by courses with little college-level math content.
California State University-Dominguez Hills. No credit given for Literature because the “Letters” requirement may be fulfilled with non-literature courses. No credit given for Foreign Language because language study is only an option in the “Letters” requirement.
California State University-Fresno. No credit given for Foreign Language because language study is only an option in the “Humanities” requirement.
California State University-Long Beach. No credit given for Literature because the “Humanities: Literature, Philosophy, Foreign Languages” requirement may be fulfilled with non-literature courses. No credit given for Foreign Language because language study is only an option in the “Humanities: Literature, Philosophy, Foreign Languages” requirement.
California State University-Los Angeles. No credit given for Literature because the “Humanities” requirement may be fulfilled with non-literature courses. No credit given for Foreign Language because language study is only an option in the “Humanities” requirement.
APPENDIX B

A REPO
RT BY THE A
MERICA
N CO
UN
CIL OF TRU
STEES AN
D A
LUM
NI
71
California State University-Monterey Bay. No credit given for Composition because the “English Communication” requirement may be satisfied by writing-intensive courses offered in a range of departments that do not focus primarily on composition and writing instruction. No credit given for Literature because the “Literature and Popular Culture” requirement may be fulfilled with non-literature courses. No credit given for U.S. Government or History because the “Democratic Participation” and “U.S. Histories” requirements may be satisfied by courses narrow in scope.
California State University-Northridge. No credit given for Foreign Language because students may fulfill the requirement with elementary-level study.
California State University-Sacramento. No credit given for Literature because the “Humanities” requirement may be fulfilled with non-literature courses. No credit given for Foreign Language because students may fulfill the requirement with elementary-level study.
California State University-San Bernardino. No credit given for Foreign Language because students may fulfill the requirement with elementary-level study.
California State University-Stanislaus. No credit given for Literature because the “Literature/Philoso-phy” requirement may be fulfilled with non-literature courses. No credit given for Foreign Language because students may fulfill the requirement with elementary-level study. No credit given for Econom-ics because it is one of six areas of the “Human Institutions: Structures and Processes” requirement, from which students need only select one. No credit given for Mathematics because the “Mathematics” requirement may be satisfied by courses with little college-level math content.
Humboldt State University. No credit given for Foreign Language because language study is only an option in the “Humanities” requirement.
San Diego State University. No credit given for Literature because the “Humanities” requirement may be fulfilled with non-literature courses. No credit given for Foreign Language because the requirement only applies to select degree programs.
Sonoma State University. No credit given for Foreign Language because language study is only an op-tion in the “Comparative Perspectives and Foreign Languages” requirement.
University of California-Berkeley. No credit given for Composition because students may test out of the “Entry Level Writing” requirement through SAT or ACT scores, and the “Reading and Composition” requirement may be satisfied by writing-intensive courses offered in a range of departments that do not focus primarily on composition and writing instruction. No credit given for Foreign Language because students may fulfill the requirement with elementary-level study. No credit given for U.S. Government or History because the “American History and Institutions” requirement may be satisfied by high school coursework or narrow courses. No credit given for Mathematics because students may test out of the “Quantitative Reasoning” requirement through SAT or ACT scores. No credit given for Natural or Physical Science because the “Biological Science Breadth” and “Physical Science Breadth” require-ments may be satisfied by courses with little science content.
University of California-Davis. No credit given for Composition because the “English Composition” section of the “Literacy with Words and Images” requirement of the “Core Literacies Component” may be satisfied by literature courses and writing within specific disciplines rather than a composition course dedicated to composition and writing instruction. No credit given for Foreign Language because the
APPENDIX B
BEST
LA
ID P
LAN
S T
HE
UN
FULF
ILLE
D P
ROM
ISE
OF
PUBL
IC H
IGH
ER E
DU
CATI
ON
IN C
ALI
FORN
IA
72
requirement only applies to select degree programs. No credit given for U.S. Government or History because the “American Cultures, Government, and History” requirement may be satisfied by courses that are not history or government surveys. No credit given for Mathematics because the “Quantita-tive Literacy” requirement may be satisfied by courses with little college-level math content. No credit given for Natural or Physical Science because the “Science and Engineering” and “Scientific Literacy” requirements may be satisfied by courses with little science content.
University of California-Irvine. No credit given for Foreign Language because students may fulfill the requirement with elementary-level study. No credit given for U.S. Government or History because the “American History and Institutions” requirement may be satisfied by high school study. No credit given for Natural or Physical Science because the “Science and Technology” requirement may be satisfied by courses in computer science and mathematics.
University of California-Los Angeles. No credit given for Literature because the “Literary and Cul-tural Analysis” section of the “Foundations of the Arts and Humanities” requirement may be satisfied by courses that are not literature surveys. No credit given for U.S. Government or History because the “American History and Institutions” requirement may be satisfied by high school coursework or by courses narrow in scope. No credit given for Mathematics because students may test out of the “Quanti-tative Reasoning” requirement through SAT or ACT scores.
University of California-Merced. No credit given for U.S. Government or History because the “Ameri-can History and Institutions” requirement may be fulfilled with high school study.
University of California-Riverside. No credit given for Foreign Language because students in select degree programs may fulfill the requirement with elementary-level study. No credit given for U.S. Gov-ernment or History because the “American History and Institutions” requirement may be fulfilled with high school coursework. No credit given for Mathematics because the “Natural Sciences and Mathemat-ics” requirement may be satisfied by courses with little college-level math content.
University of California-San Diego. No credit given for Foreign Language because students may fulfill the requirement with elementary-level study. No credit given for U.S. Government or History because the American History and Institutions requirement may be satisfied by high school study.
University of California-Santa Barbara. No credit given for Foreign Language because students may fulfill the requirement with elementary-level study. No credit given for U.S. Government or History be-cause the “American History and Institutions” requirement may be satisfied by courses narrow in scope.
One-half credit given for both Mathematics and Natural or Physical Science because math and science arefoldedintothe“QuantitativeLiteracy”and“Science,Mathematics,andTechnology”requirements;in each case, students may choose either one or the other.
University of California-Santa Cruz. No credit given for U.S. Government or History because the American History and Institutions requirement may be satisfied by high school study. No credit given for Natural or Physical Science because the “Scientific Inquiry” requirement may be satisfied by courses in linguistics or history of science. Furthermore, natural and physical science courses are an option, but not required, in the “Mathematical and Formal Reasoning” requirement.
APPENDIX B

American Council of Trustees and Alumni1726 M Street, NW, Suite 802
Washington, DC 20036Phone: 1-888-ALUMNI-8 or 202-467-6787
Fax: 202-467-6784Email: [email protected] • Website: www.goacta.org