beopt ca - california · tests into beopt by providing a qa/qc tool tool serves as a supplemental...
TRANSCRIPT
NREL is a national laboratory of the U.S. Department of Energy, Office of Energy Efficiency and Renewable Energy, operated by the Alliance for Sustainable Energy, LLC.
BEopt‐CA A Tool for Optimal Integration ofEE/DR/ES+PV in California Homes
National Renewable Energy Laboratory (NREL)Davis Energy Group (DEG)Energy + Environmental Economics (E3)
January 23, 2013Oakland, CA

2
Agenda
Introduction Project OverviewNew BEopt Features
o What is BEopt? o Retrofit Analysis o Demo BEopt
Utility Cost Testso Background and Implementation o Demo BEopt Utility Cost Testso BEopt Utility Cost Test Examples
Ongoing and Future work: o DR and Energy Storage o Calibration o Connecting to CSE o Community‐Scale Analysis
Feedback and Discussion

3
Objective
• Develop a software tool to provide utility program managers in California with a means of balancing and integrating energy options in existing homes:
o EE – Energy Efficiencyo DR – Demand Responseo ES – Energy Storageo PV – Photovoltaics
4
Team/Roles
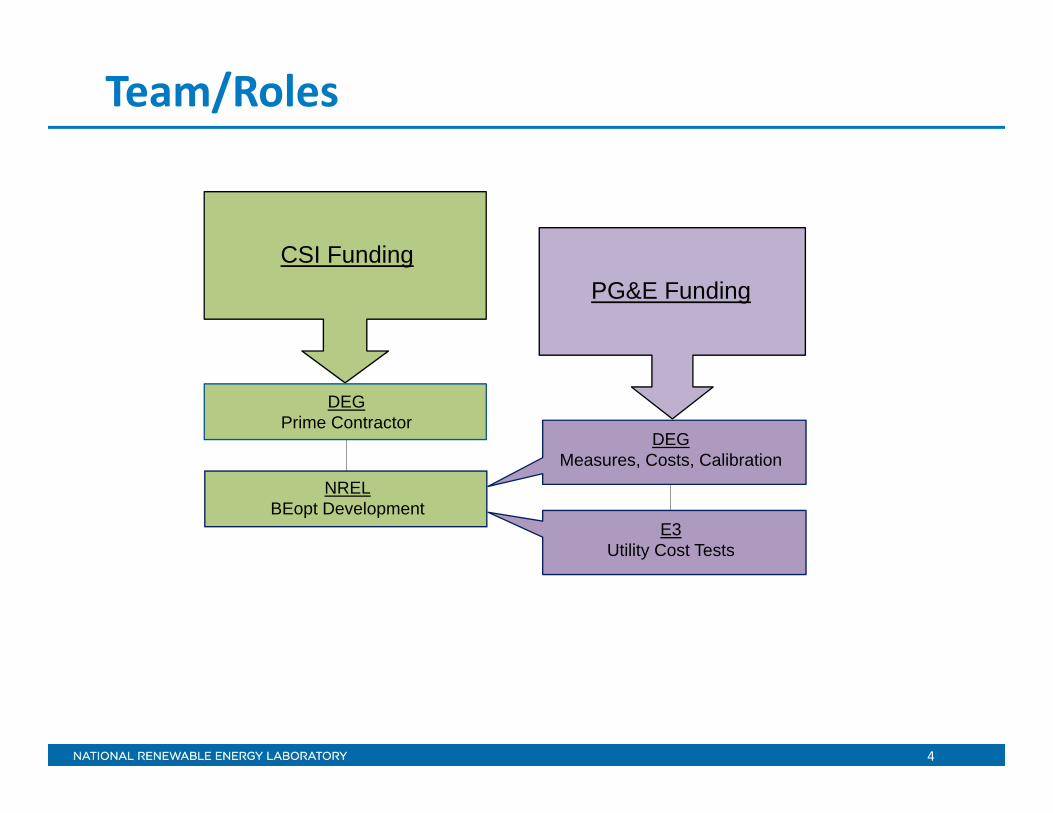
DEGPrime Contractor
NRELBEopt Development
CSI FundingPG&E Funding
DEGMeasures, Costs, Calibration
E3Utility Cost Tests

5
Technical Approach
I. Model Development
1. Modify BEopt analysis methodology to apply to retrofit analysis
2. Add energy efficiency measures that are retrofit‐specific and California‐appropriate
3. Add cost library data for EE/DR/ES+PV measures for California retrofit markets
4. Add California utility tariff capabilities
5. Add methodology and outputs for utility benefit‐cost tests
6. Add methodology and measures for demand response and energy storage
7. Modify the user interface to include additional inputs, outputs, and reports
8. Connect BEopt to CSE (California Simulation Engine)
6
Technical Approach (cont.)
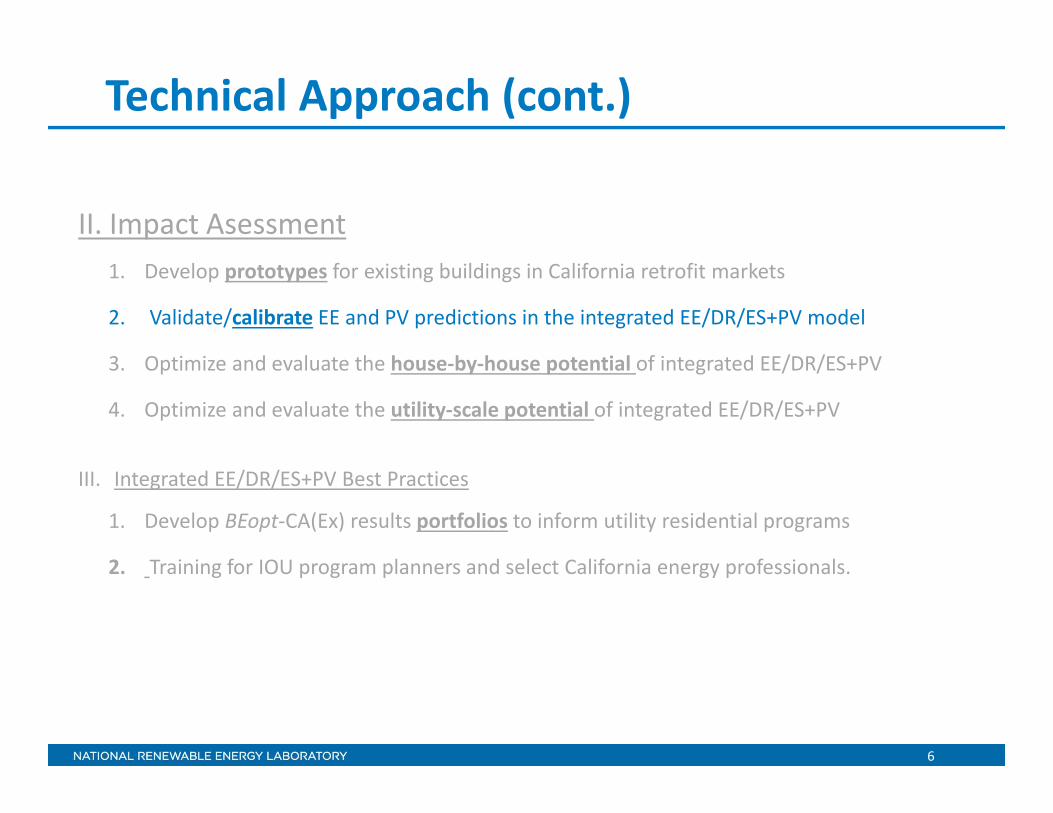
II. Impact Asessment1. Develop prototypes for existing buildings in California retrofit markets
2. Validate/calibrate EE and PV predictions in the integrated EE/DR/ES+PV model
3. Optimize and evaluate the house‐by‐house potential of integrated EE/DR/ES+PV
4. Optimize and evaluate the utility‐scale potential of integrated EE/DR/ES+PV
III. Integrated EE/DR/ES+PV Best Practices
1. Develop BEopt‐CA(Ex) results portfolios to inform utility residential programs
2. Training for IOU program planners and select California energy professionals.
• What is BEopt• Retrofit Analysis• Demo
New BEopt Features

8
Building Energy OptimizationBased on Hour-by-Hour Simulations BEopt beopt.nrel.gov

9
• Runs detailed hour‐by‐hour simulations
• Accurately accounts for interactions (e.g., glass type and HVAC)
• Evaluates realistic (discrete) options
• Finds optimal designs from base case to zero net energy
• Identifies near‐optimal alternative designs
• User‐specified or Building America occupancy/operating assumptions and climate‐specific reference buildings
BEopt (TRNSYS + DOE2)
DOE2
TRNSYSSDHW
PV
EPWHeating,Cooling
Lighting,Appliances
OptimalBuildingDesigns
BEopt
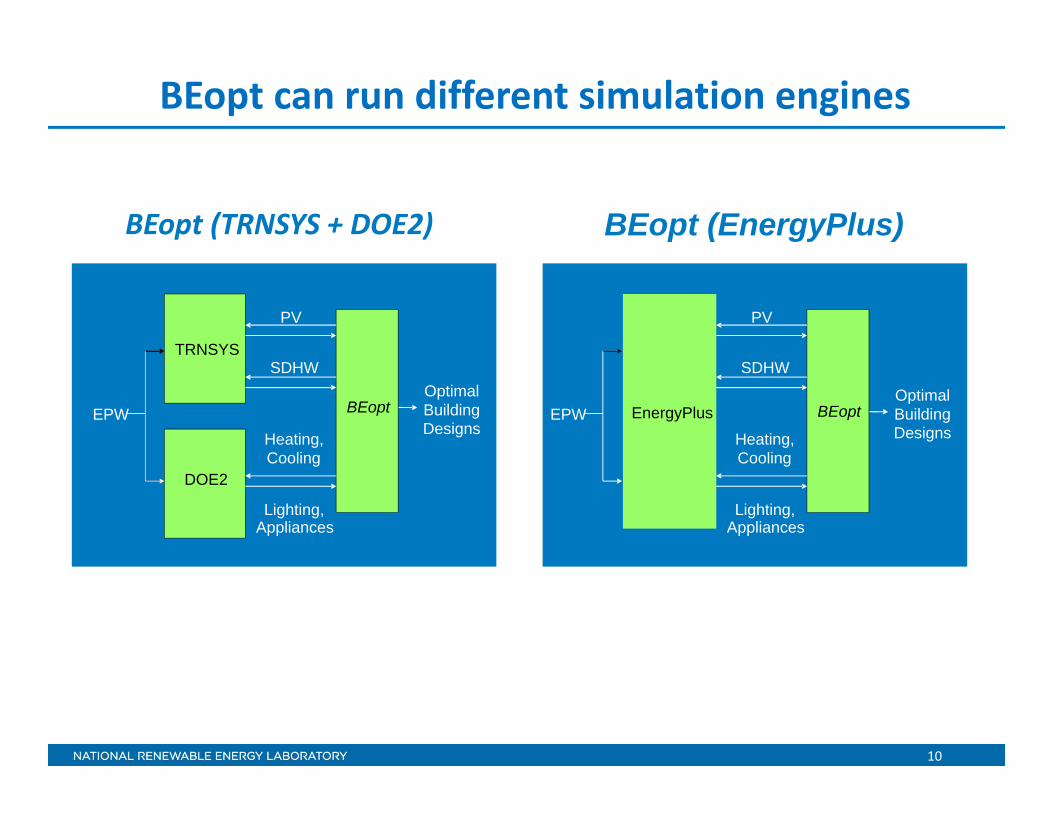
10
BEopt (TRNSYS + DOE2)
DOE2
TRNSYSSDHW
PV
EPWHeating,Cooling
Lighting,Appliances
OptimalBuildingDesigns
BEopt EnergyPlus
SDHW
PV
EPWHeating,Cooling
Lighting,Appliances
OptimalBuildingDesigns
BEopt
BEopt (EnergyPlus)
BEopt can run different simulation engines

11
ReferenceBuilding
PV More Efficient
Building Designs
Zero NetEnergy
Cost/Energy Graph

12
Parametrics(~750,000 simulations)
Optimization (~750 simulations)
Sequential Search:
Exhaustive Enumeration:
ValidationSearch technique correctly finds the least‐cost curve(No parametric points below the curve)
~1,000x fewer simulations

13
Retrofit Analysis
• Retrofit timingo Age of existing options => remaining lifeo Upgrade today or upgrade at wear‐out
• “Minimum Upgrades” o Comply with code, available on marketo Reference building at wear‐outo Design building at wear‐out or todayo Cost of upgrade included, at time of upgrade
• Multiple energy simulations if upgrade at wear‐outo For years before upgradeo For years period after upgrade
Retrofit Measures and Cost
• Include measures that are most likely to be used in standard California retrofits
• Where possible apply cost data from local sources and use California labor assumptions
• Retrofit specific labor costs include details not included in other cost data
• Compliments NREL’s National Residential Efficiency Measure Database (www.nrel.gov/ap/retrofits/group_listing.cfm)

15
• HVAC sizing o Set size of existing equipmento Only downsize if HVAC is being replaced
• Non‐central space conditioning systemso Window ACs, mini‐splits
• Heat transfer sensitive to highly‐conductive componentso Uninsulated walls/ceilingso Single glazed windows
Retrofit Modeling

BEopt GUI
Input, Run, OutputLevel 1
Level 3EnergyPlus.py
Building, PV simulations
DViewView hourly results
Level 2 Library Manager
Add, modify datasetsCost Selector
Add, modify datasetsCost Selector
Add, modify optionsOption Editor
BEopt: simple or detailed to use (open architecture)
17
BEopt Demo
• Measures• Costs• Retrofit Analysis• Utility Tariffs
18
BEopt 2.0 currently available in Beta(Official release in February 2013)
beopt.nrel.gov
For More Information

UTILITY COST TESTSPOLICY CONTEXT & APPROACH
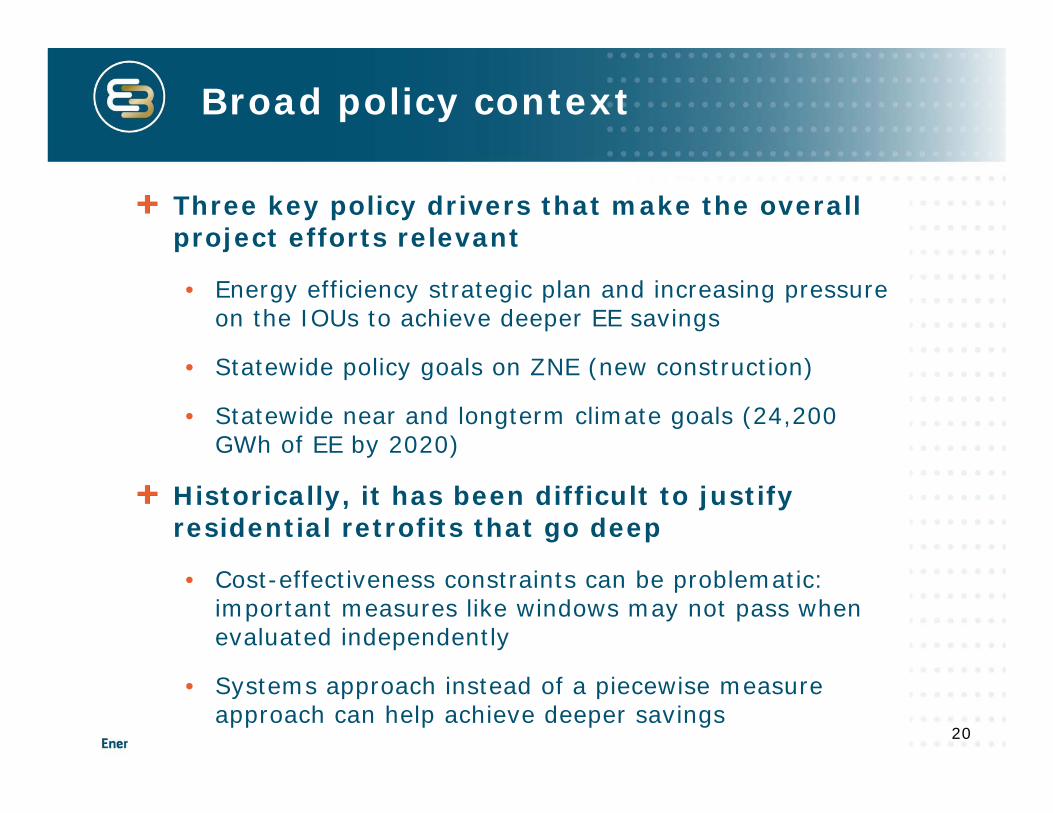
Broad policy context
Three key policy drivers that make the overall project efforts relevant
• Energy efficiency strategic plan and increasing pressure on the IOUs to achieve deeper EE savings
• Statewide policy goals on ZNE (new construction)
• Statewide near and longterm climate goals (24,200 GWh of EE by 2020)
Historically, it has been difficult to justify residential retrofits that go deep
• Cost-effectiveness constraints can be problematic: important measures like windows may not pass when evaluated independently
• Systems approach instead of a piecewise measure approach can help achieve deeper savings
20

21
Project Objective
Enhance the BEopt tool so that it can be used more directly in the energy efficiency program framework of the California Public Utilities Commission (CPUC)
Team focused on the process and steps to incorporate the cost-effectiveness metrics used by the CPUC into the BEopt modeling framework
BEoptSimulation
and California Cost estimates
CPUC Cost Tests(complete)
CSE Integration(planned 2013)
How this project fits
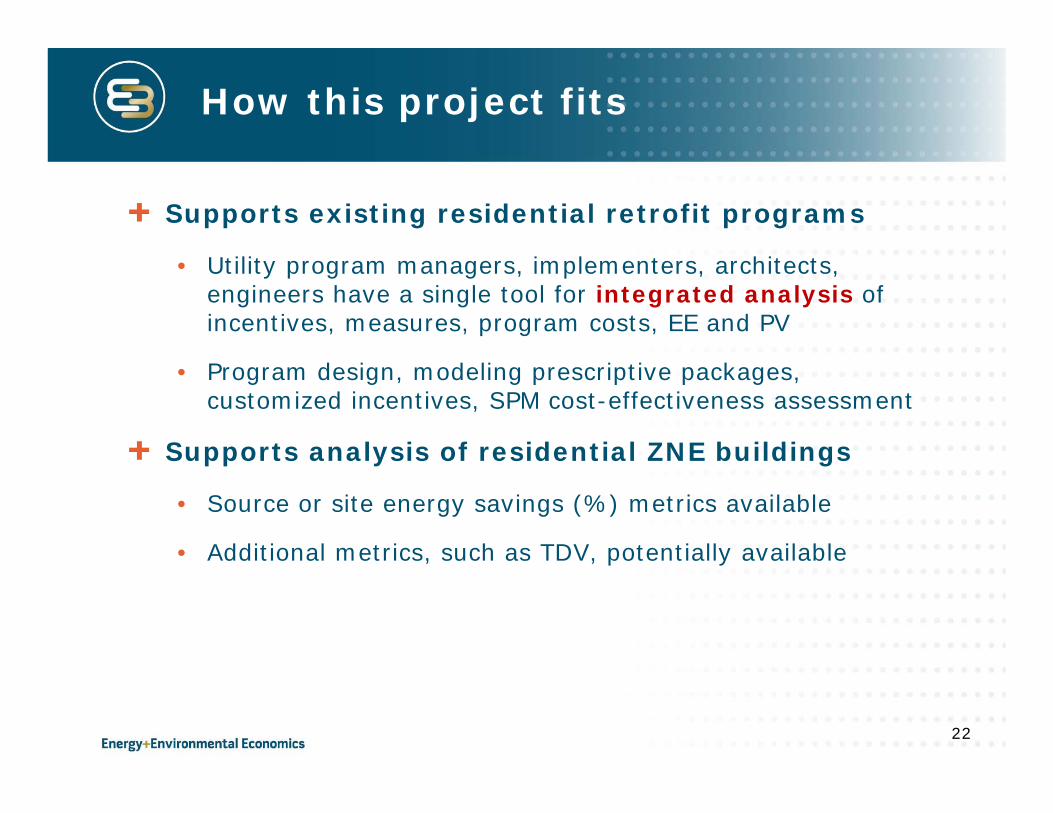
Supports existing residential retrofit programs
• Utility program managers, implementers, architects, engineers have a single tool for integrated analysis of incentives, measures, program costs, EE and PV
• Program design, modeling prescriptive packages, customized incentives, SPM cost-effectiveness assessment
Supports analysis of residential ZNE buildings
• Source or site energy savings (%) metrics available
• Additional metrics, such as TDV, potentially available
22
Two approaches to cost effectiveness implementation
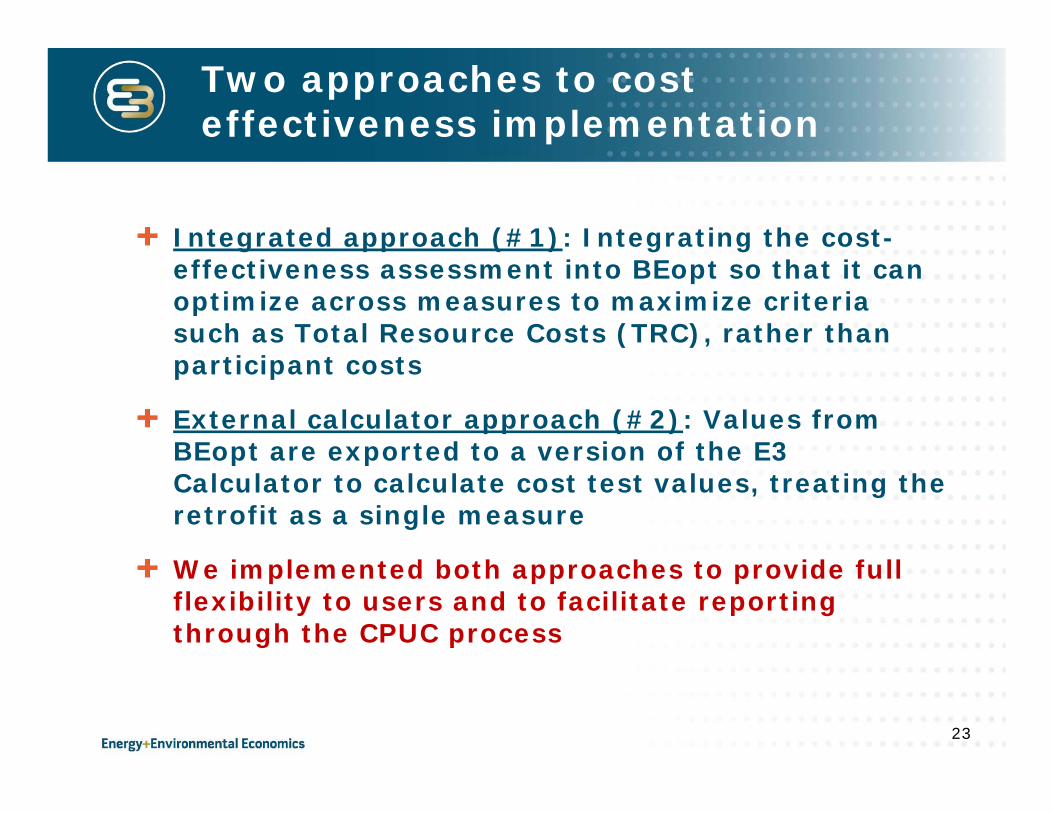
Integrated approach (#1): Integrating the cost-effectiveness assessment into BEopt so that it can optimize across measures to maximize criteria such as Total Resource Costs (TRC), rather than participant costs
External calculator approach (#2): Values from BEopt are exported to a version of the E3 Calculator to calculate cost test values, treating the retrofit as a single measure
We implemented both approaches to provide full flexibility to users and to facilitate reporting through the CPUC process
23
Approach 1: Direct integration into BEopt
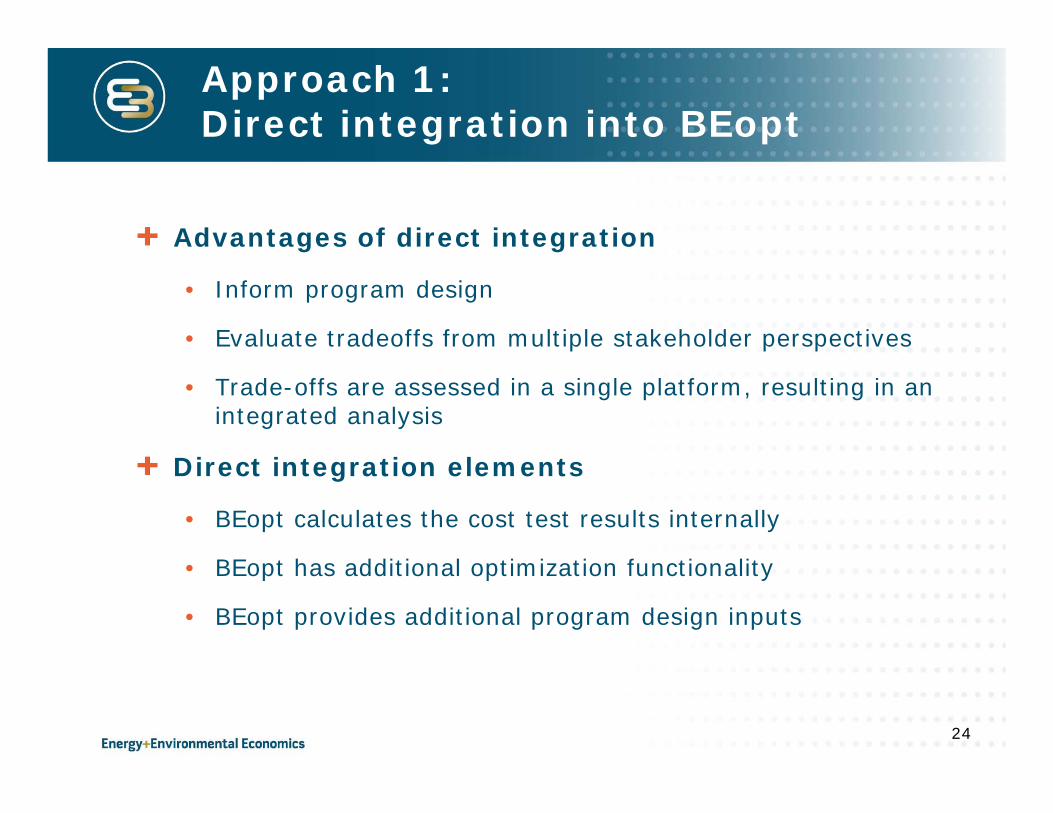
Advantages of direct integration
• Inform program design
• Evaluate tradeoffs from multiple stakeholder perspectives
• Trade-offs are assessed in a single platform, resulting in an integrated analysis
Direct integration elements
• BEopt calculates the cost test results internally
• BEopt has additional optimization functionality
• BEopt provides additional program design inputs
24
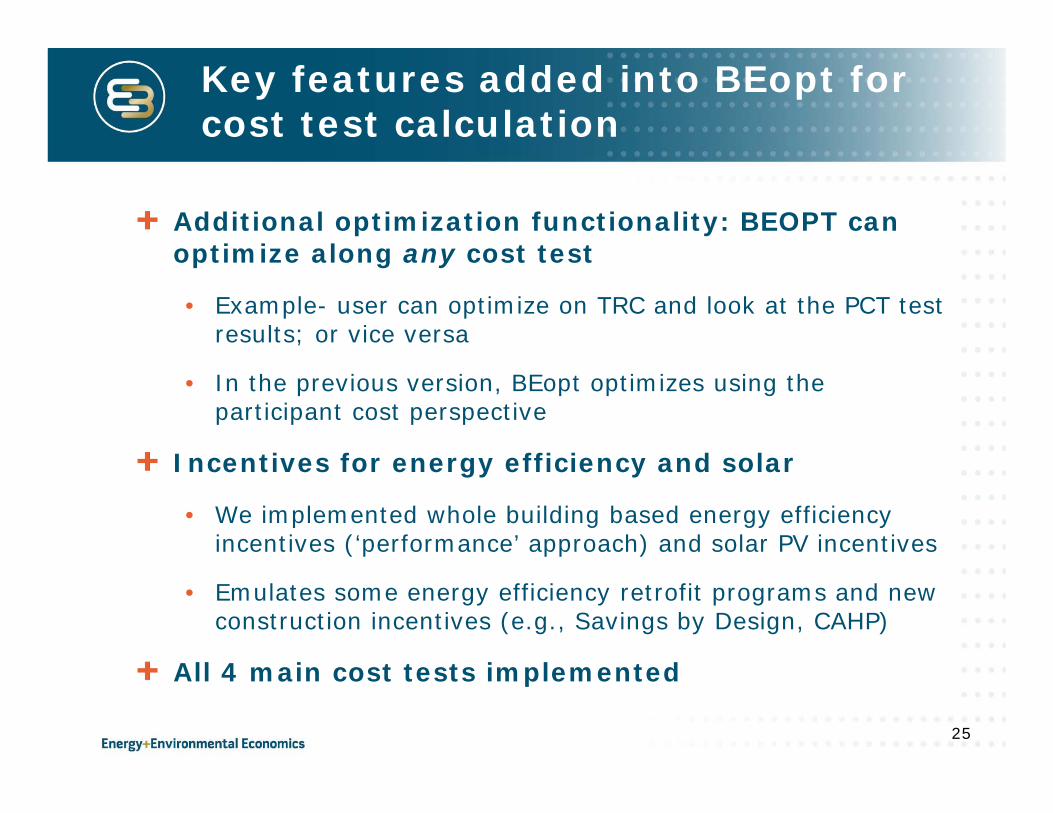
Key features added into BEopt for cost test calculation
Additional optimization functionality: BEOPT can optimize along any cost test
• Example- user can optimize on TRC and look at the PCT test results; or vice versa
• In the previous version, BEopt optimizes using the participant cost perspective
Incentives for energy efficiency and solar
• We implemented whole building based energy efficiency incentives (‘performance’ approach) and solar PV incentives
• Emulates some energy efficiency retrofit programs and new construction incentives (e.g., Savings by Design, CAHP)
All 4 main cost tests implemented
25

Cost effectiveness tests in BEopt
The 4 main cost tests are implemented
• Total resource cost test: Is the retrofit cost effective overall to society?
• Participant cost test: Is the retrofit cost effective cost effective to the home owner?
• Program administrator cost test: Is the retrofit cost effective to the program administrator?
• Ratepayer impact test: Is the retrofit cost effective to non-participating ratepayers?
Note, not all cost tests are in the E3 Calculator (current program reporting tool)
Avoided costs are provided for 40 years (Source: 2013-2014 E3 Calculator)
26
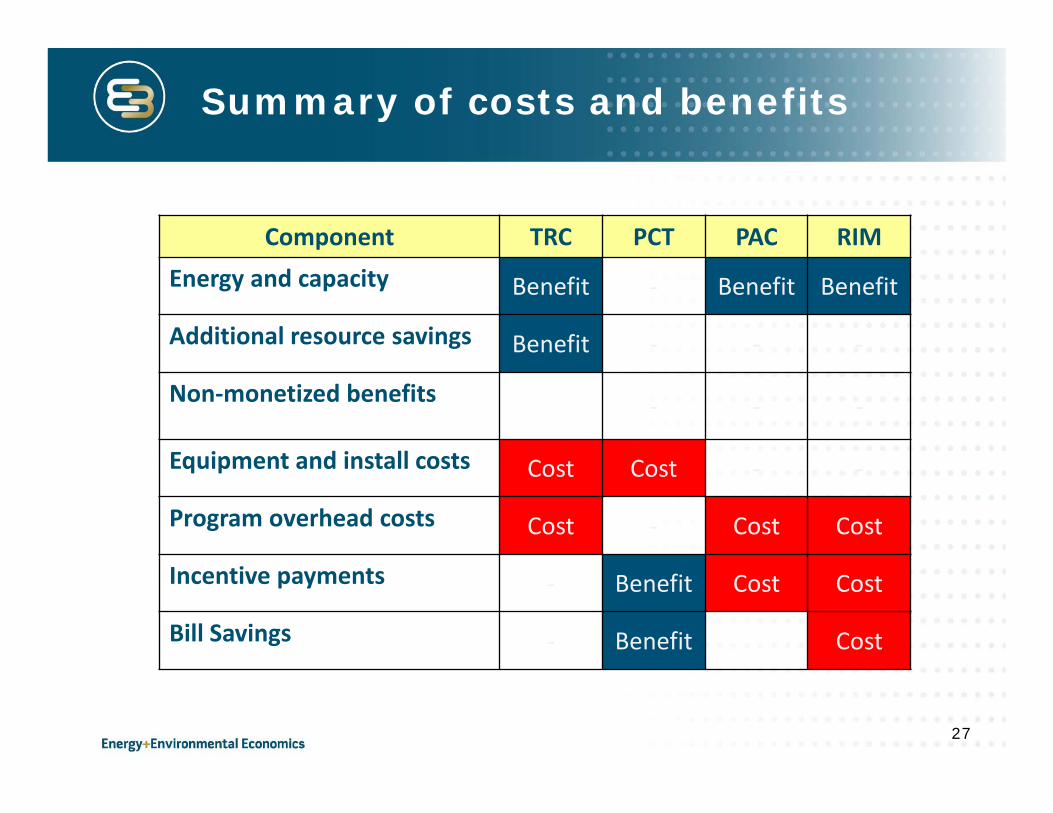
Summary of costs and benefits
Component TRC PCT PAC RIMEnergy and capacity Benefit ‐ Benefit Benefit
Additional resource savings Benefit ‐ ‐ ‐
Non‐monetized benefits ‐ ‐ ‐
Equipment and install costs Cost Cost ‐ ‐
Program overhead costs Cost ‐ Cost Cost
Incentive payments ‐ Benefit Cost Cost
Bill Savings ‐ Benefit Cost
27

Cost effectiveness analysis: overall methodology
28
Beopt output: Hourly load impact (savings between reference building
and retrofit)
Hourly avoided costs
X
Utility bill determinants
X
kWh
Hour
Hour
$/kWh
=
=
Yearly avoided cost
benefits
Yearly bill savings
All years and convert into NPV
TRC, RIM, PAC test benefits
All years and convert into NPV
PCT benefits,RIM costs
Hour
$/kWh
BEOPT provides hourly energy savings information about the proposed retrofit that is used to calculate avoided cost benefits & bill impacts
Measure cost and program information feed into the cost side of the tests.
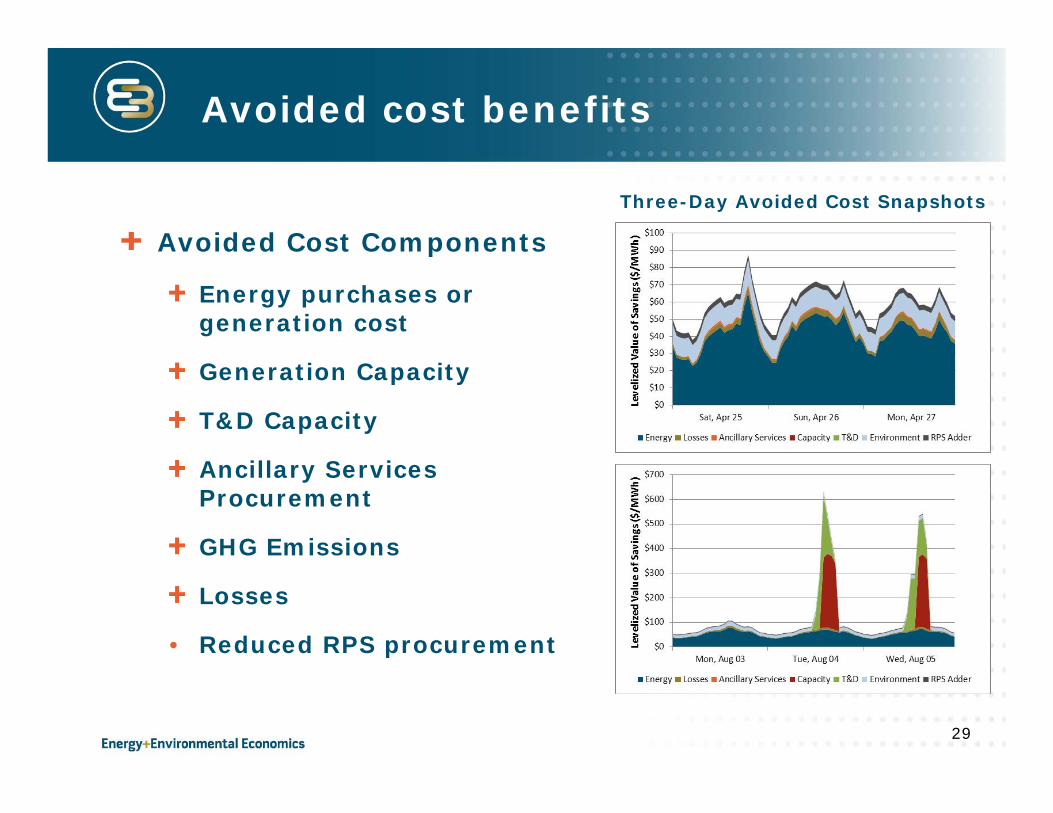
Avoided cost benefits
29
Avoided Cost Components
Energy purchases or generation cost
Generation Capacity
T&D Capacity
Ancillary Services Procurement
GHG Emissions
Losses
• Reduced RPS procurement
Three-Day Avoided Cost Snapshots

Incentive design
Energy efficiency: whole home approach selected
• Allows for the designer to assess tradeoffs among measures
• BEopt can emulate existing ‘performance’ style and whole home approach incentives (e.g., California Advanced Home Partnership, Energy Upgrade California)
Solar incentives:
• Upfront incentive and performance rebates can be modeled
• NEM: user can specify end of year payouts
Program overlap:
• BEopt allows the user to evaluate many measures; some may have existing programs, such as lighting
• BEopt can be avoid program overlap by optimizing on only the measures that do not have existing programs
30

Example of incentive interface
Recognizing that programs will evolve, BEopt provides flexibility in how solar and whole-home-based efficiency incentives are entered
CSI default values for each utility are provided in Beopt for convenience
31

Approach 2: BEopt version of the E3 Calculator
A simplified E3 Calculator takes the BEopt outputs and computes the cost tests
Tool was developed mainly to support direct integration of cost tests into BEopt by providing a QA/QC tool
Tool serves as a supplemental tool to the cost test reporting in the BEopt output
Advantages of having a supplemental tool:
• Tool mimics the E3 Calculator which is the reporting tool for all programmatic filings for ensuring standardization of cost-effectiveness
• Tool could aid future program reporting through the official E3 Calculator
• Allows for assessment of a few sensitivities outside of BEopt: program costs, NTG ratios
If helpful, E3 could add features to the tool to facilitate keeping current with avoided costs and to evaluate different simple incentive structures 32

“BEopt” E3 Calculator
33

Program design questions
Individual building analysis vs. program design:
• What are the steps in moving from individual building analysis to program analysis?
• How can the tools be improved to support program design?
Incentive approach:
• Is a whole-system approach for energy efficiency aligned with CPUC and utility directions for retrofit programs?
Program overlap:
• Are the features in BEOPT sufficient to deal with overlap with existing programs?
Standardizing inputs:
• Cost effectiveness results are highly sensitive to assumptions such as age of the building, measure lives, analysis period, etc.
34
• Inputs• Outputs
BEopt Demo
36
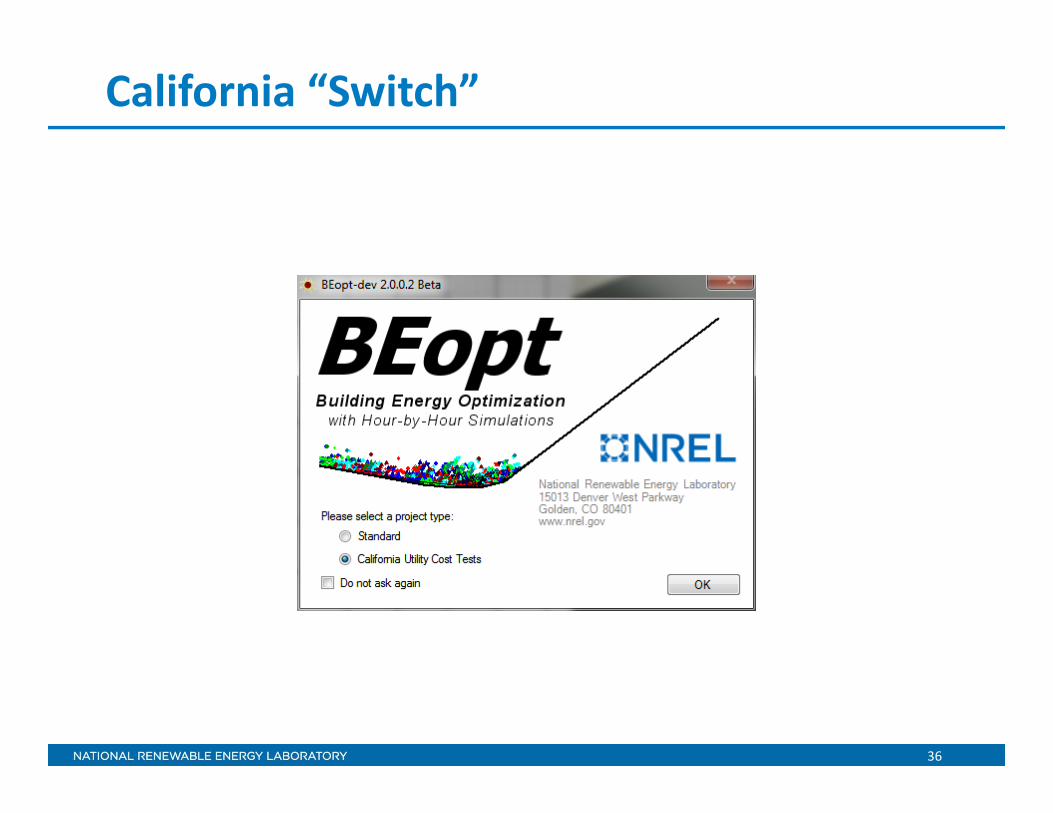
California “Switch”

37
BEopt California “Switch” Settings
1. EnergyPlus is set as the simulation engine (for calculation of avoided costs).
2. Only California climate zone weather files are displayed.
3. Additional inputs will now be available: • Net-to-Gross Ratio • Program Cost (Present Value) • CA Climate Zone Utility • CA Climate Zone Region
4. The marginal state income tax rate is defaulted to 9.3%.
5. The CSI PV rebate is enabled by default. The program specifies a performance-based rebate of $0.03/kWh for 5 years or a capacity-based rebate of $0.20/W AC.
6. Net-metered annual excess sellback rates are defaulted by CA utility climate zones.
7. The maximum analysis period is 40 years (Avoided cost factors are only available for these years.) Note that avoided costs are sourced from the 2013-2014 E3 Calculator.
8. Type of utility cost test is selectable for optimization and display.

38
California “Switch”
BEopt Demo

ILLUSTRATIVE EXAMPLES

Objective
We wanted to explore the new features of BEopt with a real example
We were interested in the following:
• Exploring the cost effectiveness results for many different bundles of EE & PV, relationships between TRC, PCT, RIM
• Exploring how BEopt can help identify incentive levels
• Understanding the sensitivity of the results to key modeling assumptions, such as climate zone, cost test being optimized, electric vs. gas heating, measure lifetime, analysis period, rates
40

Case study descriptions
41
Case 1: 2150 sqft home in Stockton (PG&E, CZ 12)
Key characteristics
• Old, inefficient & leaky home (e.g., no wall insulation, single pane metal frame windows)
• HVAC systems (SEER 8 AC, 60% AFUE gas furnace)
• Gas heating; E1 electric schedule, G1 gas schedule
Case 2: Oakland home with same characteristics
Case 3: L.A. home (Culver City) with same characteristics but with electric heating
Details of the Stockton house were provided by Davis Energy Group.

Main modeling assumptions
42
Key input parameter Value Analysis period 25 years
Rates E1-region specific and G1 (from OPEN EI)
Measure lives BEopt Defaults
Optimized over TRC NPV of net benefits ($)
Age of systems BEopt defaults (generally half of the measure lifetime)
Schedules BEopt default values
Walls, roof, window properties Walls: R-3.6; roof: R-11, windows: U 1.19, SHGC 0.83
Central air conditioner SEER 8
Infiltration 3775 CFM (ACH50 11.7/h)
Case Climate zone Heating Furnace Water heater1: Stockton 12 Gas 60% AFUE 0.4 energy factor
2: Oakland 3 Gas 60% AFUE 0.4 energy factor
3: Culver City 8 Electric 100% AFUE 0.9 energy factor
Common across cases
Specific to the cases

Main results
43
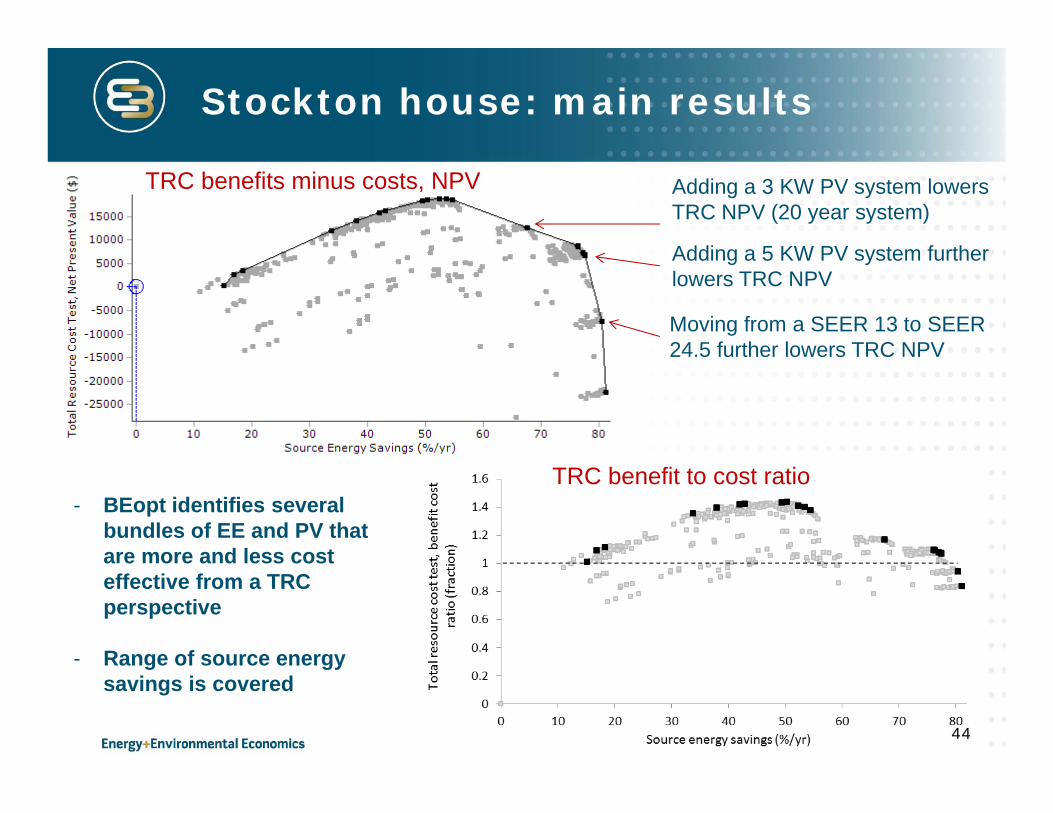
Stockton house: main results
44
- BEopt identifies several bundles of EE and PV that are more and less cost effective from a TRC perspective
- Range of source energy savings is covered
Adding a 3 KW PV system lowers TRC NPV (20 year system)
Moving from a SEER 13 to SEER 24.5 further lowers TRC NPV
TRC benefit to cost ratio
Adding a 5 KW PV system further lowers TRC NPV
TRC benefits minus costs, NPV
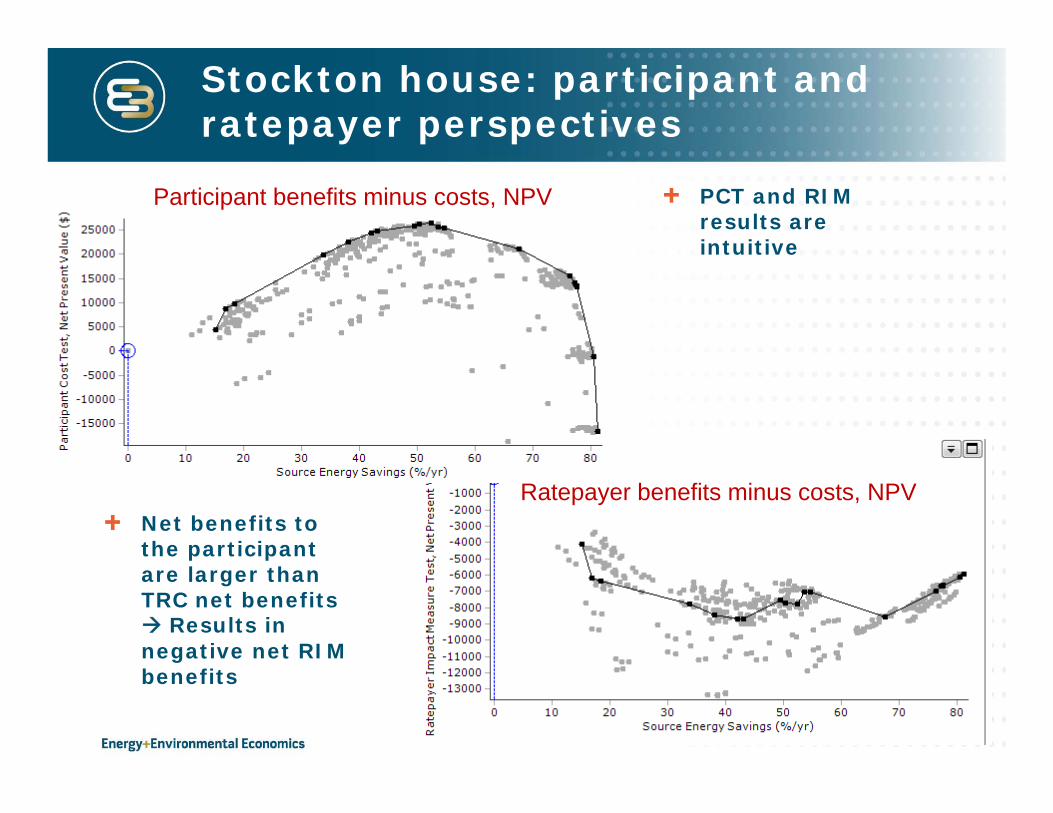
Stockton house: participant and ratepayer perspectives
PCT and RIM results are intuitive
45
Net benefits to the participant are larger than TRC net benefits Results in negative net RIM benefits
Participant benefits minus costs, NPV
Ratepayer benefits minus costs, NPV
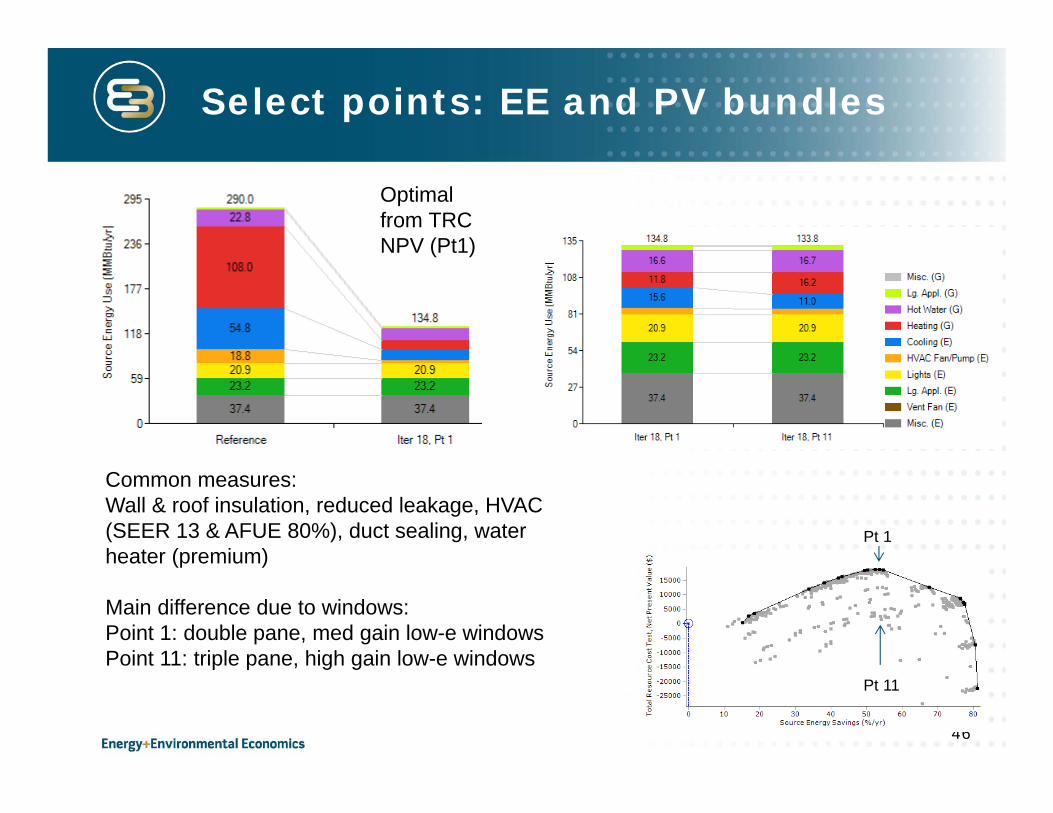
Select points: EE and PV bundles
46
Optimal from TRC NPV (Pt1)
Common measures: Wall & roof insulation, reduced leakage, HVAC (SEER 13 & AFUE 80%), duct sealing, water heater (premium)
Main difference due to windows: Point 1: double pane, med gain low-e windows Point 11: triple pane, high gain low-e windows
Pt 1
Pt 11
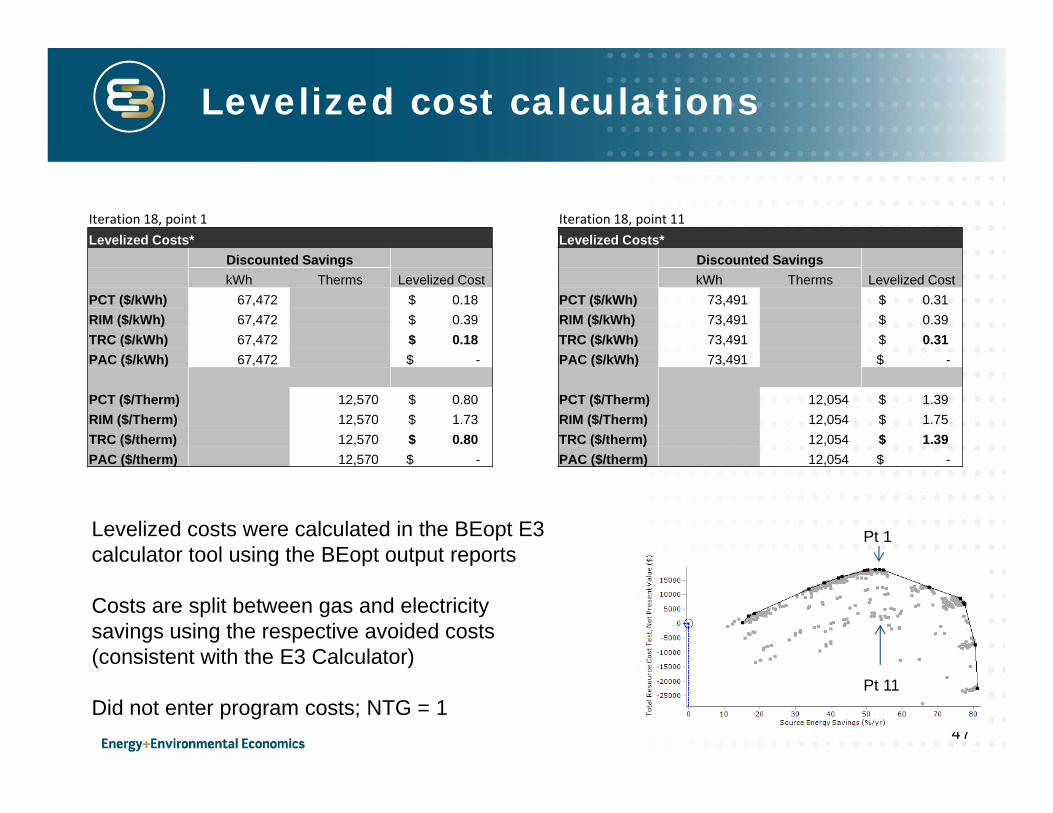
Levelized cost calculations
47
Levelized costs were calculated in the BEopt E3 calculator tool using the BEopt output reports
Costs are split between gas and electricity savings using the respective avoided costs (consistent with the E3 Calculator)
Did not enter program costs; NTG = 1
Pt 1
Pt 11
Iteration 18, point 1Levelized Costs*
Discounted SavingskWh Therms Levelized Cost
PCT ($/kWh) 67,472 $ 0.18RIM ($/kWh) 67,472 $ 0.39TRC ($/kWh) 67,472 $ 0.18PAC ($/kWh) 67,472 $ -
PCT ($/Therm) 12,570 $ 0.80RIM ($/Therm) 12,570 $ 1.73TRC ($/therm) 12,570 $ 0.80PAC ($/therm) 12,570 $ -
Iteration 18, point 11Levelized Costs*
Discounted SavingskWh Therms Levelized Cost
PCT ($/kWh) 73,491 $ 0.31RIM ($/kWh) 73,491 $ 0.39TRC ($/kWh) 73,491 $ 0.31PAC ($/kWh) 73,491 $ -
PCT ($/Therm) 12,054 $ 1.39RIM ($/Therm) 12,054 $ 1.75TRC ($/therm) 12,054 $ 1.39 PAC ($/therm) 12,054 $ -
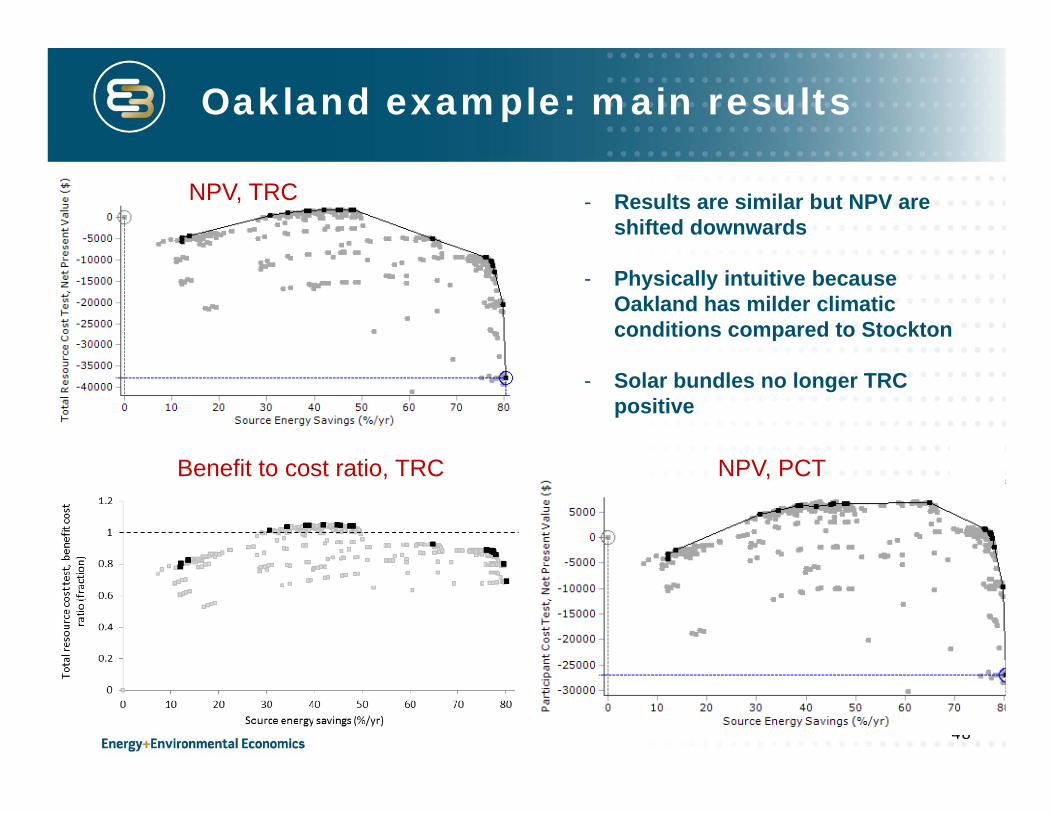
Oakland example: main results
48
- Results are similar but NPV are shifted downwards
- Physically intuitive because Oakland has milder climatic conditions compared to Stockton
- Solar bundles no longer TRC positive
NPV, TRC
Benefit to cost ratio, TRC NPV, PCT

Culver City example: main results
49
- PCT ‘plateau’ due to NEM, which essentially pays for the 3 KW PV system and almost pays for 5 kW PV
NPV, TRC This example had electric heating and hot water
- Higher cooling loads, avoided costs & electric heating likely contribute to higher TRC NPV, compared to the Oakland example
- In bundled format, EE & 3 kW PV just passes TRC
NPV, PCT
Adding 3 KW PV marginally increases PCT, NPV
Adding 5 KW PV marginally lowers PCT, NPV
Bundled EE & 3 kW solar PV

Exploring sensitivities: based on the Stockton case
50

Exploring incentive levels
Using an example incentive level ranging from $0.10/kWh to $0.90/kWh, with $1000 kicker, plus gas incentive $1/therm (structured similarly to CAHP)
Case which was non-cost effective for the participant is now cost-effective
PCT, NPV is one way of determining the incentive ‘needed’ to motivate investment
51
$1000 kicker
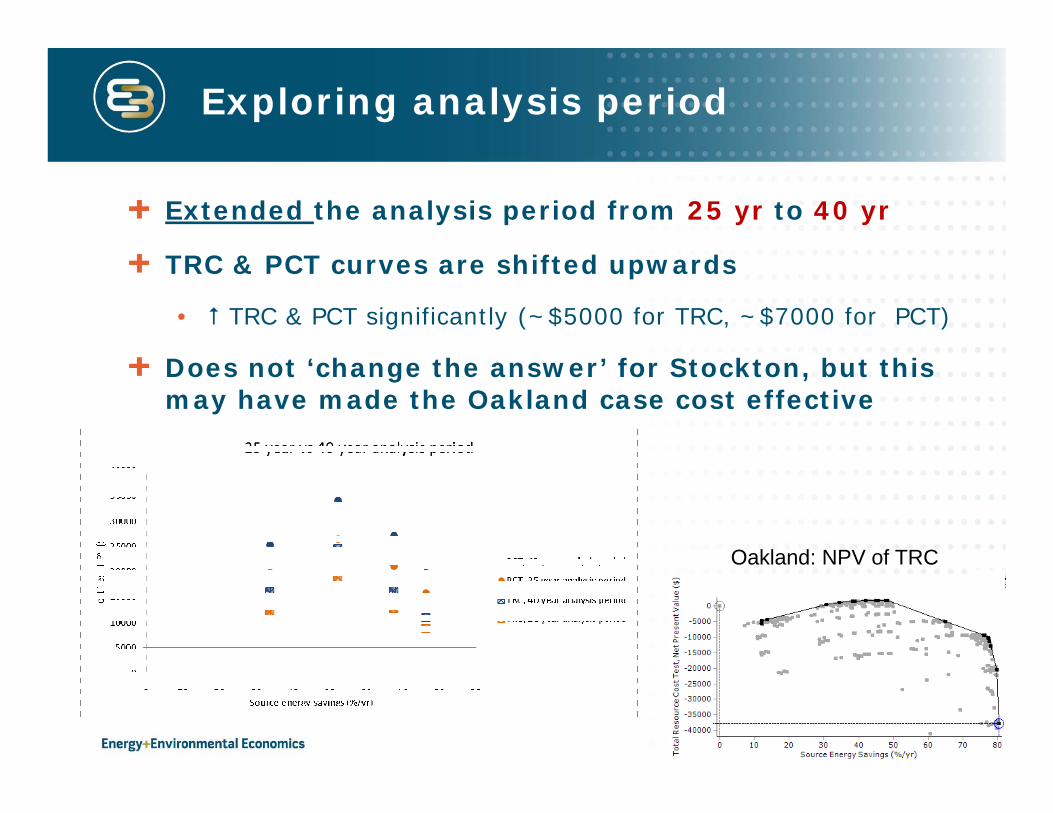
Exploring analysis period
Extended the analysis period from 25 yr to 40 yr
TRC & PCT curves are shifted upwards
• TRC & PCT significantly (~$5000 for TRC, ~$7000 for PCT)
Does not ‘change the answer’ for Stockton, but this may have made the Oakland case cost effective
52
Oakland: NPV of TRC
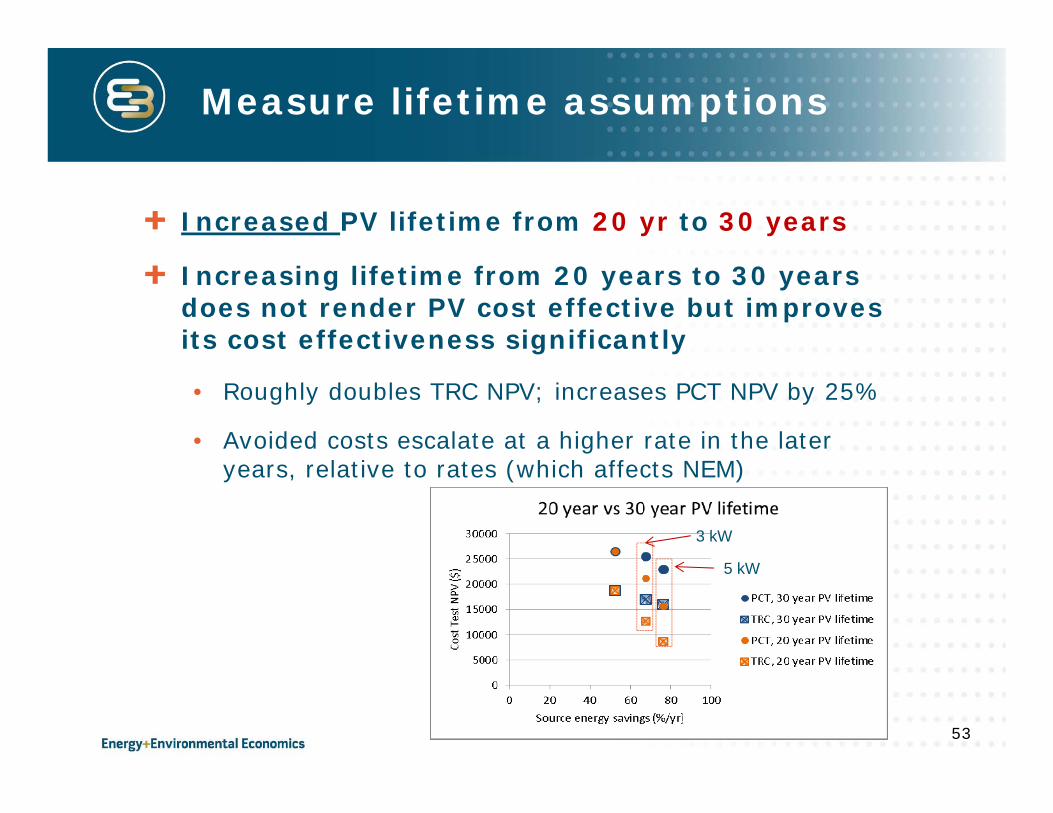
Measure lifetime assumptions
Increased PV lifetime from 20 yr to 30 years
Increasing lifetime from 20 years to 30 years does not render PV cost effective but improves its cost effectiveness significantly
• Roughly doubles TRC NPV; increases PCT NPV by 25%
• Avoided costs escalate at a higher rate in the later years, relative to rates (which affects NEM)
53
3 kW
5 kW
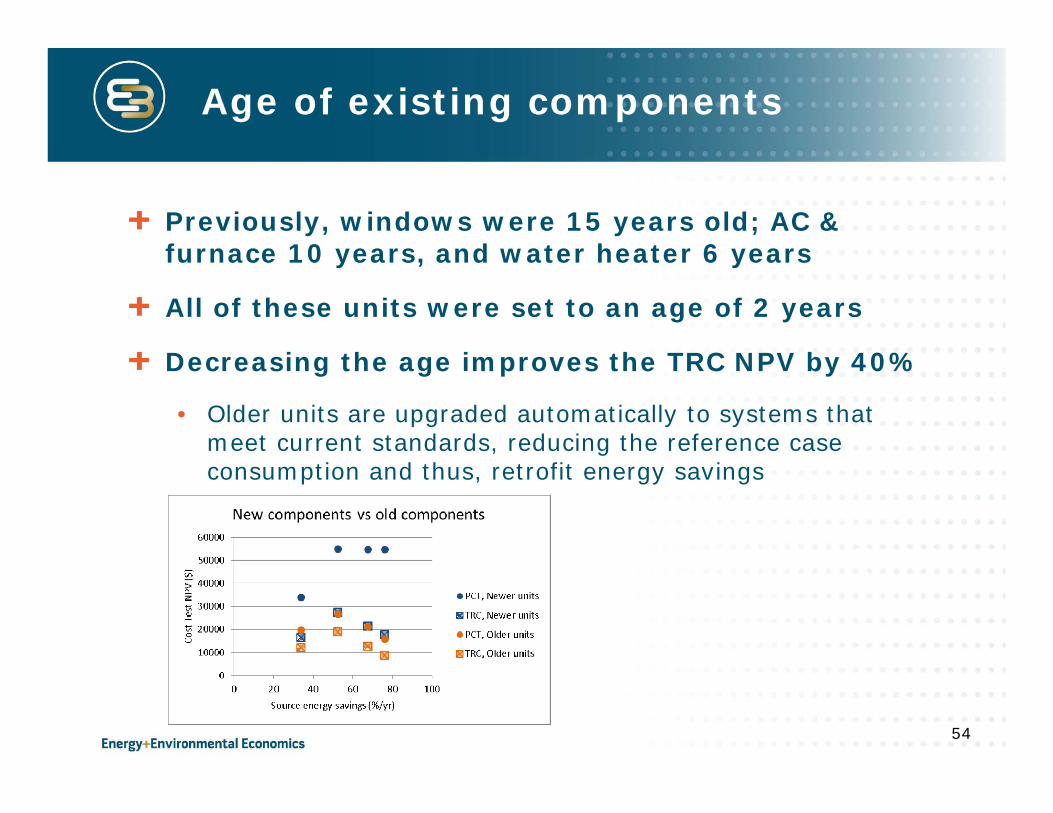
Age of existing components
Previously, windows were 15 years old; AC & furnace 10 years, and water heater 6 years
All of these units were set to an age of 2 years
Decreasing the age improves the TRC NPV by 40%
• Older units are upgraded automatically to systems that meet current standards, reducing the reference case consumption and thus, retrofit energy savings
54

Preliminary insights
BEopt tool was able to identify multiple bundles of EE and PV to inform retrofits with varying levels and patterns of cost effectiveness
Example underscores importance of an integrated analysis (EE and PV, engineering and economics)
Program related questions can be informed
• BEopt can help identify appropriate incentive levels
• Sensitivity analysis shows importance of assumptions such as analysis period, measure lifetimes, base case assumptions
• BEopt results can be used to set price points where current bundles are not cost effective
55

• Demand Response and Energy Storage• Model Calibration
Ongoing and Future Work

Demand Response
• Current California Programs– A/C cycling: PG&E SmartAC, SCE Summer Discount Plan, SDG&E Summer Saver
– Voluntary load reduction: PG&E SmartRate, SCE Save Power Days, SDG&E Reduce Your Use
• Exploratory: “day ahead” or “day of” signals using:– Open ADR– Smart Energy Profile
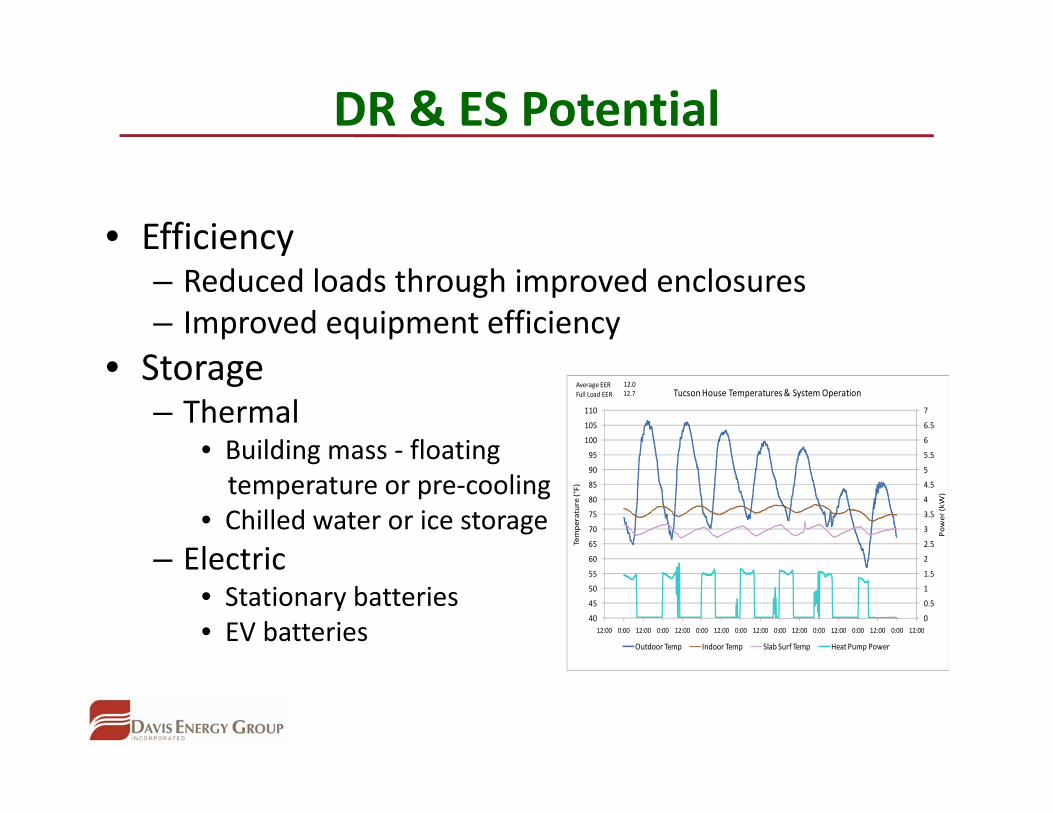
DR & ES Potential
• Efficiency– Reduced loads through improved enclosures– Improved equipment efficiency
• Storage– Thermal
• Building mass ‐ floating temperature or pre‐cooling
• Chilled water or ice storage– Electric
• Stationary batteries• EV batteries
0
0.5
1
1.5
2
2.5
3
3.5
4
4.5
5
5.5
6
6.5
7
40
45
50
55
60
65
70
75
80
85
90
95
100
105
110
12:00 0:00 12:00 0:00 12:00 0:00 12:00 0:00 12:00 0:00 12:00 0:00 12:00 0:00 12:00 0:00 12:00
Power (kW)
Temperature (°F)
Tucson House Temperatures & System Operation
Outdoor Temp Indoor Temp Slab Surf Temp Heat Pump Power
Average EERFull Load EER
12.012.7

Model Calibration
• Issue: How can energy savings be estimated at the community level with a high level of confidence to support comprehensive local retrofit programs?– Impractical to evaluate each house– HERS II software tends to over‐predict savings– Optimal selection of retrofit measures varies by climate– DEER and RASS not climate specific
• Objective– Develop a process for efficiently disaggregating community
utility bill data– Use the results to adjust program inputs to improve the
confidence level

Calibration Process
• Obtain blind utility bill data for a defined community (used Stockton & Pleasanton)
• Characterize the houses (vintage, floor area, etc.)• Apply filters for incomplete data and outliers• Separate base loads from heating, cooling, water heating and lighting
• Develop a BEopt model that typifies the house characterizations
• Adjust input parameters (thermostat settings, miscellaneous energy use assumptions, etc.) to achieve desired level of calibration

Calibration ‐‐ Population Variance
0
500
1000
1500
2000
2500Energy Usage
[kW
h]
0
200
400
600
800
1000
1200
1400
1600
1800
Energy Usage
[kW
h]
0
50
100
150
200
250
300
Energy Usage
[therms]
0
20
40
60
80
100
120
140
160
180
200
Energy Usage
[therms]
Stockton ‐ Electric
Stockton ‐ Gas
Pleasanton – Electric
Pleasanton ‐ Gas
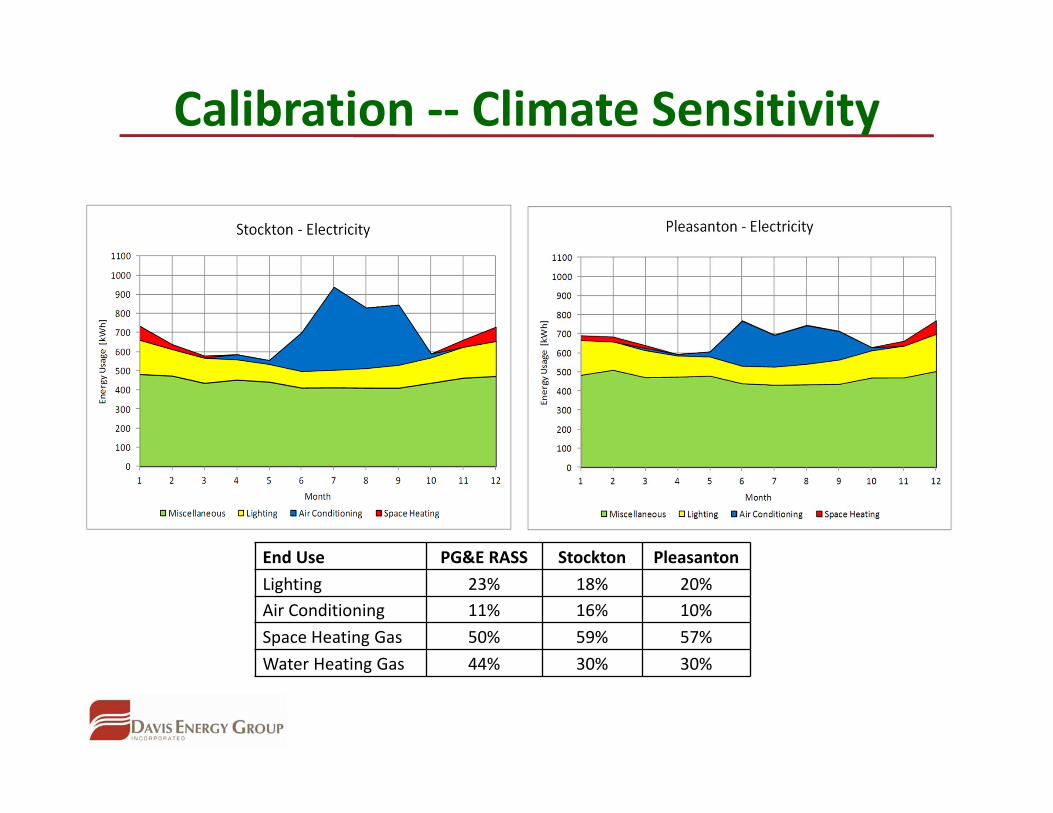
Calibration ‐‐ Climate Sensitivity
End Use PG&E RASS Stockton PleasantonLighting 23% 18% 20%Air Conditioning 11% 16% 10%Space Heating Gas 50% 59% 57%Water Heating Gas 44% 30% 30%

• Connecting to CSE• Community‐Scale Analysis
Ongoing and Future Work
64
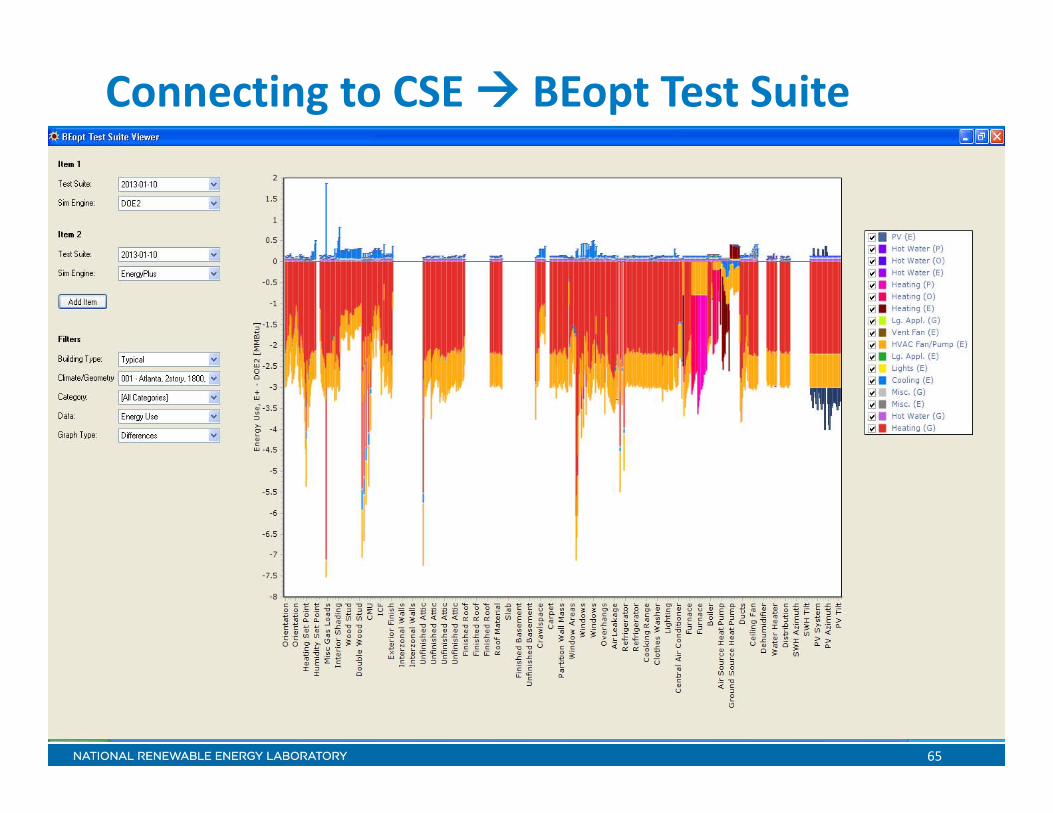
Connecting to CSE
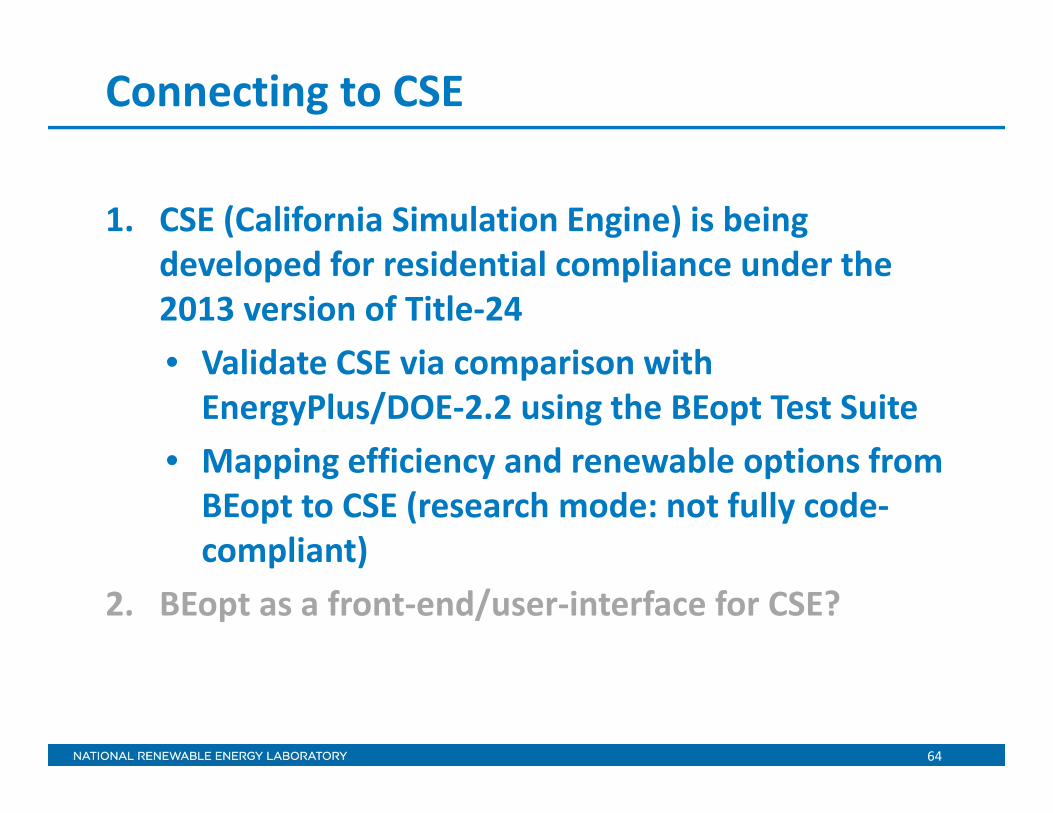
1. CSE (California Simulation Engine) is being developed for residential compliance under the 2013 version of Title‐24 • Validate CSE via comparison with EnergyPlus/DOE‐2.2 using the BEopt Test Suite
• Mapping efficiency and renewable options from BEopt to CSE (research mode: not fully code‐compliant)
2. BEopt as a front‐end/user‐interface for CSE?
65
Connecting to CSE BEopt Test Suite

66
Connecting to CSE BEopt Test Suite
67
Community~500,000 Houses
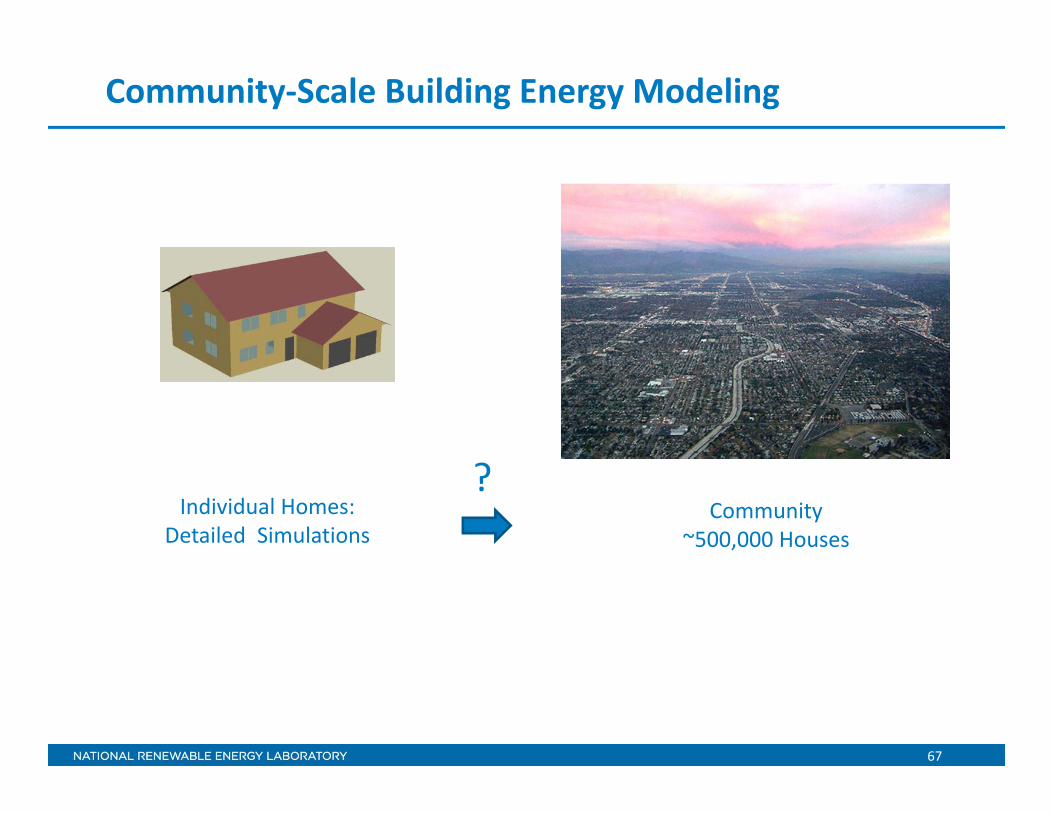
Community‐Scale Building Energy Modeling
?Individual Homes:
Detailed Simulations
68
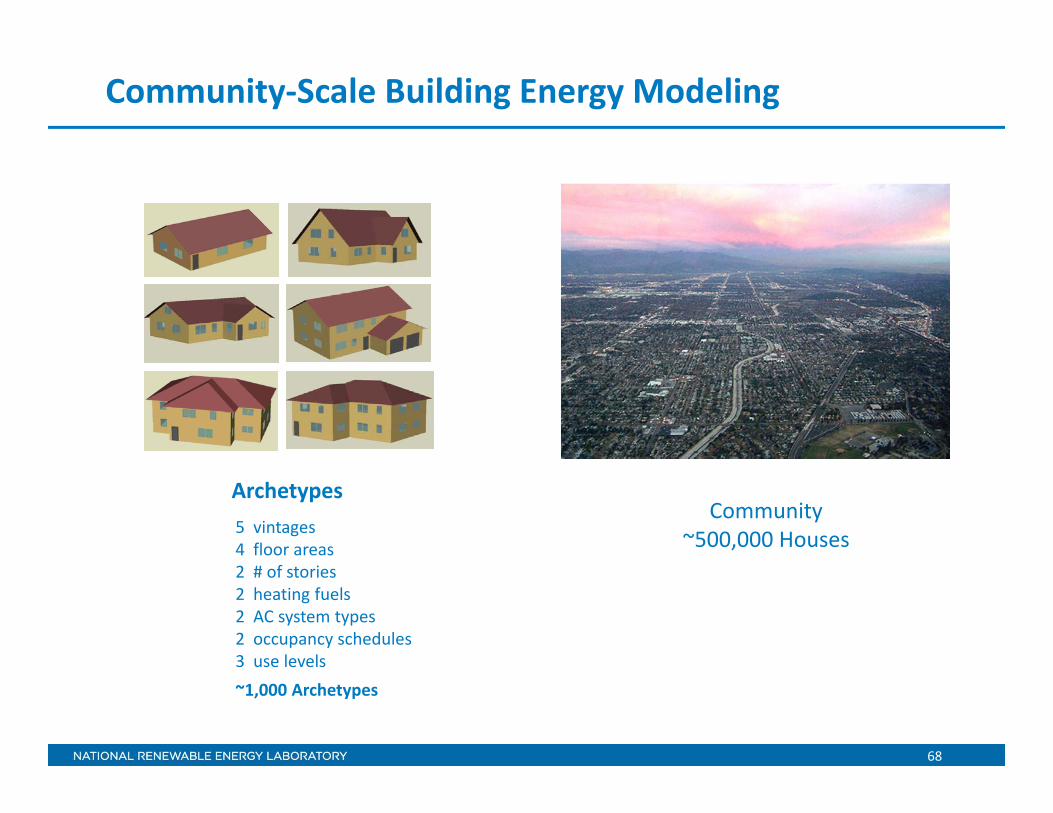
5 vintages4 floor areas2 # of stories2 heating fuels2 AC system types2 occupancy schedules3 use levels~1,000 Archetypes
Archetypes
Community‐Scale Building Energy Modeling
Community~500,000 Houses
69
Community‐Scale Building Energy Modeling
Community500,000 Houses
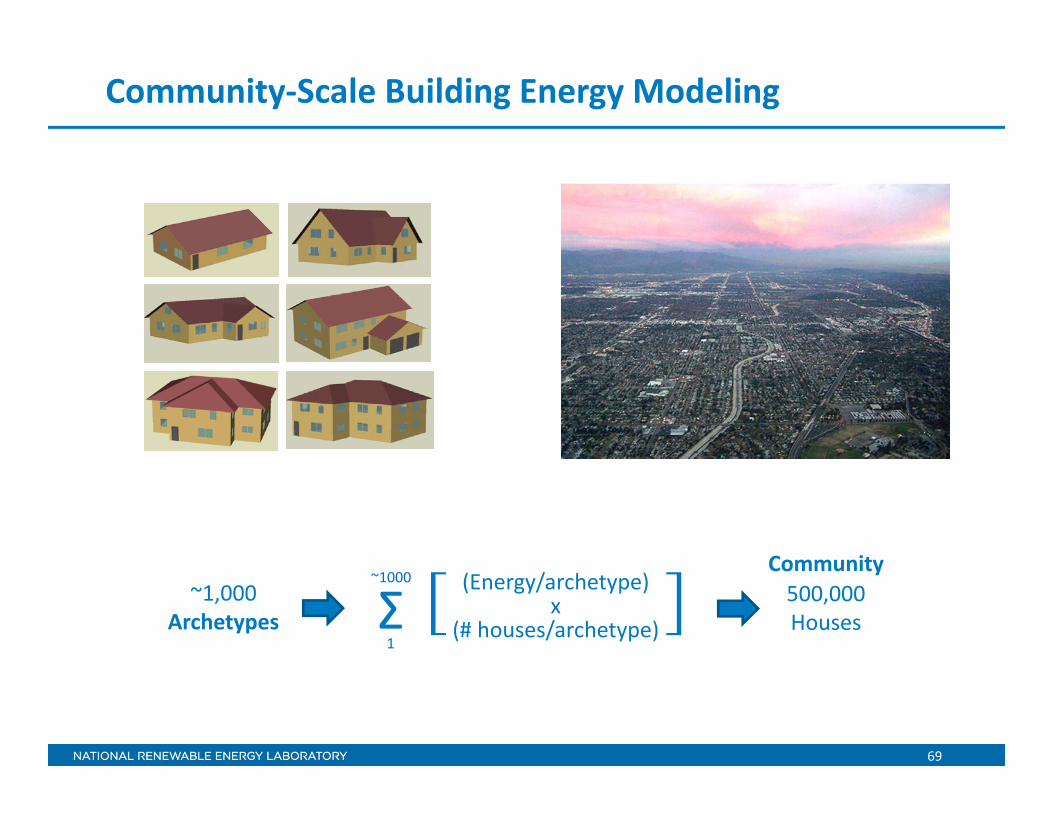
~1,000Archetypes Σ
~1000
1
(Energy/archetype)x
(# houses/archetype)[ ]

70
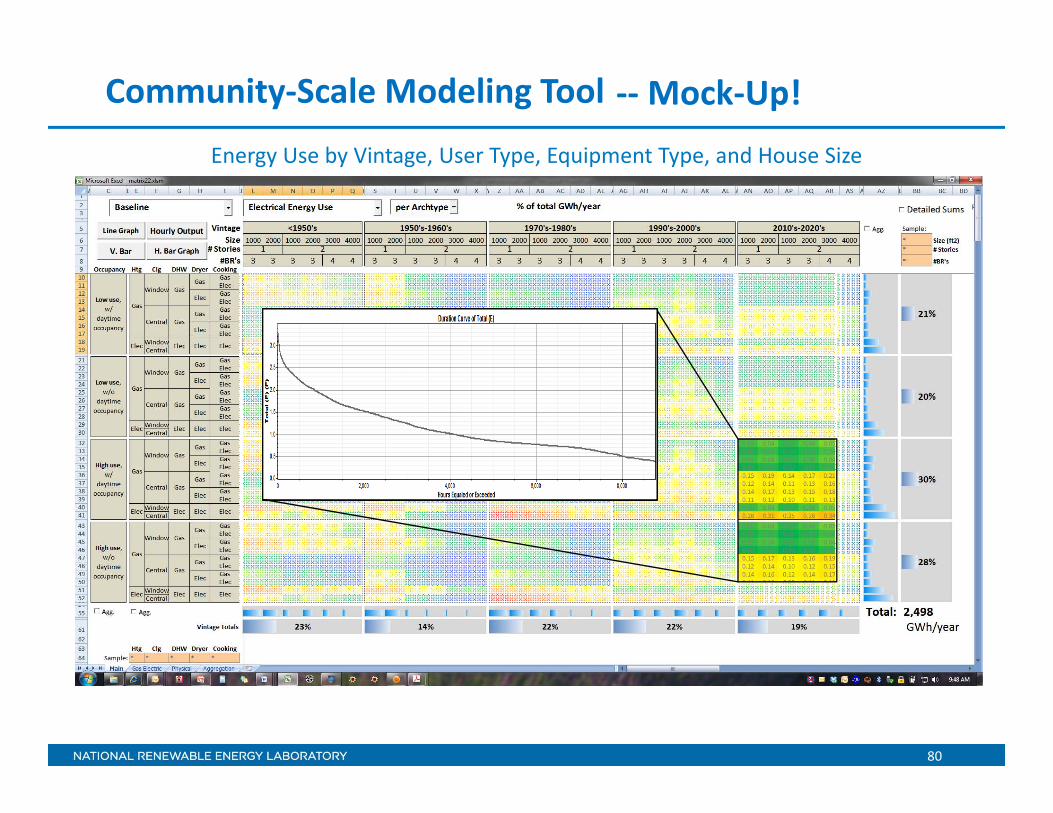
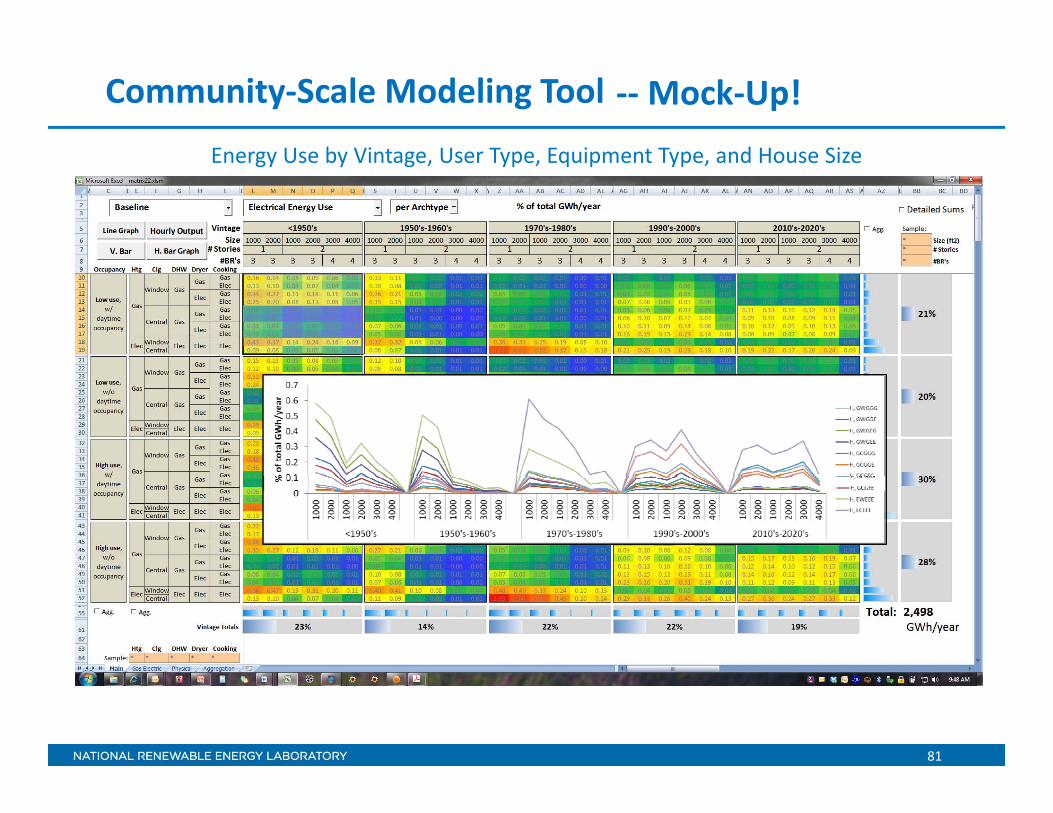
Energy Use by Vintage, User Type, Equipment Type, and House Size
How and where energy is used within the community?
Community‐Scale Modeling Tool ‐‐Mock‐Up!

71
Energy Use by Vintage, User Type, Equipment Type, and House Size
How and where energy is used within the community?
Community‐Scale Modeling Tool ‐‐Mock‐Up!
Fuel Types• Heating• Cooling• Water HeatingOccupancy Types• Daytime• Low, High
• Vintage• House Size• # Stories

72
Energy Use by Vintage, User Type, Equipment Type, and House Size
How and where energy is used within the community?
Community‐Scale Modeling Tool ‐‐Mock‐Up!
• per Archetype• per House• per ft2• Baseline
• Post‐ Retrofit• Savings
• Source Energy Use• Electrical Energy Use• Summer Peak Demand• Winter Peak Demand• Gas Energy Use• Houses
• Total• Water Heating• Heating• Cooling• HVAC Fan/Pump• Lights• Lg. Appl.• Vent Fan• Misc.• Pools/Spas• Extra fridge• Freezer

73
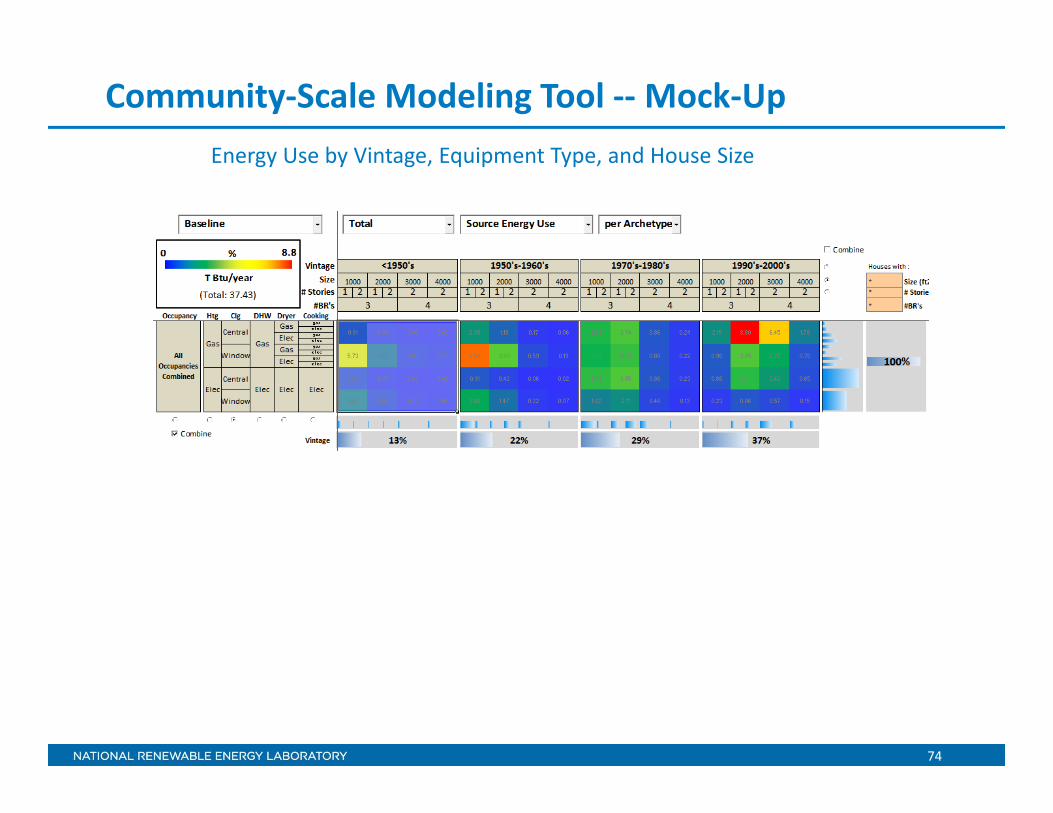
Community‐Scale Modeling Tool ‐‐Mock‐UpEnergy Use by Vintage, User Type, Equipment Type, and House Size
74
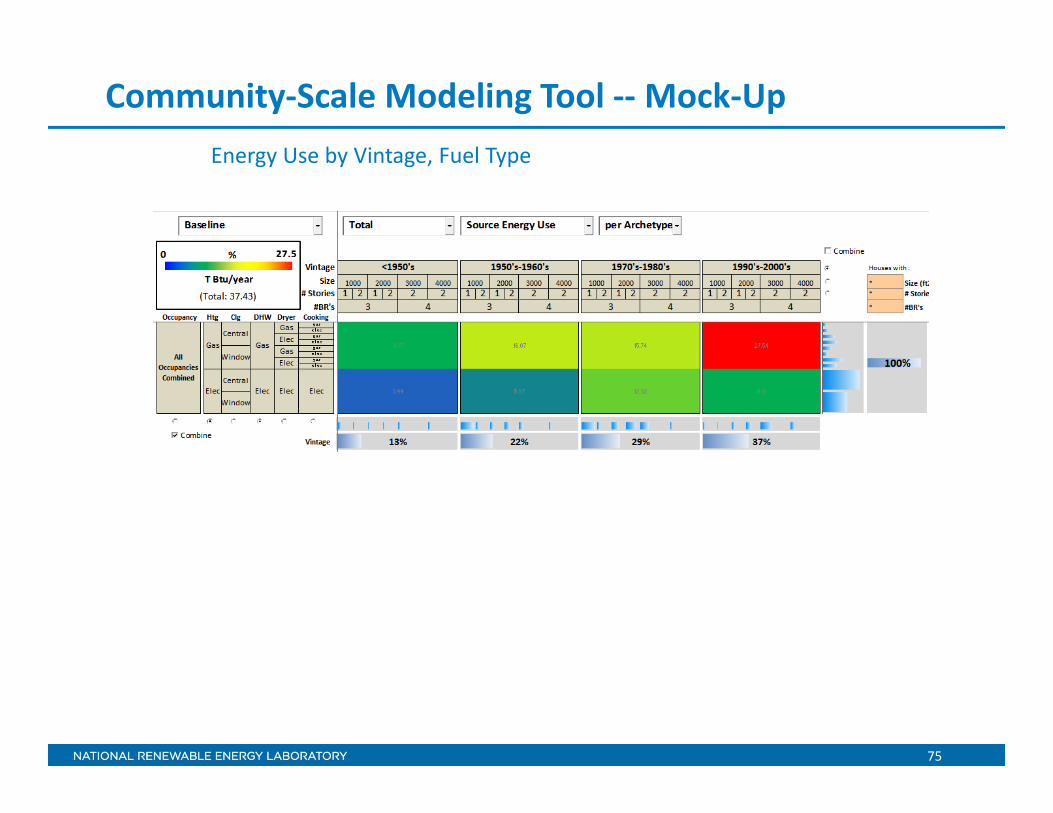
Community‐Scale Modeling Tool ‐‐Mock‐UpEnergy Use by Vintage, Equipment Type, and House Size
75
Community‐Scale Modeling Tool ‐‐Mock‐UpEnergy Use by Vintage, Fuel Type

76
Community‐Scale Modeling Tool ‐‐Mock‐UpEnergy Use by Vintage

77
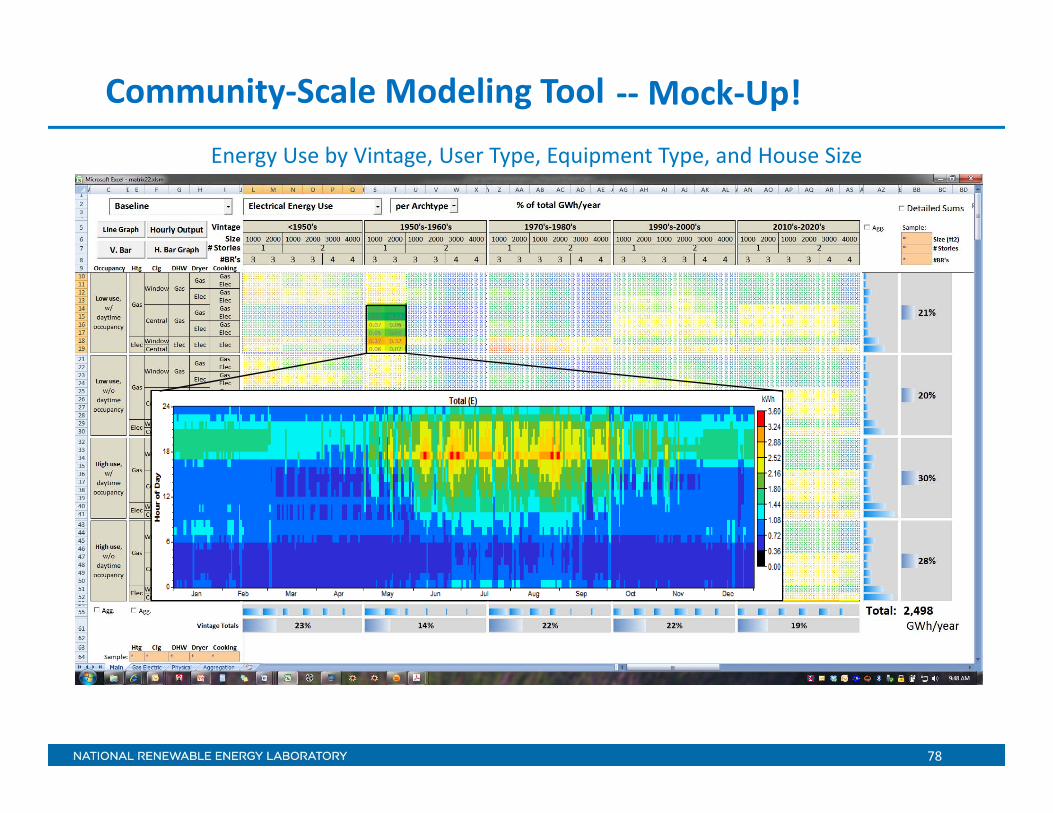
Energy Use by Vintage, User Type, Equipment Type, and House Size
Community‐Scale Modeling Tool ‐‐Mock‐Up!
78
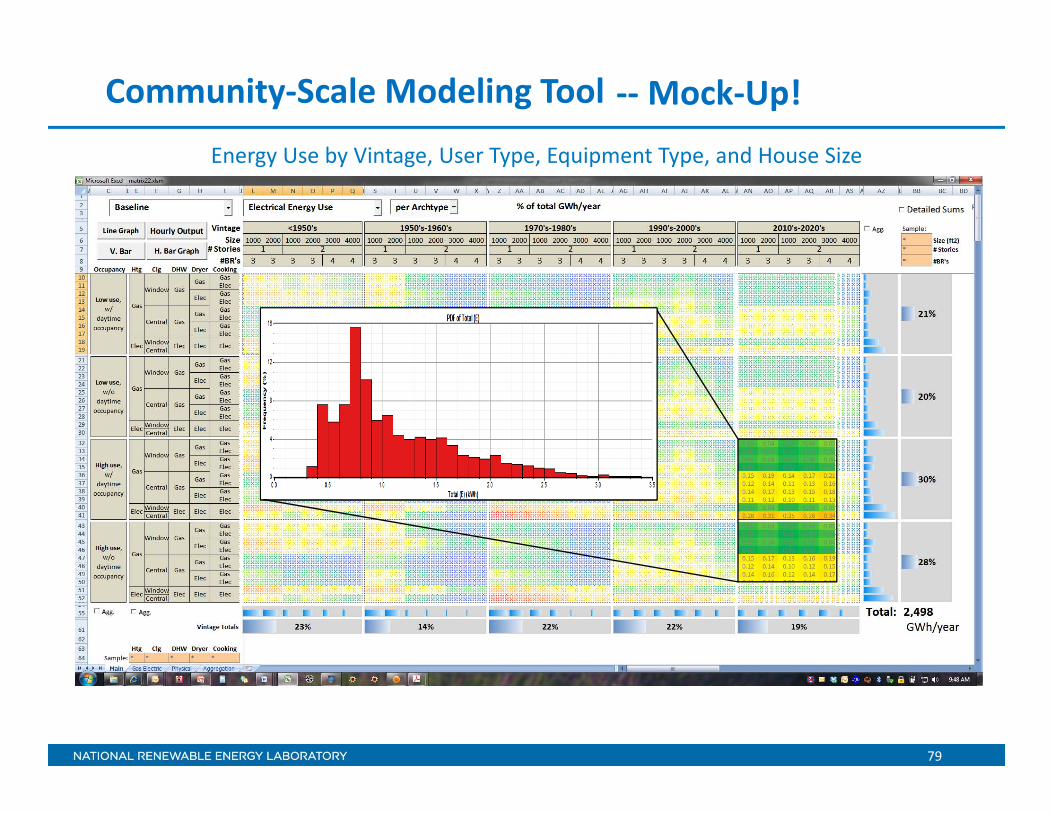
Energy Use by Vintage, User Type, Equipment Type, and House Size
Community‐Scale Modeling Tool ‐‐Mock‐Up!
79
Energy Use by Vintage, User Type, Equipment Type, and House Size
Community‐Scale Modeling Tool ‐‐Mock‐Up!
80
Energy Use by Vintage, User Type, Equipment Type, and House Size
Community‐Scale Modeling Tool ‐‐Mock‐Up!
81
Energy Use by Vintage, User Type, Equipment Type, and House Size
Community‐Scale Modeling Tool ‐‐Mock‐Up!

82
Questions, Discussion, Feedback

83

84

85

86

87
Agenda
• Introduction – Smita – 5 min• Project Overview – Dave – 5 min –
‐ 10 min• New BEopt Features
o What is BEopt? – Craig ‐‐ 10 mino Retrofit analysis ‐‐ Craig – 5 mino Demo BEopt ‐‐ Craig – 10 min
‐‐ 25 min• Utility Cost Tests
o Background and implementation – E3 – 20 mino Demo BEopt ‐‐ Scott – 10 mino Examples of using BEopt for utility cost test – E3 – 15 min
‐‐ 45 min• Ongoing and Future work:
o DR and energy storage – Dave – 5 min o Calibration – Dave – 5 mino Connecting to CSE – Scott – 5 mino Community‐scale analysis – Craig – 5 min
‐‐20 min
• Feedback and discussion – Smita ‐‐ 20 min
8888
Extra Slides
89
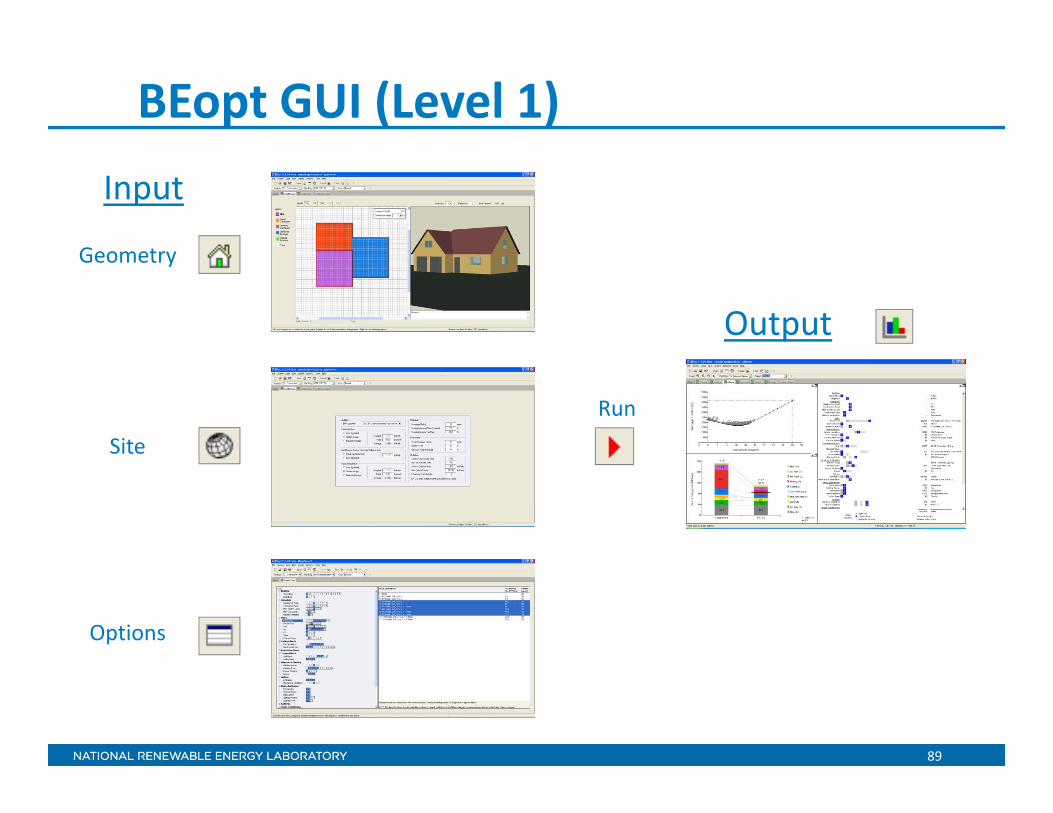
BEopt GUI (Level 1)
Geometry
Site
Options
Input
Output
Run

90
Drawing Tool – quick/accurate input of detailed building geometryBEopt input
91
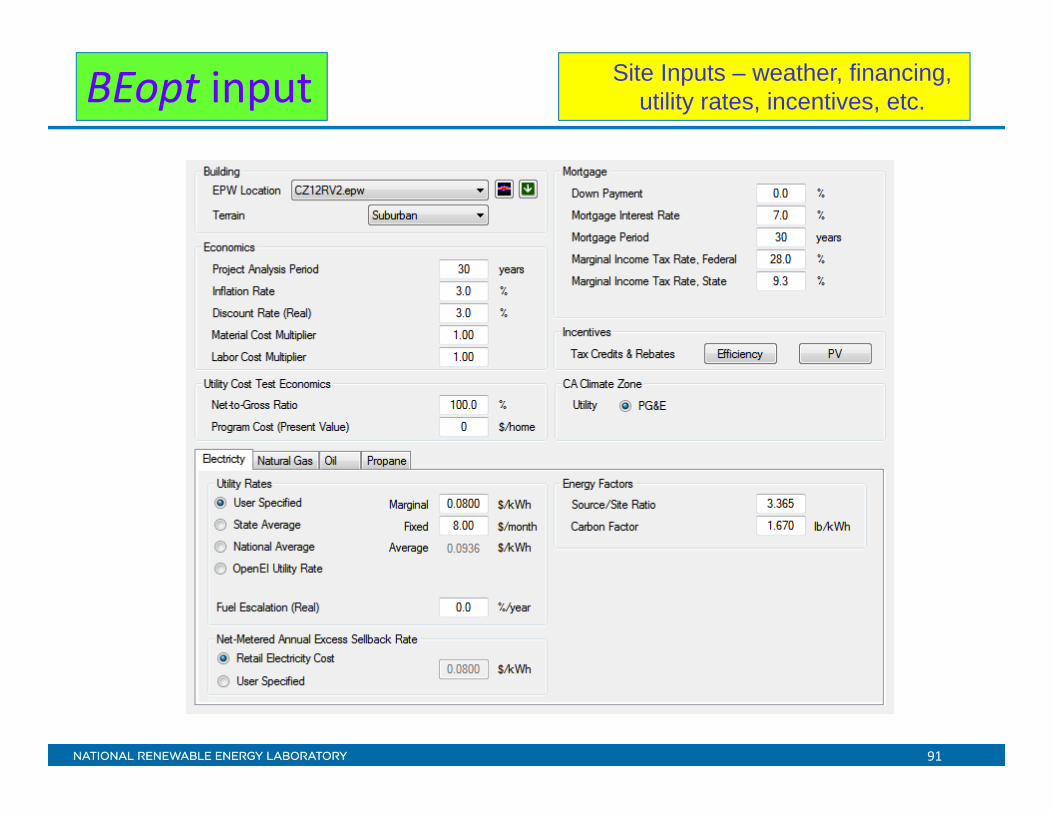
BEopt input Site Inputs – weather, financing, utility rates, incentives, etc.

92
Category Options
Options – operation, envelope, equipment
~500 options (in ~50 categories)
BEopt input
93
Cost/Energy Graph
End-Use Graph
Options Graph
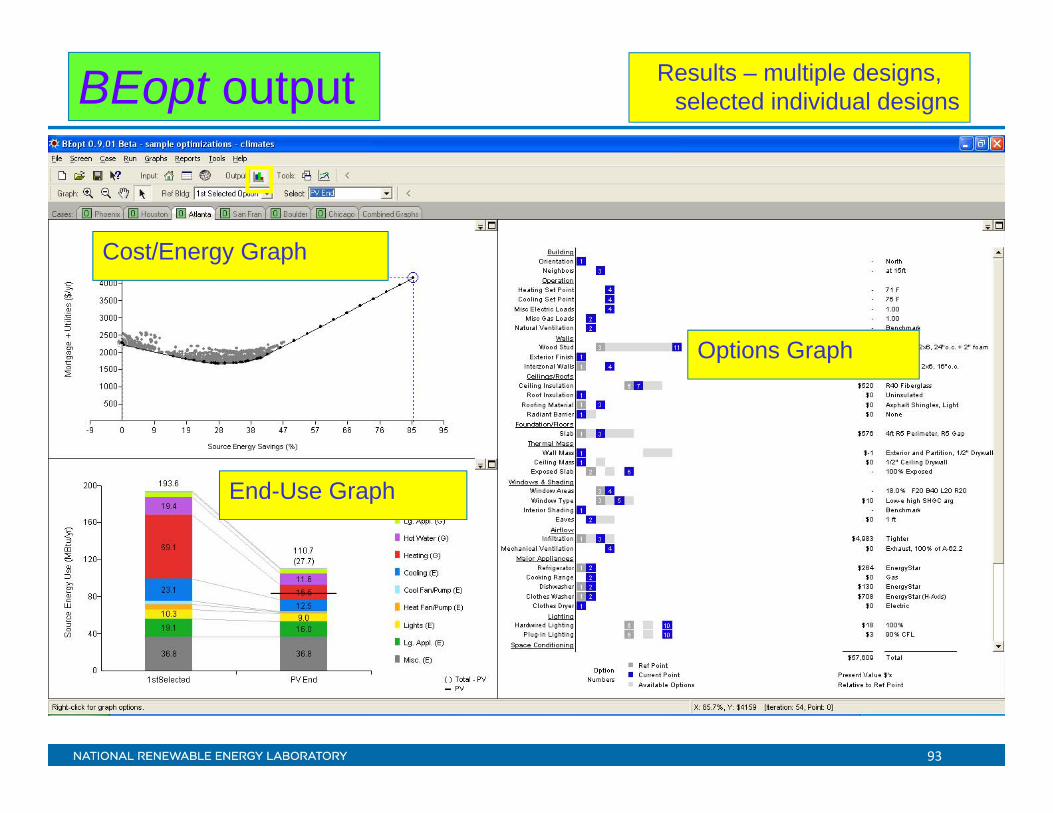
BEopt output Results – multiple designs, selected individual designs
94
California‐Specific Cost Data
• Includes measures that are most likely to be used in standard California retrofits
• Where possible applies cost data from local sources and uses California labor assumptions
• Includes details not included in other cost data• Compliments NREL’s National Residential Efficiency Measure
Database (www.nrel.gov/ap/retrofits/group_listing.cfm)
95
• Include measures that are most likely to be used in standard California retrofits
• Where possible apply cost data from local sources and use California labor assumptions
• Retrofit specific labor costs include details not included in other cost data
• Compliments NREL’s National Residential Efficiency Measure Database (www.nrel.gov/ap/retrofits/group_listing.cfm)
Retrofit Measures