benthic-pelagic coupling and the seasonal silica cycle in
TRANSCRIPT

HAL Id: hal-01071299https://hal.archives-ouvertes.fr/hal-01071299
Submitted on 6 Sep 2021
HAL is a multi-disciplinary open accessarchive for the deposit and dissemination of sci-entific research documents, whether they are pub-lished or not. The documents may come fromteaching and research institutions in France orabroad, or from public or private research centers.
L’archive ouverte pluridisciplinaire HAL, estdestinée au dépôt et à la diffusion de documentsscientifiques de niveau recherche, publiés ou non,émanant des établissements d’enseignement et derecherche français ou étrangers, des laboratoirespublics ou privés.
Distributed under a Creative Commons Attribution| 4.0 International License
Benthic-pelagic coupling and the seasonal silica cycle inthe Bay of Brest (France): new insights from a coupled
physical-biological modelG. Laruelle, Pierre Reignier, Olivier Ragueneau, M. Kempa, Brivaëla
Moriceau, Sorcha Ni Longphuirt, Aude Leynaert, Gérard Thouzeau, LaurentChauvaud
To cite this version:G. Laruelle, Pierre Reignier, Olivier Ragueneau, M. Kempa, Brivaëla Moriceau, et al.. Benthic-pelagic coupling and the seasonal silica cycle in the Bay of Brest (France): new insights from acoupled physical-biological model. Marine Ecology Progress Series, Inter Research, 2009, pp.15-32.�10.3354/meps07884�. �hal-01071299�

MARINE ECOLOGY PROGRESS SERIESMar Ecol Prog Ser
Vol. 385: 15–32, 2009doi: 10.3354/meps07884
Published June 18
INTRODUCTION
Like many other coastal areas worldwide (Cloern2001), the Bay of Brest (NW France) is a macrotidal em-bayment which is subject to major anthropogenic pres-sure. In this ecosystem, nitrogen inputs from agricul-tural practices in the watersheds have doubled sincethe 1970s (Le Pape et al. 1996). At the same time, thegastropod Crepidula fornicata invaded the bay and be-came the main benthic suspension feeder within themegafauna during the early 1990s. (Chauvaud et al.2000). In 2000, it covered approximately half of theentire benthic surface area of the bay (Chauvaud 1998).
Despite the marked increase in dissolved inorganicnitrogen (DIN) inputs, the Bay of Brest has not experi-
enced any major eutrophication events so far. Suchdynamics have been attributed to the fact that most ofthe nutrient delivery occurs before the start of the pro-ductive season. In addition, it has been argued thatthe estuarine processes occurring upstream and themacrotidal dynamics in the bay itself were not provid-ing favorable conditions for the onset of eutrophication(Le Pape et al. 1996). More surprisingly, however, nosignificant perturbation of the pelagic food-web struc-ture related to the long-term decline in the dissolvedsilica (dSi):DIN ratio which accompanied the increasein nitrate inputs has yet been observed (Ragueneau1994). In many ecosystems, such a decline has inducedchanges in phytoplankton dynamics—an increase innon-siliceous phytoplankton species at the expense of
© Inter-Research 2009 · www.int-res.com*Email: [email protected]
Benthic–pelagic coupling and the seasonal silicacycle in the Bay of Brest (France): new insights
from a coupled physical–biological model
G. G. Laruelle1,*, P. Regnier1, 2, O. Ragueneau3, M. Kempa3, B. Moriceau3, S. Ni Longphuirt3, A. Leynaert3, G. Thouzeau3, L. Chauvaud3
1Faculty of Geosciences, Department of Earth Sciences – Geochemistry, Utrecht University, PO Box 80021, 3508 TA Utrecht, The Netherlands
2Department of Earth and Environmental Sciences, Université Libre de Bruxelles, Brussels, Belgium3UMR CNRS 6539, Institut Universitaire Européen de la Mer, Place Copernic,Technopôle Brest-Iroise, 29280 Plouzané, France
ABSTRACT: A fully transient, 2-dimensional physical and biological model has been developed toquantify the seasonal cycle of silica in the estuaries–coastal zone continuum of the Bay of Brest(France). The numerical model includes an explicit representation of the benthic–pelagic coupling,which is stimulated by the increasing density of an invasive megabenthic filter feeder, the slipperlimpet Crepidula fornicata. The selected spatial resolution allows resolution of the heterogeneousdensity distribution of these organisms in the bay. Results show that the benthic nutrient dynamicsare highly variable and strongly depend on the local conditions. This heterogeneity is not reflected inthe pelagic phytoplankton population dynamics because transport and mixing homogenize the dis-tribution of nutrients and biomass. A seasonally resolved silica budget over the entire bay and estu-aries emphasizes the important contribution of the benthic recycling fluxes to the supply of dissolvedsilica (dSi) during the productive period (~50% from 1 April to 1 September). In a prognostic scenariowhich forecasts the impact of removing the invasive benthic filter feeders, the dSi efflux is reducedby 63% and a pronounced harmful algal bloom of dinoflagellates develops in late summer.
KEY WORDS: Crepidula fornicata · Dissolved silica · Harmful algal bloom · Benthic–pelagic coupling ·Nutrient cycles
Resale or republication not permitted without written consent of the publisher
OPENPEN ACCESSCCESS
Mar Ecol Prog Ser 385: 15–32, 2009
diatoms—with important implications for the pelagicand benthic food webs (Smayda 1990, Conley et al.1993, Turner et al. 1998). However, as recently re-viewed by Ragueneau et al. (2006a), such a shift inphytoplankton abundances due to modifications innutrient ratios does not always occur. In particular, ithas been advocated that the intensity of dSi recyclingwithin a specific ecosystem plays an essential role incontrolling the characteristics and succession of phyto-plankton species. The recycling intensity modifiesthe properties of the various diatom species (Robertset al. 2003), especially their degree of silicification(Rousseau et al. 2002), and ultimately favor the switchfrom diatom to non-diatom species when the dSi stressbecomes too strong (Officer & Ryther 1980).
Until very recently, diatoms have dominated thephytoplankton biomass throughout the productiveperiod in the Bay of Brest (Del Amo et al. 1997b,Beucher et al. 2004), despite indirect (Ragueneau et al.1994) and direct (Del Amo et al. 1997a, Ragueneau etal. 2002) evidence of a dSi limitation during spring. Onthe one hand, physical factors have been proposed(Ragueneau et al. 1996) to explain the limited occur-rence of dinoflagellates, which generally prefer strati-fied water bodies (Margalef 1978). On the other hand,dSi recycling is significant in this ecosystem, both inthe water column (Beucher et al. 2004) and in thesediments (Ragueneau et al. 1994, Martin et al. 2007),and therefore could explain the high resistance of thediatoms towards the decrease in the dSi:DIN ratio. DelAmo et al. (1997a) have suggested the existence of acoastal silicate pump similar to that of the oceanic sili-cate pump proposed by Dugdale et al. (1995), whichextracts dSi from the surface waters, but instead oftransferring it to the deep layers of the open ocean, itwould here be directly transported and temporarilystored in the sediments. The subsequent benthic recy-cling flux of dSi during late spring and summer couldthen explain the maintenance of diatoms throughoutthe entire productive period. Since it has been sug-gested that the invasion of Crepidula fornicata signifi-cantly increased the efficiency of the silicate pump inthe Bay of Brest (Chauvaud et al. 2000), the 2 majoranthropogenic perturbations (nutrient load increaseand invasive species) strongly interact in this ecosys-tem. The efficiency of the silicate pump is improved bythe filtering and biodeposition activities of the benthicfilter feeder, leading to a significant storage of biogenicsilica (bSiO2) in the sediments followed by dissolutionlater in the season when temperature increases. If true,such a hypothesis implies that the proliferation of thebenthic filter feeder may have aided in the prevention,at least for some time, of the expected switch in phyto-plankton dominance. From an integrated coastal zonemanagement (ICZM) perspective, the possible positive
effect of the invasive species, that is, its ability to pre-vent the development of non-diatom, possibly harmful,algal blooms, should thus be balanced with its nega-tive impact on other native benthic species in the bay(e.g. the great scallop Pecten maximus).
Previous experimental studies have already investi-gated the direct impact of the presence of Crepidulafornicata on the magnitude of benthic recycling fluxesof dSi (Ragueneau et al. 2002, 2006b). In addition, sea-sonal and annual budgets of Si have been proposed(Ragueneau et al. 2005) and the importance of the ben-thic filter feeders in the Si seasonal cycle has clearlybeen established. Yet the feedback of this biologicallydriven silicate pump on the phytoplankton dynamics inthe bay and, more specifically, its ability to maintainthe diatom dominance despite the observed wide-spread dSi limitation are important research questionsthat remain essentially unanswered. These questionsare, however, essential if one aims to forecast thepotential effect of benthic filter feeder eradication onboth the eutrophication and food-web structure in thebay. Such an engineered intervention has beenplanned since the early 2000s and, therefore, prognos-tic simulations are particularly timely to help designthe best sustainable management strategy for the Bayof Brest.
In the present study, a 2-dimensional, depth-aver-aged, hydrodynamic and reactive-transport model hasbeen developed for the estuaries and the Bay of Brest.The ecological and biogeochemical reaction networkincludes the dominant processes of the Si, C and Ncycles in the water column and surficial layers of thesediments. In particular, the model explicitly accountsfor the feeding and biodeposition activities of Crepi-dula fornicata at the sediment–water interface. Modelresults are not only compared with measurements ofstanding stocks of nutrients and chlorophyll a (chl a),but also with in situ flux and rate measurements(e.g. silica production, benthic fluxes, etc.). Mesocosmexperiments (Fouillaron et al. 2007) have shown thatobservations on process rates and material fluxes areessential to understand the biogeochemical dynamicsin the bay. The model advances our understanding ofthe Si dynamics in the bay and enables us to establishtemporally and spatially resolved budgets of silica andconduct prognostic simulation addressing the ecologi-cal consequences of partly eradicating the benthicfilter feeder from the sea bed.
MODEL SET-UP
Hydrodynamics and transport. Support: A 2-dimen-sional, vertically integrated numerical model (MIKE21, www.dhisoftware.com/mike21) was used to com-
16

Laruelle et al.: Bay of Brest seasonal silica cycle
pute the flow field in the Aulne and Elorn estuaries, theBay of Brest and the inner part of the Iroise Sea (Fig. 1).The model extends upstream in the Aulne and Elornup to the limit of tidal influence where unidirectionalflow is maintained at all times. The marine boundary inthe Iroise Sea is set to longitude 4° 36’ W. The landboundaries and bathymetry were obtained from theService hydrologique et océanographique de la marine(SHOM) digital charts. Spatial resolutions of the bathy-metric surveys in the Iroise Sea, the Bay of Brest andthe Aulne and Elorn estuaries were on the order of 500,100 and 200 m, respectively. The hydrodynamic modelwas run over the entire domain with a spatial resolu-tion of 150 × 150 m. Time series of water elevation werethen extracted along a transect through the narrowstrait between the bay and the Iroise Sea (Goulet,Fig. 1) and used to force a smaller scale, coupled phys-ical–biological model which was run over the entireyear of 2001.
Hydrodynamics: The hydrodynamic model wasbased on the vertically integrated volume (Eq. 1) andmomentum conservation equations (Eqs. 2 & 3) forbarotropic flow:
(1)
(2)
(3)
This set of coupled non-linear partial differentialequations (PDEs) resolves the spatial (x,y) and tempo-ral (t) dynamics of surface water elevation, ζ (m), andscalar components of the momentum fluxes, p and q(m2 s–1). The flux densities p and q are defined per unitlength along the y and x coordinates, respectively. InEqs. (2) & (3), h is the water depth (m), g is the Earth’sgravitation constant (m s–2), Ω is the Coriolis parameter(s–1) and M is the Manning-Strickler coefficient (m1/3
s–1), which is used to constrain the bed friction. Theeffect of wind stress (last term on the left side of Eqs. 2& 3) is also taken into account in the momentum bal-ance, using daily data of wind speed (V) and directionobtained 10 m above the surface at the LanvéocPoulmic meteorological station (48° 16’57.11’ N, 004°26’37.29’ W, Fig. 1). The wind friction factor f (V) wascalculated according to Smith & Bank (1992). The sys-tem of PDEs was solved by finite differences with
appropriate initial and boundary conditions using anon-iterative alternating direction implicit algorithm(Abbott 1979).
The Manning-Strickler and eddy viscosity coeffi-cients, M and Ex,y (m2 s–1), respectively, are modelcalibration parameters that must be specified. Eddyviscosity coefficients are proportional to the local cur-rent velocities and calculated with the Smagorinskyformula (Smagorinsky 1963) using a proportionalityconstant of 0.5. For bed friction, a Manning-Stricklervalue of 60 has been used over the entire domain.
Transport: The mass conservation equation forscalar components (salt and biogeochemical variables)is based on the vertically integrated advection–dispersion equation:
(4)
where c is the species concentration (mol m–3), u = p/hand v = q/h are the horizontal components of the veloc-ity vector (m s–1), and Dx and Dy are the eddy disper-sion coefficients (m2 s–1). The hydrodynamic modelprovides the horizontal velocity components u and v aswell as the water depth, h. In Eq. (4), ΣR is the rate ofproduction or consumption of the species by the sum ofbiogeochemical processes, defined per unit surfacearea (mol m–2 s–1), and S (mol m–2 s–1) is a source/sinkterm defining the local exchange of the species be-tween the water column and the sediment.
The equation was solved for the spatial and temporalevolution of the concentration field using appropriateinitial and boundary conditions (see below). Numericalintegration of Eq. (4) was performed using the third-order, explicit finite difference scheme QUICKEST(Ekebjærg & Justesen 1991). The dispersion coeffi-cients Dx and Dy in Eq. (4) are model parameters thatwere set proportional to the local current velocities.The proportionality constant was adjusted until agree-ment with observed salinity profiles was achieved.Both the hydrodynamic and salt transport models wererun with a time step of 20 s that guarantees stabilityof the numerical schemes. The biogeochemical modelused to calculate the ΣR and S terms was numericallydecoupled from the transport algorithm using anoperator-splitting approach. To decrease computationaltimes, it was run with a larger time step of numericalintegration of 360 s.
Biogeochemistry. Reaction network and state vari-ables: The biogeochemical model was based on a reac-tion network (RN) that describes the pelagic and ben-thic processes involved in the Si and associated C andN cycles (Fig. 2) The biogeochemical model was imple-mented within the ECOLab© environmental modeling
∂∂
+ ∂∂
+ ∂∂
− ∂∂
⋅ ∂∂( )t
hcx
uhcy
vhcx
h Dcxx( ) ( ) ( )
− ∂∂
⋅ ∂∂
⎛⎝
⎞⎠ + +
yh D
cy
Ry Σ SS = 0
∂∂
+ ∂∂
⎛⎝⎜
⎞⎠⎟ + ∂
∂ ( ) + ∂∂
+ +qt y
qh x
pqh
ghy
gq p qM
2 2 2
2
ζhh h
Eq
yE
qxx y
1 3 2
2
2
2
2
/
− ∂∂
+ ∂∂
⎡⎣⎢
⎤⎦⎦⎥
+ − =Ωp f V Vy( ) 0
∂∂
+ ∂∂
⎛⎝⎜
⎞⎠⎟ + ∂
∂ ( ) + ∂∂
+ +pt x
ph y
pqh
ghx
gp p qM
2 2 2
2
ζhh h
Ep
xE
pyx y
1 3 2
2
2
2
2
/
− ∂∂
+ ∂∂
⎡⎣⎢
⎤⎦⎦⎥
− − =Ωq f V Vx( ) 0
∂∂
+ ∂∂
+ ∂∂
=ζt
px
qy
0
17

Mar Ecol Prog Ser 385: 15–32, 2009
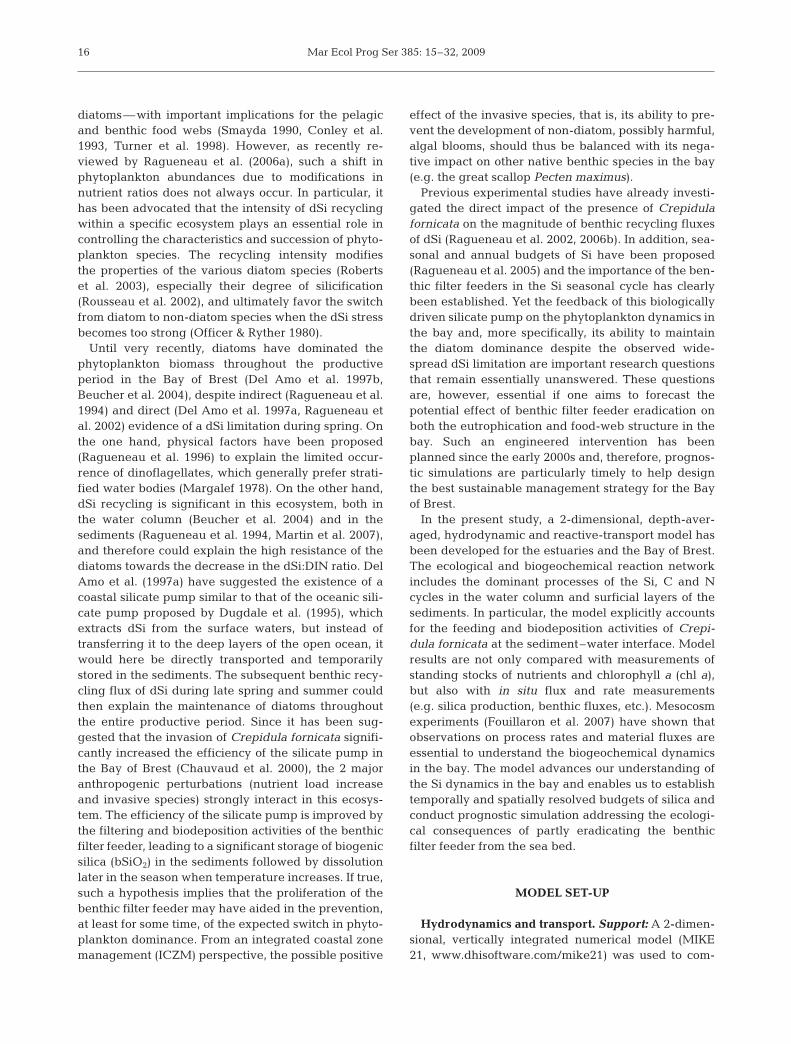
tool of DHI (e.g. Vanderborght et al. 2007,Arndt et al. 2007). All pelagic state vari-ables are subject to fluid flow motionwhile the benthic variables are fixed onthe bed and, thus, not explicitly trans-ported. The benthic compartment consistsof the top layer of the sediment where bio-logical activity is most intense. Thepelagic RN is a slightly modified versionof the reaction set proposed by Le Pape etal. (1996). The formulation of benthic pro-cesses also follows these authors, exceptfor the dynamics of benthic diatoms(microphytobenthos) and filter feeders, aswell as an improved formulation of opaldissolution. Table 1 lists all state variablesand their respective units.
Briefly, 2 phytoplankton groups (diatoms[Dia] and dinoflagellates [Dino]) are dis-tinguished in the model (Fig. 2). Pelagicdiatom growth consumes both dSi andDIN, dinoflagellates only requiring DIN.Both phytoplankton species are grazed byzooplankton (Zoo). The death of diatomssupports a pool of freshly dead diatoms(FDDia) which, in turn, are decomposedto detritic nitrogen (NDet) and detritic sil-ica (SiDet) (Jean 1994). A simpler formu-lation is used for the Dino and Zoo, whichassumes a direct transformation into NDetupon death of organisms. Zooplanktonalso excrete DIN. The detritic material(SiDet and NDet) is partially mineralized inthe water column and leads to the produc-tion of dissolved nutrients (dSi and DIN).
Overall, the state variables involved inthe benthic RN are similar to the ones im-plemented in the pelagic compartment.The model accounts for living and freshlydead benthic diatoms (BDia and BFDDia),detritic pools of Si and N (BSiDet and BN-Det) and pore-water dissolved inorganicnutrients (BdSi and BDIN). Benthic filterfeeders (Ben), which graze on pelagic(Dia, FDDia and Dino) and benthic (BDiaand BFDDia) microalgae groups are alsoexplicitly represented. The grazing onbenthic diatoms implicitly assumes thatresuspension may occur (Richard 2005,Guarini et al. 2008). BDia consume boththe silica and nitrogen present in the porewater. Their death and subsequent de-composition follows the same dynamics asthe corresponding pelagic variable. Benmortality increases the BNDet pool, excre-
18
Fig. 1. (a) Geographical extent of the model, (b) bathymetric map of the Bay ofBrest, France, and (c) spatial distribution of benthic filter feeder density. All
locations and stations referred to in the text are shown in (a) and (b)
Laruelle et al.: Bay of Brest seasonal silica cycle
tion releases BDIN and egestion produces both BSiDetand BNDet. Finally, the mineralization of BSiDet andBNDet releases inorganic nutrients (BdSi and BDIN).
Besides benthic grazing, the coupling between thepelagic and benthic compartments is realized throughthe sedimentation of Dia, FDDia, NDet and SiDet (Sterm negative in Eq. 4) which feeds the pools of BDia,BFDDia, BNDet and BSiDet, respectively. The diffu-sive fluxes of dissolved inorganic nutrients through thesediment–water interface, JB (mol m–2 s–1), provide asource of DIN and dSi to the water column (S term pos-itive in Eq. 4). This flux is positive out of the sedimentand the mass balance for the benthic variables there-fore reads:
(5)
where Hsed is the thickness of the benthic layer (m),vsed is the sedimentation rate (m s–1), cB is the con-centration of the benthic state variable (mol m–3) andRB is the net benthic flux (mol m–2 s–1), accounting
for both production (positive) and consumption(negative) processes affecting the chemical spe-cies considered.
All physiological and mineralization processesare temperature dependent. In addition, thegrowth of pelagic and benthic microalgaedepends both on light and nutrient availability,whose respective limitations are combined usingLiebig’s law (Von Liebig 1840). A detailed descrip-tion of the equations implemented in our RN,including all parameter values, is given in Appen-dix 1.
Boundary conditions: The Service d’Observa-tion en Milieu Littoral (SOMLIT) database (www.domino.u-bordeaux.fr/somlit_national/pSiteBrest.php) and the buoy-mounted MAREL (www.ifremer.fr/sismer/UK/catal/base/edmed_an.htql?CBASE=MAREL2) automated acquisition system(Fig. 1) provide high frequency nutrient and totalchl a data (sampling interval between 20 and60 min) at the Goulet site for the year 2001. At thislocation, the annual evolution of the relative pro-portions of diatoms and dinoflagellates is takenfrom Beucher et al. (2004). Following Le Pape(1996), zooplankton concentration was set to 10%of the total phytoplankton concentration.
Nutrient concentrations at the upstream limits ofthe model domain were specified using weeklymeasurements performed in the framework ofthe ECOFlux program (www.univ-brest.fr/IUEM/observation/ecoflux/ecoflux.htm). In the presentversion of the model, it is assumed that no phyto-plankton or zooplankton is introduced in the sys-
∂∂
= ⋅ − +( )H ct
v c J RBB B
sedsed Σ
19
Fig. 2. Schematic representation of the biogeochemical model. Boxesand arrows represent the state variables and processes, respectively.Thin black lines characterize the pelagic and benthic processes.Benthic–pelagic coupling occurs through grazing by benthic filterfeeders (thick grey lines), sedimentation (black dotted lines) and dif-fusion (grey dashed lines). See Table 1 for state variable abbreviations
Table 1. State variables of the models with their units and abbreviations
Abbrev. Definition Unit
Dia Diatoms μmol C l–1
Dino Dinoflagellates μmol C l–1
Zoo Zooplankton μmol C l–1
DIN Pelagic dissolved inorganic μmol N l–1
nitrogenNDet Pelagic detritic nitrogen μmol N l–1
dSi Pelagic dissolved silica μmol Si l–1
SiDet Pelagic detritic silica μmol Si l–1
FDDia Freshly dead diatoms μmol C l–1
BDIN Dissolved inorganic nitrogen mmol N m–2
in pore watersBNDet Benthic detritic nitrogen mmol N m–2
BdSi Dissolved inorganic silica in mmol Si m–2
pore watersBSiDet Benthic detritic silicon mmol Si m–2
BDia Benthic diatoms mmol C m–2
BFDDia Benthic freshly dead diatoms mmol C m–2
Ben Benthic filter feeders mmol C m–2

Mar Ecol Prog Ser 385: 15–32, 2009
tem through the upper boundaries. There areonly very few phytoplankton measurements at theupstream boundaries of the model and the few avail-able data only provide information on total biomasswithout any further details on species distribution.Nutrient data are linearly interpolated between eachsampling time interval to provide upstream concentra-tions at the frequency of the biogeochemical modelresolution. Water discharge, dSi and DIN in the Aulneand Elorn estuaries during the year 2001 are shown inFig. 3. The changes in forcing conditions (temperatureand incident solar radiation) in the bay are also shown.
Initial conditions: The spin-up time for pelagic statevariables in the model is on the order of 1 mo. To pro-vide realistic initial conditions for the simulation, themodel was launched on 1 December 2000, startingwith spatially homogeneous concentrations. However,the benthic state variables exhibit much longer spin-up times and, therefore, the model was run twice overthe year 2001. Simulations reveal that in this case, theintra-annual seasonal variation is much larger than theinter-annual variability recorded from the differencebetween the ends of the first and second years. Notethat for computational efficiency, the initial conditionsare distributed homogeneously for all variables exceptthe benthic filter feeders. The latter were estimatedfrom recent maps of spatial distribution of Crepidulafornicata in the Bay of Brest (Guérin 2004), combined
with an older estimate of the biomass of other benthicfilter feeders (Chauvaud 1998, Jean & Thouzeau 1995).The spatial distribution of C. fornicata was determinedat 127 locations in the bay during the fall of 2000. Thedensity at each model grid point in the bay was thendetermined by linear interpolation. Rivers wereexcluded from the survey and assumed here to be freeof any benthic filter feeders. An average value of0.056 g C ind.–1 (Jean 1994) was used to convert thepopulation density (ind. m–2) into carbon biomass. Thecontribution of all other benthic filter feeders (Jean& Thouzeau 1995) was then added to C. fornicata toobtain the initial spatial distribution of total benthicfilter feeder biomass. In the following, all model resultscorrespond to the second year of simulation.
RESULTS AND DISCUSSION
Hydrodynamics and transport
Hydrodynamics
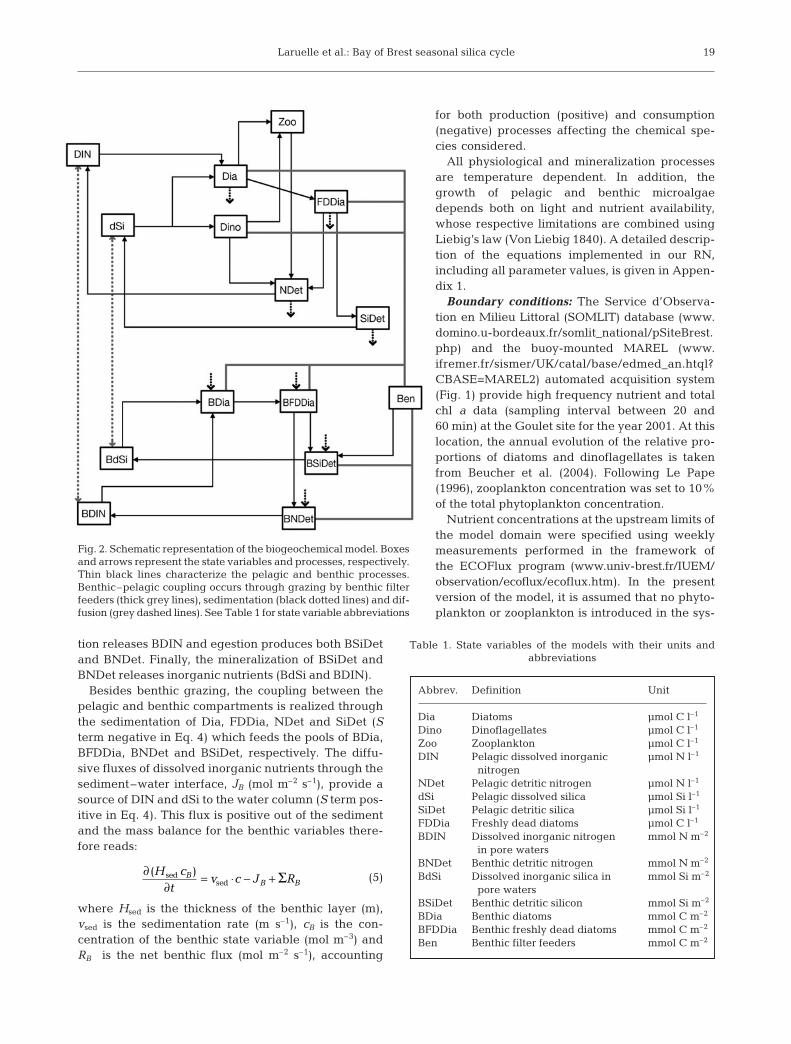
Model validation was performed on both water ele-vation and instantaneous tidal current velocities. Fig. 4compares simulated and measured elevations recordedat the single tidal gauge station located in the bay(Fig. 1) for both spring and neap tide conditions. Over-
20
Fig. 3. (a,b) Model forcing and (c–e)upstream boundary conditions for theyear 2001. (a) Incident solar radiation,and (b) average temperature for thewhole bay, (c) River discharge, (d) dis-solved inorganic nitrogen (DIN) and (e)dissolved silica (dSi) concentrations in
the Aulne and Elorn estuaries
Laruelle et al.: Bay of Brest seasonal silica cycle
all agreement between modelled andmeasured tides is achieved with an error intidal amplitude on the order of 5% anda deviation in phase never exceeding15 min. Fig. 5 shows the simulated andmeasured components of the velocity vec-tor at 4 locations in the bay (Fig. 1). Onestation (Terenez, Fig. 1b) is located nearthe mouth of the Aulne estuary, while theother stations are representative of theconditions encountered in the centre of thebay. Results reveal that both the magni-tude and direction of the flow field are wellcaptured by the model. The time lagsamong the various stations are also prop-erly reproduced. In particular, the good fitat station Terenez, which is located farthestupstream, indicates that the tidal wavepropagates accurately within the system.
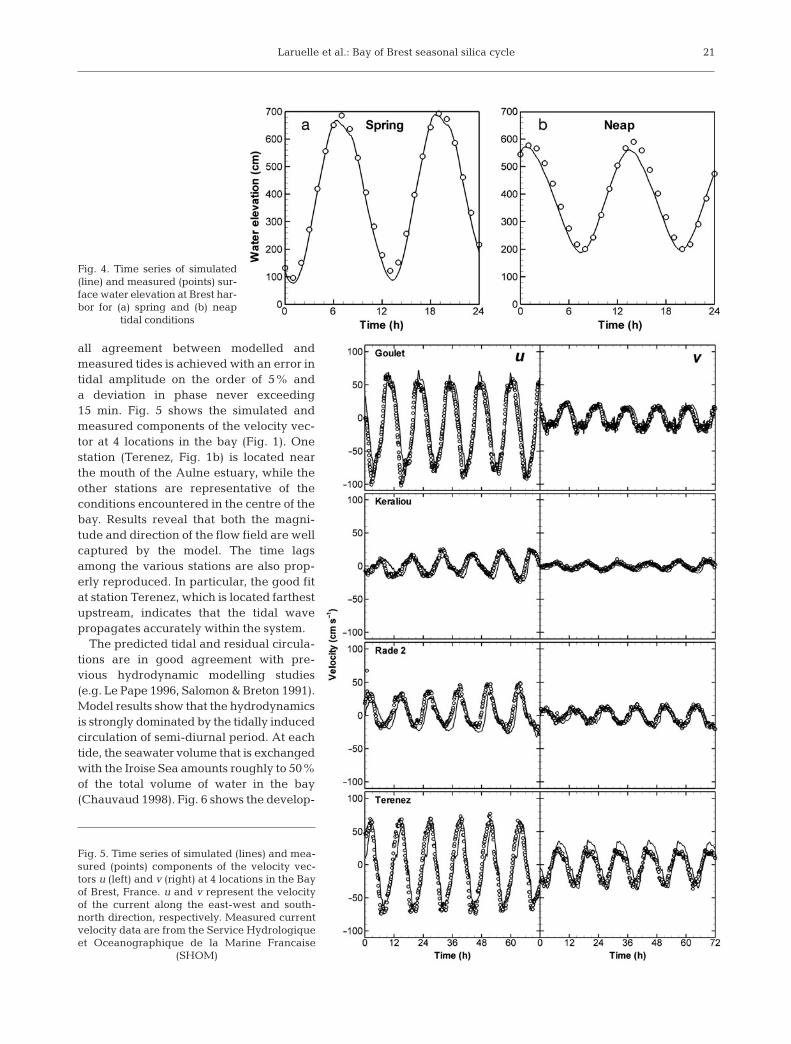
The predicted tidal and residual circula-tions are in good agreement with pre-vious hydrodynamic modelling studies(e.g. Le Pape 1996, Salomon & Breton 1991).Model results show that the hydrodynamicsis strongly dominated by the tidally inducedcirculation of semi-diurnal period. At eachtide, the seawater volume that is exchangedwith the Iroise Sea amounts roughly to 50%of the total volume of water in the bay(Chauvaud 1998). Fig. 6 shows the develop-
21
Fig. 4. Time series of simulated(line) and measured (points) sur-face water elevation at Brest har-bor for (a) spring and (b) neap
tidal conditions
Fig. 5. Time series of simulated (lines) and mea-sured (points) components of the velocity vec-tors u (left) and v (right) at 4 locations in the Bayof Brest, France. u and v represent the velocityof the current along the east-west and south-north direction, respectively. Measured currentvelocity data are from the Service Hydrologiqueet Oceanographique de la Marine Francaise
(SHOM)
Mar Ecol Prog Ser 385: 15–32, 2009
ment of large gyres in the center of the bay and verystrong currents in the narrow strait connecting the bay tothe ocean (Goulet). During the flood, the formation of thewell-documented, large central cyclonic gyre (Salomon& Breton 1991) can be identified in the model results.Several smaller anti-cyclonic gyres characterized by sig-nificantly lower velocities also develop in the northern
and southern basins. During ebb, all large circula-tion features disappear and a uniform, retreatingseaward flux of the water masses can be observedin the entire bay (Fig. 6b). The calculated residualcirculation, which filters out the short-term (<1 d)tidal components, reveals the existence of a well-established central cyclonic gyre and a complexcirculation pattern in the Goulet, with water en-tering and leaving the bay by the southern andnorthern sides of this narrow strait, respectively.The residual circulation leads to freshwater resi-dence times in the bay typically between 10 and20 d (Le Pape 1996).
Transport
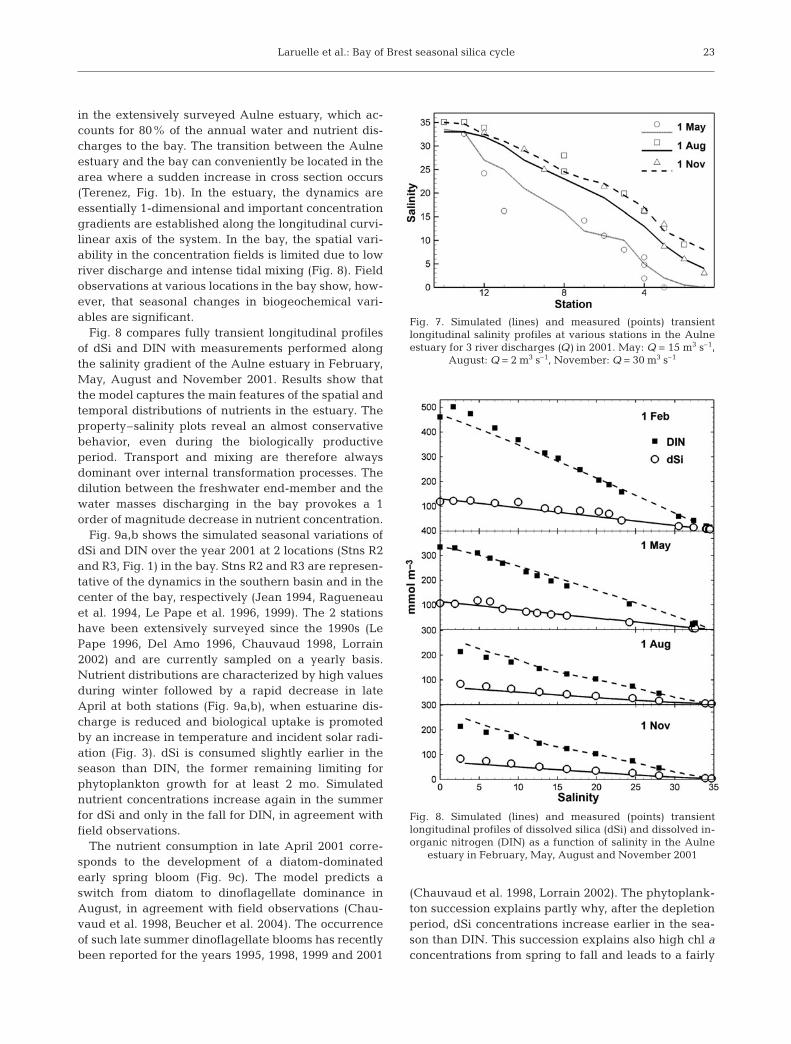
Calibration of the dispersion coefficients (Dx,y)was performed using a set of salinity data from1993 (not shown). Three salinity profiles col-lected in 2001 along a longitudinal transectwithin the Aulne estuary and the inner bay werethen used for validation of the transport model(Fig. 7). In August and November 2001, riverdischarges from the Aulne River were low (~10and ~5 m3 s–1, respectively). In contrast, May2001 was characterized by much higher values(~50 m3 s–1). Comparison between simulatedand measured profiles reveals that, under lowflow conditions characteristic of the summer pe-riod, the fully transient model properly capturesthe estuarine salt intrusion. A slightly larger de-viation is observed in May 2001, which can beexplained by the onset of a vertical stratificationof the water masses in the vicinity of the estuar-ine mouth when river flow increases. The simu-lated depth-averaged salinities are thereforehigher than the observed values collected 1 mbelow the water surface. Note, however, that thestratification is significant only in a small portionof the longitudinal transect within the estuary(~10 km into the bay from the Aulne’s riverineboundary) and is generally negligible within thebay during the biologically productive period(Salomon & Breton 1991, Le Pape 1996).
Biogeochemistry
Seasonal dynamics
The Bay of Brest and the estuaries are characterizedby different hydrodynamic and transport regimes, and,therefore, by distinct biogeochemical behavior. In thefollowing, the estuarine processes are only analyzed
22
Fig. 6. Snapshot of the velocity vector field during (a) flood tide and (b)ebb tide. (c) Computed Eulerian residual circulation in the Bay of Brest
Laruelle et al.: Bay of Brest seasonal silica cycle
in the extensively surveyed Aulne estuary, which ac-counts for 80% of the annual water and nutrient dis-charges to the bay. The transition between the Aulneestuary and the bay can conveniently be located in thearea where a sudden increase in cross section occurs(Terenez, Fig. 1b). In the estuary, the dynamics areessentially 1-dimensional and important concentrationgradients are established along the longitudinal curvi-linear axis of the system. In the bay, the spatial vari-ability in the concentration fields is limited due to lowriver discharge and intense tidal mixing (Fig. 8). Fieldobservations at various locations in the bay show, how-ever, that seasonal changes in biogeochemical vari-ables are significant.
Fig. 8 compares fully transient longitudinal profilesof dSi and DIN with measurements performed alongthe salinity gradient of the Aulne estuary in February,May, August and November 2001. Results show thatthe model captures the main features of the spatial andtemporal distributions of nutrients in the estuary. Theproperty–salinity plots reveal an almost conservativebehavior, even during the biologically productiveperiod. Transport and mixing are therefore alwaysdominant over internal transformation processes. Thedilution between the freshwater end-member and thewater masses discharging in the bay provokes a 1order of magnitude decrease in nutrient concentration.
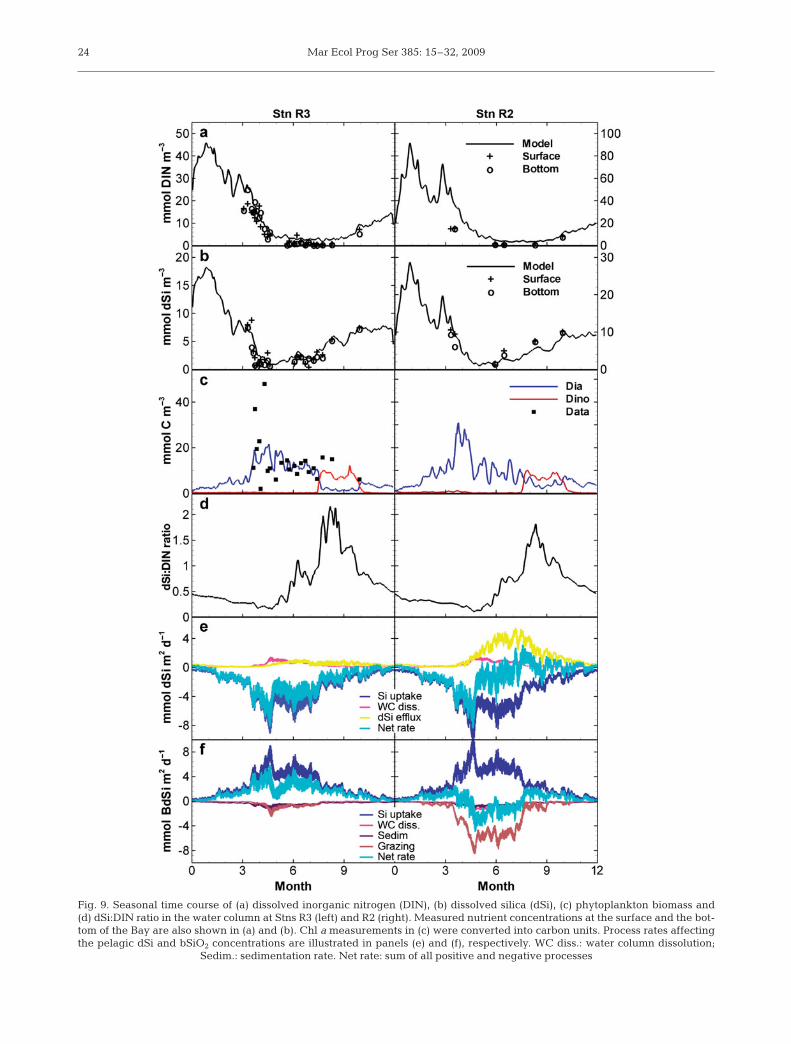
Fig. 9a,b shows the simulated seasonal variations ofdSi and DIN over the year 2001 at 2 locations (Stns R2and R3, Fig. 1) in the bay. Stns R2 and R3 are represen-tative of the dynamics in the southern basin and in thecenter of the bay, respectively (Jean 1994, Ragueneauet al. 1994, Le Pape et al. 1996, 1999). The 2 stationshave been extensively surveyed since the 1990s (LePape 1996, Del Amo 1996, Chauvaud 1998, Lorrain2002) and are currently sampled on a yearly basis.Nutrient distributions are characterized by high valuesduring winter followed by a rapid decrease in lateApril at both stations (Fig. 9a,b), when estuarine dis-charge is reduced and biological uptake is promotedby an increase in temperature and incident solar radi-ation (Fig. 3). dSi is consumed slightly earlier in theseason than DIN, the former remaining limiting forphytoplankton growth for at least 2 mo. Simulatednutrient concentrations increase again in the summerfor dSi and only in the fall for DIN, in agreement withfield observations.
The nutrient consumption in late April 2001 corre-sponds to the development of a diatom-dominatedearly spring bloom (Fig. 9c). The model predicts aswitch from diatom to dinoflagellate dominance inAugust, in agreement with field observations (Chau-vaud et al. 1998, Beucher et al. 2004). The occurrenceof such late summer dinoflagellate blooms has recentlybeen reported for the years 1995, 1998, 1999 and 2001
(Chauvaud et al. 1998, Lorrain 2002). The phytoplank-ton succession explains partly why, after the depletionperiod, dSi concentrations increase earlier in the sea-son than DIN. This succession explains also high chl aconcentrations from spring to fall and leads to a fairly
23
Fig. 7. Simulated (lines) and measured (points) transientlongitudinal salinity profiles at various stations in the Aulneestuary for 3 river discharges (Q) in 2001. May: Q = 15 m3 s–1,
August: Q = 2 m3 s–1, November: Q = 30 m3 s–1
Fig. 8. Simulated (lines) and measured (points) transientlongitudinal profiles of dissolved silica (dSi) and dissolved in-organic nitrogen (DIN) as a function of salinity in the Aulne
estuary in February, May, August and November 2001
Mar Ecol Prog Ser 385: 15–32, 200924
Fig. 9. Seasonal time course of (a) dissolved inorganic nitrogen (DIN), (b) dissolved silica (dSi), (c) phytoplankton biomass and(d) dSi:DIN ratio in the water column at Stns R3 (left) and R2 (right). Measured nutrient concentrations at the surface and the bot-tom of the Bay are also shown in (a) and (b). Chl a measurements in (c) were converted into carbon units. Process rates affectingthe pelagic dSi and bSiO2 concentrations are illustrated in panels (e) and (f), respectively. WC diss.: water column dissolution;
Sedim.: sedimentation rate. Net rate: sum of all positive and negative processes

Laruelle et al.: Bay of Brest seasonal silica cycle
long productive period. Such dynamics differs from theconditions that prevailed in the years 1970 to 1980when the first diatom spring bloom was usually oflarger magnitude (up to 10 μg chl a l–1, which repre-sents 60 to 70 μmol C l–1 in the model) and the produc-tive period of shorter duration (Chauvaud et al. 2000).The simulated dSi uptake by diatoms is in good agree-ment with in situ rate measurements based on 32Siincorporation (Fig. 10a, Ragueneau et al. 2005), exceptfor the 2 very high uptake rates recorded at the earlystages of the productive period. This discrepancymight be attributed to the succession of distinct diatomspecies characterized by different Si:C ratios, a featurenot accounted for in the model. The observed phyto-plankton which remained in the fall of 2001 (up to1.5 μg chl a l–1, Lorrain 2002) when dSi uptake is lowmust be attributed to non-siliceous algal development,a result consistent with the simulated phytoplanktonsuccession (Fig. 9c). As already reported in previousmodeling studies (Monbet 1992, Pondaven et al. 1998),the zooplankton dynamics follows that of phytoplank-ton with a time lag of about 10 d, consistent with a typ-ical predator–prey relationship for this kind of ecosys-tem (data not shown).
The time course of water column variables at StnsR2 and R3 exhibits similar patterns and, thus, limitedspatial variability in the pelagic dynamics. At thesestations, the high density of filtering organisms leadsto a benthic exchange flux through the sediment–water interface of similar magnitude to the pelagicuptake of dSi. In contrast, the biomass of benthic filterfeeders shows a high degree of heterogeneity overshort distances (Fig. 1). The intra-annual variability inbiomass of benthic filter feeders is of the order of 40 to50%, in agreement with previous modeling studies inthe bay (Jean 1994, Grall et al. 2006). Typically, theseasonal time course of the biomass is characterizedby a decrease during winter followed by a growth
period between April and September and, during fall,a decrease back to the original winter conditions(Grall et al. 2006).
Fig. 9e,f compares the process rate distributions af-fecting dSi and bSiO2 at Stns R2 and R3. Model resultsreveal that the pelagic uptake of dSi and the dissolutionof dead diatoms in the water column are of similar mag-nitude at both stations. Benthic processes show, how-ever, a much larger variability: the grazing of diatomsby benthic filter feeders and the dSi efflux out of thesediments is roughly 1 order of magnitude higher atStn R2. At this site, benthic exchanges through thesediment–water interface are of similar magnitude tothe pelagic uptake of dSi due to the high density offiltering organisms. In contrast, the local dynamics atStn R3 is by far dominated by the pelagic activity of thephytoplankton. As a result, the dynamic balance be-tween processes always remains negative for dSi at thisstation, indicating continuous, net silica uptake over aseasonal cycle. The pattern in net rate is more complexat Stn R2 as a result of the dynamic interplay betweenpelagic production, grazing and benthic bSiO2 dissolu-tion. The benthic flux of silica reaches values as high as6 mmol Si m–2 d–1 and exceeds the dSi uptake during alarge part of the productive period.
The magnitude and timing of this high recycling fluxof bSiO2 is in good agreement with direct flux mea-surements based on sediment cores incubations(Fig. 10b, Ragueneau et al. 2005). The drop in dSiefflux in the absence of filtering organisms is also cap-tured by our model, even though the seasonal variationin the simulated flux is of smaller magnitude than actu-ally observed. The comparison between the pelagicdynamics at Stns R2 and R3 shows that the intense tur-bulent mixing leads to an homogenization of watercolumn properties that does not reflect the spatialheterogeneity in benthic process intensities. Field ob-servations focusing only on the time evolution of the
25
Fig. 10. (a) Simulated (points) and measured (vertical bars) pelagic dSi uptake rates. (b) Comparison of Si benthic fluxes throughthe sediment–water interface simulated (lines) and measured (points) at a station with (circles, black line) and without (triangles,
grey line) Crepidula fornicata. Data from Ragueneau et al. (2005)
Mar Ecol Prog Ser 385: 15–32, 2009
pelagic variables (DIN, dSi and phytoplankton) aretherefore of limited value to capture the biogeochemi-cal dynamics in the Bay of Brest.
Temporally resolved Si budget
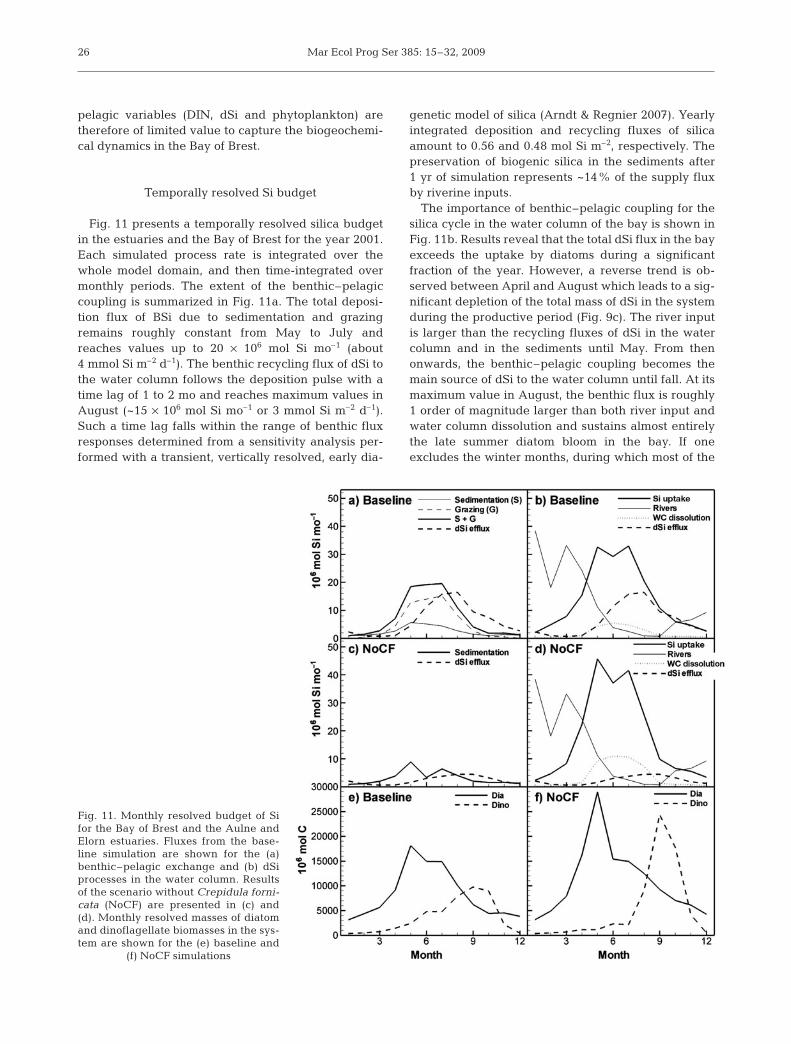
Fig. 11 presents a temporally resolved silica budgetin the estuaries and the Bay of Brest for the year 2001.Each simulated process rate is integrated over thewhole model domain, and then time-integrated overmonthly periods. The extent of the benthic–pelagiccoupling is summarized in Fig. 11a. The total deposi-tion flux of BSi due to sedimentation and grazingremains roughly constant from May to July andreaches values up to 20 × 106 mol Si mo–1 (about4 mmol Si m–2 d–1). The benthic recycling flux of dSi tothe water column follows the deposition pulse with atime lag of 1 to 2 mo and reaches maximum values inAugust (~15 × 106 mol Si mo–1 or 3 mmol Si m–2 d–1).Such a time lag falls within the range of benthic fluxresponses determined from a sensitivity analysis per-formed with a transient, vertically resolved, early dia-
genetic model of silica (Arndt & Regnier 2007). Yearlyintegrated deposition and recycling fluxes of silicaamount to 0.56 and 0.48 mol Si m–2, respectively. Thepreservation of biogenic silica in the sediments after1 yr of simulation represents ~14% of the supply fluxby riverine inputs.
The importance of benthic–pelagic coupling for thesilica cycle in the water column of the bay is shown inFig. 11b. Results reveal that the total dSi flux in the bayexceeds the uptake by diatoms during a significantfraction of the year. However, a reverse trend is ob-served between April and August which leads to a sig-nificant depletion of the total mass of dSi in the systemduring the productive period (Fig. 9c). The river inputis larger than the recycling fluxes of dSi in the watercolumn and in the sediments until May. From thenonwards, the benthic–pelagic coupling becomes themain source of dSi to the water column until fall. At itsmaximum value in August, the benthic flux is roughly1 order of magnitude larger than both river input andwater column dissolution and sustains almost entirelythe late summer diatom bloom in the bay. If oneexcludes the winter months, during which most of the
26
Fig. 11. Monthly resolved budget of Sifor the Bay of Brest and the Aulne andElorn estuaries. Fluxes from the base-line simulation are shown for the (a)benthic–pelagic exchange and (b) dSiprocesses in the water column. Resultsof the scenario without Crepidula forni-cata (NoCF) are presented in (c) and(d). Monthly resolved masses of diatomand dinoflagellate biomasses in the sys-tem are shown for the (e) baseline and
(f) NoCF simulations

Laruelle et al.: Bay of Brest seasonal silica cycle
dSi is transported as a passive tracer through the sys-tem (freshwater residence times ~10 d for a typicalwinter river discharge), the relative contributions ofthe benthic flux, the river input and the water columndissolution to the dSi supply during the period April toSeptember amount to 48, 36 and 16%, respectively.Therefore, benthic–pelagic coupling sustains an im-portant part of the annual diatom productivityin the bay.
The monthly resolved budgets can be integrated andcompared with previously established seasonal bud-gets during the winter/fall and spring/summer periodsof 2001 (Ragueneau et al. 2005). The seasonal budgetswere constructed from local measurements of silicaproduction and dissolution in the water column, as wellas from experimentally derived dSi benthic fluxesthrough the sediment–water interface. The extrapola-tion for the production flux was based on weekly sur-veys performed at a single site (Stn R3). The agreementwith the model predictions is nevertheless satisfactory,a result which can be explained by the fairly homoge-neous dSi uptake rates over the entire area of the bay.Overall agreement in dSi benthic flux estimates isalso achieved and reflects the dominant control ofCrepidula fornicata on the magnitude of these fluxes, afactor which was already accounted for in the experi-mentally derived budgets (Ragueneau et al. 2005). Alarger discrepancy is obtained for the deposition flux,the yearly integrated estimates agreeing within 30%.The winter/fall prediction from the model is only abouthalf that of Ragueneau et al. (2005), yet because mostof the internal Si cycling in the bay occurs during thespring/summer period, this variability has a limitedeffect at the yearly time scale.
The most important deviation between estimates isobtained for the water column dissolution. The model-based calculations suggest that this process accountsfor only 13% of the annual Si production, whereas theestimate from direct measurements by Beucher et al.(2004) leads to a significantly higher relative con-tribution (45%). Interestingly, a similar discrepancybetween the estimates of Beucher et al. (2004) andthose established by mass balance calculations (18%)was already reported by Ragueneau et al. (2005) andattributed to the fact that the direct measurementsrepresent a (maximum) potential dissolution flux fromthe diatom community if they were to remain perma-nently in suspension in the water column. However,the Bay of Brest is very shallow and diatoms settlerapidly; therefore, they are being heavily grazed bysuspension feeders, and the magnitude of the model-derived pelagic dissolution should logically be smallerthan the experimentally derived estimate. Obviously, asignificant fraction of the preserved diatoms will actu-ally dissolve in the sediments. However, as already dis-cussed above, it is important to obtain accurate esti-
mates of the relative contribution of water column andbenthic dissolution fluxes as this factor is instrumentalfor the determination of the time delays in Si dynamicsand, thus, for the phytoplankton dynamics in the bay.
Reduction in biomass of benthic filter feeders
The model is used here for prognostic purposes andis a first attempt at quantifying the effect of eradicatingan invasive benthic filter feeder on the Si dynamicsand phytoplankton succession in the bay. Fig. 11cshows the magnitude of the benthic–pelagic couplingin a scenario without Crepidula fornicata (referred toas NoCF) and should be compared with the results ofthe baseline simulation discussed above (Fig. 11a,b).Simulations reveal that in the NoCF scenario, the sup-ply flux of bSiO2 to the sediments and the dSi flux backto the water column are both significantly smaller thanin the baseline run. On a yearly integrated basis, theamount of bSiO2 reaching the benthic compartmentdecrease from 89 × 106 to 37 × 106 mol yr–1 when thebenthic filter feeders are removed. Although removingthe grazing term leads to a slightly higher sedimenta-tion flux (+29%) in the NoCF scenario, this increasedoes not compensate for uptake by the grazers and,therefore, the dSi efflux is roughly 3 times smaller inthis case.
The effect of the benthic–pelagic coupling on theamount of dSi available to sustain the pelagic primaryproduction is summarized in Fig. 11d. In the baselinesimulation, the benthic dSi flux to the bay is largelydominant from early June until November, the riverineinputs contributing most during the winter period. Inthe NoCF case, the benthic return flux remains smallthroughout the year. Yet, because of the increasedresidence time of the phytoplankton within the watercolumn (both living and dead), the pelagic dissolutionof dead diatoms is twice as large during most of thesummer period, and partly compensates for the drop inbenthic flux. A major difference between both scenar-ios, however, is the overall reduction of the dSi fluxduring late summer and fall, which was mainly sus-tained by the time-delayed efflux from the sedimentsin the baseline simulation.
The temporal distribution of dSi uptake (Fig. 11d)and phytoplankton succession (Fig. 11e,f) partly reflectsthe variation in dSi supply when benthic filter feedersare removed from the seabed. In the NoCF scenario,results reveal that during the spring/early summer,when the total dSi inputs from the various sources arealready reduced but not limiting, both the Si uptakeand the total diatom biomass are increased comparedto the baseline simulation. Such behavior mightappear counterintuitive but can be explained by the
27

Mar Ecol Prog Ser 385: 15–32, 2009
significantly larger residence times of living diatoms inthe bay when the sink term due to grazing is sup-pressed. As a result, the total diatom biomass, whichdevelops during the April to July period, increases by32% in the NoCF scenario. Results also reveal a moredistinct phytoplankton succession when the influenceof the benthic–pelagic coupling is reduced. In theNoCF case, the total biomass of dinoflagellates is up totwice that of the baseline scenario. The hypothesis thatan engineered intervention aiming at removing Crepi-dula fornicata from the bay might sustain enhancedharmful dinoflagellate blooms is thus supported by theresults of the present study.
CONCLUSIONS
A reactive-transport modeling approach has beenused to identify and quantify the dominant pelagic andbenthic processes of the Si cycle in the Bay of Brest andthe Aulne and Elorn estuaries. The simulations re-solved the seasonal variations in process intensitiesand helped unravel the role of the benthic filter feedersin the magnitude and timing of the benthic–pelagiccoupling in this shallow coastal ecosystem. Hydrody-namics and transport results showed that the dominantphysical controls on biological processes were prop-erly represented in our numerical model. The biogeo-chemical dynamics in the estuaries revealed limitedbiogeochemical transformation but significant dilutionupon estuarine mixing. In the bay, the model resultswere in good agreement with the measured seasonalevolution in nutrient concentration, dSi uptake andbenthic fluxes. Simulations revealed that the intensemixing in the bay limits the spatial variability in thepelagic phytoplankton dynamics. In contrast, the ben-thic processes showed a high degree of heterogeneitywhich is correlated with the spatial distribution of ben-thic filter feeders. The magnitude of the benthic effluxof dSi to the water column can vary by up to 1 orderof magnitude and, in areas densely populated byCrepidula fornicata, it may reach values comparable tothe local uptake by diatoms in the overlying water col-umn. The dSi efflux also followed the deposition pulsewith a typical time lag of 1 to 2 mo and, on a yearlybasis, preservation of bSiO2 remained limited. Ourmodel approach was particularly suitable to providetemporally resolved Si budgets for the entire bay andestuarine areas. Results revealed that the benthic recy-cling fluxes of dSi during the productive period wasthe main source (40%) of this nutrient to the bay andsustained almost entirely the late summer diatombloom. A prognostic scenario of reduction in biomassof benthic filter feeders revealed that the magnitudeand timing of the pelagic diatom bloom is only moder-
ately affected by the decrease in intensity of the ben-thic–pelagic coupling. On the other hand, the hypoth-esis that the removal of the filtering organisms on theseabed might enhance the development of harmfuldinoflagellate blooms in the bay is supported by ourmodel results.
Acknowledgments. This work was financially supported bythe EU-RTN Si-WEBS (contract number HPRN-CT-2002-000218), by the Netherlands Organization for ScientificResearch (NWO) (VIDI award 864.05.007 to P.R.) and by thegovernment of the Brussels-Capital region (Brains Back toBrussels award to P.R.).
LITERATURE CITED
Abbott MB (1979). Computational hydraulics: elements of thetheory of free surface flows. Pitman, London
Andersen V (1985) Modélisation d’écosystèmes pélagiques.Étude de processus. PhD thesis, Université Pierre et MarieCurie, Paris
Andersen V, Nival P (1988) A pelagic ecosystem model simu-lating production and sedimentation of biogenic particules:role of salps and copepods. Mar Ecol Prog Ser 44:37–50
Antia NJ, McAllister CD, Parsons TR, Stephens K, StricklandJDH (1963) Further measurements of primary productionusing a large-volume plastic sphere. Limnol Oceanogr 8:166–183
Arndt S, Regnier P (2007) A model for the benthic–pelagiccoupling of silica in estuarine ecosystems: sensitivity ana-lysis and system scale simulation. Biogeosciences 4:331–352
Arndt S, Vanderborgth JP, Regnier P (2007) Diatom growthresponse to physical forcing in a macrotidal estuary: cou-pling hydrodynamics, sediment transport and biogeo-chemistry. J Geophys Res 12. doi:10.1029/2006JC003581
Baretta-Bekker JG, Riemann B, Baretta JW, Rasmussen EK(1994) Testing the microbial loop concept by comparingmesocosm data with results from a dynamical simulationmodel. Mar Ecol Prog Ser 106:187–198
Beucher C, Tréguer P, Corvaisier R, Hapette AM, Elskens M(2004) Production and dissolution of biosilica, and chang-ing microphytoplankton dominance in a coastal ecosystemof western Europe. Mar Ecol Prog Ser 267:57–69
Chapelle A (1991) Modélisation d’un écosystème marin ciersoumis à l’eutrophisation: la baie de Vilaine (sud Bre-tagne). Etude du phytoplancton et du bilan en oxygène.PhD thesis, Université Pierre et Marie Curie, Paris
Chauvaud L (1998) La coquille Saint-Jacques en Rade deBrest: un modèle biologique d’étude des réponses de lafaune benthique aux fluctuations de l’environnement.PhD thesis, Université de Bretagne Occidentale, Brest
Chauvaud L, Thouzeau G, Paulet YM (1998) Effects of envi-ronmental factors on the daily growth rate of Pectenmaximus juveniles in the Bay of Brest (France). J Exp MarBiol Ecol 227:83–111
Chauvaud L, Jean F, Ragueneau O, Thouzeau G (2000) Long-term variation of the Bay of Brest ecosystem: benthic–pelagic coupling revisited. Mar Ecol Prog Ser 200:35–48
Cloern JE (2001) Our evolving conceptual model of thecoastal eutrophication problem. Mar Ecol Prog Ser 210:223–253
Conley DJ, Schelske CL, Stoermer EF (1993) Modificationof the biogeochemical cycle of silica with eutrophication.Mar Ecol Prog Ser 101:179–192
28

Laruelle et al.: Bay of Brest seasonal silica cycle
Del Amo Y (1996) Dynamique et structure des communautésphytoplanctoniques en écosystème côtier perturbé; ciné-tiques de l’incorporation du silicium par les diatomées.PhD thesis, Université de Bretagne Occidentale, Brest
Del Amo Y, Le Pape O, Tréguer P, Quéguiner B, Menesguen A,Aminot A (1997a) Impacts of high-nitrate freshwater inputson macrotidal ecosystems. I. Seasonal evolution of nutrientlimitation for the diatom-dominated phytoplankton of theBay of Brest (France). Mar Ecol Prog Ser 161:213–224
Del Amo Y, Quéguiner B, Tréguer P, Breton H, Lampert L(1997b) Impacts of high-nitrate freshwater inputs onmacrotidal ecosystems. II. Specific role of the silicatepump in the year-round dominance of diatoms in the Bayof Brest (France). Mar Ecol Prog Ser 161:225–237
Dugdale RC, Wilkerson FP, Minas HJ (1995) The role of asilicate pump in driving new production. Deep-Sea Res I42:697–719
Ekebjærg L, Justesen P (1991) An explicit scheme for ad-vection-diffusion modelling in two dimensions. ComputMethods Appl Mech Eng 88:3–8
Eppley RW (1972) Temperature and phytoplankton growth inthe sea. Fish Bull 70:1063–1085
Fouillaron P, Leynaert A, Claquin P, L’Helguen S and others(2007) Response of a phytoplankton community to in-creased nutrient inputs: a mesocosm experiment in theBay of Brest (France). J Exp Mar Biol Ecol 351:188–198
Grall J, Le Loc’h F, Guyonnet B, Riera P (2006) Communitystructure and food web based on stable isotopes (δ15N andδ13C) analysis of a North Eastern Atlantic maerl bed. J ExpMar Biol Ecol 338:1–15
Guarini JM, Sari N, Moritz C (2008) Modelling the dynamicsof the microalgal biomass in semi-enclosed shallow-waterecosystems. Ecol Model 211:267–278
Guérin L (2004) La crépidule en rade de Brest: un modèlebiologique d’espèce introduite proliférante en réponseaux fluctuations de l’environnement. PhD thesis, Univer-sité de Bretagne Occidentale, Brest
Jean F (1994) Modélisation à l’état stable des transferts decarbone dans le rè seau trophique benthique de la Radede Brest (France). PhD thesis, Université de BretagneOccidentale, Brest
Jean F, Thouzeau G (1995) Estimation des variables d'etatd'un modele de reseau trophique benthique en rade deBrest. C R Acad Sci Paris Sci Vie 318:145–154
Le Pape O (1996) Modélisation des cycles biogéochimiquesdes éléments limitant la production phytoplanctonique enrade de Brest. PhD thesis, Ecole Nationale supérieure d’Agronomie de Rennes
Le Pape O, Del Amo Y, Ménesguen A, Aminot A, Quéguiner B,Tréguer P (1996) Resistance of a costal ecosystem toincreasing eutrophic conditions: the Bay of Brest (France), asemi-enclosed zone of Western Europe. Cont Shelf Res 16:1885–1907
Le Pape O, Jean F, Ménesguen A (1999) Pelagic and benthictrophic chain coupling in a semi-enclosed coastal system,the Bay of Brest (France): a modelling approach. Mar EcolProg Ser 189:135–147
Lorrain A (2002) Les structures calcifiées des invertébrésmarins témoins des fluctuations de l’environnement côtier.PhD thesis, Université de Bretagne Occidentale, Brest
Margalef R (1978) Life-forms of phytoplankton as survivalalternatives in an unstable environment. Oceanol Acta 1:493–509
Martin S, Clavier J, Chauvaud L, Thouzeau G (2007) Commu-nity metabolism in temperate maerl beds. II. Nutrientfluxes. Mar Ecol Prog Ser 335:31–41
Monbet Y (1992) Control of phytoplankton biomass in estuar-
ies: a comparative analysis of microtidal and macrotidalestuaries. Estuaries 15:563–571
Moriceau B (2002) La dissolution de la silice biogé nique dansla Rade de Brest: influence des crépidules. MS thesis, Uni-versité de Bretagne Occidentale, Brest
Officer CB, Ryther JH (1980) The possible importance of siliconin marine eutrophication. Mar Ecol Prog Ser 3:83–91
Paasche E (1973) Silicon and the ecology of marine planktondiatoms: II. Silicate-uptake kinetics in five diatom species.Mar Biol 19:262–269
Pondaven P, Fravalo C, Ruiz-Pino D, Tréguer P, Quéguiner B,Jeandel C (1998) Modelling the silica pump in the perma-nently open ocean zone of the Southern Ocean. J Mar Syst17:587–618
Radach G, Moll A (1993) Estimation of the variability of pro-duction by simulating annual cycles of phytoplankton inthe central North Sea. Prog Oceanogr 31:339–419
Ragueneau O (1994) La dynamique du phytoplancton en éco-systèmes macrotidaux: couplage avec l’hydrodynamiqueet le cycle biogéochimique du silicium. PhD thesis, Uni-versité de Bretagne Occidentale, Brest
Ragueneau O, De Blas Varela E, Tréguer P, Quéguiner B, DelAmo Y (1994) Phytoplankton dynamics in relation to thebiogeochemical cycle of silicon in a coastal ecosystem ofwestern Europe. Mar Ecol Prog Ser 106:157–172
Ragueneau O, Quéguiner B, Tréguer P (1996) Contrast in bio-logical responses to tidally induced vertical mixing for twomacrotidal ecosystems of Western Europe. Estuar CoastShelf Sci 42:645–665
Ragueneau O, Chauvaud L, Leynaert A, Thouzeau G and oth-ers (2002) Direct evidence of a biologically active coastalsilicate pump: ecological implications. Limnol Oceanogr47:1849–1854
Ragueneau O, Chauvaud L, Moriceau B, Leynaert A, Thou-zeau G, Donval A, Le Loc’h F, Jean F (2005) Biodepositionby an invasive suspension feeder impacts the biogeo-chemical cycle of Si in a coastal ecosystem (Bay of Brest,France). Biogeochem 75:19–41
Ragueneau O, Conley DJ, Ni Longphuirt S, Slomp C, Ley-naert A (2006a) A review of the Si biogeochemical cycle incoastal waters, I: diatoms in coastal food webs and thecoastal Si cycle. In: Ittekkot V, Humborg C, Garnier J (eds)Land–ocean nutrient fluxes: silica cycle. SCOPE Book,Island Press, Washington, DC, p 163–195
Ragueneau O, Conley DJ, Ni Longphuirt S, Slomp C, Ley-naert A (2006b) A review of the Si biogeochemical cycle incoastal waters, II: anthropogenic perturbation of the Sicycle and responses of coastal ecosystems. In: Ittekkot V,Humborg C, Garnier J (eds), Land–ocean nutrient fluxes:silica cycle. SCOPE Book, Island Press, Washington, DC,p 197–213
Redfield AC (1934) On the proportions of organic derivationsin sea water and their relation to the composition of plank-ton. In: Daniel RJ (ed) James Johnson Memorial Volume.University Press of Liverpool, p 177–192
Richard J (2005) Crepidula fornicata: un modèle biologiquepour l’étude du rôle de la variabilité des caractères phéno-typiques (reproduction, croissance et nutrition) sur lesprocessus de colonisation en milieu marin. PhD thesis,Université de Genève
Roberts EC, Davidson K, Gilpin LC (2003) Response of tem-perate microplankton communities to N:Si ratio perturba-tion. J Plankton Res 25:1485–1495
Rousseau V, Leynaert A, Daoud N, Lancelot C (2002) Diatomsuccession, silicification and silicic acid availability in Bel-gian coastal waters (Southern North Sea). Mar Ecol ProgSer 236:61–73
29

Mar Ecol Prog Ser 385: 15–32, 2009
Salomon JC, Breton M (1991) Numerical study of the disper-sive capacity of the Bay of Brest, France, towards dis-solved substances. In: Lee Cheung (ed) Environmentalhydraulics. A. A. Balkema, Rotterdam, p 459–464
Smagorinsky J (1963) General circulation experiments withthe primitive equations. Mon Weather Rev 91:99–164
Smayda TJ (1990) Novel and nuisance phytoplanktonblooms in the sea: evidence for a global epidemic.In: Graneli E, Sundström B, Edler L, Anderson DM (eds)Toxic marine phytoplankton. Elsevier, Amsterdam,p 29–40
Smith SJ, Bank LC (1992) Modifications to beam theory forbending and twisting of open section composite beams:experimental verification. Compos Struct 22:169–177
Turner RE, Qureshi N, Rabalais NN, Dortch Q, Justic D, ShawRF, Cope J (1998) Fluctuating silicate:nitrate ratios andcostal plankton food webs. Proc Natl Acad Sci USA 95:13048–13051
Van Cappellen P, Dixit S, Van Beusekom J (2002) Biogenic sil-ica dissolution in the oceans: reconciling experimental andfield-based dissolution rates. Global Biogeochem Cycles16(4):1075, doi:10.1029/2001GB001431
Vanderborght JP, Folmer I, Aguilera DR, Uhrenholdt T, Reg-nier P (2007) Reactive-transport modelling of a river-estuar-ine-coastal zone system: application to the Scheldt estuary.Mar Chem 106:92–110
Von Liebig J (1840) Die organische Chemie in ihrer Anwen-dung auf Agrikultur und Physiologie. Friedrich Vieweg
30
Appendix 1. Parameters of the model and differential equations describing each state variable. See Table 1 for state variable abbreviations
Symbol Description Value Units Source
kNDet NDet mineralisation rate at 0°C in the water column 0.03 d–1 Baretta-Bekker et al. (1994)kSiDet SiDet mineralisation rate at 0°C in the water column 0.06 d–1 Le Pape (1996)vsed Sedimentation rate for Dia and detritic matter 1.5 mol C l–1 Andersen & Nival (1988)kdFDDia FDDia degradation rate to detritic matter 0.1 d–1 Le Pape (1996)kdBFDDia BFDDia degradation rate to detritic matter 0.1 d–1 Le Pape (1996)μmaxDia Maximum growth rate at 0°C for Dia 0.5 d–1 Chapelle (1991 )IoptDia Optimal light intensity for Dia 100 W m–2 Andersen (1985)IoptDino Optimal light intensity for Dino 140 W m–2 Andersen (1985)kNDia Half saturation constant for N for Dia 2 μmol N l–1 Eppley (1972)kNDino Half saturation constant for N for Dino 2 μmol N l–1 Le Pape (1996)kSiDia Half saturation constant for Si for Dia 1 μmol N l–1 Paasche (1973)ηDia Mortality rate at 0°C for Dia 0.02 d–1 Andersen (1985)ηDino Mortality rate at 0°C for Dino 0.02 d–1 Radach & Moll (1993)μmaxDino Maximum growth rate at 0°C for Dino 0.4 d–1 CalibrationC:N C:N ratio for phytoplankton 6.62 mol C mol N–1 Redfield (1934)Si:N Si:N ratio for phytoplankton 1 – Redfield (1934)N:chl a N:chl a ratio for phytoplankton 1 – Antia et al. (1963)Knc Non-chlorophilian light extinction coefficient 0.1 – Calibrationl Maximum depth over which the sedimentation rate is 30 m Le Pape (1996)
maximumkBNDet BNDet mineralisation rate at 0°C in the sediment 0.003 d–1 Le Pape (1996)kBSiDet Si mineralisation rate at 0°C in the sediment 0.006 d–1 Moriceau (2002)kdiffSi Diffusion coefficient for Si 0.0001 – CalibrationkdiffN Diffusion coefficient for N 0.0001 – CalibrationεDia Egestion rate of Ben for Dia 0.4 – Le Pape et al. (1999)εNDet Egestion rate of Ben for Detritic matter 0.8 – Le Pape et al. (1999)εBDia Egestion rate of Ben for BDia 0.4 – Le Pape et al. (1999)εDino Egestion rate of Ben for Dino 0.4 – Le Pape et al. (1999)AffDia Affinity of benthic feeders for Dia 0.35 – CalibrationAffDino Affinity of benthic feeders for Dino 0.35 – CalibrationAffBDia Affinity of benthic feeders for BDia 0.3 – CalibrationAffNDet Affinity of benthic feeders for detritic matter 0 – CalibrationSminDia Minimum slope of predation rate for Ben on Dia 3 mmol C m–3 CalibrationSmaxDia Maximum slope of predation rate for Ben on Dia 11 mmol C m–3 CalibrationSminDino Minimum slope of predation rate for Ben on Dino 3 mmol C m–3 CalibrationSmaxDino Maximum slope of predation rate for Ben on Dino 11 mmol C m–3 CalibrationSminBDia Minimum slope of predation rate for Ben on BDia 200 mmol C m–2 CalibrationSmaxBDia Maximum slope of predation rate for Ben on BDia 500 mmol C m–2 CalibrationSminBen Ben biomass below which grazing stops 3000 mmol C m–2 CalibrationSmaxBen Saturation threshold for Ben 18000 mmol C m–2 CalibrationηBen Mortality rate at 0°C for Ben 0.0005 d–1 Calibration

Laruelle et al.: Bay of Brest seasonal silica cycle 31
Appendix 1 (continued)
Symbol Description Value Units Source
ρBen Excretion rate at 0°C for Ben 0.0005 d–1 CalibrationτBen Maximum ingestion rate at 0°C for Ben 0.017 d–1 Le Pape et al. (1996)pDia Affinity for Dia by Zoo 0.5 – Pondaven et al. (1998)pDino Affinity for Dino by Zoo 0.5 – Pondaven et al. (1998)KZoo Half saturation constant for chlorophyll for Zoo 4.6 Pondaven et al. (1998)ηZoo Maximum mortality rate at 0°C for Zoo 0.06 d–1 Pondaven et al. (1998)ρZoo Excretion rate at 0°C for Zoo 0.01 d–1 Pondaven et al. (1998)εZoo Egestion rate for Zoo 0.4 – Pondaven et al. (1998)m0 Minimum mortality rate for Zoo 0 d–1 Pondaven et al. (1998)mdd Density-dependent mortality rate for Zoo 0.0002 d–1 Pondaven et al. (1998)burBSiDet Accumulation rate within the sediment for BSiDet 0.003 CalibrationburBNDet Accumulation rate within the sediment for BNDet 0.003 CalibrationkSiBDia Half saturation constant for Si for BDia 1 CalibrationkNBDia Half saturation constant for N for BDia 2 CalibrationIoptBDia Optimal light intensity for BDia 100 W m–2 CalibrationμmaxBDia Maximum growth rate at 0°C for BDia 0.25 d–1 CalibrationηBDia Mortality rate at 0°C for BDia 0.02 d–1 CalibrationEapp Activation energy of the Arrhenius function 60 kJ mol–1 Van Cappellen et al. (2002)R Gas constant 8.31 J K–1 mol–1 Van Cappellen et al. (2002)
State variable Equation
Dia
with f (N) = exp(0.07 ×T ) for the temperature function
for diatom growth limitation by DIN availability
for the sedimentation of diatoms where H is water depth
and for the light limitation function for diatoms
using Iz = Isurf × exp(–K × z) and K = Knc + 0.04 × (Dia + Dino)0.6
Dino
Zoo
with where
F = Dia · ρDia + Dino · ρDino
and
and ηZoo = max(m0,mdd) · Zoo
Thus and
DIN
with
NDet∂
∂= ⋅ + ⋅ + ⋅( ) ×NDet
tDino FDDia kd Zoo f Tρ ρdino FDDia Zoo ( )) ( )⋅ − × × − + × +N:C NDet Zoo Zoo
DiaZooDk f T NDet BNDet C Cε iino( )
diffN k
BDINl
DIN
l= − ×
−diffN
∂∂
= × × − ⋅ + ×∑DINt
k f T NDet ZooNDet preyprey
N:C prey( ) μ ρZZoo N:C× × +f T diffN( )
C Zoo f T GZooDino
ZooDino= × ( ) ×C Zoo f T GZoo
DiaZooDia= × ( ) ×
IDino p
Dia p Dino pDinoDino
Dia Dino
= ⋅⋅ + ⋅
IDia p
Dia p Dino pDiaDia
Dia Dino
= ⋅⋅ + ⋅
GI
K FGZoo
Dia Dia Dia
ZooZooDino Dinoand=
+=μ μmax max
IIK F
Dino
Zoo +μ εZoo Zoo Zoo
DiaZooDino= −( ) +( )1 G G
∂∂
= × ⋅ − ⋅ − ⋅[ ]Zoot
Zoo f T f T f Tμ η ρZoo Zoo Zoo( ) ( ) ( )
∂∂
= × × ×Dinot
Dino f T f l f Nμmax ( ) min ( ) , ( )Dino Dino DDino Dino ZooDino
BenDino( ) − ×[ ] − −η f T C C( )
f lH
I PI
I PI
z z( ) = × ⋅ × − ⋅Dia
act
optDia
act
optD
11exp
iia
d⎛⎝⎜
⎞⎠⎟∫ z
H
0
sed DiaH
vHlDia sed= × × × ( )1
1min ,
f NDIN
DIN kN( ) =
+DiaDia
∂∂
= × × ×Diat
Dia f T f l f NμmaxDia Dia Dia( ) min ( ) , ( ) ,ff Si f T sed C C( ) ( )Dia Dia Dia ZooDia
Ben( ) − ×[ ] − − −η DDia

Mar Ecol Prog Ser 385: 15–32, 200932
Editorial responsibility: Alain Vézina,Dartmouth, Nova Scotia, Canada
Submitted: June 23, 2008; Accepted: December 10, 2008Proofs received from author(s): May 25, 2009
Appendix 1 (continued)
dSi
with for the Si dissolution
SiDet
FDDia
BDIN
BNDet
BdSi
BSiDet
BDia
BFDDia
Ben
with
and
Thus: C Ben f T Aff pl ddlBenprey
Ben prey prey Be= × ( ) × × × ×τ nn
ddlBenBen Ben
Ben Ben
Ben Ben= +× −
− − +max
( ),
η ρτ ε
η ρτ1
1 1BBen Ben
Ben
Ben B× −⎛⎝
⎞⎠ × −
−( )min , min
max min11
εBen S
S S een
⎡⎣⎢
⎤⎦⎥
⎛⎝
⎞⎠
⎡⎣⎢
⎤⎦⎥
⎡⎣⎢
⎤⎦⎥
plprey S
S Spreyprey
prey prey
=−
−max ,min , min
max min
0 1⎛⎛⎝⎜
⎞⎠⎟
⎛⎝⎜
⎞⎠⎟
∂∂
= × × × × −Bent
Aff pl ddl[ (τ εBen prey prey Ben prey1 )) ( )]∑ × − +[ ] × ×ddl Ben Ben f T BenBen η ρ
∂∂
= × × − × ×FDDiat
f T BDia BFDDia f T kdηBDia BFDD( ) ( ) iia BenBFDDia− + ⋅C H BFDDia
∂∂
= × × ×BDiat
BDia f T f l f NμmaxBDia BDia( ) min ( ) , ( )BBDia BDia BDia BenBDia, ( ) ( )f Si BDia f T C( ) − × × − +η HH sed⋅ Dia
∂∂
= × × × + × +BSiDett
kd f T BFDDia H sedBFDDia SiDetSi:C( ) SSi:C BenDia
BenFDDia
BenBDia
BenBFDDia× + + +[ ]C C C C
( )− × × − ×BSiDet k f A BSiDetBSiDet bburBSiDet
∂∂
= × × −BdSit
BSiDet k f A diffSiBSiDet ( )
∂∂
= − × × × + × + ×BNDett
k f T BFDDia H sed fBFDDia NDetN:C( ) η (( )T Ben Ci
× + × −( ) ⋅∑N:C prey prey1 ε
( )− × × − ×BNDet k f T BNDet burBNDet BNDet
∂∂
= × × − + × × ×BDINt
BNDet k f T diffN f T BenBNDet N:C( ) ( )ρ
∂∂
= × × − × × −FDDiat
f T Dia FDDia f T kd sηDia FDDia( ) ( ) eed CFDDia BenFDDia−
∂∂
= × ×[ ] − × ×SiDett
FDDia kd f T SiDet kSi:C FDDia SiDet( ) ff A sed C C( ) − + +[ ]SiDet ZooDia
ZooFDDiaSi:C
and
BdSi
diffSidiffSi k ldSi
l= ×
−–
f A AE
R Tapp( ) exp= ⋅ −⋅
⎛⎝⎜
⎞⎠⎟
∂∂
= × × − ×( ) +dSit
k f A SiDet Dia diffSiSiDet DiaSi:C( ) μ