benthic habitat mapping in western port– review and study
TRANSCRIPT

Prepared by Dr Daniel Ierodiaconou and Richard Zavalas Page 1 of 41
Benthic Habitat Mapping in Western Port– Review and Project Proposal
BenthicHabitatMappinginWesternPort–DesktopReviewandStudyDesign
FacultyofScience,Engineering&BuiltEnvironment
SchoolofLifeandEnvironmentalSciences,
DEAKINUNIVERSITY
February2015
AGH‐CEP0‐EV‐REP22

In May 2016 the Special Minister of State asked Infrastructure Victoria to provide advice on the future capacity of Victoria’s commercial ports. Specifically, the Minister has asked for advice on when the need for a second container port is likely to arise and which variables may alter this timeline. The Minister has also asked for advice on where a second container port would ideally be located and under what conditions, including the suitability of, and barriers to investing in, sites at the Port of Hastings and the Bay West location.
In undertaking this task, Infrastructure Victoria reviewed work that was completed as part of the Port of Hastings development project before it was cancelled in 2014. This document forms part of the initial work undertaken for the proposed port development at Hastings. Infrastructure Victoria considers that much of the previous Hastings work, although preliminary in nature, is relevant and suitable for informing a strategic assessment. Therefore, Infrastructure Victoria has made the reports previously commissioned for the development project part of the evidence base on which Infrastructure Victoria will use in providing the Minister with advice.
The opinions, conclusions and any recommendations in this document are based on conditions encountered and information reviewed at the date of preparation of the document and for the purposes of the Port of Hastings Development Project.
Infrastructure Victoria and its consultants have used the information contained in these reports as an input but have not wholly relied on all the information presented in these reports.

Prepared by Dr Daniel Ierodiaconou and Richard Zavalas Page 2 of 41
Benthic Habitat Mapping in Western Port– Review and Project Proposal
Table of Contents
1. Introduction ........................................................................................................................................ 3
1.1Context ......................................................................................................................................... 3
1.1.1Projectoverview ................................................................................................................ 3
1.1.2Environmentalandsocialstudies .................................................................................. 3
1.2PurposeandScope ....................................................................................................................... 5
1.3Limitations ................................................................................................................................. 5
2.KeyQuestions .................................................................................................................................... 6
2.1SummaryofBenthicHabitatsinWesternPort ..................................................................... 6
2.2Keyquestionstobeaddressed................................................................................................. 8
3.InformationReview........................................................................................................................... 9
3.1Overviewofexistingstudies .................................................................................................... 9
3.2KnownnaturalvaluesinWesternPortbygeographiczone ............................................ 15
3.3KnowledgegapsandConclusions ......................................................................................... 22
3.3.1Summaryofknowledgegaps ........................................................................................ 22
3.3.2PracticalityofHabitatMappinginWesternPort ...................................................... 26
3.3.3Reviewofavailabletechnologyforhabitatmapping ............................................... 27
4.StudyPlanProposal ........................................................................................................................ 29
4.1BaselineHabitatSurvey ......................................................................................................... 29
4.1.1Surveyareaandsummary ............................................................................................. 29
4.1.2MultibeamSONARdatacollection ............................................................................... 31
4.1.4Groundtruthdataprioritisation ................................................................................... 33
4.1.5Videodatacollection ...................................................................................................... 33
4.1.5Habitatclassification ...................................................................................................... 34
4.2MonitoringEnvironmentalResponse ................................................................................... 36
4.2.1Regionalreferencesites ................................................................................................. 36
References ............................................................................................................................................ 39

Prepared by Dr Daniel Ierodiaconou and Richard Zavalas Page 3 of 41
Benthic Habitat Mapping in Western Port– Review and Project Proposal
1.Introduction
1.1Context
1.1.1ProjectoverviewThe Victorian Government has identified the Port of Hastings as a key area for port expansion. An
expanded Port of Hastings will increase capacity and competition in the container ports sector
servicing Melbourne and Victoria helping to manage the expected growth in container trade.
The Port of Hastings Development Authority (the Authority) and its board were established in
January 2012 under the Transport Integration Act 2010. The primary objectives of the Authority are
to:
manage and operate the Port of Hastings; and
facilitate the development of the Port of Hastings as a viable alternative to the Port of
Melbourne as a container port to increase capacity and competition in the container ports
sector to accommodate future growth in trade, consistent with the vision statement and the
transport system objectives.
Over the next three to four years, the Authority will be working to develop a business case for an
expanded Port of Hastings and undertake comprehensive environmental assessment. This business
case will include:
preferred project design/scope (including transport connections)
necessary environmental approvals (including impact assessment)
preferred governance and delivery strategy
In May 2014, the Port of Hastings Development Project was declared a 'Major Transport Project'
under the Major Transport Project Facilitation Act 2009 (MTPF Act).
In July 2014, the then Minister for Ports, Mr David Hodgett, formally appointed the Authority as the
Project Proponent under the MTPF Act.
1.1.2EnvironmentalandsocialstudiesThe overall design methodology for the Project involves an iterative design process which has
commenced and will continue for around two years. The design process will cycle and re‐cycle the
evolving design through an evaluation process that allows design options to be tested and evaluated
against economic, environmental, social and other objectives and associated criteria. Performance
requirements will be developed as an integral part of the design process to clearly define the
environmental and social outcomes that the Project must achieve in its implementation phases. The
preliminary design will demonstrate the way in which the Authority considers the Project could be
developed so as to achieve the performance requirements.
Environmental and social studies are required for the Project to inform the design development
process and to assess the Project in accordance with the Approvals Strategy previously adopted by

Prepared by Dr Daniel Ierodiaconou and Richard Zavalas Page 4 of 41
Benthic Habitat Mapping in Western Port– Review and Project Proposal
the Authority. An overview of the framework for the environmental and social studies and their
relationship with the design process is shown in Figure 1.
Figure 1. Framework for environmental and social studies
As shown in Figure 1, a stepwise approach is being employed to implement the environmental and
social studies for the Project. This reflects both the iterative relationship between the studies and
the design development process and their ultimate purpose of informing assessment under the
Major Transport Projects Facilitation Act 2009 (MTPF Act) and the Environment Protection and
Biodiversity Conservation Act 1999 (EPBC Act).
The key steps in the implementation of the environmental and social studies are:
Undertake an initial assessment of need using an issues screening process to identify
priorities for studies
Initiate environmental and social investigations required to support the design development
process
Undertake desktop reviews to complete the assessment of the adequacy of existing
information and confirm methodology for any further existing conditions investigations,
including field work (where required)
Project concept
Iterative design process
Initial preliminary design
Final preliminary design
Preliminary risk report
Desktop studies
Initial data collection &
fieldwork
Detailed investigations &
assessment
CIS assessment
Draft environmental
objectives
Initial performance
requirements
Refined performance
requirements
Final performance
requirements
Project objectives, key assumptions, and assets, values and uses
Design Development Environmental and Social Studies Performance Requirements
Prepared by Dr Daniel Ierodiaconou and Richard Zavalas Page 5 of 41
Benthic Habitat Mapping in Western Port– Review and Project Proposal
At the relevant stage of project definition and taking into account emerging performance
requirements, undertake field and other investigations to characterise existing conditions
Following the issue of the preliminary design, undertake risk and impact assessments to
support preparation of the CIS.
1.2PurposeandScopeThe purpose of this report is to present a desktop review of the adequacy of existing information
and confirm methodology for any further existing conditions investigations, including field work
(where required) for habitat mapping.
The scope of this report includes:
Identifying the key questions to be addressed by a habitat mapping baseline study in support
of investigations being completed for the Project
Review of existing background information and historical data to identify its suitability to
map habitats in support of design decision making, impact assessment, identification of
relevant management and mitigation measures and development of performance criteria,
and approvals requirements
Identifying gaps in existing data or information which should be addressed to adequately
inform design decisions, impact assessment, performance requirements and approvals
Defining a habitat mapping method to address any identified information requirements.
1.3LimitationsThe contents of this document reflect Deakin University’s current position on the subject matter of
this document. It is provided for discussion or information purposes and is intended to be a guide
only. The contents of this document should not be relied upon as representing Deakin University’s
final position on the subject matter, except where stated otherwise. Any views expressed by Deakin
University in this document may change as a consequence of Deakin University finalising formal
technical studies or specifications, or legislative, or procedure and regulatory developments. Any
figures provided are indicative only, are subject to change and are dependent upon a number of
factors.

Prepared by Dr Daniel Ierodiaconou and Richard Zavalas Page 6 of 41
Benthic Habitat Mapping in Western Port– Review and Project Proposal
2.KeyQuestions2.1SummaryofBenthicHabitatsinWesternPortThe following section provides and overview of the marine habitats that occur in Western Port which
are also identified in the Ecological Character Description for the Ramsar sites as critical ecosystem
components of the site.
The Western Port embayment is an estuarine environment characterised by extensive mudflats
(approximately one third of West Port), saltmarsh, mangroves and seagrass beds (IMCRA 2006). It is
a large shallow bay that is divided into five interconnected basins by several islands and channel
constrictions. The geography of Western Port means that strong and complex tidal currents create
pathways for dispersal of benthic flora and fauna as well as movement of sediments, nutrients and
toxicants (Melbourne Water 2011).
The benthic biological habitats within the bay are especially important (e.g. see Figure 2), providing
many varied ecosystem services including nursery/reproduction habitat for shorebird and fish,
reduction of sedimentation and carbon sequestration. Mangrove and saltmarsh are the dominant
intertidal vegetation within Western Port, where the coast retains a massive area of intact saltmarsh
(Boon et al.et al. 2011). Within the bay there is only one mangrove species, Avicennia marina subsp.
australasica, stands of which often control sedimentation patterns creating depositional mudflats
(Bird 1986). Below the low tide mark, seagrass is the dominant macrophyte with four main species
detected in the bay; Zostera muelleri, Heterozostera tasmanica, Halophila australis and Amphibolis
antarctica (Blake & Ball 2001). Seagrasses are colonisers of mud, silt and sand and are therefore
important for maintaining water quality and providing ideal habitat for fish and benthic fauna
communities (Blake & Ball 2001). Linkages between fish communities and benthic habitats are
among some of the most ecologically significant relationships within Western Port. This includes
nursery habitat for many species and areas of high diversity, such as the south‐eastern corner where
diverse reef biota close to rhodolith beds and breeding areas for elephant fish form complex
interdependent benthic habitats with high natural values (Melbourne Water 2011).
Intertidal mudflats and highly diverse invertebrate communities within soft sediments create an
important environment for many bird species; including shorebird habitat that harbours 10000 –
15000 migratory waders, in excess of 10000 ducks and Black Swans and threatened species such as
the Fairy Tern (Cygnus atratus)(KBR 2010). In 1982 a large portion of Western Port was classified as
Ramsar wetland signifying its international importance (KBR 2010). It is due largely to the soft
sediment fauna and complex vegetation communities that make these environments so ecologically
important. Because of the extensive interconnected channels and bodies of shallow water coupled
with strong tidal flushes, benthic habitats are particularly susceptible to critical linkages within the
bay. For example the extent and penetration of marine tidal currents can be witnessed with the
Crawfish Rock in the north arm, which supports a rich diversity of marine algae, filter‐feeding
sponges, ascidians and other sessile biota. Shepherd et al. (2009) displayed the vulnerability of these
biological communities to disturbances from increased sedimentation and reduced water quality.
The decline in water quality caused by large scale seagrass loss in the 1970s, impacted flora at
Crawfish Rock resulting in a sharp decline in canopy biomass and species richness of marine algae
(↓66%) over the past 35 years (Shepherd et al.et al. 2009).

Prepared by Dr Daniel Ierodiaconou and Richard Zavalas Page 7 of 41
Benthic Habitat Mapping in Western Port– Review and Project Proposal
a. Dense seagrass, Zostera sp. on sand (north arm) b. Dense sea pens on sand (north arm)
c. Sponges and gorgonians on reef (north arm) d. Bare silt with infauna burrows (north arm)
e. Bryozoans and sponges (Corinella) f. Dense rhodolith bed (Rhyll)
g. Rhodoliths with seagrass (Rhyll) h. Rhodoliths and mixed algae (Rhyll)
Figure 2. Example representative benthic habitats and communities in Western Port. Image still frames from groundtruth video surveys (Blake et al. 2013)

Prepared by Dr Daniel Ierodiaconou and Richard Zavalas Page 8 of 41
Benthic Habitat Mapping in Western Port– Review and Project Proposal
2.2KeyquestionstobeaddressedThis section defines the scope of the marine habitat mapping requirements by identifying key
questions that should be addressed in the review of the adequacy of existing information to describe
marine habitats from a current and historical perspective in Western Port. The key questions and
scope of proposed mapping investigations will provide important baseline information to support
other specialist investigations including seagrass, marine fish and water quality.
1. What is currently known about Western Port benthic habitats and where are they
located?
Geophysical mapping data
Subtidal habitat mapping
Intertidal vegetation mapping
2. What is the location and extent of areas of high biodiversity and natural value
significance?
3. How can we monitor ongoing change and effects to seafloor habitats?
Baseline information
Prioritisation of monitoring sites
4. What information is available to define inter‐annual and seasonal variation in key
habitats?
Separating natural variation from impact assessments
What information is available to define cover of habitats at the time of its
listing (1982) as a Ramsar site?

Prepared by Dr Daniel Ierodiaconou and Richard Zavalas Page 9 of 41
Benthic Habitat Mapping in Western Port– Review and Project Proposal
3.InformationReview
3.1Overviewofexistingstudies
This section provides an assessment of previous habitat mapping investigations (Table 1) of
critical components of the ecological character of the Western Port Ramsar site. The
assessment of the relevance and data limitations are on the basis of whether they provide
sufficient information to address the key questions identified in Section 2.
The relevance of these investigations have been scored as either high, medium or low.
Definitions for these rankings are:
High – High quality information useful for providing a historical baseline. Methods applied
allow for measures of uncertainty of data products to be assessed. Provides new knowledge
on habitat types and extent.
Medium ‐ Useful information on historical habitat extents and current status in Western
Port. Limited information available to inform data uncertainty and associated area estimates
the habitat mapping may provide.
Low – Provide little or no information that can be used to quantify habitat extents. May
provide a historical perspective and indication of habitat loss
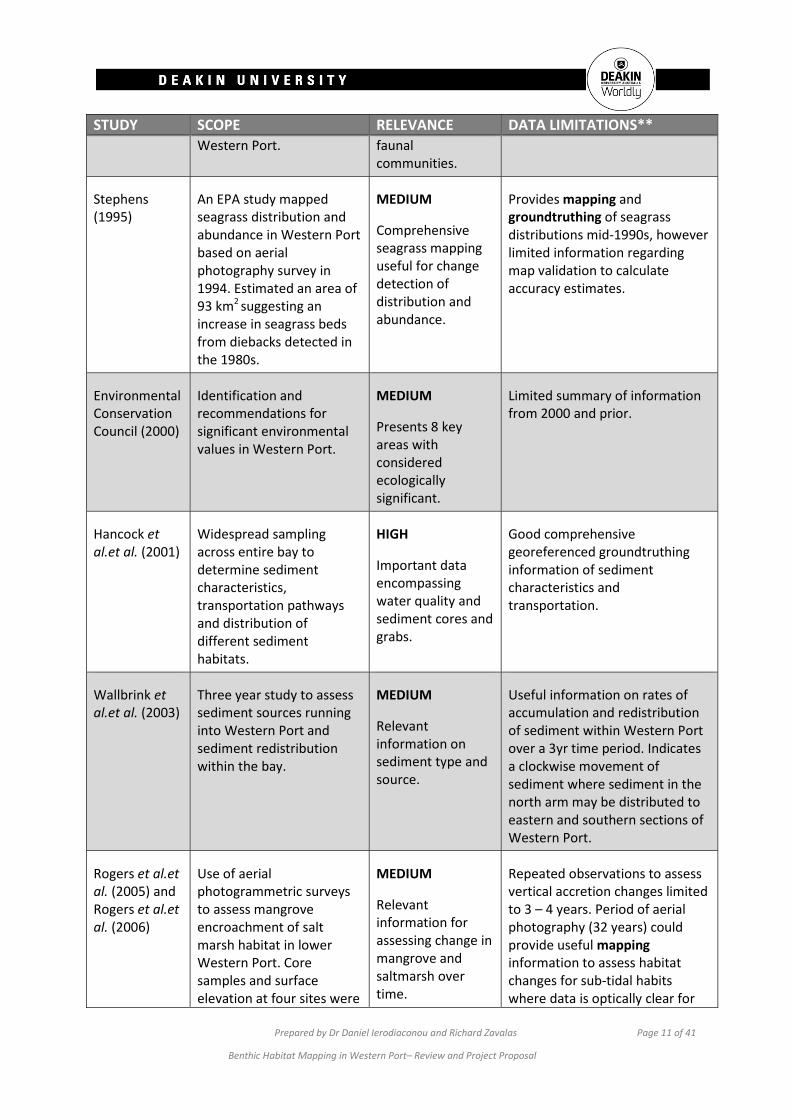
Table 1. Overview of previous studies pertaining to mapping and distribution of habitats in Western Port. Study scope, relevance and limitations of data types available are summarised. For “Data Limitations”, bold text denotes data types including, mapping = full coverage mapping survey datasets, groundtruth = point/transect field observations
STUDY SCOPE RELEVANCE DATA LIMITATIONS**
Shapiro (1975)
Biological and geological mapping of Western Port as part of the original Western Port Bay Environmental Study. Provides broad habitat classifications (e.g. mangroves, seagrass & sediment flats) and defines areas of ecological significance.
MEDIUM ‐ LOW
Provides some historical baseline information on broad classification of benthic habitats across whole bay.
Accuracy and methodological limitations of habitat classifications. Can provide mapping and groundtruthing information if original data can be acquired.
Bulthuis (1976), (1981) and (1984)
Bulthuis &
Used field data to make maps that modified the first recorded seagrass surveys in Western Port as part of Shapiro (1975).
MEDIUM
Initial subtidal vegetation mapping of
Provides initial historical perspective of seagrass distributions, with mapping surveys.

Prepared by Dr Daniel Ierodiaconou and Richard Zavalas Page 10 of 41
Benthic Habitat Mapping in Western Port– Review and Project Proposal
STUDY SCOPE RELEVANCE DATA LIMITATIONS**
Woelkerling (1983)
Estimated cover of seagrass and macrophytic algae at 250 km2. Later, Bulthuis (1984) estimated 85% dieback in seagrass compared to the initial 1975 surveys.
Western Port. Detected seagrass diebacks.
Bird (1986) Used nautical charts cross‐referenced with aerial photography to chart distribution of mangrove habitat and relate this to shoreline geomorphology. Determined that 40% of the mid shoreline had a mangrove fringe that varied between 40 and 300 m wide in the mid‐1980s.
LOW
Historical perspective on only one vegetation type (mangroves).
If data can be acquired there is potentially useful mapping information to assess changes in mangrove habitat in Western Port.
Unknown (1979)
Initial side‐scan SONAR surveys of the lower eastern arm in Western Port. Products include geomorphology habitat map of sediment and clay forms.
LOW
First recorded side‐scan SONAR of the east arm main channel.
Accuracy and detailed methodology of habitat maps and mapping data products not known. Potential to examine historical change in seagrass extent for section of the eastern arm if historical ground data can be located for verification.
Shepherd et al.et al. (1989)
Shepherd et al.et al. (1989) defined seagrass distributions between the mid‐1970s and 1989 describing a habitat loss from 250 km2 to 72km2, especially Zostera sp. in northern and eastern Western Port.
MEDIUM ‐ LOW
Historical perspective on seagrass (Shepherd et al 1989).
Shepherd et al.et al. 1989 can provide useful mapping information about historical perspectives (1970s – 1980s) of seagrass diebacks, although more recent research provides better information on seagrass habitat extents. Limited information to calculate uncertainty of the aerial estimates provided.
Edgar et al.et al. (1994)
Defined differences in faunal communities between seagrass vegetated and unvegetated benthic habitats at 6 sample sites across
LOW
Some indication of influence of seagrass loss on sediment and
Limited to site specific sediment cores providing some groundtruthing information about sediment characteristics and faunal communities.
Prepared by Dr Daniel Ierodiaconou and Richard Zavalas Page 11 of 41
Benthic Habitat Mapping in Western Port– Review and Project Proposal
STUDY SCOPE RELEVANCE DATA LIMITATIONS**
Western Port. faunal communities.
Stephens (1995)
An EPA study mapped seagrass distribution and abundance in Western Port based on aerial photography survey in 1994. Estimated an area of 93 km2 suggesting an increase in seagrass beds from diebacks detected in the 1980s.
MEDIUM
Comprehensive seagrass mapping useful for change detection of distribution and abundance.
Provides mapping and groundtruthing of seagrass distributions mid‐1990s, however limited information regarding map validation to calculate accuracy estimates.
Environmental Conservation Council (2000)
Identification and recommendations for significant environmental values in Western Port.
MEDIUM
Presents 8 key areas with considered ecologically significant.
Limited summary of information from 2000 and prior.
Hancock et al.et al. (2001)
Widespread sampling across entire bay to determine sediment characteristics, transportation pathways and distribution of different sediment habitats.
HIGH
Important data encompassing water quality and sediment cores and grabs.
Good comprehensive georeferenced groundtruthing information of sediment characteristics and transportation.
Wallbrink et al.et al. (2003)
Three year study to assess sediment sources running into Western Port and sediment redistribution within the bay.
MEDIUM
Relevant information on sediment type and source.
Useful information on rates of accumulation and redistribution of sediment within Western Port over a 3yr time period. Indicates a clockwise movement of sediment where sediment in the north arm may be distributed to eastern and southern sections of Western Port.
Rogers et al.et al. (2005) and Rogers et al.et al. (2006)
Use of aerial photogrammetric surveys to assess mangrove encroachment of salt marsh habitat in lower Western Port. Core samples and surface elevation at four sites were
MEDIUM
Relevant information for assessing change in mangrove and saltmarsh over time.
Repeated observations to assess vertical accretion changes limited to 3 – 4 years. Period of aerial photography (32 years) could provide useful mapping information to assess habitat changes for sub‐tidal habits where data is optically clear for

Prepared by Dr Daniel Ierodiaconou and Richard Zavalas Page 12 of 41
Benthic Habitat Mapping in Western Port– Review and Project Proposal
STUDY SCOPE RELEVANCE DATA LIMITATIONS**
used to assess the role of sea‐level rise and sedimentation on salt marsh decline (2005). Feldspar marker horizons were also used to measure vertical accretion (2006).
patch discrimination.
Harvey & Bird (2008)
First detailed study of rhodolith beds in south‐eastern Western Port. Identified as important benthic habitat because of high associated biodiversity.
LOW
Characterises ecologically important habitat rare in Western Port and presumed coastal Victoria.
Limited to sample transects of one habitat type, could provide some useful groundtruthing data for rhodolith beds and associated flora and fauna.
Shepherd et al. (2009)
Shepherd et al. (2009) charted a 66% decline in macroalgae species at Crawfish rock over a 35 year period, attributed to declining water quality and increased sediment loads.
MEDIUM – LOW
Site specific information about habitat change at ecologically significant Crawfish rock.
Shepherd et al. 2009 provides groundtruthing information of algae assemblages at Crawfish rock from 1967 ‐ 1971 and 2002 – 2006. This will be an ideal site to continue and ongoing comparison building on the time series data available.
Blake & Ball (2001) and Ball et al. (2010)
Mapping of seagrass distributions across the majority of Western Port using aerial photography groundtruthed with in situ underwater video observations of seagrass patch characteristics and boundaries.
HIGH
Important broad coverage benthic habitat mapping data encompassing current knowledge of the majority of seagrass distributions in Western Port.
Studies will provide important mapping data.
Historical aerial photography used unable to be groundtruthed (2001). Limited information on uncertainty of predictions
Lack of spatial replication at fine‐scale to assess seagrass health and therefore difficulties assessing changes in seagrass patch health compared to total patch area (2010).
Future Coasts (2010)
Survey of Victorian coastline to develop comprehensive high resolution digital elevation model (DEM) of shallow coastal waters using airborne LiDAR and vessel
HIGH
Most current majority coverage mapping data available for Western Port (See
Airborne LiDAR had limited data coverage in Western Port due to water clarity in channels. This was supplemented with SONAR bathymetry mapping. Reduced quality of backscatter data from this survey effects the usefulness

Prepared by Dr Daniel Ierodiaconou and Richard Zavalas Page 13 of 41
Benthic Habitat Mapping in Western Port– Review and Project Proposal
STUDY SCOPE RELEVANCE DATA LIMITATIONS**
based multibeam SONAR surveys.
– Figure 9). Provides the best bathymetry data for the extent of wester Port to date. Data has been integrated with data from Blake et al 2013 to develop broad prediction of substratum and biotic communities for the southern coastal area of Wester Port.
of SONAR data for habitat mapping with approximately 50% of coverage backscatter data not recorded in survey. Data is 5 yrs old so may result in mismatch when modelling current habitat distributions.
Butler & Bird (2010)
Sampling of sediment characteristics at 10 sites to assess macroinvertebrates and sediment conditions in Western Port marine protected areas (MPAs).
LOW
Most data not relevant for the current study.
Good replication of core sediment samples at study sites that can provide groundtruthing information, although many of these are outside target study area.
Edmunds et al. (2010)
Summarised reef and benthic biota distributions in Western Port.
MEDIUM
Good summary of mapped benthic biota and geomorphology.
Data summaries limited to mapping surveys 2010 and prior.
Boon et al. (2011)
Full coverage vegetation mapping (mangroves and saltmarsh) of Western Port using aerial photography and extensive field based sampling to develop fine‐scale habitat maps.
HIGH
Most current detailed vegetation habitat mapping for mangroves and saltmarsh across Western Port.
Mapping information limited to existing aerial photography, therefore difficult to assess seasonal variation.
Barton et al. (2012)
Summary of natural values and habitat information for Western Port MPAs.
MEDIUM – HIGH
Presents current knowledge on important ecological features and detailed mapping information
Limited to summary of existing data only and MPAs within Western Port.

Prepared by Dr Daniel Ierodiaconou and Richard Zavalas Page 14 of 41
Benthic Habitat Mapping in Western Port– Review and Project Proposal
STUDY SCOPE RELEVANCE DATA LIMITATIONS**
available.
Blake et al (2013)
Comprehensive underwater video survey targeting key marine habitats in Western Port for biological and geological habitat classification.
HIGH
Widespread coverage of video transects with data extracted that is precisely positioned using acoustic transponders (USBL)
Limited to groundtruthing video only with no mapping products extracted. Important widespread video information available identifying potential habitat priorities. Also sparse coverage in upper north‐eastern zones.
French et al (2014)
Presents a novel method for high‐resolution mapping of sub‐tidal habitats by defining seagrass distributions using satellite imagery (World View 2) and LiDAR remote sensing combined with underwater video.
HIGH
Most current sub‐tidal habitat mapping methodology.
Study analyses limited to Western Port MPAs only (French and Yaringa MNPs, although some mapping and groundtruthing data is available beyond these extents.

Prepared by Dr Daniel Ierodiaconou and Richard Zavalas Page 15 of 41
Benthic Habitat Mapping in Western Port– Review and Project Proposal
3.2KnownnaturalvaluesinWesternPortbygeographiczone
Figure 3 Western Port overview showing geographic segments as defined by Marsden et al. 1979. Marine protected areas are shaded blue.

Prepared by Dr Daniel Ierodiaconou and Richard Zavalas Page 16 of 41
Benthic Habitat Mapping in Western Port– Review and Project Proposal
Figure 4. Western entrance geographic segment, Western Port. Habitat mapping information including seagrass (Blake et al. 2001), inter‐tidal vegetation (Boon et al. 2011) and geologically significant sites; coloured markers, green = regional/local, yellow = state and purple = national/international (Rosengren 1984).

Prepared by Dr Daniel Ierodiaconou and Richard Zavalas Page 17 of 41
Benthic Habitat Mapping in Western Port– Review and Project Proposal
Figure 5. Lower north arm geographic segment, Western Port. Habitat mapping information including seagrass (Blake et al. 2001), inter‐tidal vegetation (Boon et al. 2011) and geologically significant sites; coloured markers, green = regional/local, yellow = state and purple = national/international (Rosengren 1984).

Prepared by Dr Daniel Ierodiaconou and Richard Zavalas Page 18 of 41
Benthic Habitat Mapping in Western Port– Review and Project Proposal
Figure 6. Upper north arm geographic segment, Western Port. Habitat mapping information including seagrass (Blake et al. 2001), inter‐tidal vegetation (Boon et al. 2011) and geologically significant sites; coloured markers, green = regional/local, yellow = state and purple = national/international (Rosengren 1984).

Prepared by Dr Daniel Ierodiaconou and Richard Zavalas Page 19 of 41
Benthic Habitat Mapping in Western Port– Review and Project Proposal
Figure 7. Rhyll geographic segment, Western Port. Habitat mapping information including seagrass (Blake et al. 2001), inter‐tidal vegetation (Boon et al. 2011) and geologically significant sites; coloured markers, green = regional/local, yellow = state and purple = national/international (Rosengren 1984).
Prepared by Dr Daniel Ierodiaconou and Richard Zavalas Page 20 of 41
Benthic Habitat Mapping in Western Port– Review and Project Proposal
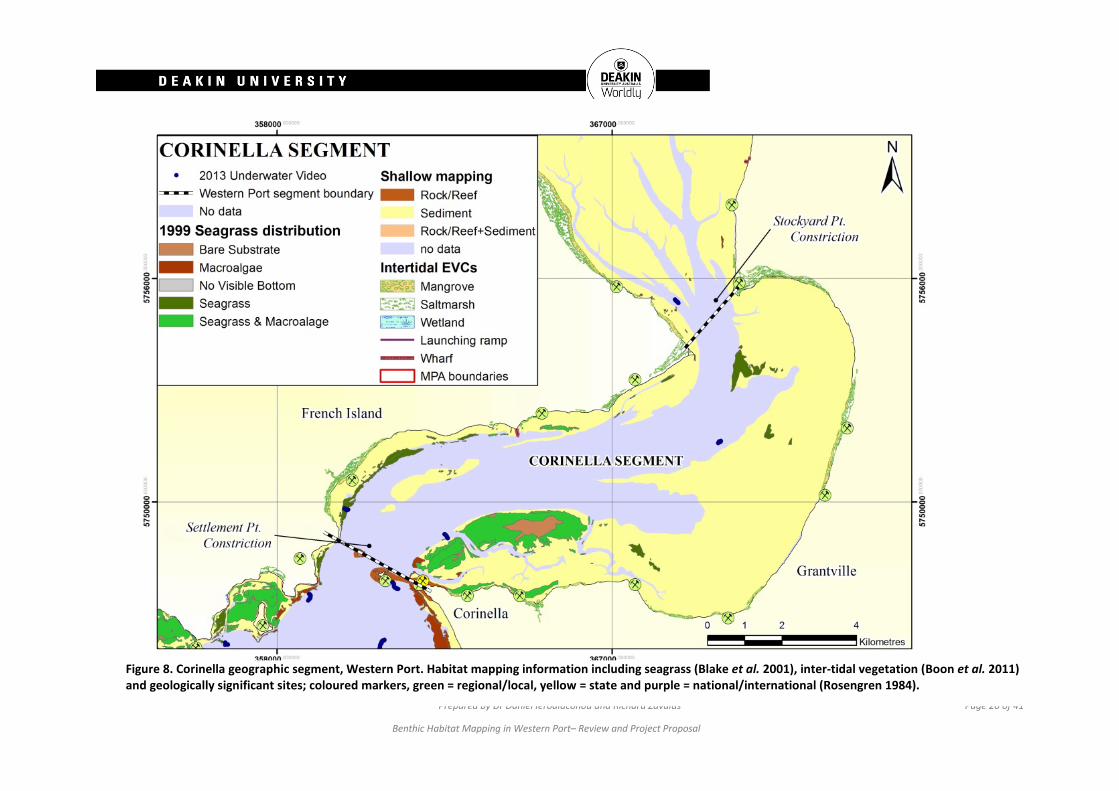
Figure 8. Corinella geographic segment, Western Port. Habitat mapping information including seagrass (Blake et al. 2001), inter‐tidal vegetation (Boon et al. 2011) and geologically significant sites; coloured markers, green = regional/local, yellow = state and purple = national/international (Rosengren 1984).

Prepared by Dr Daniel Ierodiaconou and Richard Zavalas Page 21 of 41
Benthic Habitat Mapping in Western Port– Review and Project Proposal
Figure 9. Confluence zone geographic segment, Western Port. Habitat mapping information including seagrass (Blake et al. 2001), inter‐tidal vegetation (Boon et al. 2011) and geologically significant sites; coloured markers, green = regional/local, yellow = state and purple = national/international (Rosengren 1984).

Prepared by Dr Daniel Ierodiaconou and Richard Zavalas Page 22 of 41
Benthic Habitat Mapping in Western Port– Review and Project Proposal
3.3KnowledgegapsandConclusions
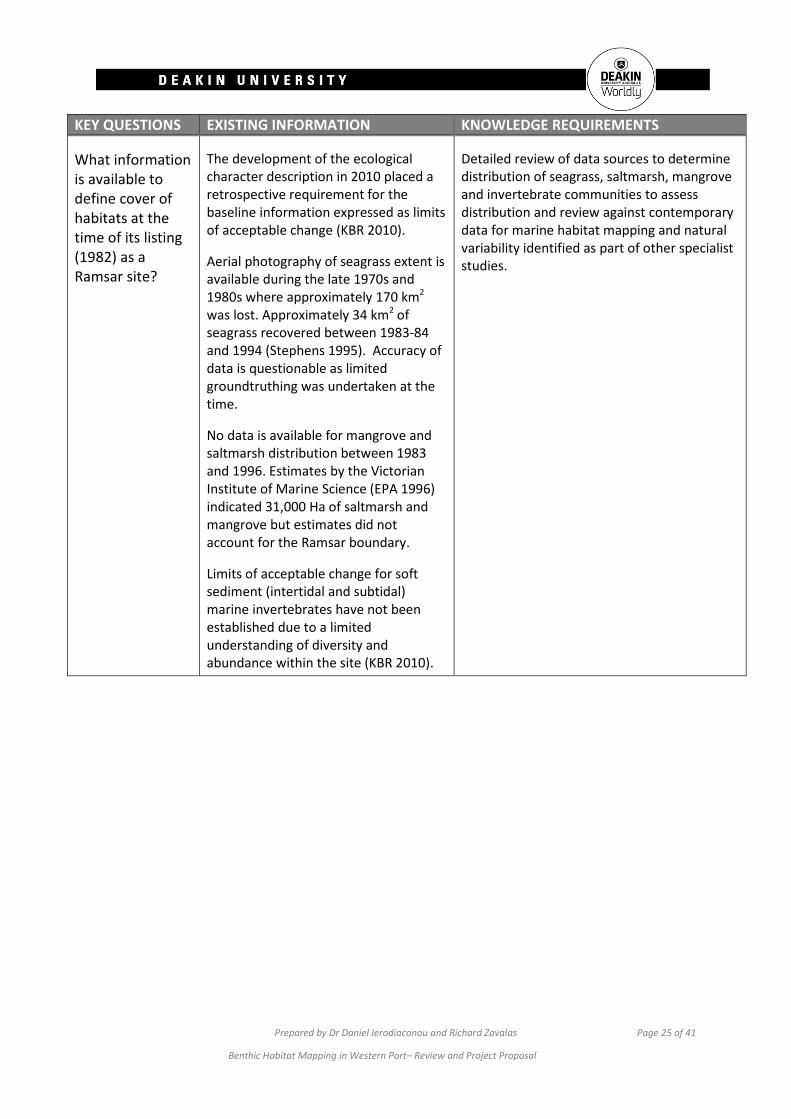
3.3.1SummaryofknowledgegapsTable 2. Summary of key questions, existing information and knowledge requirements for benthic habitat mapping in Western Port.
KEY QUESTIONS EXISTING INFORMATION KNOWLEDGE REQUIREMENTS
What is currently known about Western Port benthic habitats and where are they located?
Geophysical mapping data:
In reference to mapping data that reveals an accurate digital elevation model (DEM) of the seafloor for Western Port currently there is only one dataset that has majority coverage (See Figure 10). This includes data from two sources, LiDAR and Multibeam echo sounder (MBES) (Future Coasts 2010). Pixel resolution is 5 m for LiDAR and 2.5 m for MBES. From this data we can derive accurate bathymetric information for survey areas, although textural information and resolution for fine‐scale benthic habitat mapping is lacking.
Existing full coverage datasets provide good bathymetric maps of Western Port. However this data is limited for the purpose of fine‐resolution habitat mapping due to a number of factors; 5 years old, resolution and ‘patchiness’ of LiDAR data (French et al. 2014) and lack of MBES backscatter data that provides important textural information for habitat classifications. This information provides signal strength for certain areas of MBES data that is useful in habitat characterisation studies.
Contemporary full coverage high resolution bathymetry and backscatter data required for areas targeted for fine‐resolution habitat mapping of biota and geomorphology.
Intertidal vegetation mapping:
Existing information of intertidal vegetation is provided by Boon et al. (2011). This study provides comprehensive maps of different Ecological Vegetation Classes (EVCs) in Western Port in all littoral and intertidal zones.
Existing data can be used to inform baseline habitat distributions of important intertidal vegetation including mangrove and saltmarsh from Boon et al. (2011). Recent surveys by Biosis have assessed the quality of vegetation in accordance with state biodiversity guidelines
Future assessment or monitoring could use vegetation mapping completed by Boon et al. (2011) as a baseline distribution for saltmarsh and mangrove habitats.
Subtidal habitat mapping:
For subtidal areas existing habitat mapping data includes coverage of seagrass distribution (Blake & Ball 2001) and basic geophysical mapping; i.e. reef, sediment and reef/sediment mixed. Limitations of this data is its restriction to areas visible from aerial photography, hence there are large ‘no data’ areas in deeper water. Seagrass distributions are from 1999 surveys
Scarcity of data on benthic communities is clear not only in the priority study area but throughout the whole bay.
Mapping of the primary area of western segments of Western Port
Mapping of other benthic habitats, particularly deeper water including sessile invertebrate and reef communities and fringing seagrass.

Prepared by Dr Daniel Ierodiaconou and Richard Zavalas Page 23 of 41
Benthic Habitat Mapping in Western Port– Review and Project Proposal
KEY QUESTIONS EXISTING INFORMATION KNOWLEDGE REQUIREMENTS
with current seagrass extents not known.
What is the location and extent of areas of high biodiversity and natural value significance?
Study results from Shapiro (1975) determined 6 areas of ecological significance in Western Port, 3 of which have boundaries similar to Yaringa, French Is and Churchill Is Marine National Parks established in 2002.
In addition to these existing studies have identified rare areas of high biodiversity on rocky reefs including, Crawfish Rock, Honeysuckle reef and small reef near San Remo important for opisthobranchs (Melbourne Water 2011).
Rhodolith beds in close proximity to important elephant fish breeding habitat are located near San Remo in the Rhyll segment (See Figure 7) (Harvey & Bird 2008).
Dense seagrass beds throughout the bay, especially in the Corinella, Rhyll segments and in the north arm in Yaringa and French island MNPs (Blake & Ball 2001; French et al 2014) represent one of Western Ports most important natural values.
Other important vegetation habitat includes extensive saltmarsh and mangrove vegetation along the coast in the north arm and around the northern coast of French Island (Boon et al. 2011)
Comprehensive mapping of intertidal saltmarsh and mangrove systems was published by Boon et al 2011 and is current
Mapping of the extent and composition of intertidal and subtidal seagrass is required as the most recent mapping was completed in 1998 and does not represent current distribution.
Mapping of soft sediment invertebrate (epi and infauna) community distribution across Western Port which includes a wide range of shallow and deep water subtidal habitats harbouring filter feeding invertebrates that exist in the bay.
How do we monitor ongoing change and effects for seafloor habitats?
To assess future impacts it is highly important to define current baseline information. However, effective baseline data from existing sources is limited for most habitats in Western Port. The most comprehensive information is for seagrasses (Blake & Ball 2001) and mangrove and saltmarsh vegetation (Boon et al. 2011).
High resolution baseline geophysical datasets are available from the Future
Identify prioritise and map regional reference habitat sites in Western Port. Key sources to support and guide prioritisation are Blake & Ball (2001) for seagrass and Blake et al. (2013) for all other benthic habitats. Anecdotal evidence derived from existing literature reviews such as Melbourne Water (2011), Edmunds et al. (2010) and KBR (2010) is also important for defining ecologically important sites.

Prepared by Dr Daniel Ierodiaconou and Richard Zavalas Page 24 of 41
Benthic Habitat Mapping in Western Port– Review and Project Proposal
KEY QUESTIONS EXISTING INFORMATION KNOWLEDGE REQUIREMENTS
Coasts (2010) project with good coverage, albeit 5yrs old (Figure 10). However such datasets are limited in their application for fine‐resolution habitat mapping due to temporal discrepancies and collection procedures not optimised for habitat mapping purposes (gain change in LIDAR intensity data and missing MBES backscatter data).
Blake et al. (2013) provides the most comprehensive video data of benthic communities which is useful for prioritisation of sampling sites.
What information is available for inter‐annual and seasonal variation in key habitats and approaches for assessment?
Few existing studies have incorporated temporal components for assessment of benthic communities in Western Port.
Inter‐annual datasets of mangrove and seagrass aerial photography have allowed assessment of these vegetation types over time (Bird 1986, Bulthuis 1984). For example Bird (1986) showed there has been some recovery of mangrove stands overtime since the 1930s along the northern coast. It should be noted that considering the variety of techniques and approaches applied and the lack of validation approaches it is difficult to quantify uncertainty in data presented in most circumstances.
The most substantial temporal variation for Western Port is expected in sedimentation pathways, phytoplankton assemblages and sediment faunal communities (Melbourne Water 2011).
Integrate mapping data capture with other specialist studies to support defining natural variability in the system.
Review historical temporal data sets to define variability in ecological values and review the accuracy of temporal data to define the limits of acceptable change.
Prepared by Dr Daniel Ierodiaconou and Richard Zavalas Page 25 of 41
Benthic Habitat Mapping in Western Port– Review and Project Proposal
KEY QUESTIONS EXISTING INFORMATION KNOWLEDGE REQUIREMENTS
What information is available to define cover of habitats at the time of its listing (1982) as a Ramsar site?
The development of the ecological character description in 2010 placed a retrospective requirement for the baseline information expressed as limits of acceptable change (KBR 2010).
Aerial photography of seagrass extent is available during the late 1970s and 1980s where approximately 170 km2 was lost. Approximately 34 km2 of seagrass recovered between 1983‐84 and 1994 (Stephens 1995). Accuracy of data is questionable as limited groundtruthing was undertaken at the time.
No data is available for mangrove and saltmarsh distribution between 1983 and 1996. Estimates by the Victorian Institute of Marine Science (EPA 1996) indicated 31,000 Ha of saltmarsh and mangrove but estimates did not account for the Ramsar boundary.
Limits of acceptable change for soft sediment (intertidal and subtidal) marine invertebrates have not been established due to a limited understanding of diversity and abundance within the site (KBR 2010).
Detailed review of data sources to determine distribution of seagrass, saltmarsh, mangrove and invertebrate communities to assess distribution and review against contemporary data for marine habitat mapping and natural variability identified as part of other specialist studies.

Prepared by Dr Daniel Ierodiaconou and Richard Zavalas Page 26 of 41
Benthic Habitat Mapping in Western Port– Review and Project Proposal
3.3.2PracticalityofHabitatMappinginWesternPortBenthic habitat mapping in Western Port is limited by difficult survey conditions (e.g. turbid, shallow
water), hence there is a lack of information characterising benthic communities and geomorphology
for many areas. Currently the most comprehensive mapping datasets is a combination of LiDAR for
shallow intertidal areas and MBES in deeper channel habitat (Figure 10). Although this dataset
provides high resolution bathymetry information over a large coverage area, textural information
important for fine‐resolution mapping of biotic communities is lacking. Furthermore the resolution
of LiDAR data means its application for biological habitat mapping is limited. The LiDAR data can be
useful for broad classification of benthic habitats but it has a somewhat reduced accuracy for
subtidal vegetation mapping (French et al. 2014) in comparison to high resolution MBES. The
LIDAR/MBES data are 5 years old therefore we are uncertain whether they represent current habitat
conditions in Western Port.
Figure 10. Western Port showing survey extents of most recent mapping as part of the DSE Future Coasts program. LiDAR 2010 survey (blue) and Multibeam SONAR (MBES) 2010 survey (grey). Source ‐ Blake et al. 2013. Note whilst bathymetry data is provided there are issues in data quality and coverage for intensity (LiDAR) and backscatter (MBES) data products within Western Port which are important for habitat mapping.
Aerial photography and satellite imagery have proved the most effective techniques for shallow
water mapping of Western Port. There are comprehensive datasets available for intertidal saltmarsh
and mangrove vegetation (Boon et al. 2011) and shallow water seagrass (Blake & Ball 2001).
Seagrass mapping is detailed and effectively groundtruthed with field observations however it is
now 15 years old and may not accurately reflect current distributions. Furthermore seagrass
mapping is restricted to areas where the seafloor is visible through aerial photography, hence the

Prepared by Dr Daniel Ierodiaconou and Richard Zavalas Page 27 of 41
Benthic Habitat Mapping in Western Port– Review and Project Proposal
majority of channel areas and deeper water is not mapped for seagrass or other benthic biota. These
habitats are currently considered ‘no data’ areas with very little classification of benthic assemblages
or geophysical characteristics even though existing video observations have shown important
ecological communities (Blake et al. 2013) and likely underestimating the current extent of seagrass.
Current groundtruthing video observations within deeper water areas provides an important
indication of the type and diversity of benthic assemblages where there is otherwise no other
georeferenced information (Blake et al. 2013). Such information that is point located and classified
for density of different benthic biota is extremely useful for prioritising reference sites and
ecologically significant habitat patches for future monitoring.
3.3.3ReviewofavailabletechnologyforhabitatmappingThe general approach for benthic habitat mapping requires full coverage of the study area of
interest to provide information of the environmental/ geophysical characteristics. This is often then
combined with some information to ground truth the geophysical data to identify habitats to infer
relationships and makes predictions of habitat extents across the full coverage areas achieved.
Western Port due to its complex hydrodynamics and turbidity makes some traditional approaches to
habitat mapping challenging. This has resulted in a bias of coverage in ecologically important
habitats in shallow water environments (Blake and Ball 2001; Boon 2011).
If full coverage habitat data for Wester Port is required it is likely that a multiple approaches will be
required. Here we summarise options for geophysical (to characterise the environment) and
biological data collections and their associated limitations.
Geophysical Data
The options for geophysical data collection need to take into consideration the coverage proposed
to be achieved in Western Port. The Future Coasts Program showed the potential for collecting
baywide coverage of shallow water habitats using bathymetric LIDAR in Western Port (Fugro LADs
system). Unfortunately recent trials with a different bathymetric LIDAR system were not as
successful and were deemed not feasible for baywide shallow water coverage. The main limitation
with bathymetric LIDAR systems is their penetration capabilities, generally around 2.5 time secchi
depth, problematic in areas such as Western Port which are notably highly turbid particularly in the
North eastern section of the embayment. Turbidity is equally problematic for other spectral
acquisition systems such as aerial or satellite imagery. Satellite imagery acquisition was an issue for
French et al. 2014 who used an archived Worldview multispectral image due to issues obtaining a
suitable cloud free image close to the time of video observation data collection. Plane based
platforms may negate issues with satellite systems regarding cloud cover and provide more
alternatives for data acquisition in optimal tidal conditions. Aerial photography has been applied to
map mangroves and saltmarsh (Boon et al., 2011) and seagrass habitat (Blake and Ball 2001). In the
absence of a suitable bathymetric LIDAR system (which will provide the advantage of bathymetry
and intensity data) plane based hyperspectral/ multispectral sensors alone may provide a cost
effective alternative to obtaining baywide coverage for shallow waters for the purpose of habitat
characterisation. All the options above are limited to shallow (<5m at best) water and acoustic

Prepared by Dr Daniel Ierodiaconou and Richard Zavalas Page 28 of 41
Benthic Habitat Mapping in Western Port– Review and Project Proposal
approaches provide the best option for geophysical data collection for the deeper regions of
Western Port. Multibeam echo sounder sounders (MBES) provide the best approach for achieving
seafloor coverage in deeper waters and provide high resolution geo‐physical datasets that can be
used to explore patterns of both broad and fine scale ecosystem dynamics in benthic habitats. The
advantage of using MBES over other acoustic sensors such as single beam echo sounders or side‐
scan sonars is that complete seafloor coverage can be achieved, and that bathymetry and
backscatter (intensity of acoustic returns) are co‐registered.
Groundtruth data
Irrespective of the geophysical data collection chosen the collection of groundtruth data of biological
habitats is imperative for model development and validation. Due to their non‐destructive nature
video techniques are becoming a standard approach for the collection of biological information. The
main challenges if using such approaches in Western Port is turbidity that can impact video quality
and the capability to distinguish between habitat types. Ground‐truth acquisition can be maximised
by working with optimal tidal conditions within the embayment, however sections in the north east
component are likely to be problematic. In such cases benthic grabs may provide an alternative to
providing an indication of habitat present. In all cases care should be taken to enable the
groundtruth data to be appropriately georeferenced. Differential GPS may be adequate for drop
camera and benthic grabs. However for towed platforms, Remotely Operated or Autonomous
Vehicles underwater acoustic positioning using ultra short base line systems (USBL) or equivalent will
be essential. Ideally geophysical and biological acquisitions should be timed in such a way to
minimise temporal discrepancy between the data sets.

Prepared by Dr Daniel Ierodiaconou and Richard Zavalas Page 29 of 41
Benthic Habitat Mapping in Western Port– Review and Project Proposal
4.StudyPlanProposal
4.1BaselineHabitatSurvey
4.1.1SurveyareaandsummaryThe area of interest (AOI) for a marine habitat mapping baseline survey plus regional reference sites
is defined in Figure 11. Surveys will be undertaken using the following approaches
Hydroacoustic survey using multibeam echo sounder
Towed video survey
Analysis of geophysical data (MBES bathymetry, MBES backscatter) will be processed to
derive habitat models of the area
The methodological approach will involve five major components: (1) MBES data collection, (2)
Geophysical data processing, (3) ground‐truth prioritization, (4) video data collection, and (5) habitat
classification.
A hydroacoustic survey of the waters deeper than 5 m within the AOI will be conducted using a
Kongsberg Maritime EM2040C Multibeam Echo sounder (MBES) within the Lower North Arm,
Confluence zone and Western Entrance. Additional reference sites outside this AOI will be targeted
to gain baseline data on important representative habitats of ecological significance across Western
Port. This system captures ultra‐high‐density bathymetry and backscatter data. Backscatter data is
the strength of the acoustic signal return, which is dependent on the “roughness” and “hardness” of
the seafloor and is thus useful for inferring seabed or habitat types. The MBES survey will be
conducted so as to acquire full coverage at a sub‐metre resolution. Since the swathe width (cross
track coverage) of MBES systems is dependent on water depth, we have used existing bathymetry
data to estimate the total duration of the MBES survey effort needed. Using the total surface of the
AOI and its average depth, it can be estimated at approximately 32 days (25 days for AOI and 7 days
for regional reference sites) (Table 3).
A video survey will be undertaken using a towed video system precisely positioned through the use
of an Ultra Short Base Line (USBL) system. A drop video approach will be undertaken where towed
surveys are not feasible due to navigation hazards. These two techniques will be used to identify the
benthic communities within the AOI. The video survey effort is to comprise 12 days to ground‐truth
the area covered by the MBES survey in the Lower North Arm only (on the basis that this is the area
where dredging and Port construction would occur and be most affected) and 4 days to ground‐
truth additional regional reference sites (Table 4).
The geophysical data (MBES bathymetry, MBES backscatter) will be processed into geophysical
derivatives (i.e. slope, surface ruggedness, etc.), which will provide the input for the development of
models designed to characterise marine habitats within the AOI. These models follow a
methodology designed and refined as part of Deakin University studies over the past decade
(Ierodiaconou et al., 2011), which consist in applying automated classification techniques to
integrating geophysical data with observation data from video ground‐truthing (Figure 13).

Prepared by Dr Daniel Ierodiaconou and Richard Zavalas Page 30 of 41
Benthic Habitat Mapping in Western Port– Review and Project Proposal
Figure 11. Proposed survey areas for habitat mapping. Blue polygon indicates multibeam sonar coverage of areas deeper than 10 m. Thick blue lines indicate area of supplementary multibeam survey of deep channel habitat. Suggested locations for regional habitat reference sites are shown in purple squares. Not to scale and for illustrative purposes only.

Prepared by Dr Daniel Ierodiaconou and Richard Zavalas Page 31 of 41
Benthic Habitat Mapping in Western Port– Review and Project Proposal
4.1.2MultibeamSONARdatacollectionAll survey equipment is to be fitted to Deakin University’s customised 9.2 m habitat survey vessel
Yolla. Proposed planning and time estimates for the MBES survey are included in Table 3. Weather
windows will be targeted to enable optimal survey conditions for data collection. We propose to
have the survey vessel on standby onsite at Hastings if suitable secure shedding/mooring facilities
can be located. This will minimise the mobilisation time by removing the need to remobilise, re‐fit
equipment and re‐perform calibration tests between each survey leg.
MBES data will be acquired using the latest‐generation shallow‐waters EM2040C by Kongsberg
Maritime. The EM2040C transmits short acoustic pulses (pings) at an operating frequency of 300 kHz
within a narrow across‐track swath (1.3° alongships), and receives the echo resulting from the
interaction of the pulse with the seafloor within 256 narrow beams (1.3° athwartships) electronically
steered in the across‐track plane between ‐65° and + 65°. This geometry results in the system
forming 256 narrow beams (1.3x1.3°) in a wide across‐track swath (130°) allowing coverage of
approximately 4.3 times the water depth (assuming flat seafloor). The transmit and receive beams
are electronically steered to compensate for the vessel roll and pitch movements in real time and
keep the acoustic swath stable at the vertical under the vessel. New Kongsberg Maritime firmware
allows the EM2040C to acquire multiple soundings for the outer‐swath beams and to steer
electronically the individual beams so as to produce 400 equidistant soundings per ping. The
EM2040C has a variable ping rate (up to 50Hz) and pulse length (down to 0.025ms) that
automatically adjust to water depth to achieve the highest ping density and highest resolution
possible given the depth conditions.
The variation of sound velocity with depth, which affects underwater acoustics measurements, will
be measured by two sound velocity sensors: a Monitor SVP by Valeport Ltd, which will be deployed
at least once daily to measure sound velocity throughout the water column, and a Mini SVP by
Valeport Ltd, which is setup next to the EM2040C sonar head to continuously measure sound speed
at that depth during survey operation. Kongsberg Maritime software SIS seamlessly combines these
two sound velocity data inputs to apply real‐time sound speed corrections to the acoustic
measurements.
The EM2040C on Yolla is integrated with an Applanix POS MV WaveMaster that provides accurate
measurements of the MBES position (latitude, longitude, altitude) and motion (heave, pitch, roll and
yaw). The POS MV is setup on Yolla so as to receive real‐time RTK corrections from the state‐wide
network of Global Navigation Satellite System (GNSS) base stations “Vicmap Position – GPSnet”.
Real‐time navigation, data‐logging, quality control and display will be undertaken on‐board using
software SIS by Kongsberg Maritime and POSView by Applanix.
The EM2040C has the capability to log acoustic data from the water column between the survey
vessel and the ensonified seafloor. Such water‐column data can be logged in specific regions of
interest, to be prioritised following discussion with GHD staff and marine experts, if desired.
The MBES survey will be conducted so as to acquire data at a resolution that conform to the change‐
detection assessment approach pioneered by Deakin University. Such resolution allows for the

Prepared by Dr Daniel Ierodiaconou and Richard Zavalas Page 32 of 41
Benthic Habitat Mapping in Western Port– Review and Project Proposal
potential detection of fine‐scale changes in habitat distribution between data time‐series, should
subsequent surveys occur.
Table 3. Multibeam duration estimate based on average depth and area estimates in survey blocks
AOI MBES Survey Regional Reference sites
Site Block A Block B Block C Block D Channel section
TOTAL
Mean depth (m) 15 10 15 12 18 TBA ‐
Line space (m) 45 30 35 30 60 TBA ‐
Width (m) 3000 1000 4000 6000 21000 TBA ‐
Length 10000 10000 5500 4000 1000 TBA ‐
No. lines 67 33 89 150 350 TBA 689
Total length (km) 667 333 489 600 350 TBA 2439
Survey time (hrs) 67 33 49 60 35 67 311
Survey time (days)
7 3 5 6 4 7 32
4.1.3Geophysicaldataprocessing
The navigation data collected by the POS MV, the bathymetry and the backscatter data collected by
the MBES system will be processed in four stages.
First, the navigation data will be post‐processed using Applanix Software POSPac MMS to combine
the GNSS and inertial data acquired in real‐time by the POS MV with post‐processed RTK corrections
from GPSnet to produce more accurate position and orientation of the sonar head during the survey.
The improvement of the vertical accuracy (~±2 cm) of the sonar position during the survey implies
that soundings can be corrected to the desired vertical datum without the need to collect tidal
information from modelled or existing tide gauges and without the need to measure the vessel
squat or list during survey operations. The navigation data are processed in POSPac MMS as a
Smoothed Best Estimator of Trajectory (SBET), which can then be exported to aid in bathymetry data
processing.
Then, bathymetry data will be processed with CARIS software HIPS&SIPS v8.2. Processing includes
overwriting the real‐time navigation with the SBET solution, cleaning the soundings manually and
through the use of automatic filters, and gridding using the CUBE algorithm. The bathymetry grid is
then exported to IVS software Fledermaus for interpolation and visualisation.
Next, backscatter data will be processed with IVS software Fledermaus Geocoder Toolbox (FMGT).
The processing consists in creating a “backscatter mosaic”, that is, an acoustic picture of the seafloor
in which tonal and textural variations are representative of changes in seafloor‐type. The density of
backscatter samples being higher than that of the bathymetry soundings, the backscatter mosaic can
usually be created at a better resolution than the corresponding bathymetry grid. The backscatter
Prepared by Dr Daniel Ierodiaconou and Richard Zavalas Page 33 of 41
Benthic Habitat Mapping in Western Port– Review and Project Proposal
mosaic can be created at a resolution between 0.2 and 1m depending on the data overlap and
survey speed.
Last, MBES bathymetry data will be integrated in ESRI software ArcGIS 10.2. Secondary products will
be derived from the combined MBES‐LiDAR bathymetry dataset and the backscatter mosaic using a
range of techniques and applications in ENVI 4.8 and ArcGIS 10.2. Products derived from the
combined bathymetry dataset may include slope, aspect, benthic position index, maximum
curvature, rugosity and complexity. Products derived from the backscatter mosaic may include
textures features calculated from grey‐level co‐occurrence matrices, hue‐saturation‐intensity
transformations and object‐based segmentation images based on backscatter intensity similarity.
Similar derivative products will be developed from the bathymetric LiDAR bathymetry and intensity
data delivered by the proposed consultants.
4.1.4GroundtruthdataprioritisationUnsupervised clustering of the datasets derived from MBES data will be performed to prioritise
where ground‐truthing will be undertaken and enable the assessment of the representativeness of
the site. A k‐means clustering approach will be used to segment the AOI into areas with similar
geophysical characteristics. This segmentation technique will include an object‐based image analysis
approach for feature extraction, pattern recognition using fuzzy logic membership and customised
segmentation algorithms. Visual examination of the backscatter mosaic will also provide a
preliminary model of seafloor‐type distributions across the AOI. The automatic segmentation, the
manual seafloor‐type identification and existing biological knowledge will be used to develop a
ground‐truthing survey design that will enable the whole range of geophysical conditions to be
targeted.
4.1.5VideodatacollectionThe video surveys will provide the biological community identification “groundtruth” data that is to
be used by the models to develop the relationships between marine biota and the geo‐physical
datasets derived from MBES. The video survey techniques developed at Deakin University allow for
rapid survey over large areas beyond the range of conventional methods such as diver surveys.
Deakin University’s 9.2m research vessel Yolla will provide the platform for the video survey
operations.
Camera systems will be acoustically positioned using a TrackLink USBL system by LinkQuest Inc. The
Applanix POS MV WaveMaster setup on Yolla combined with the real‐time input for RTK corrections
from the Vicmap Position – GPSnet network will provide precise vessel position and motion to
accurately position the video camera systems relative to the vessel. This hardware integration
enables the precise location of video information with a spatial accuracy of <2m at depths less than
40 m. The video data will be classified using the Victorian Towed Video Classification Program
developed by CI Ierodiaconou. The access program was designed to allow the direct import of
camera positional information, classification of video data into predefined hierarchal levels for
substrata and biological communities using pull down menus, and direct export to geo‐statistical
packages for further spatial analysis.
Prepared by Dr Daniel Ierodiaconou and Richard Zavalas Page 34 of 41
Benthic Habitat Mapping in Western Port– Review and Project Proposal
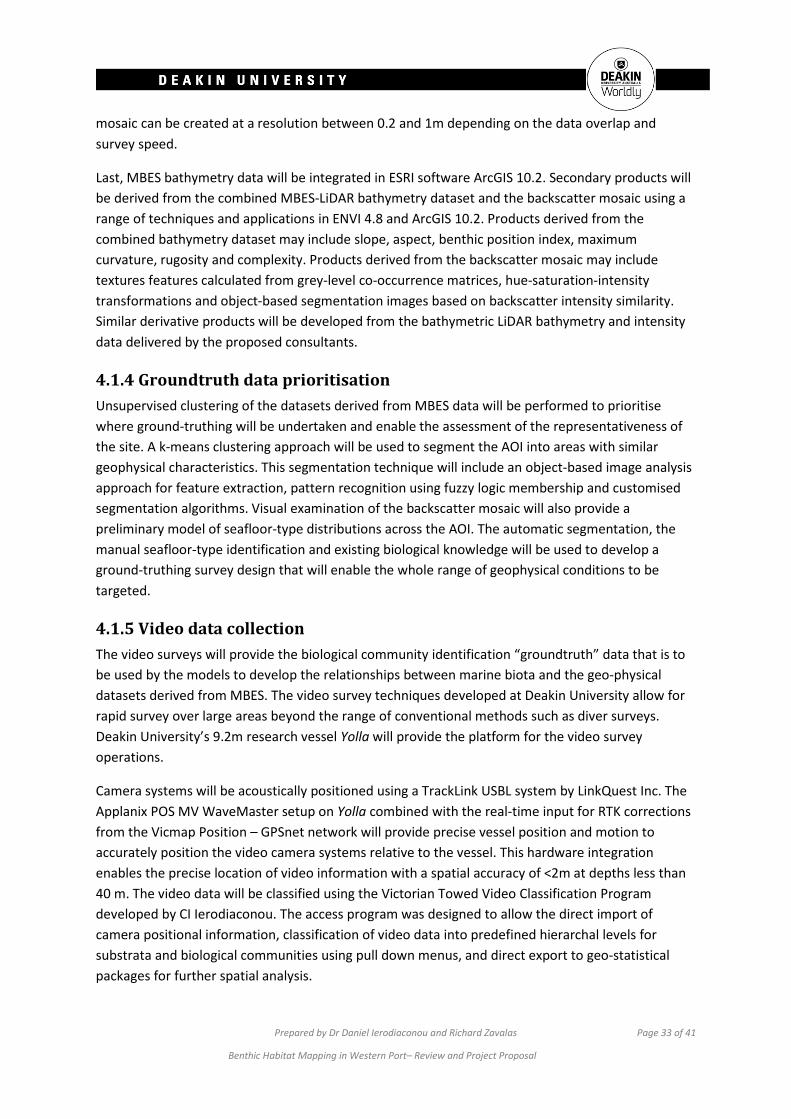
Table 4. Groundtruth underwater video survey duration estimate.
Site AOI MBES Survey
Regional reference sites
TOTAL
Video capture (days) 12 4 16
Data processing and extraction (days)
36 12 48
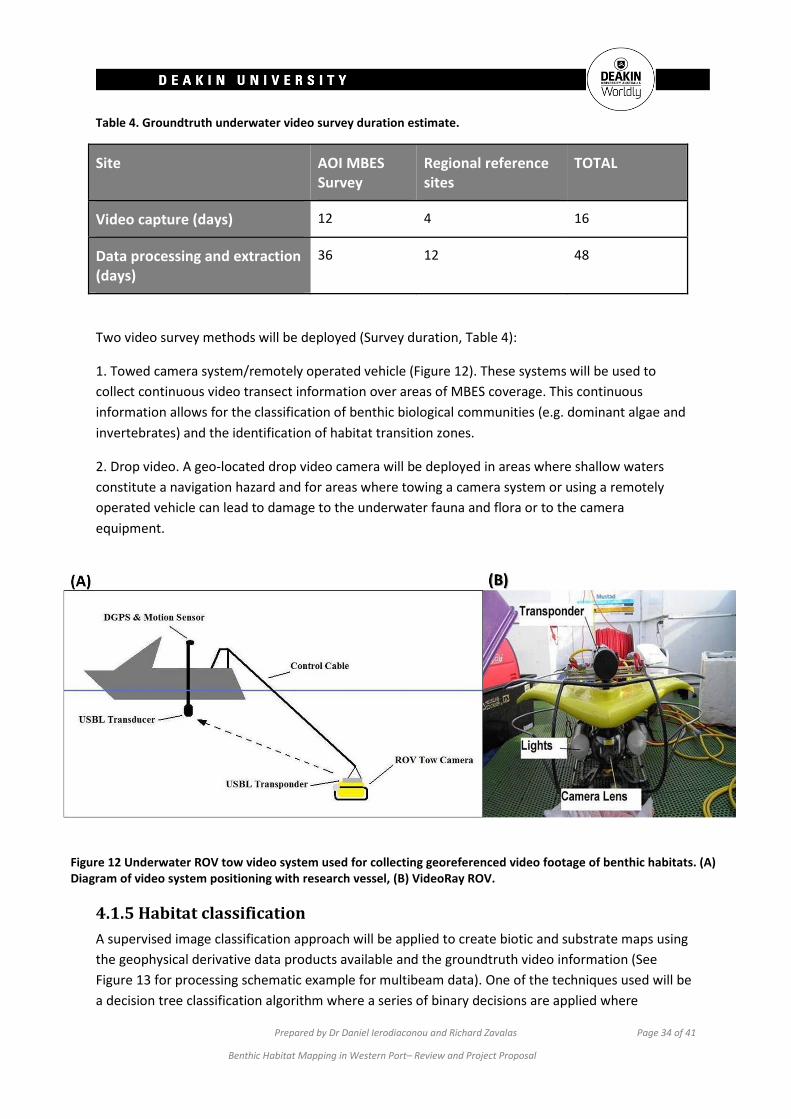
Two video survey methods will be deployed (Survey duration, Table 4):
1. Towed camera system/remotely operated vehicle (Figure 12). These systems will be used to
collect continuous video transect information over areas of MBES coverage. This continuous
information allows for the classification of benthic biological communities (e.g. dominant algae and
invertebrates) and the identification of habitat transition zones.
2. Drop video. A geo‐located drop video camera will be deployed in areas where shallow waters
constitute a navigation hazard and for areas where towing a camera system or using a remotely
operated vehicle can lead to damage to the underwater fauna and flora or to the camera
equipment.
4.1.5HabitatclassificationA supervised image classification approach will be applied to create biotic and substrate maps using
the geophysical derivative data products available and the groundtruth video information (See
Figure 13 for processing schematic example for multibeam data). One of the techniques used will be
a decision tree classification algorithm where a series of binary decisions are applied where
Figure 12 Underwater ROV tow video system used for collecting georeferenced video footage of benthic habitats. (A) Diagram of video system positioning with research vessel, (B) VideoRay ROV.

Prepared by Dr Daniel Ierodiaconou and Richard Zavalas Page 35 of 41
Benthic Habitat Mapping in Western Port– Review and Project Proposal
individual pixels are placed into one of two categories for each node of the decision tree with no
constraint on the number of nodes used (ENVI 4.2 RSI). Seventy percent of the video information will
be used to develop representative signatures from the derivative product layers for each of the
biotic and substrata categories defined. The remaining 30% of the information will then used to
independently assess the accuracy of the final classification results. The classification tree is
dependent on the discrimination of distinct environmental signatures for each biotic and substrate
class which will be identified through in situ visual analysis (video ground‐truth data). It is envisaged
as physical data products explaining the hydrodynamics become available they can be included into
the classification process and techniques applied to infer the geophysical variables most influencing
the biotic patterns observed.
Figure 13. Schematic showing processing steps for the production of dominant biota and substrata maps using a decision tree classification technique using Multibeam (Ierodiaconou et al. 2011).
Mapping output and deliverables
1. Detailed baseline benthic habitat maps for Western Port AOI survey area
2. Identification of suitable subtidal habitat monitoring locations

Prepared by Dr Daniel Ierodiaconou and Richard Zavalas Page 36 of 41
Benthic Habitat Mapping in Western Port– Review and Project Proposal
3. Detailed classification of video data collection
4. Baseline habitat surveys and habitat maps of regional reference sites in Western Port
5. GIS data (e.g. classification maps, shapefiles, metadata) containing field work results and
photographs.
4.2MonitoringEnvironmentalResponse
4.2.1RegionalreferencesitesRegional reference sites have been proposed as part of the baseline habitat survey to enable the
comprehensive representation of different habitats throughout Western Port. These sites are
suggested for baseline information (i.e. regional control sites) to be used as part of a Before After
Control Impact (BACI) monitoring design. To adequately measure impacts to benthic habitats in
Western Port we propose small‐scale, representative sample sites that can be used for repetitive
sampling programs of impact assessment. Sampling of regional reference sites will encompass small
MBES patch surveys (7 days – Table 3) and tow video data (4 days – Table 4) to be collected at each
site. Site prioritisation has been determined using existing information of benthic habitats in
Western Port to target all dominant subtidal habitats and areas of high ecological significance (Table
5, Figure 14). In addition to these regional reference sites, impact and control sites will be defined
within the overall MBES survey in the lower north arm. These sites will not require any additional
sampling for the baseline habitat survey but are important for assessment as part of a BACI
monitoring design.
Table 5. Proposed location of regional reference sites, including habitat and biota type. Site numbers cross‐referenced with Western Port sampling map – See Figure 14.
Important reference sites
Western Port segment
Substratum Relevance and representative habitat
1.Crawfish rock Lower north arm
Reef High profile reef high biodiversity of sessile invertebrates/macroalgae
2.Eagle rock Lower north arm
Reef High profile reef high biodiversity of sessile invertebrates/macroalgae (Blake et al 2013)
3.Honeysuckle reef Western entrance
Reef High diversity of sessile invertebrates/macroalgae (Melbourne Water 2011)
4.Western entrance reef
Western entrance
Reef Diversity of macroalgae, especially phaeophytes (Blake et al 2013)
5.San Remo shallow reefs
Rhyll segment Reef High diversity of sessile invertebrates/macroalgae, important for opisthobranchs (Melbourne Water 2011)
6.Rhyll high profile reef
Rhyll segment Reef High profile reef with sessile invertebrates/macroalgae (Blake 2013)

Prepared by Dr Daniel Ierodiaconou and Richard Zavalas Page 37 of 41
Benthic Habitat Mapping in Western Port– Review and Project Proposal
7.Corinella reef holes Corinella segment
Reef Unique geomorphology, sessile invertebrates
8.Corinella seagrass Corinella segment
Sediment Dense seagrass beds (Blake & Ball 2001)
9.Corinella channel Corinella segment
Sediment Sediment slopes, fauna burrows and sessile invertebrates
10.Upper north arm sea pens
Upper north arm
Sediment Sessile invertebrates on sediment; sea pens, bryozoans, sponges, ascidians (Blake et al 2013)
11.North arm channel Upper north arm
Sediment Sediment slopes, fauna burrows and sessile invertebrates (Blake et al 2013)
12.Yaringa MNP seagrass
Lower north arm
Sediment Dense seagrass beds
13.Western entrance seagrass
Western entrance
Sediment Dense seagrass beds
14.Churchill Is. seagrass beds
Rhyll segment Sediment Seagrass/macroalgae
15.San Remo seagrass Rhyll segment Sediment High seagrass diversity near San Remo eastern channel entrance (Blake et al 2013)
16.Rhyll sea pens Rhyll segment Sediment Sessile invertebrates on sediment; sea pens, bryozoans, sponges, ascidians (Blake et al 2013)
17.French Is. macroalgae (north)
Upper north arm
Mixed Macroalgae including mixed red and Caulerpa spp. beds (Blake et al 2013)
18.French Is. macroalgae (south)
Rhyll segment Mixed Macroalgae/seagrass including mixed green algae beds
19.San Remo rhodolith beds
Rhyll segment Mixed Rhodoliths (Harvey & Bird 2008)
20.Rhyll green algae beds
Rhyll Segment Mixed Caulerpa spp.macroalgae beds (Blake et al 2013)

Prepared by Dr Daniel Ierodiaconou and Richard Zavalas Page 38 of 41
Benthic Habitat Mapping in Western Port– Review and Project Proposal
Figure 14. Proposed location of regional reference sites for Western Port. Site numbers cross‐referenced site descriptions – see Table 5. Please note additional sites within the lower north arm will be prioritised following MBES data acquisition.

Prepared by Dr Daniel Ierodiaconou and Richard Zavalas Page 39 of 41
Benthic Habitat Mapping in Western Port– Review and Project Proposal
References
Ball, D., Parry, G. D., Heislers, S., Blake, S., Werner, G., Young, P. and Coots, A. (2010). Victorian
multi‐regional seagrass health assessment 2004 ‐ 07. Fisheries Victoria Technical Report No.66.
Department of Primary Industries Victoria, Queenscliff, Victoria, Australia.
Barton, J., Pope, A. & S. Howe (2012) Marine Natural Values Study Volume 2: Marine Protected
Areas of the Victorian Embayments Bioregion, Part 2 Western Port Bay & Corner Inlet. Parks
Victoria Technical Series No. 78. Parks Victoria, Melbourne.
Blake, S. & Ball, D. (2001). Victorian Marine Habitat Database. Seagrass mapping of Western
Port. Geospatial Systems Section, Marine and Freshwater Resources Institute report No. 29.
Marine and Freshwater Resources Institute: Queenscliff.
Blake, S., Ball, D., Coots, A. & Smith, T. (2013). Marine Video Survey of Western Port. Fisheries
Victoria Technical Report No.176. Department of Primary Industries Victoria, Queenscliff,
Victoria, Australia.
Bird E.C.F. (1986) Mangroves and intertidal morphology in Westernport Bay, Victoria, Australia.
Marine Geology 69:251‐271.
Boon P., Allen T., Brook J., Carr G., Frood D., Harty C., Hoye J., McMahon A., Mathews S.,
Rosengren N., Sinclair S., White M. & Yugovic J. (2011). Mangroves and coastal saltmarsh of
Victoria: distribution, condition, threats and management. Institute for Sustainability and
Innovation, Victoria University, Melbourne.
Bulthuis, D.A. (1976). The Standing Crop of Submerged Macrophytes in Westernport Bay. Project
report No. 124 to the Westernport Bay Environmental Study (1973‐74). Ministry for
Conservation. Victoria.
Bulthuis, D.A. (1981). Distribution and Summer Standing Crop of Seagrass and Macro‐algae in
Western Port. Victoria. Proceedings of the Royal Society of Victoria. Vol, 92. pp. 107‐112.
Bulthuis, D.A. (1984). Loss of Seagrass in Western Port, a Proposal for Further Research,
1984/85. Marine Science Laboratories. Internal Report Series, No. 72. Ministry for Conservation.
Victoria
Bulthuis, D.A. & Woelkerling, W.J. (1983). Seasonal Variation in Standing Crop, Density and Leaf
Growth Rate of the Seagrass, Heterozostera tasmanica (Martens ex Aschers.) den Hartog in
Western Port and Port Phillip Bay, Vic. Australia. Aquat. Bot. 16: 111‐136.
Butler S.N. & Bird F.L. (2010) Monitoring the macroinvertebrates and soft sediments in the
Marine National Parks in Western Port. Parks Victoria Technical Series No. 60. Parks Victoria,
Melbourne.

Prepared by Dr Daniel Ierodiaconou and Richard Zavalas Page 40 of 41
Benthic Habitat Mapping in Western Port– Review and Project Proposal
Edgar G.J., Shaw C., Watson G.F. & Hammond L.S. (1994) Comparisons of species richness, size‐
structure and production of benthos in vegetated and unvegetated habitats in Western‐port,
Victoria. Journal of Experimental Marine Biology and Ecology 176:201‐226.
Edmunds M, Mustoe S, Stewart K, Sheedy E & Ong J (2010) VNPA Nature Conservation Review:
Marine Conservation Priorities and Issues for Victoria. Report to Victorian National Parks
Association. Australian Marine Ecology Report 405, Melbourne.
Environment Conservation Council (2000) Marine Coastal and Estuarine Investigation. Final
Report. Environment Conservation Council.
French, T., Monk, J., Ierodiaconou, D., Pope, A. & Ball, D. (2014) Yaringa and French Island
Marine National Park Habitat Mapping. Parks Victoria Technical Series No. 96. Parks Victoria,
Melbourne.
Future Coasts. (2010). Future coasts – preparing Victoria’s coast for climate change. Dept.
Sustainability and the Environment. Melbourne
Hancock G., Olley J.M. & Wallbrink P.J. (2001) Sediment transport and accumulation in Western
Port. Report on Phase 1 of a study determining the sources of sediment to Western Port.
Technical report no 47/01. CSIRO Land and Water ‐ Environmental Hydrology.
Harvey A.S. & Bird F.L. (2008) Community structure of a rhodolith bed from cold‐temperate
waters (southern Australia). Australian Journal of Botany 56:437‐450.
Ierodiaconou D., Rattray, A., Monk, J., Laurenson L & Versace, V. (2011). Comparison of
automated classification techniques for predicting benthic biological communities using
hydroacoustics and video observations. Continental Shelf Research, 31, 28‐38.
IMCRA (2006). Integrated Marine and Coastal Regionalisation of Australia: an ecosystem based
classification for marine and coastal environments. Version 4. Environment Australia,
Commonwealth Department of the Environment, Canberra
KBR (2010). Western Port RAMSAR Wetland Ecological Character Description. Report for
Department of Sustainability, Environment, Water, Population and Communities, Canberra
Marsden M.A.H., Mallett C.W. & Donaldson A.K. (1979). Geological and physical setting,
sediments and environments, Western Port, Victoria. Marine Geology 30:11‐46.
Melbourne Water (2011). Understanding the Western Port Environment – A summary of current
knowledge and priorities for future research. Melbourne Water Corporation, East Melbourne,
November 2011.
Rogers, K., Saintilan, N., & Heijnis, H. (2005). Mangrove encroachment of salt marsh in Western
Port Bay, Victoria: The role of sedimentation, subsidence, and sea level rise. Estuaries, 28(4),
551‐559.

Prepared by Dr Daniel Ierodiaconou and Richard Zavalas Page 41 of 41
Benthic Habitat Mapping in Western Port– Review and Project Proposal
Rogers, K., Wilton, K. M., & Saintilan, N. (2006). Vegetation change and surface elevation
dynamics in estuarine wetlands of southeast Australia. Estuarine, Coastal and Shelf Science,
66(3), 559‐569.
Rosengren N.J. (1984) Sites of Geological and Geomorphological significance in the Westernport
Bay catchment. Environmental Studies Series No. 401. Ministry for Conservation, Victoria
Shapiro M. (1975) Westernport Bay Environmental study, 1973 – 1974. Abridged Version.
Melbourne 581 ‐1 – 73
Shepherd S.A., McComb A.J., Bulthuis D.A., Neverauskas V., Steffensen D.A. & West R. (1989).
Decline of seagrasses. In: Larkum A.W.D., McComb A.J. and Shepherd S.A. (eds.) Biology of
Seagrasses: treatise on the biology of seagrass with special reference to the Australia region.
Elsevier, Amsterdam, pp. 346‐387.
Shepherd S.A., Watson J.E., Womersley H.B.S. & Carey J.M. (2009) Long‐term changes in
macroalgal assemblages after increased sedimentation and turbidity in Western Port, Victoria,
Australia. Botanica Marina 52:195‐206.
Stephens, A.C. (1995). Seagrass in Western Port, Victoria. Australia. Environment Protection
Authority, No. 490. Victoria. Australia.
Wallbrink, P.J., Hancock, G.J., Olley, J.M., Hughes, A., Prosser I. P, Hunt, D.,Rooney, G., Coleman
& R. Stevenson, J. (2003). The Western Port sediment study, CSIRO Consultancy report, 2003