benthic habitat mapping in the bulgarian black sea · project Е/701/08 „bulgarian black sea...
TRANSCRIPT
Ozhan E. (Editor), 2015, Proceedings of the Twelfth International Conference on the Mediterranean Coastal Environment MEDCOAST’15, 06-10 October 2015, Varna, Bulgaria, MEDCOAST, Mediterranean Coastal Foundation, Dalyan, Mugla, Turkey, vol. 1, pages 251- 262
Benthic Habitat Mapping in the Bulgarian Black Sea
Valentina Todorova (1), Lyubomir Dimitrov (1, 2), Valentina Doncheva (1, 3), Ekaterina Trifonova (1, 4)
and Bogdan Prodanov (1, 5)
(1) Institute of Oceanology, 9000 Varna, Bulgaria Tel: + 359-52-370-486 E-mail: [email protected] (2) E-mail: [email protected] (3) E-mail: [email protected] (4) E-mail: [email protected] (5) E-mail: [email protected]
Abstract
The aim of this study is to produce benthic habitats maps in the Natura 2000 SAC Ropotamo, the Bulgarian Black Sea, by integrating acoustic, geological and biological data. The focus is on the soft-sediment physical habitats and biotopes (the environment and the associated biological communities). Bathymetry and backscatter data were collected using multi-beam sonar system SeaBat 7111. Digital terrain models were produced with a resolution of 3 m and 2 m in the open sea and the coastal area respectively and isobaths at 1 m depth interval were drawn. Data of the sonar function of the multi-beam sonar system was processed to generate sonar mosaic of the area. Areas with similar backscatter characteristics were defined in ArcGIS to delineate distinct acoustic facies that presumably represent different lithological types of seabed sediments. The acoustic facies were validated by sediment samples analysed for particle size and invertebrate macrofauna. Fourteen sediment classes (Folk 16) were identified in the region, besides rock and boulders. Sediments distribution map was created using map algebra algorithm (Saretta et al, 2007). The acoustic facies and sediments distribution maps were integrated in ArcGIS to produce a lithological map. Bray-Curtis similarity and clustering procedure were employed to discriminate macrofauna

assemblages and Similarity Percentages analysis was used to define the typical species (PRIMER 6). The biological data were overlaid on the lithological map and biotopes were extrapolated, integrating the lithological with biological data in ArcGIS. Depth boundaries between adjacent biotopes were defined using ROC curve analysis on the depth data, and delineated in ArcGIS to produce the final biotopes map. This habitat mapping survey provides basic information on the distribution, extent, area and the associated macrofauna of the habitats of conservation importance in SAC Ropotamo and thus supports spatial planning and ecosystem-based management in a marine protected area. Introduction
Benthic habitat mapping provides basic information about the distribution, spatial pattern, extent and area of the habitats of conservation importance and thus supports spatial planning and ecosystem-based management of a marine protected area. The aim of this study is to produce maps of the benthic physical habitats and biotopes in the Natura 2000 SAC Ropotamo BG0001001, the Bulgarian Black Sea, integrating data from acoustic techniques and sediment sampling. The focus of the survey is on the soft-sediment habitats. Due to variable usage of benthic ecology terminology and in order to avoid nomenclature confusion, the definitions used here are postulated as follows: A physical habitat refers to the abiotic environment in a precise location. The benthic physical habitat is characterized in this study by two environmental factors - depth and lithology. A biotope is defined as the physical habitat and its associated community of macrofauna, in particular the dominant conspicuous species that occur consistently in a specified environment. SAC Ropotamo covers marine area stretching over 881.91 km2 and represents the largest marine space protected within Natura 2000 ecological network in the Bulgarian Black Sea. Water depths range from 0 m along the shoreline to 75 m at the eastern boundary of the protected site. The area of conservation comprises a variety of marine habitats of national and European conservation importance including sandbanks, rocky reefs, seagrass meadows and biogenic reefs. SAC Ropotamo contains the largest shares of the national area of the Habitats Directive Annex I listed habitat types 1170 Reefs and 1110 Sandbanks which are slightly covered by sea water all the time, 15 % and 13 % respectively, which ranks the site first of importance for the maintenance and restoration of the favourable conservation status of these habitat types.
Material and Methods
Bathymetry
Bathymetry data was collected using 100 kHz multi-beam sonar system SeaBat 7111. A total of 234 square kilometres were mapped with 100% coverage (Fig. 1). Data were processed and two digital terrain models (DTM) were created: for the open sea (water depths running from 30 m to 55 m) with a resolution of 3 m and for the coastal area (water depths running from 7-10 m to 30 m) with sell size of 2 m. In addition to these data a DTM from airborne LiDAR survey with a resolution of 3 m covering very shallow waters of the coastal area at all the SAC Ropotamo done under the national

project Е/701/08 „Bulgarian Black Sea bathymetric LiDAR’2009”, was kindly provided by the Centre of Underwater Archaeology (CUWA). The combined DTMs were used to draw a detailed bathymetric chart with isobaths at 1 m depth interval. For areas with no multi-beam data water lines were digitized from navy nautical charts and combined with our own data.
Acoustic data Data of the sonar function of the multi-beam sonar system SeaBat 7111 were
exported in *.XTF format, processed with SonarWiz Map software and sonar mosaic of all the surveyed areas was created (Fig. 1). For a comparison and more detail analysis, a mosaic of backscatter strength was also created using “snippets” of the sonar system, both in a 16-Bit grey colour scheme: low backscatter values (white) represent acoustically absorbent sea floor types (soft bottom), and high backscatter values (black) represent acoustically reflective sea floor types (hard bottom). Multibeam system co-registered water depth and reflectivity at the same time, thus the two types of data were geographically referenced together, ensuring that backscatter snippet data were always shown in the right place on the seafloor.
A high resolution sonar mosaic in a 16-Bit rusty colour scheme of the very
shallow area south of town of Kiten was provided by the CUWA (project Е/701/08 „Bulgarian Black Sea bathymetric LiDAR”, 2009) and combined with our own data (Fig. 1).
Areas with similar backscatter characteristics were delineated in ArcGIS to
discriminate acoustic facies that presumably represent different lithological types of seabed sediments.
Fig.1: Sonar mosaics of the surveyed area within SAC Ropotamo.

Bottom Samples Sediment samples were collected and analysed for particle size and invertebrate
macrofauna composition and biomass with the purpose to ground truth and interpret the acoustic data. The position and number of the bottom samples were proportional to the ground coverage of each acoustic facies. The majority of the samples were collected in the coastal area due to higher heterogeneity of the acoustic imagery, while more homogeneous offshore sonar mosaics were validated with fewer samples.
Sediment properties Altogether 441 sediment samples were collected within the survey area for
particle size analysis during several sampling campaigns: 20 samples from CoCoNet project sampling survey in June 2013, 108 samples from surveys during June-October 2014 conducted under Contract № 0-33-18 with the Ministry of Environment and Waters (Trifonova et al., 2014) and 313 samples collected in the Coastal Zone Dynamics dept. during the period 1976-2006. Van Veen grab samplers were used with area 0.1 m2 and 0.05 m2 in the offshore and coastal areas respectively. Grain size analyses were done by sieving and aerometer methods. For the purposes of biotope mapping, modification of Folk 16 (including rock and boulders) classification system was selected (Folk, 1954, 1974). Fourteen sediment classes were identified in the region, besides rock and boulders. Map algebra algorithm written in a GIS environment (Saretta et al, 2007) was used to create sediments distribution map. Additionally, sand was classified according to the domination fraction as coarse, medium and fine.
Macro fauna assemblages Quantitative samples for benthic macrofauna were collected from the sediments
at 74 stations using 0.1 m2 Veen grab sampler, sieved on 1.0 mm and 0.5 mm mesh and fixed in buffered 4-10% formaldehyde. The retained macro-invertebrates were identified to the species level, enumerated and weighted on scales with precision 0.0001 g for biomass (wet weight) determination (Todorova and Konsulova, 2005).
Bray-Curtis similarity coefficient (Bray-Curtis, 1957) was employed on 4th root
transformed biomass to assess the similarity between every pair of samples. The biomass better represents the large conspicuous species in a given biotope, and therefore preferred as biotope descriptor to the abundance, which is dominated by miniscule unnoticeable by naked eye polychaetes, oligochaetes and crustaceans. Hierarchical agglomerative clustering procedure using group-average linking and ordination by Multidimensional Scaling (MDS) were performed on the pairwise similarities matrix to study the community pattern and differentiation (Clarke and Warwick, 2001). Similarity Percentages (SIMPER) was used to characterize each of the clusters by the species that contribute most to within-assemblage similarity. PRIMER v6 software package (Primer-E Ltd) was employed for the multivariate statistical analyses. Depth boundaries between adjacent communities were defined using ROC curve analysis on the depth data.
Integration of acoustic data with sediment type and biological data The acoustic facies and sediments distribution maps were integrated in ArcGIS
to produce a lithological map of the seafloor substrate. The biological data were overlaid on the lithological map and biotopes were extrapolated, integrating the lithological with biological data in ArcGIS. Depth boundaries between adjacent biotopes were defined using ROC curve analysis on the depth data, and delineated in ArcGIS to produce the final biotopes map. All shape files were created in UTM projection, zone 35N in datum WGS’84. Results
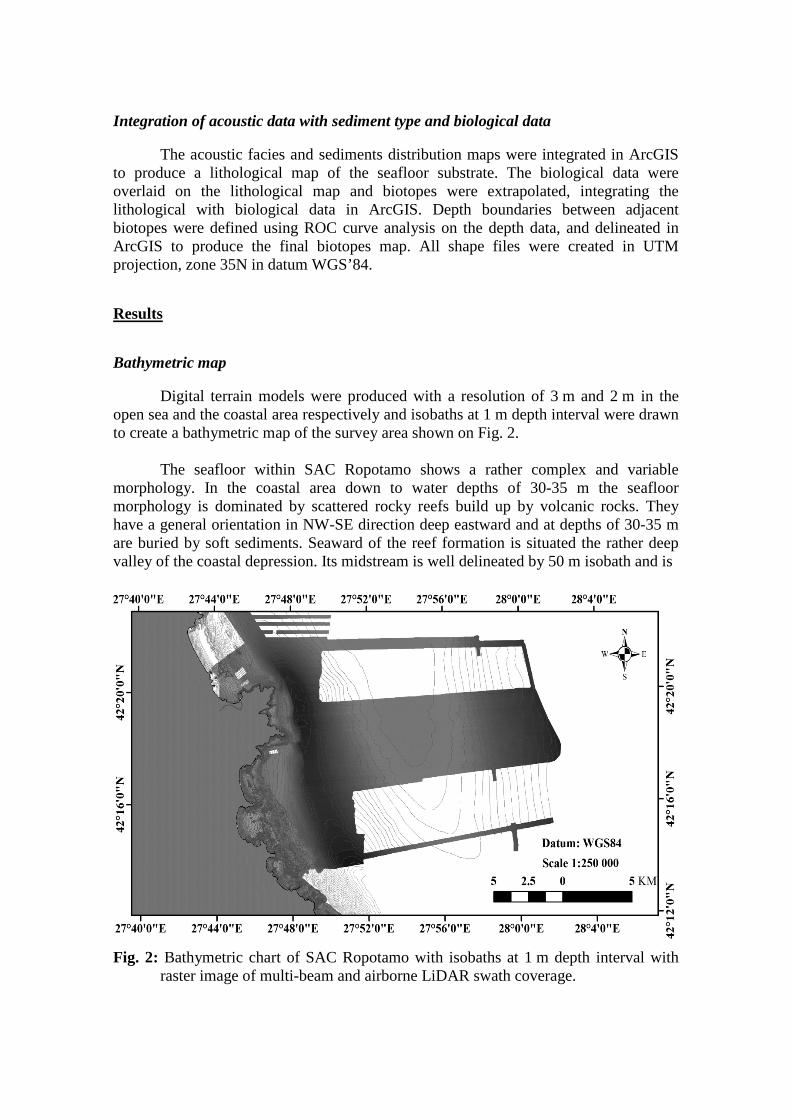
Bathymetric map Digital terrain models were produced with a resolution of 3 m and 2 m in the
open sea and the coastal area respectively and isobaths at 1 m depth interval were drawn to create a bathymetric map of the survey area shown on Fig. 2.
The seafloor within SAC Ropotamo shows a rather complex and variable
morphology. In the coastal area down to water depths of 30-35 m the seafloor morphology is dominated by scattered rocky reefs build up by volcanic rocks. They have a general orientation in NW-SE direction deep eastward and at depths of 30-35 m are buried by soft sediments. Seaward of the reef formation is situated the rather deep valley of the coastal depression. Its midstream is well delineated by 50 m isobath and is
Fig. 2: Bathymetric chart of SAC Ropotamo with isobaths at 1 m depth interval with
raster image of multi-beam and airborne LiDAR swath coverage.

oriented in NNW-SEE direction along the general trend of the coastline. The valley shallows and widens northward of Cape Korakya. Further offshore follows the accumulative plain of the central shelf where the tongue-like end of the so called Emine accumulative bar occurs. The bar features steep western board and gentle eastern one spreading up to 60-65 m water depth with top as shallow as 37 m. Substrate maps
The sediment distribution map clearly illustrates the dominance of sandy mud in
the offshore area (Fig. 3). In the nearshore area, especially close to the rocky capes and reefs the sands are
enriched by shells and shell debris. In accordance with the Folk system shells are classified as gravel, therefore the gravelly sediments in the presented map correspond to shelly ones in nature. The sediments become increasingly fine with distance from the coast. The finest sediments (sandy mud) were located on the eastern slope of Emine bar and adjoining depression (Fig. 3). Coarse sediments (gravel and sandy gravel) were found in the coastal area around rocky reefs, the gravel composed mostly of shells of mussels and oysters that typically overgrow hard bottoms.
The final lithological map represents an integration of the acoustic facies with
the substrates map as shown on Fig. 4. While sandy mud occupies most of the shelf area, the coastal area substrates are very heterogeneous, composed of rocky reefs, sands with different grain size and shelly gravel.
Fig. 3: Sediment map based on in-situ data

Besides Folk 16 substrate classes, another distinctive acoustic class was depicted with image characteristics similar to “hard bottom” but featuring peculiar spatial pattern of distribution over the predominantly muddy shelf bottoms (Fig. 4). Based on grey literature information regarding the characteristic biological communities that occur in the area (Kaneva-Abadzhieva and Marinov, 1960, 1967) an assumption is made that these acoustic facies represent mussel beds on sediments. The accuracy of this assumption is discussed further in the text in relation to zoobenthos in-situ data.
Macrozoobenthos communities The clustering procedure on the Brey-Curtis similarities between samples
calculated on 4th root transformed biomass generated the dendrogram on Fig. 5. Nine statistically significant clusters of similar stations were differentiated.
Based on expert knowledge of the biological communities in the Bulgarian Black Sea, four of the clusters in shelly coarse sand were combined into one and thus six final macrofauna assemblages were classified. Each assemblage was characterised by its typical dominant species as derived by SIMPER, listed in Table 1.
Fig. 4: Final seabed substrate map, including sediments, rocky reefs and presumable
“mussel beds” over shelf sediments.

Fig. 5: Dendrogram of the sediment samples grouped in clusters according to the
invertebrate macrofauna similarity (Brey-Curtis coefficient on 4th root transformed biomass data). Symbols: grey triangle - muddy sand and sandy mud, black square - shelly coarse sand, grey dot - fine sand, black dot - medium sand.
FFFFFFFFFFFFFFFFFFDDDDDDEEEEEEEGGGGGGGGGGGGGGGGGGGCCCBBBBBBBBBBBBBBBBBBBBB
Sam
ples
100806040200Similarity

Table 1: Average biomass, average similarity, % contribution and cumulative % of the dominant typical species derived by SIMPER for each macrofauna community (the groups are according to the clusters on Fig.4) .
Species Av. Biomass (g.m-2)
Av. Simi-larity
Contri-bution
%
Cumu-lative
% Group F Donax trunculus (Linne, 1758) 1.35 9.20 17.33 17.33 Lentidium mediterraneum (Costa O.G., 1829)
1.22 7.73 14.56 31.89
Chamelea gallina (Linne, 1758) 1.31 7.70 14.51 46.40 Group D Chamelea gallina (Linne, 1758) 3.73 26.22 40.62 40.62 Donax trunculus (Linne, 1758) 0.89 4.98 7.72 48.33 Lucinella divaricata (Linne, 1758) 0.84 4.34 6.73 55.06 Group E Chamelea gallina (Linne, 1758) 1.41 9.94 16.85 16.85 Angulus tenuis (da Costa, 1778) 0.90 5.80 9.83 26.68 Spisula subtruncata (da Costa, 1778) 0.85 5.12 8.69 35.36 Group G Protodorvillea kefersteini (McIntosh, 1869) 0.57 3.70 8.26 8.26 Branchiostoma lanceolatum Pallas, 1744 0.50 1.98 4.43 48.76 Gouldia minima (Montagu, 1803) 0.49 1.93 4.31 53.08 Group C Calyptraea chinensis (Linne 1758) 0.63 5.91 12.66 12.66 Prionospio cirrifera Wiren, 1883 0.59 5.05 10.81 23.47 Heteromastus filiformis (Claparede, 1864) 0.62 5.03 10.78 34.25 Group B Nephthys hombergii Savigny in Lamarck, 1818
0.69 7.18 13.86 13.86
Abra prismatica (Montagu, 1808) 0.49 4.44 8.58 31.61 Pitar rudis (Poli, 1795) 0.77 4.27 8.24 39.85 Mytilus galloprovincialis Lamarck, 1819 0.85 3.75 7.24 54.53
Biotopes
A point shape file was created in ArcGIS of the zoobenthos communities differentiated according to the similarity analyses. Each community was denoted by the dominant in the biomass characteristic species as derived by SIMPER results. The communities point layer was overlaid on the lithological map. Evidently, some lithological facies were occupied by several invertebrate assemblages along the depth gradient, while some communities spread over several sediment types within the same depth range. The boundary isobaths (defined in advance by ROC curve analysis) between adjacent communities, were used to cut and distribute the lithological polygons among the resident communities. The resulting polygons were assigned to the typical community, sediment type and depth zone to produce the final biotope map on Fig. 6.

Fig. 6: Map of the seabed biotopes identified in SAC Ropotamo with point distribution
of the biological communities.
Altogether six sedimentary biotopes were identified and mapped in the survey area, as shown on the map of Fig. 6. The first five of them in the order of listing on the figure’s legend represent national subtypes of the habitat type 1110 “Sandbanks which are slightly covered by sea water all the time”.
The zoobenthos similarity analyses did not statistically distinguish between the
biological communities within and outside the acoustic “mussel bed patches”. Therefore ground truthing methods, other than Van Veen grab sampling, shall be explored in the future in order to validate the accuracy of our assumption that mussel beds are reflected by the acoustic image.
Conclusions Six sedimentary biotopes were identified and mapped in this study, five of which
represent national subtypes of the habitat type 1110 Sandbanks which are slightly covered by sea water all the time listed in Annex I of the EU Habitats Directive, as follows:
- Donax trunculus, Lentidium mediterraneum, Chamelea gallina in very
shallow (1-10 m) medium and fine sand; - Chamelea gallina, Donax trunculus, Lucinella divaricata in shallow (5-15 m)
fine sand;

- Chamelea gallina, Tellina tenuis, Spisula subtruncata in shallow (13-20 m) fine, medium and muddy sand;
- Protodorvillea kefersteini, Gouldia minima, Branchiostoma lanceolatum in shallow (10-30 m) shelly, medium and coarse sand;
- Calyptraea chinensis, Prionospio cirrifera, Heteromastus filiformis in medium depth (30-40 m) shelly coarse sand.
The last identified biotope: Nephthys hombergii, Abra prismatica, Pitar rudis, Mytilus galloprovincialis in medium depth (30-50 m) mud, sandy mud and muddy sand is not Annex I (Habitats Directive) listed habitat. Although the muds are not a qualifying feature of SAC Ropotamo, their good ecological status is essential in order to ensure the continuity and the food base of the demersal fishes, such as turbot and sturgeons, listed as “important species” at the site.
Ground truthing methods for direct observation, such as ROV cameras for
underwater filming and drop down cameras, shall be used in the future for validation of the peculiar acoustic image that presumably reflects mussel beds on muddy sediments.
The results of the present habitat mapping survey provide basic information on
the distribution, extent, area and the associated macrofauna communities of the habitats of conservation importance 1110 Sandbanks which are slightly covered by sea water all the time and 1170 Reefs in SAC Ropotamo and thus support spatial planning and ecosystem-based management in a marine protected area. The survey offers an approach for future mapping of the habitats and biotopes in the ecological network Natura 2000 in the Bulgarian Black Sea. Acknowledgements
This work was partly funded through the European Community’s Seventh
Framework Programme (FP7/2007-2013) under Grant Agreement No. 287844 for the project “Towards COast to COast NETworks of marine protected areas (from the shore to the high and deep sea), coupled with sea-based wind energy potential’ (COCONET)”; the Bulgarian Ministry of Environment and Waters under Contract No. 0-33-18/12.06.2013 for carrying out the national marine monitoring under the Water Act; the Enterprise for Management of Environmental Protection Activities under Contract No. 7976/04.04.2011 for the project “Extension of Natura 2000 in the Bulgarian Black Sea”.
We gratefully acknowledge the Centre of Underwater Archaeology for providing
a sonar mosaic of the very shallow area south of town of Kiten, produced under the project Е/701/08 „Bulgarian Black Sea bathymetric LiDAR”, 2009. References Clarke, K.R., Warwick R.M. (2001), “Change in marine communities: an approach to
statistical analysis and interpretation”, 2nd edition. PRIMER-E, Plymouth, United Kingdom, 172 p.

Folk, R.L., (1954), “The distinction between grain size and mineral composition in sedimentary rock nomenclature”, Journal of Geology, 62(4), 344-359.
Folk, R.L., (1974), “Petrology of sedimentary rocks”, Austin, Tex., Hemphill
Publishing Co., 182 p. Kaneva-Abadjieva, V., T. Marinov, (1960), “Zoobenthic distribution in the Bulgarian
Black Sea area”, Proc. Inst. Fish., 3, 117-161. (In Bulgarian). Kaneva-Abadjieva, V., T. Marinov, (1967), “Distribution of the blue mussel and status
of Bulgarian mussel catch”, Proc. Inst. Fish., 8, 71-79. (In Bulgarian). PRIMER-E Ltd, PRIMER v6, Plymouth, United Kingdom. Saretta, A., Masiol, M.and Molinaroli, E. (2007), "Development of algebra algorithms
for automated generation of grain-size distribution maps." Earth Surface Processes and Landforms 32.7 1116-1127.
Todorova, V. and Konsulova, Ts. (2005), “Manual for quantitative sampling and
sample treatment of marine soft-bottom macrozoobenthos”, IO-BAS, Varna, Bulgaria, 38p.
Trifonova E., Keremedchev, S., Kotsev, I. and Kirilova, D. (2014), Sediments.
“Assessment Report of Marine Environmental Status Contract № 0-33-18 from 06.12.2013 between Ministry of Environment and Water and the Institute of Oceanology - BAS, Varna for implementation of obligations under the monitoring of the Black Sea, on the grounds of Article 171, paragraph 2, item 3 of the Water Act”,43-76. (In Bulgarian).