benthic fluxes and porewater concentration profiles of dissolved organic carbon in sediments from...
TRANSCRIPT
PII S0016-7037(99)00032-0
Benthic fluxes and porewater concentration profiles of dissolved organic carbon insediments from the North Carolina continental slope
MARC J. ALPERIN,1,* CHRISTOPHERS. MARTENS,1 DANIEL B. ALBERT,1 ISMAIL B. SUAYAH ,2 LARRY K. BENNINGER,2 NEAL E. BLAIR,3
and RICHARD A. JAHNKE4
1Department of Marine Sciences, University of North Carolina, Chapel Hill, North Carolina 27599-3300, USA2Department of Geology, University of North Carolina, Chapel Hill, North Carolina 27599-3315, USA
3Department of Marine, Earth, and Atmospheric Sciences, North Carolina State University, Raleigh, North Carolina 27695-8208, USA4Skidaway Institute of Oceanography, Savannah, Georgia 31411, USA
(Received May31, 1998;accepted January7, 1999)
Abstract—Numerous studies of marine environments show that dissolved organic carbon (DOC) concentra-tions in sediments are typically tenfold higher than in the overlying water. Large concentration gradients nearthe sediment–water interface suggest that there may be a significant flux of organic carbon from sediments tothe water column. Furthermore, accumulation of DOC in the porewater may influence the burial andpreservation of organic matter by promoting geopolymerization and/or adsorption reactions. We measuredDOC concentration profiles (for porewater collected by centrifugation and “sipping”) and benthic fluxes (within situ and shipboard chambers) at two sites on the North Carolina continental slope to better understand thecontrols on porewater DOC concentrations and quantify sediment–water exchange rates. We also measured asuite of sediment properties (e.g., sediment accumulation and bioturbation rates, organic carbon content, andmineral surface area) that allow us to examine the relationship between porewater DOC concentrations andorganic carbon preservation. Sediment depth-distributions of DOC from a downslope transect (300–1000 mwater depth) follow a trend consistent with other porewater constituents (SCO2 and SO4
22) and a tracer ofmodern, fine-grained sediment (fallout Pu), suggesting that DOC levels are regulated by organic matterremineralization. However, remineralization rates appear to be relatively uniform across the sediment transect.A simple diagenetic model illustrates that variations in DOC profiles at this site may be due to differences inthe depth of the active remineralization zone, which in turn is largely controlled by the intensity ofbioturbation. Comparison of porewater DOC concentrations, organic carbon burial efficiency, and organicmatter sorption suggest that DOC levels are not a major factor in promoting organic matter preservation orloading on grain surfaces. The DOC benthic fluxes are difficult to detect, but suggest that only 2% of thedissolved organic carbon escapes remineralization in the sediments by transport across the sediment-waterinterface. Copyright © 1999 Elsevier Science Ltd
1. INTRODUCTION
Bacteria are known to play a major role in the organic matterdegradation process in marine sediments (Schwinghamer et al.,1986; Smith et al., 1987; Deming and Baross, 1993; Nealson,1997). Because most bacteria only assimilate compounds smallenough to be transported across the cytoplasmic membrane(Law, 1980; King, 1986; Colberg, 1988), particulate organicmatter must be dissolved before bacterial uptake. Sedimentbacteria use extracellular hydrolytic enzymes to convert solid-phase biopolymers to oligomers or monomers that are suitablefor intracellular metabolism (Mayer, 1989; Chro´st, 1991;Meyer-Reil, 1991; Arnosti et al., 1994). The hydrolysis ofparticulate macromolecular organic matter releases dissolvedorganic carbon (DOC) to the sediment porewater.
DOC produced by hydrolytic enzymes faces several possiblefates: uptake by sediment bacteria, adsorption onto particlesurfaces, or chemical transformations via abiotic reactions(Henrichs, 1992). Porewater DOC concentrations, therefore,reflect the balance between rates of production and consump-tion. Numerous studies from a wide variety of marine environ-ments show that DOC concentrations in sediments are typically
tenfold higher than in the overlying water (e.g., Krom andSholkovitz, 1977; Martin and McCorkle, 1993; Alperin et al.,1994; Burdige and Gardner, 1998). The elevated DOC concen-trations in porewaters imply that there is net production ofDOC in the sediment column.
The accumulation of DOC in marine porewaters may have asignificant impact on several aspects of the oceanic carboncycle. Concentration gradients near the sediment–water inter-face suggest that DOC diffuses from the sediments to theoverlying water. Based on Fick’s Law and measured porewaterprofiles, Burdige et al. (1992) calculate a global DOC benthicflux that is comparable in magnitude to the riverine input oforganic carbon to the oceans. However, calculated fluxes aresubject to errors resulting from uncertainty in the diffusioncoefficient, artifacts associated with the collection of sedimentand isolation of porewater, and the difficulty of accuratelymeasuring concentration gradients at the sediment–water inter-face (Burdige et al., 1992). These errors could produce eitherpositive or negative bias in the calculated flux.
The accumulation of DOC in the porewater may also influ-ence the preservation and burial of organic matter. Three mech-anisms have been proposed to account for the long-term storageof organic carbon in marine sediments: (1) porewater DOC isstabilized by adsorption to mineral surfaces (Mayer, 1994a,b;Hedges and Keil, 1995; Henrichs, 1995; Thimsen and Keil,
*Author to whom correspondence should be addressed([email protected]).
Pergamon
Geochimica et Cosmochimica Acta, Vol. 63, No. 3/4, pp. 427–448, 1999Copyright © 1999 Elsevier Science LtdPrinted in the USA. All rights reserved
0016-7037/21801 $20.001 .00
427
1998); (2) porewater DOC undergoes abiotic condensationreactions to form refractory geopolymers (Tissot and Welte,1984; Krom and Sholkovitz, 1977); and (3) inert biomacromol-ecules produced by microalgae and bacteria are selectivelypreserved (de Leeuw and Largeau, 1993; Largeau, 1995). Al-though the relative importance of each mechanism is currentlybeing debated (e.g., Hedges and Keil, 1995; Berner, 1995;Henrichs, 1995, Mayer, 1995; Pedersen, 1995; Collins et al.,1995; Ransom et al., 1997), porewater DOC may play a role inthe first two models.
In this paper, we present the results of a study designed toquantify the benthic DOC flux, evaluate porewater DOC sam-pling procedures, investigate the controls on down-core varia-
tions in sediment DOC concentration, and examine the rela-tionship between porewater DOC and organic carbonpreservation. The study focuses on sediments from the NorthCarolina continental slope because the shelf and upper slopemay contribute more than half of the global benthic DOC flux(Burdige et al., 1992) and account for 40% of global organiccarbon burial (Hedges and Keil, 1995).
2. STUDY SITES
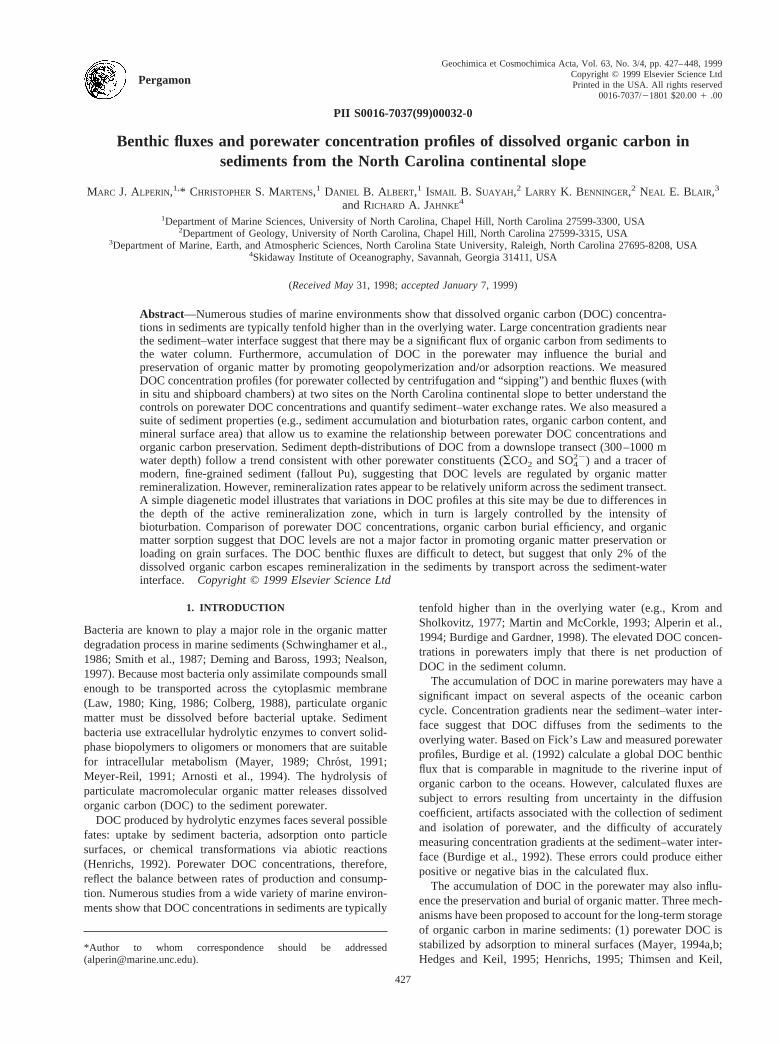
Sediment cores for this study were collected from two loca-tions on the North Carolina continental slope (Fig. 1): a transectsite at 36°209N and a bathymetric survey site at 35°299N. DOC
Fig. 1. Locations of the two study sites. Bottom contours are in meters. The inset is a cross-sectional view of the transectsite (36°209N) showing the slope of the seafloor and the depth of the water column at sampling stations A through D (afterBunn and McGregor, 1980).
428 M. J. Alperin et al.

benthic flux measurements were conducted in the vicinity ofboth sites.
The transect site intersects the Currituck Slide, a 20-km widesubmarine landslide that extends downslope for about 30 km(Prior et al., 1986). Morphology in the slide region is relativelysmooth compared with adjacent areas that are heavily dissectedby valleys (Bunn and McGregor, 1980). Seismic-reflectionprofiles reveal a slide headwall at depths of 500–700 m with anaverage slope of 12° (Fig. 1 inset); the inclination decreases to4–5° immediately above and below the escarpment (Bunn andMcGregor, 1980). Macrofaunal densities at 500 m water depthare 103 m22 (DeVito, 1981).
Bathymetry at the 35° 299 N site is steep and complex. Ahigh resolution Sea Beam survey reveals numerous “V”-shapedcanyons (up to 800 m wide and 300 m deep) separated by sharpridge crests (Mellor and Paull, 1994). The ridge flanks aredissected by small channels (200 m wide and 25 m deep) thatintersect the submarine canyons at sharp angles (Mellor andPaull, 1994). Sediments from this region have an unusuallyhigh abundance (104–105 m22) of benthic organisms (Blakeand Hilbig, 1994).
3. METHODS
3.1. Sediment Coring
Sediments were collected by surface ship using a Kasten corer (KC;Kuehl et al., 1985) and an MK-III box corer (BC). Subcores were takenfrom the box core using clear plastic core liner (9-cm outer diameter)or stainless steel tubing (6-inch outer diameter). Sediments were alsocollected by manned submersible. Push cores (PC) were taken using thesubmarine’s mechanical arm to slowly insert clear plastic core liner(9-cm outer diameter) into the sediment.
At the transect site, cores were collected at four nominal watercolumn depths: 300, 500, 750, and 1000 m. Most cores showed clearsigns of bioturbation; polychaete worms were abundant throughout theupper 5 cm and burrows were visible to depths of 16 cm. The sedimentswere dark gray and composed primarily of silty-clay. The sedimenttemperature was 6–7°C at the time samples were collected.
At the bathymetric survey site, submarine push cores were collectedat three distinct seafloor morphologies: a ridge crest, a valley wall, anda valley floor. The three coring sites span a triangular area of,0.07km2. Inclinometer readings ranged from 10° (ridge-top plateau) to 50°(valley wall). Ridge crest sediments had an apparent redox discontinu-ity (brown to dark-gray color change) at 3 to 10-cm depth; wallsediments exhibited brown/dark-gray mottling; valley floor sedimentshad an abrupt textural change below 8 cm where dark-gray, highporosity material gave rise to light-gray, highly compacted clay.Polychaete worms were found in the upper 5 to 10-cm of every core.The temperature of the bottom water was 4–5°C.
3.2. Porewater Extraction
Porewater collection began shortly after the cores were recovered.Sediments from box cores and push cores were processed in a coldroom; Kasten cores were rapidly processed on deck.
Most porewater samples for this study were extracted from sedimentby centrifugation. The sediment was sectioned at 0.5- to 2.0-cm inter-vals and packed into 30-mL Teflon centrifuge tubes. Each tube wasfilled to the rim to minimize O2 contact and CO2 exchange. Thegimbaled centrifuge would not fit in the cold room, therefore the rotorhead was cooled to 6°C before use. Samples were spun at 5000g for15 min; the supernatant was pipetted from the centrifuge tube using astainless-steel needle connected to a 5-mL glass-barrel/Teflon-pistonsyringe. The porewater was passed through a 0.45-mm syringe filterthat had been precleaned by flushing with 40 mL of distilled water andpurging with air. The first mL of filtrate was discarded.
Porewater for DOC analysis was also extracted using a “sipper”device. The sipper is composed of a porous (60mm) polyethylene
membrane attached to a polypropylene syringe. The syringe and mem-brane assembly were flushed with 30 mL of distilled water and purgedwith air before use. Sediments processed by this method were collectedin core liners with tape-covered holes at 1-cm intervals. After coreretrieval, the tape was punctured and the sipper was inserted horizon-tally into the sediment. The syringe was cocked to create a partialvacuum; 2–4 mL of porewater was collected in less than 30 min.Assuming that porewater extraction is isotropic, the depth intervalsampled is about 1.0–1.3 cm. The porewater was filtered as describedabove. Sampling of distilled water demonstrated that the blank contri-bution of the sipper device was negligible.
3.3. Whole Sediment Processing
Samples for whole sediment analyses were processed on deck. Wateroverlying the sediment was removed and the cores were sliced at 0.5-to 2.0-cm intervals. Samples for total organic carbon and specificsurface area analyses were stored frozen in Ziplock bags. For pluto-nium and porosity, depth intervals from two 6-inch stainless subcoreswere combined and stored refrigerated in polypropylene jars (thesample from BC-74 has sediment from only one subcore). Beforeanalysis, the samples were dried and ground to a fine powder.
3.4. Benthic DOC Flux
The DOC flux at the sediment–water interface was measured in situusing a free-vehicle benthic lander (BECI; Jahnke and Christiansen,1989). The lander free-falls to the sea floor and inserts a 303 30-cmtitanium chamber part way into the sediment. After a short delay (1 h),the chamber lid (polyvinylidene fluoride with butyl rubber gasket) issealed. Water inside the chamber is stirred (5 rpm) by a paddlecomposed of four Delrin rods to simulate turbulence levels typical ofthe deep-sea benthic boundary (discussed in detail by Buchholtz-TenBrink et al., 1989). Aliquots of overlying water are periodically col-lected by spring-loaded plastic syringes that release at predeterminedtimes. To reduce the potential for organic contamination, samples forDOC analysis were collected in combusted Pyrex ampoules (filled withlow-DOC distilled water [10–16mmol C z L21] before deployment)placed upstream of the plastic syringes. However, the samples did passthrough 30 cm of small-bore (1.6 mm) Tygon tubing during transitfrom the chamber to the ampoules. Six to eight DOC samples werecollected during each 20–35 h deployment. Immediately after thelander was retrieved, samples for DOC analysis were pipetted into aglass-barrel/Teflon-piston syringe using a stainless steel needle andfiltered as described above.
The DOC flux was also measured by incubating intact cores in glassflux chambers on board ship. The chambers were fashioned from 2.5-Lacid bottles (12.5-cm inner diameter at the base) with the bottoms cutoff. The chambers were gently inserted into box cores to a sedimentdepth of 10 cm and sealed on the bottom by Teflon-covered base plateswith foam-backed silicone gaskets. A strap of surgical tubing providedthe force to seal the bottom edge of the glass against the gasket.Because water in the chamber contacted only combusted glass, stain-less steel, and natural sediment, organic contamination was minimized.Bottom water collected by a Niskin bottle was added to the chamber tomake up the total volume of overlying water to 450 mL. Elevating thewater level to the narrow region of the neck reduced sloshing caused bythe rolling ship. The overlying water was gently bubbled (10 mLzmin21) with humidified ultra-pure air (,0.1 ppm total hydrocarbon) tomix the water and prevent O2 depletion. The stainless-steel aerationtube also served as a sampling port. Samples were withdrawn byattaching a glass-barrel/Teflon-piston syringe to the Luer fitting (thefirst 2 mL were discarded) and filtered as described above. The fluxchambers were kept in the dark in a water bath (7–9°C) in a cold room.The cold room compressor failed early in cruise and flux chamberswere moved to a refrigerator (6°C) for 2 days while repairs were made.
3.5. Sediment Accumulation and Bioturbation Rates
Advection-diffusion models applied to plutonium depth distributionscan provide information on sediment accumulation and bioturbationrates (Christensen and Bhunia, 1986). Plutonium was first introduced tothe marine environment in 1952 from above-ground testing of thermo-
429

nuclear explosives; fallout peaked in 1963 and rapidly declined insubsequent years after ratification of the Nuclear Test Ban Treaty(Benninger and Dodge, 1986). Plutonium is scavenged by fine-grainedparticles and is thought to be immobile after deposition (Aston andStanners, 1981; Sholkovitz and Mann, 1984). The maximum in sedi-ment Pu activity is assumed to coincide with particles deposited in1963 and its depth provides a measure of the sedimentation rate; thebreadth of the peak is assumed to reflect the extent of biologicalmixing.
A brief outline of the one-dimensional, time-dependent Pu model isgiven below; a complete description is reserved for a subsequent paper.Bioturbation was modeled as a diffusive process with a constantcoefficient that rapidly decreased to zero at the base of the mixed layer(Robbins, 1986). Sediment compaction was simulated by allowingporosity to decrease exponentially with depth (Berner, 1980). Themodel was initialized by setting Pu activities to zero at all depths for theyear 1950, before the first global-scale release of fission-derived iso-topes (Benninger and Dodge, 1986). The time-dependent input flux(upper boundary condition) was assumed to mimic90Sr fallout at NewYork City (Health and Safety Laboratory, 1977) and was scaled so thattotal deposition balanced the measured sediment inventory. The lowerboundary was set sufficiently deep that Pu activity remained zero overthe time domain of the model. Solutions were obtained att 5 43.6 yr(the time elapsed between sample collection and 1950) using themethod of lines with cubic Hermite polynomials (Sewell, 1982).
For each station, sediment accumulation rate, bioturbation coeffi-cient, and depth of the mixed layer were varied so that simulated Puprofiles best-fit the data. The sedimentation and mixing rates predictedby Pu distributions were confirmed by applying a steady-state model toexcess210Pb data (not shown). Accumulation and mixing parametersthat produced good fits to the Pu data also generally did a good jobsimulating 210Pb data; r2 values of model-derived210Pb profiles forstations A through D were 0.90, 0.44, 0.95, and 0.85, respectively (thepoor fit for Sta. B is due to increasing210Pb with depth in the upper 5cm).
3.6. Analytical Results
DOC samples were stored in combusted Pyrex vials with Teflon-lined lids. All of the porewater samples were analyzed on board shipwithin several hours of collection (samples were kept at 6°C beforeanalysis). Most flux samples were collected toward the end of the cruiseand thus were frozen for later analysis on shore. Ship- and shore-basedanalysis of selected flux samples indicates that concentrations mea-sured at sea are 146 7 mM (n 5 9) higher than those measured in thelaboratory; shipboard values have been corrected to avoid potentialbias.
DOC concentrations were measured by high temperature catalyticoxidation using a ShimadzuTOC-5000. The combustion tube waspacked with 17 g of platinized alumina overlain by 12 g of CuO wire.The CuO provides a large thermal mass to accelerate combustion andimprove peak shape (Ron Benner, personal communication). Becausethe TOC-5000 detector is motion sensitive, a LicorLI-6251 CO2
analyzer was used as a detector for shipboard measurements; the twodetectors give identical results when operated on a stable platform.Samples were acidified (50–100mL 6 N HCl) immediately beforeanalysis and bubbled with low-carbon air (,1 ppm CO2, ,0.1 ppmtotal hydrocarbon) for about 10 min to quantitatively remove inorganiccarbon. Standards were prepared in water purified by reverse osmosisfollowed by passage through a BarnstedNANOpure II deionizationsystem. The DOC content of water used in standards (10–16mM) wasdetermined after assessing the instrument blank using the “blankcheck” capability of theTOC-5000(Benner and Strom, 1993). Stan-dards were corrected for the DOC contribution from the water. Theinstrument blank was measured several times each day (by injectingpurified water with a known DOC concentration) but was not sub-tracted as it affects both samples and standards. The instrument blankcontributed,5 and 20–25% of the total signal for porewater andbenthic flux samples, respectively. All DOC concentrations have beencorrected for procedural blanks determined by analyzing purified waterthat had been filtered, stored, and acidified in parallel with the samples.The instrumental precision for porewater and benthic flux samplesaveraged63% and65%, respectively. About half of the estimated
uncertainty in the flux sample concentrations is due to variability in theprocedural blank (56 4 mM).
Concentrations ofSCO2 were determined within several hours ofporewater collection by flow injection analysis (Hall and Aller, 1992).Porewater was filtered directly into 1-mL plastic syringes and sealedwith three-way stopcocks. Precision of theSCO2 method is estimatedat 62%; maximum interference from H2S is 2%.
Samples for SO422 analysis were immediately acidified and purged
with N2 to prevent interference from sulfide oxidation. Sulfate concen-trations were measured on board ship by ion chromatography (Dionex2010i) using post-column chemical suppression. The precision of themethod averaged62% (based on triplicate analysis of standards).
Activities of fallout plutonium (239,240Pu) were measured by alphaspectrometry. Plutonium was leached from the sediment in two stages:first with hot 1 M HCl (CO2 was collected to determine sedimentcarbonate content) followed by hot nitric acid digestion. Solutions fromthe two extractions were combined and242Pu was added to serve as ayield tracer. The mixture was purified by anion exchange chromatog-raphy and electroplated onto stainless-steel discs (Anderson and Fleer,1982; Benninger and Dodge, 1986).
Percent organic carbon was determined by a Carlo-Erba1500Ele-mental Analyzer. Carbonates were removed by vapor phase acidifica-tion with concentrated HCl (Hedges and Stern, 1984). The relativestandard deviation of replicate analyses is typically63%.
Sediment surface area was measured by the N2 adsorption techniqueusing a QuantachromeNOVA 1200. Samples were pretreated by heat-ing to 350°C for 12–16 h in open crucibles. Just before analysis,aliquots were weighed into calibrated cells and degassed for 30 min at300°C under vacuum. Surface areas were calculated by the three-pointBET method (Brunauer et al., 1938). The analytical precision is typi-cally ,1% (based on reanalysis of the same sediment parcel) butsurface areas measured on duplicate aliquots of a well-mixed samplecan differ by up to 10%. We compared our surface areas with thosemeasured at the University of Maine for three samples (4, 13, and 100cm) from a Kasten core taken at 35°509N (800 m water depth); themagnitude of the difference between the two labs averaged 10% (range8 to 14%), comparable to the maximum variation between replicatesediment aliquots. Because samples from the transect site had all beenground before analysis, we conducted a test to determine the effect ofgrinding on sediment surface area. Five freeze-dried samples from theNorth Carolina continental slope (sediment depths ranging from 1.5 to100 cm) were disaggregated by gentle shaking. After measuring thesurface area of the unground sediment, the cell contents were dumpedinto a ceramic mortar, ground to a fine powder, and transferred back tothe cell (taking care to minimize sample loss). The difference betweenunground and ground sediment averaged only 10% (range 6 to 17%),indicating that grinding has a minimal effect on surface area.
4. RESULTS
4.1. DOC Concentrations in Porewater Obtained byCentrifuge and Sipper
A number of studies have shown that DOC concentrationscan be affected by the technique used to isolate porewater. Forexample, Martin and McCorkle (1993) demonstrated thatwhole core squeezing leads to artificially high DOC concen-trations. They also showed that removing macrofauna by siev-ing leads to lower DOC in porewater obtained by centrifuga-tion. Likewise, Carignan et al. (1985) report that DOCconcentrations in porewater isolated by centrifugation werehigher and more variable than in samples obtained by dialysis.
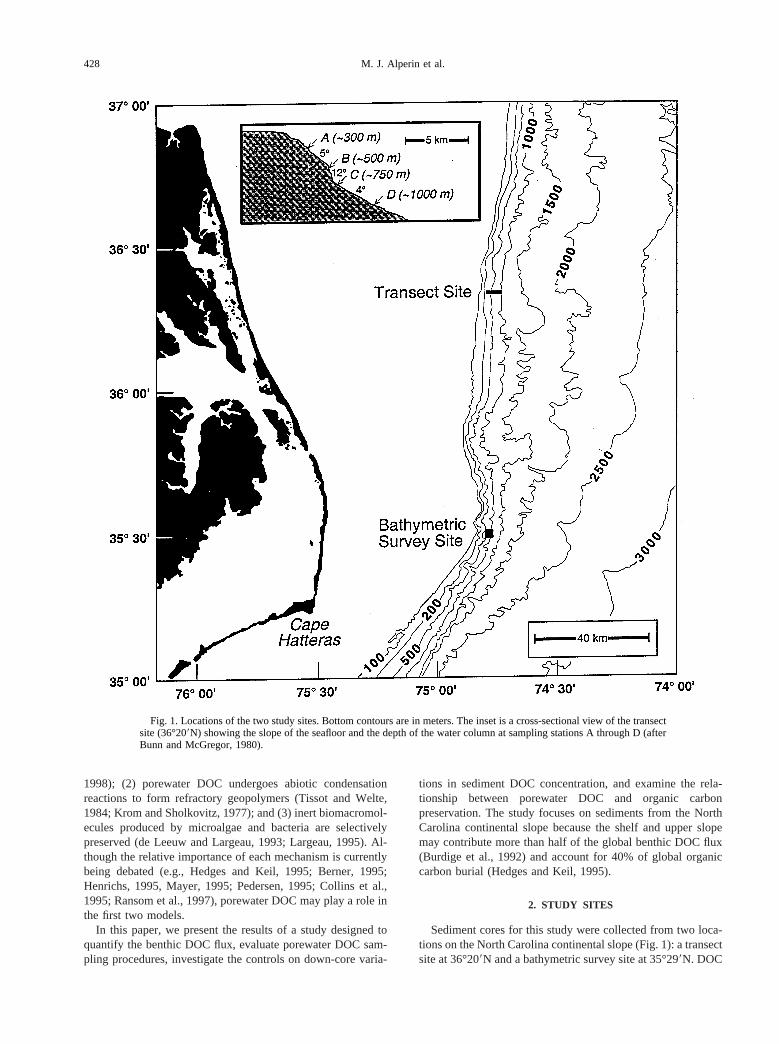
A comparison of centrifugation and sipping methods forobtaining DOC samples from continental slope sediments issummarized in Fig. 2. The top-left panel illustrates small-scalehorizontal variability in porewater extracted by sipping. Withthe exception of three points, DOC concentration profiles fromtriplicate cores are smooth and show no consistent differences.The other three panels illustrate the effect of extraction method
430 M. J. Alperin et al.
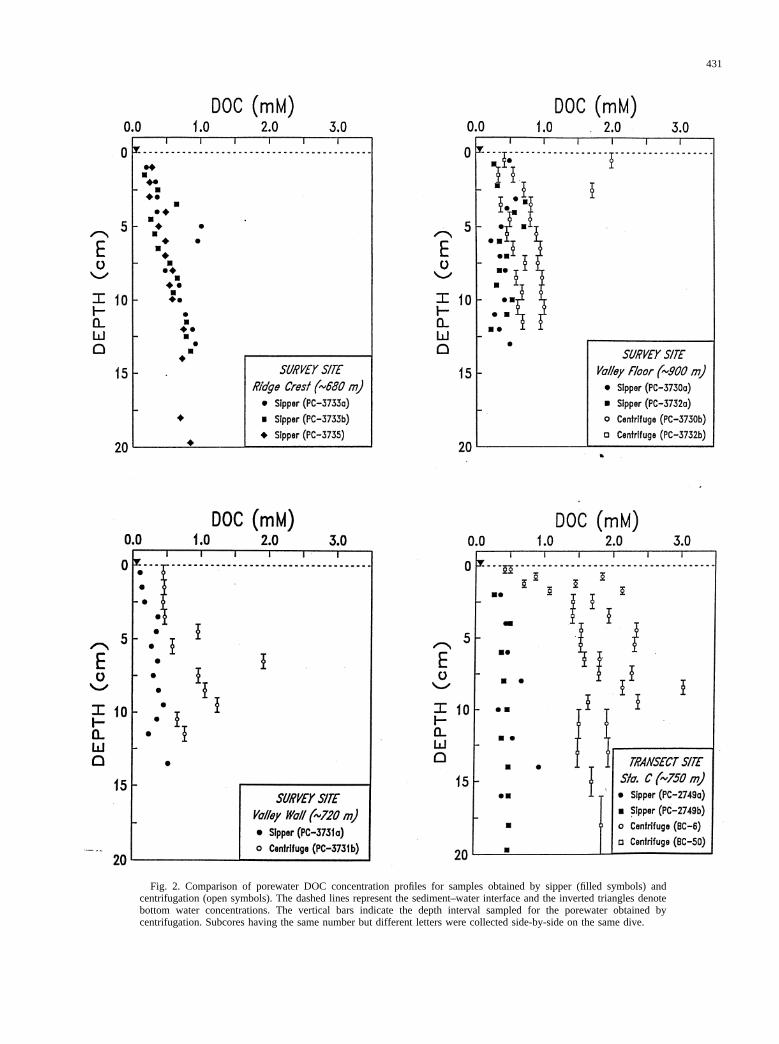
Fig. 2. Comparison of porewater DOC concentration profiles for samples obtained by sipper (filled symbols) andcentrifugation (open symbols). The dashed lines represent the sediment–water interface and the inverted triangles denotebottom water concentrations. The vertical bars indicate the depth interval sampled for the porewater obtained bycentrifugation. Subcores having the same number but different letters were collected side-by-side on the same dive.
431

on DOC. Concentrations in porewater obtained by centrifuga-tion are consistently higher and more variable than in porewaterobtained by sipping. The effect of extraction method is mostpronounced at the transect site (Sta. C,;750 m) where centri-fuged samples from the upper 20 cm have fourfold higher DOCconcentrations than sipper samples.
The difference between the two extraction methods could beattributable to a temperature artifact. Although the sippingoperation was conducted in a cold room at constant temperature(7°C), the centrifuged samples gradually warmed as the tem-perature of the rotor head increased during spinning. The effectof warming on DOC concentration was tested by placing sed-iment at room temperature for 60 min and monitoring DOC inporewater extracted by sipper. Results of the warming experi-ment (Table 1) are consistent with a previous study (Martin andMcCorkle, 1993) showing that a short-term increase in sedi-ment temperature has minimal effect on DOC concentration.
Alternatively, high DOC concentrations in centrifuged sam-ples could be due to the rupturing of organisms and the sub-sequent release of dissolved organic matter. This artifact wouldbe particularly acute in sediments with a high density of benthicfauna. To assess the magnitude of the DOC contribution fromrupture of macrofauna, individual polychaete worms wereplaced in centrifuge tubes with bottom water and spun asdescribed above. The resultant solutions were highly enrichedin DOC (Table 2). The experiment clearly shows that centri-
fuging sediment containing macrofauna could lead to artifi-cially high DOC concentrations. The magnitude of the artifactwill depend on the number and size of the fauna as well as thelocation of organisms in the centrifuge tube. Worms at thebottom of the tube are less likely to contribute DOC to thesupernatant than those near the top of the sediment pellet.
4.2. Profiles From the 36°20*N Transect
Sediment profiles of DOC from the transect site are shown inFig. 3. All porewater samples were obtained by centrifugation.DOC concentrations in the upper centimeter of sediment (0.5–2mM) are an order of magnitude higher than the bottom water(50–60mM), suggesting a substantial flux of DOC across thesediment–water interface. However, the large concentrationgradient may be an artifact; DOC samples obtained by centri-fuging macrofauna-rich surface sediment are likely to be con-taminated by ruptured organisms (Table 2). At Sta. C (;750m), the average DOC concentration gradient in the upper 2 cmfor centrifuged samples is nearly an order of magnitude greaterthan for sipper samples (Fig. 2). Hence, calculated benthicfluxes based on DOC concentrations in porewater obtained bycentrifuging are likely to be upper limits.
Subsurface maxima (.2 mM) in DOC concentration at 5–10cm are visible at all four stations (Fig. 3). The fact that suchpeaks are absent from sipper samples (Fig. 2) suggests anartifact associated with centrifuging sediment containing mac-rofauna. Although the greatest number of benthic organisms inslope sediments are generally found in the upper 2 cm (Schaffet al., 1992; Schaff and Levin, 1994), some species—in partic-ular the larger animals—are known to concentrate below thesurface to reduce the threat of predation (McCall and Tevesz,1982) or possibly as a response to sediment coring and pro-cessing (Blake, 1994).
Contamination from ruptured macrofauna is likely to dimin-ish with increasing depth in the sediment. Although we haveobserved deep-burrowing worms in North Carolina continentalslope sediments at 180 cm, macrofaunal densities generally falloff rapidly below 15 cm (Schaff et al. 1992; Schaff and Levin1994; Blake, 1994) presumably attributable to the high ener-getic cost of burrowing to greater depths (Jumars and Wheat-croft, 1989). For the following discussion, we assume thatcentrifuged porewater from sediment depths greater than 25 cmhas not been compromised by the release of intra-organismalDOC.
DOC profiles from the transect site show a clear trend withwater column depth (Fig. 3). The deep (.25 cm) portion of theprofile from Sta. A has constant concentrations that average1.4 6 0.1 mM. At Sta. B, DOC increases gradually from 1.1mM (50 cm) to 1.8 mM (225 cm). DOC concentrations below25 cm at Sta. C increase continuously, reaching 4.7 mM at 225cm. The profile from Sta. D is similar to Sta. A, with littlegradient below 125 cm and an average DOC concentration of1.5 6 0.1 mM.
A comparable trend is apparent in porewaterSCO2 profilesfrom the transect site (Fig. 4). There is little increase in con-centration with sediment depth at Sta. A, a modest increase atSta. B, a large increase at Sta. C, and a very slight increase atSta. D. Note that this trend is visible in samples from box coresas well as Kasten cores. BecauseSCO2 is the end product of
Table 1. Effect of sediment warming on porewater DOC concentra-tion.*
SampleTime(min)
Temperature(°C)
DOC(mM)†
Control (initial) 0 7 0.306 0.07Control (final) 60 7 0.256 0.03Treatment (initial) 0 7 0.346 0.06Treatment (final) 60 20‡ 0.406 0.02
* Porewater was extracted by sipper from the 0 to 5-cm interval ofa core collected from the ridge top at the submersible site. The intervalwas split into two fractions to provide control and treatment samples.The control was kept in the cold room; the treatment sediment wasplaced at room temperature for 60 min after the initial porewatersample was collected.
† Error intervals represent the standard deviation of duplicate pore-water samples.
‡ Sediment temperature increased logarithmically (7–20°C) duringthe 60 min that sample was not in the cold room.
Table 2. Release of DOC by centrifuging a polychaete worm.*
Sample DOC (mM)†
Bottom water control-1 0.106 0.01Bottom water control-2 0.216 0.02Bottom water plus worm-1 1.026 0.01Bottom water plus worm-2 4.226 0.08
* Centrifuge tubes were filled with 30 mL of bottom water and spunat 5000g for 15 min. Worms were collected from a core taken at thetransect site (BC-50) and were alive at the start of the experiment.Worm-1 was a 2-cm long gravid scale-worm; worm-2 was a lum-brenerid polychaete of comparable size.
† Error intervals represent analytical uncertainty based on the stan-dard deviation of triplicate analyses.
432 M. J. Alperin et al.

Fig. 3. Depth distributions of DOC from stations at the 36°209N transect site. All porewater samples were obtained bycentrifugation. The dashed lines represent the sediment-water interface and the inverted triangles denote bottom waterconcentrations.
433

Fig. 4. Depth distributions ofSCO2 from stations at the 36°209N transect site. The dashed lines represent thesediment–water interface and the inverted triangles denote bottom water concentrations.
434 M. J. Alperin et al.

organic matter degradation, the high concentrations observed atSta. C suggest that significant decomposition occurs within thesediment column.
The pattern for SO422 profiles (Fig. 5) generally mirrors that
of SCO2. Sulfate depletion is modest except at Sta. C, whereconcentrations approach 7 mM at 225 cm. Although the SO4
22
profile indicates that sulfate reduction is active at Sta. C, theratio of SCO2 accumulation (23.2–2.25 21.0 mM) to SO4
22
depletion (27.7–7.35 20.4 mM) is only;1, well below thevalue of 2 expected for organic matter remineralization bysulfate reducing bacteria. This suggests that carbonate precip-itation may be occurring within these sediments. PorewaterCa21 concentrations were not determined at the transect site,but a Kasten core taken in the general vicinity (35°259N, ;500m) reveals a decline in porewater Ca21 from 10 mM at thesurface to 2 mM at 225 cm (Mark Green, personal communi-cation), consistent with precipitation of calcium carbonate.
Sediment inventories of239,240Pu (total quantity per m2 ofseafloor) at Stations A, B, and C (Fig. 6) exceed direct atmo-spheric deposition (89 Bqz m22; Benninger and Wells, 1993),suggesting that accumulation of fine-grained particles is fo-cused at these sites. The large inventory at Sta. C (2.4 timesatmospheric input) is consistent with enhanced deposition offines at the base of the slide headwall (Fig. 1 inset). Sedimen-tation rates at water column depths of 300 to 750 m arecomparable (100 to 125 cmz kyr21), but decline precipitouslyat greater depth (10 cmz kyr21 at 1000 m). The poor correlationbetween239,240Pu inventory and sedimentation rate may beattributable to a greater portion of coarse-grained, low-Pu par-ticles in the material deposited at the shallower stations (seesurface area data below). Bioturbation coefficients (DB) andmixed layer depths (xML) range from 0.55 to 1.25 cm2 z yr21
and 11 to 25 cm, respectively, and show no consistent patternwith water depth. However, the bioturbation intensity—definedhere as the depth-integrated bioturbation coefficient (the prod-uct of DB and xML)—follows a trend consistent with the pore-water constituents (cf. Fig. 9c and Figs. 3 to 5): Sta. C..Sta. B . Sta. D ' Sta. A. Variations in the bioturbationintensity along the 36° 209 N transect may reflect differences inthe food supply (i.e., flux of organic carbon to the sediment;Smith, 1992).
Profiles of sediment organic carbon and specific surface areaare shown in Fig. 7. Organic carbon concentrations in surfacesediments (0–2 cm) increase monotonically with water columndepth between 300 and 1000 m: 1.26 0.1% (Sta. A), 1.860.2% (Sta. B), 2.86 0.2% (Sta. C), and 3.16 0.1% (Sta. D).A similar trend was reported by Anderson et al. (1994) for twoMid-Atlantic Bight sites located 60 and 140 km north of ourtransect. Organic carbon concentrations are generally higher atthe sediment surface than at depth, but the downcore profileshave a complex shape.
Average sediment surface areas increase with water depthalong the 36°209N transect: 4.56 0.5 m2 z g21 (Sta. A), 9.462.1 m2 z g21 (Sta. B), 14.66 1.2 m2 z g21 (Sta. C), and 17.461.0 m2 z g21 (Sta. D). This trend reflects a decrease in grain sizewith increasing distance from the shelf. Depth distributions ofsediment surface area and organic carbon concentration trackone another, consistent with the hypothesis that surface areaprovides a major control on sediment organic carbon content
(Mayer, 1993, 1994a,b; Keil et al., 1994; Hedges and Keil,1995).
4.3. DOC Benthic Flux
Results of in situ DOC benthic flux measurements are shownin Fig. 8a. Because there are no apparent differences betweensites, results from the three lander deployments are treated as asingle data set. DOC concentrations in chamber water did notincrease significantly during the 1 to 1.5-day deployments(slope of line fit to DOC versus time data is 0.256 0.34mM zh21 [95% confidence interval]), indicating that the magnitudeof the benthic flux is below the detection limit. The averageDOC concentration in the chamber (706 7 mM) is slightlyhigher than bottom water (626 3 mM), perhaps due to con-tamination from Tygon tubing that connects the chamber tosample storage ampoules.
Results of shipboard flux measurements at the transect site(Stations B and C) are shown in Fig. 8b. Although thesemeasurements are prone to artifacts caused by sediment distur-bance during core retrieval, they allow for longer incubationtimes than are practical with the in situ chamber and henceprovide greater sensitivity. The slope of the line fit to the DOCvs. time data (2.26 1.9mM z d21) is statistically different fromzero (P 5 0.05) and provides a constraint on the magnitude ofthe benthic flux: 0.0766 0.066 mmol Cz m22 z d21. They-intercept (906 9 mM) is considerably elevated above theDOC concentration in the bottom water, suggesting that pore-water DOC was released to the overlying water during coringor while inserting the benthic chamber into the sediment.
For comparison, the diffusive flux of DOC from sediment(Jo) at transect site Sta. C can be calculated from Fick’s FirstLaw:
J0 5 woD*DOC FDDOC
Dx G ,
wherewo is the porosity of surficial sediment (0.86), D*DOC isthe sediment diffusion coefficient for DOC, andDDOC/Dx isthe DOC concentration gradient between porewater at a depthof 2.0 cm (collected by sipper) and bottom water (Fig. 2,Transect Site [750 m]). The free-solution diffusion coefficientfor DOC (DDOC) at in situ temperature and salinity (0.106 0.02 cm2 z d21) was estimated from the Stokes-Einsteinequation assuming an average molecular weight for DOC of5000 (650%) daltons (Alperin et al., 1994; Burdige and Gard-ner, 1998). Uncertainty in the molecular weight has relativelylittle effect on the calculated flux because of the inverse-cuberoot relationship between DDOC and molecular weight (Cornelet al., 1986). The sediment diffusion coefficient was calculatedusing a tortuosity estimated from the modified Weissberg re-lation (Boudreau, 1997).
The calculated diffusive flux (0.0846 0.035 mmol Cz m22 zd21) is remarkably similar to the measured flux (0.0766 0.066mmol C z m22 z d21). Given the large uncertainty in themeasured value, this excellent agreement may be fortuitous.Nevertheless, the consistency suggests that rapid DOC con-sumption in the benthic boundary layer is not required toreconcile porewater concentration profiles and measured fluxes.
435
Fig. 5. Depth distributions of SO422 from stations at the 36°209N transect site. The dashed lines represent the
sediment–water interface and the inverted triangles denote bottom water concentrations.
436 M. J. Alperin et al.

Fig. 6. Depth distributions of fallout239,240Pu from stations at the 36°209N transect site. The horizontal bars indicate thecounting error (6 1s) and the vertical bars indicate the depth interval sampled. “SPu” denotes the sediment inventory of239,240Pu. The solid curves represent239,240Pu profiles simulated by a one-dimensional, time-dependent diagenetic model;the predicted mixed-layer depth (dashed line), bioturbation coefficient (DB) and sediment accumulation rate (v) are givenfor each station.
437

Fig. 7. Depth distributions of organic carbon (closed circles) and specific surface area (open circles) from stations at the36°209N transect site.
438 M. J. Alperin et al.

Fig. 8. DOC concentrations as a function of time for (a) in situ and (b) shipboard benthic flux experiments. Note that thetwo plots have different concentration and time scales. The dashed lines denote the start of the incubation and the trianglesmark the DOC concentration in the bottom water. The vertical bars represent uncertainty in the concentrations based oninstrumental precision and variability in the procedural blanks. Absence of an error bar indicates that the standard deviationis comparable to the size of the symbol. For the in situ flux chamber, the increase in DOC concentration with time is notstatistically significant. The shipboard chambers did show a very slight increase with time; the solid line represents aleast-squares linear fit to the data (all points given equal weight).
439

There is a paucity of published measurements with which tocompare our DOC benthic flux. Hulth et al. (1997) report fluxesranging from21 to 3 mmol Cz m22 z d21 for the southernWeddell Sea at water depths of 280 to 2514 m (a negative fluxdenotes net DOC transport from the bottom water to the sedi-ment). Burdige et al. (1999) measured DOC fluxes of 0.1 to 2mmol C z m22 z d21 for the California continental margin(water depths ranging from 95 to 3700 m). The few otherpublished studies report values in the range of 0.3 to 10 mmolC z m22 z d21, but these are all from shallow (#20 m),organic-rich environments such as Chesapeake Bay, VA (Bur-dige and Homstead, 1994), Cape Lookout Bight, NC (Alperinet al., 1994), and a marine fish farm in Gullmar Fjord, Sweden(Hall et al., 1990).
5. DISCUSSION
5.1. Controls on Porewater DOC Concentrations
Porewater DOC concentrations reflect a balance betweenproduction and consumption reactions; dissolved compoundsproduced by hydrolysis of solid-phase organic matter are con-sumed by biotic and abiotic processes. We expect that observedvariations in DOC depth profiles at the transect site (Fig. 3) arelargely the result of differences in net DOC production rates.Although profiles from all four stations approach asymptoticvalues at depth, the magnitude of the asymptote varies bynearly a factor of four. In this section, we develop a simpletheoretical model to elucidate some factors that may be respon-sible for these differences in asymptotic DOC concentrations.
The steady-state depth distribution of DOC can be describedby the following diagenetic equation and boundary conditions:
D*DOC
d2@DOC#
dx2 1 (PDOC 5 0
@DOC# 5 @DOC#BW at x 5 0
d@DOC#
dx5 0 atx 5 `, (1)
where [DOC] is the concentration of DOC,x is depth below thesediment surface,SPDOC is the depth-dependent net DOCproduction rate, andBW indicates bottom water. To keep theequation simple, sedimentation and compaction have been ne-glected. Ignoring sediment accumulation is justified by thePeclet number (Pe, 1), which indicates that advection rates insediments from the transect site are small relative to diffusionover the diffusion-reaction length scale (Boudreau, 1997).Likewise, compaction is ignored because its influence is fo-cused on the uppermost portion of the sediment column (,25cm) while the model is primarily concerned with predictingporewater concentrations in deeper sediments ($100 cm). Wehave omitted a term for bioirrigation in eq. [1] because we haveno information on pore fluid exchange rates at the transect site.Because irrigation may be an important mass transfer processin upper slope sediments, results of the model must be viewedas qualitative. Assuming steady state and negligible advectionimplies that the DOC profile is unaffected by equilibriumadsorption (Berner, 1976).
The rate law defining the kinetics of net DOC production isunknown. However, Alperin et al. (1994) used an inverse
model to calculate net DOC production rates for sedimentsfrom Cape Lookout Bight, NC, where organic matter reminer-alization is dominated by sulfate reduction. They found thatdown-core and seasonal variations inSPDOC generally parallelsulfate reduction rates, suggesting that net DOC production inanoxic sediments is roughly proportional to gross organic mat-ter remineralization. Because remineralization is usually mostrapid at the sediment surface and slows with depth, we assumethat the depth dependence of net DOC production below thesurface oxic layer (6–13 mm; unpublished microelectrode data)can be described by an exponential function:
SPDOC 5 SPDOCo z exp ~ 2 ax!, (2)
whereSPDOCo is the net DOC production rate at the sediment–
water interface anda is the depth-attenuation coefficient. Sub-stituting eq. [2] into [1] and solving yields:
@DOC# 5SPDOC
o
a2D*DOC@1 2 exp ~ 2 ax!# 1 @DOC#BW. (3)
Integrating eq. [2] gives the depth-integrated net DOC produc-tion rate (*SPDOC):
E0
`
SPDOC dx 5SPDOC
o
a. (4)
Therefore, the asymptotic DOC concentration ([DOC]`) is:
@DOC#` 5*SPDOC z z*DOC
D*DOC1 @DOC#BW, (5)
wherez*DOC ( 5 1/a) is the e-folding depth for the net DOCproduction rate. Because [DOC]` ..[DOC]BW for sedimentsfrom the transect site (Fig. 3):
@DOC#` <*SPDOC z z*DOC
D*DOC. (6)
Equation [6] shows that the magnitude of the asymptotic DOCconcentration is controlled by two primary factors: the depth-integrated net DOC production rate and the attenuation of netDOC production with depth. If we can assume thatSPDOC isproportional to the carbon remineralization rate, then*SPDOC
must be proportional to depth-integrated remineralization (*RG).Likewise, the depth-attenuation of net DOC production andorganic matter remineralization should be comparable. Thus,
@DOC#` }* RG z z*G, (7)
wherez*G is the e-folding depth for organic matter remineral-ization. This simple model predicts that asymptotic DOC con-centrations will be highest at sites that have the greatest organicmatter remineralization (on an areal basis) and at which theremineralization occurs deepest in the sediment.
Here, we will test eq. [7] for sediments from the transect site.The depth-integrated remineralization rate at each station canbe constrained by calculating the flux ofSCO2 that diffusesfrom the sediments to the overlying water:
*RG < woD*HCO3 FDSCO2
Dx Go
, (8)
440 M. J. Alperin et al.

where D*HCO3is the sediment diffusion coefficient for bicar-
bonate ion (the molecular diffusion coefficient [Li and Gregory,1974] corrected for tortuosity according the modified Weiss-berg relation [Boudreau, 1997]) and [DSCO2/Dx]o is the con-centration gradient between porewater at a depth of 0.25 cmand bottom water (Fig. 4). The benthicSCO2 flux calculatedthis way represents a lower limit as it ignores bioirrigation andremineralization at the sediment surface. Furthermore, benthicSCO2 fluxes may over- or underestimate total organic matterremineralization because of calcium carbonate dissolution innear-surface sediments or precipitation at depth. Despite thesecaveats,*RG at Sta. C estimated from eq. [8] (4.76 0.04 mmolC z m22 z d21) is consistent with sediment carbon oxidationbased on the in situ O2 flux plus sulfur burial flux (4.66 1.8mmol C z m22 z d21; unpublished data). (In situ benthic fluxdata are not available for Stations A, B, and D.) In addition,integrated remineralization at Sta. D (3.4 mmol Cz m22 z d21)is in excellent agreement with that for sediments at the samewater column depth from a site located 60 km to the north (3.38mmol C z m22 z d21; Anderson et al., 1994). The latter valuesare based on sediment traps and14C-derived sedimentationrates, and hence are unaffected by processes that could biascalculated and measured benthic fluxes.
Depth-integrated remineralization rates estimated from thediffusive flux of SCO2 appear to be relatively uniform forsediments from the four coring stations (Fig. 9a). A similarconclusion is reached by comparing benthic O2 fluxes deter-mined by shipboard incubations of cores collected at stations B,C, and D (unpublished data); the variation between replicatesamples from a single station is greater than the variationbetween stations. The consistency in the depth-integrated remi-neralization rate is at first surprising given the seafloor mor-phology at the transect site (Fig. 1 inset). Anderson et al. (1994)suggest that up to 80% of the organic carbon deposited on theupper slope of the Middle Atlantic Bight is derived from lateraltransport of resuspended shelf sediments. If downslope trans-port is important at the transect site, the abrupt change inbottom slope (12° to 4°) at 700 m should promote organicmatter deposition in the vicinity of Sta. C. One might expectthat enhanced carbon deposition at Sta. C would lead to higherremineralization rates. However, Blair et al. (1994) have shownthat theSCO2 diffusive flux varies by only a factor of two(2.2–4.7 mmol Cz m22 z d21) for three sites on the NorthCarolina continental slope where deposition of organic carbonvaries by a factor of 20 (2.3–39 mmol Cz m22 z d21; DeMasteret al., 1994). Although the diffusive fluxes reported in Blair etal. (1994) do not include bioirrigation and hence underestimatetheSCO2 benthic flux, integrated remineralization rates in thisregion appear to be relatively insensitive to the depositionalflux of organic carbon (i.e., the relationship between depositionand remineralization is attenuated and nonlinear).
The e-fold depth for organic matter remineralization (z*G) ateach station can be roughly constrained from estimates of theasymptoticSCO2 concentration ([SCO2]`, estimated as thehighest concentration at depth) and the integrated remineral-ization rate. This can be shown by analogy with eq. [5]:
z*G 5~@SCO2#` 2 @SCO2#BW! D*HCO3
*RG, (9)
where [SCO2]BW is the bottom waterSCO2 concentration(2.24 6 0.04 mM). The e-fold depth calculated in this wayrepresents a lower limit as carbonate precipitation and bioirri-gation may decrease the value of [SCO2]`. The depth of theactive remineralization zone (defined as depth at which remi-neralization is 95% complete or 3z z*G) varies dramatically forstations along the 36° 209 N transect (Fig. 9b). At Sta. A, whereaccumulation of porewaterSCO2 is minimal (Fig. 4), organicmatter remineralization appears to be concentrated near thesediment–water interface. In contrast, remineralization contin-ues to;50 cm at Sta. C where the asymptoticSCO2 concen-tration exceeds 20 mM (Fig. 4). Anderson et al. (1994) con-clude that “most of the [organic matter] remineralization inslope sediments . . . takes place within a few mm of thesediment–water interface.” This conclusion clearly cannot bethe case for all slope sediments; subsurface remineralization isthe only plausible mechanism to account for the highSCO2
concentrations (Fig. 4) and extensive SO422 depletion (Fig. 5)
observed at Sta. C.It is not immediately clear why z*G varies so widely for the
four transect stations (Fig. 9b). Depth attenuation of organicmatter remineralization will depend on organic matter reactiv-ity, sediment accumulation rate, sediment mixing rate, anddepth of the mixed layer. There is no reason to expect majordifferences in the reactivity of organic matter deposited alongthe 36°209N transect. Average values of sedimentd13C andC:N ratios for the four stations are invariant (221.16 0.13‰and 8.56 0.4, respectively; unpublished data), suggesting asimilar source of organic matter throughout the region. Like-wise, differences in sediment accumulation rates (Fig. 6) can-not account for the dramatic variations in z*G. However, bio-turbation intensity at Sta. C is threefold higher than adjacentareas (Fig. 9c), indicating more rapid and deeper mixing ofrecently deposited sediment. In situ tracer experiments using13C-labeled algae (Blair et al., 1996; Levin et al., 1997) clearlyshow that rapid biological mixing of surficial slope sedimentshas a profound impact on the depth distribution of organicmatter remineralization.
Predicted relative values of asymptotic DOC concentrationsare shown in Fig. 9d. Because eq. [7] expresses a proportion-ality, only the relative concentrations—not the magnitudes—are significant. The simple model predicts the following trendfor [DOC]` at the transect site:
Sta. C.. Sta. B. Sta. D. Sta. A.
Measured DOC concentration profiles (Fig. 3) conform reason-ably well to the predicted trend: the product*RG z z*G is closelycorrelated with maximal measured concentrations (r2 5 0.96).Thus, the model is generally successful at predicting qualitativevariations in asymptotic DOC concentrations for sedimentsfrom the 36°209N transect. The main factor responsible fordifferences in [DOC] at this site appears to be the depth of theactive remineralization zone. This, in turn, is largely controlledby the intensity of biological mixing.
5.2. Porewater DOC and Organic Carbon Preservation
Three models are commonly invoked to explain why organicmatter is preserved in marine sediments. Theselective preser-vation model (Hatcher and Spiker, 1988; de Leeuw and
441

Largeau, 1993; Largeau, 1995) argues that refractory organicmatter is largely composed of recalcitrant biomolecules thatresist diagenetic alteration. Thegeopolymerization model(Nis-senbaum and Kaplan, 1972; Krom and Sholkovitz, 1977; Tissotand Welte, 1984; Hedges, 1988) suggests that abiotic conden-sation of low molecular weight dissolved organic compounds isone mechanism for forming refractory organic matter. Thesorptive preservation model(Mayer, 1993, 1994a,b; Keil et al.,1994; Hedges and Keil, 1995) argues that refractory organicmatter forms when partially degraded, soluble organic com-
pounds become adsorbed to mineral surfaces. All three modelsare likely to operate to some extent in preserving organicmatter, and their relative importance is likely to vary from siteto site (Henrichs, 1992; Mayer, 1994b; Collins et al., 1995;Hedges and Keil, 1995).
The geopolymerization and sorptive preservation modelssuggest a possible link between porewater DOC and organiccarbon preservation. For example, if geopolymerization reac-tions are promoted by high concentrations of dissolved organicprecursors, we might expect to see enhanced preservation in
Fig. 9. Summary of sediment properties for stations at the 36°209N transect site. (a) Depth-integrated remineralizationrates (*RG) estimated by calculating the benthic flux ofSCO2 (eq. [8]). The stars indicate independent estimates of*RG
based on the in situ O2 flux plus sulfur burial rate (Sta. C; unpublished data) or sediment trap flux and14C-burial rate fora nearby site at the same water depth (Sta. D; Anderson et al., 1994). (b) Depths of the active remineralization zone (3zz*G) calculated from asymptoticSCO2 concentrations (Fig. 4) and*RG (eq. [9]). (c) Bioturbation intensity calculated fromthe product of the bioturbation coefficient (DB) and the mixed layer depth (Fig. 6). (d) Predicted relative values of theasymptotic DOC concentration (eq. [7]).
442 M. J. Alperin et al.
sediments with elevated DOC. Likewise, if some of the sorbedorganic matter is reversibly bound, we might expect to findgreater organic carbon loading and enhanced preservation insediments with elevated DOC (Henrichs, 1995; Hedges andKeil, 1995). In this section, we look for evidence that organiccarbon preservation in sediments from the North Carolinacontinental slope is influenced by the concentration of DOC inthe porewater.
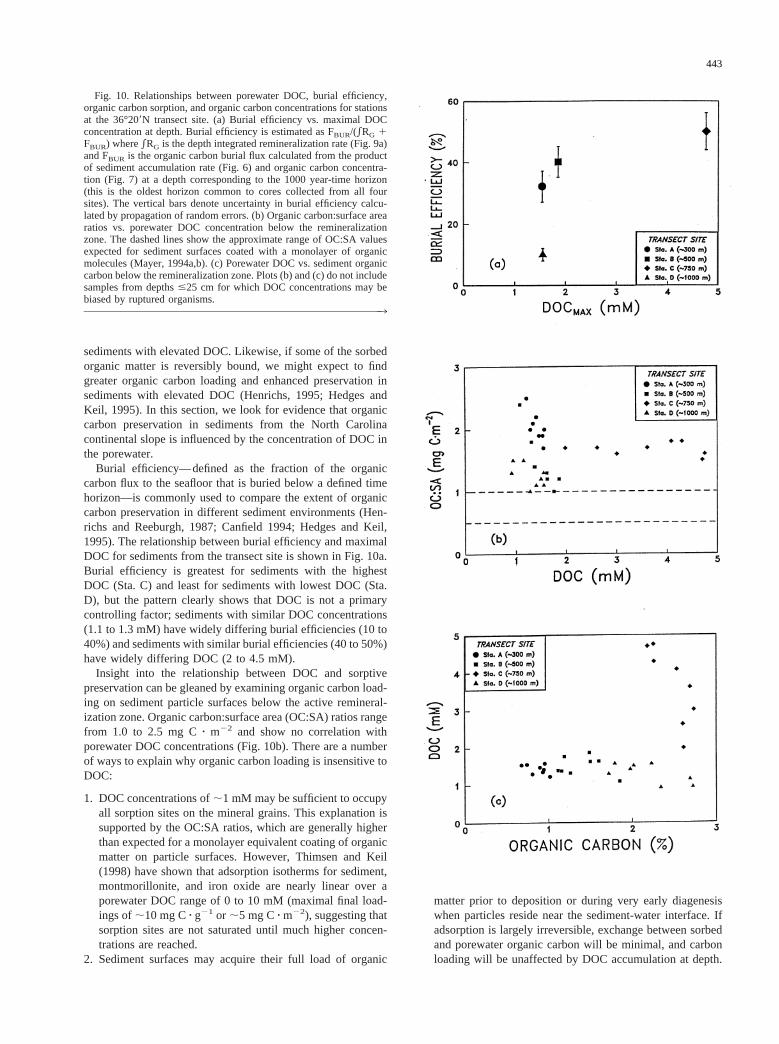
Burial efficiency—defined as the fraction of the organiccarbon flux to the seafloor that is buried below a defined timehorizon—is commonly used to compare the extent of organiccarbon preservation in different sediment environments (Hen-richs and Reeburgh, 1987; Canfield 1994; Hedges and Keil,1995). The relationship between burial efficiency and maximalDOC for sediments from the transect site is shown in Fig. 10a.Burial efficiency is greatest for sediments with the highestDOC (Sta. C) and least for sediments with lowest DOC (Sta.D), but the pattern clearly shows that DOC is not a primarycontrolling factor; sediments with similar DOC concentrations(1.1 to 1.3 mM) have widely differing burial efficiencies (10 to40%) and sediments with similar burial efficiencies (40 to 50%)have widely differing DOC (2 to 4.5 mM).
Insight into the relationship between DOC and sorptivepreservation can be gleaned by examining organic carbon load-ing on sediment particle surfaces below the active remineral-ization zone. Organic carbon:surface area (OC:SA) ratios rangefrom 1.0 to 2.5 mg Cz m22 and show no correlation withporewater DOC concentrations (Fig. 10b). There are a numberof ways to explain why organic carbon loading is insensitive toDOC:
1. DOC concentrations of;1 mM may be sufficient to occupyall sorption sites on the mineral grains. This explanation issupported by the OC:SA ratios, which are generally higherthan expected for a monolayer equivalent coating of organicmatter on particle surfaces. However, Thimsen and Keil(1998) have shown that adsorption isotherms for sediment,montmorillonite, and iron oxide are nearly linear over aporewater DOC range of 0 to 10 mM (maximal final load-ings of;10 mg Cz g21 or ;5 mg Cz m22), suggesting thatsorption sites are not saturated until much higher concen-trations are reached.
2. Sediment surfaces may acquire their full load of organic
matter prior to deposition or during very early diagenesiswhen particles reside near the sediment-water interface. Ifadsorption is largely irreversible, exchange between sorbedand porewater organic carbon will be minimal, and carbonloading will be unaffected by DOC accumulation at depth.
Fig. 10. Relationships between porewater DOC, burial efficiency,organic carbon sorption, and organic carbon concentrations for stationsat the 36°209N transect site. (a) Burial efficiency vs. maximal DOCconcentration at depth. Burial efficiency is estimated as FBUR/(*RG 1FBUR) where*RG is the depth integrated remineralization rate (Fig. 9a)and FBUR is the organic carbon burial flux calculated from the productof sediment accumulation rate (Fig. 6) and organic carbon concentra-tion (Fig. 7) at a depth corresponding to the 1000 year-time horizon(this is the oldest horizon common to cores collected from all foursites). The vertical bars denote uncertainty in burial efficiency calcu-lated by propagation of random errors. (b) Organic carbon:surface arearatios vs. porewater DOC concentration below the remineralizationzone. The dashed lines show the approximate range of OC:SA valuesexpected for sediment surfaces coated with a monolayer of organicmolecules (Mayer, 1994a,b). (c) Porewater DOC vs. sediment organiccarbon below the remineralization zone. Plots (b) and (c) do not includesamples from depths#25 cm for which DOC concentrations may bebiased by ruptured organisms.™™™™™™™™™™™™™™™™™™™™™™™™™™™™™™™™™™™™™™™™™™™™™™™™™™™™™™™™3
443

However, Keil et al. (1994) found that organic matter israpidly desorbed from sediment surfaces by repetitive wash-ing with mild solutions. This suggests that some portion ofthe sorbed organic matter pool is reversibly bound.
3. Biopolymer degradation produces a complex, heteroge-neous mixture of soluble organic molecules with varyingaffinities for particle surfaces. Porewater and sorbed poolsobviously fractionate compounds according to their adsorp-tivity: the sorbed pool should be enriched in surface activecompounds compared to the porewater. If the production ofstrongly and weakly sorbed compounds are not coupled, thequantity of sorbed and dissolved organic carbon may notco-vary.
Perhaps the most perplexing observation pertaining to or-ganic matter sorption is the poor correlation between porewaterDOC and sediment organic carbon (Fig. 10c). Keil et al. (1994)found that up to 15% of the organic matter sorbed onto Wash-ington continental slope sediments could be solubilized byrinsing with organic-free seawater (as reported by Mayer,1995). If a similar fraction of sorbed organic matter is easilydesorbed from North Carolina slope sediments, the pool ofexchangeable organic carbon is;160 mM (assuming an or-ganic carbon content of 2%, porosity of 0.8, and particledensity of 2.5 gz cm23). This enormous pool—roughly 80times larger than the DOC pool—should buffer DOC concen-trations and provide the dominant control on DOC depth pro-files (Thimsen and Keil, 1998). The fact that DOC concentra-tions vary independently of organic C content suggests thatdynamic sorption equilibrium is not the dominant controllingfactor for DOC in sediments from this site.
Thus, the relationship between porewater DOC, burial effi-ciency, and organic matter sorption is equivocal. Nevertheless,data from North Carolina continental slope sediments clearlyshow that (1) elevated porewater DOC concentrations are not amajor factor in promoting organic carbon preservation; (2)organic carbon loading on grain surfaces does not appear to bestrongly affected by the amount of DOC in the porewater; and(3) DOC concentrations are not buffered by a large pool ofexchangeable, sorbed organic matter.
5.3. Significance of the DOC Benthic Flux
The upward flux of DOC across the sediment-water interfacerepresents a transfer of organic carbon from the sediment to thewater column (Bauer et al., 1995). Jahnke (1996) has shown,using mass balance constraints, that the quantity of DOC re-leased from sediments at ocean depths greater than 1000 mmust be substantially less than total sediment organic matterremineralization. Direct measurements of the DOC benthic flux(0.0766 0.066 mmol Cz m22 z d21) and the sediment carbonremineralization rate (4.66 1.8 mmol Cz m22 z d21, based onin situ O2 flux plus sulfur burial; unpublished data) at Sta. Cshow that continental slope sediments at depths less than1000 m also release minimal organic carbon to the bottomwater; the benthic DOC flux is less than 2% of the total organiccarbon remineralization.
Literature values of measured DOC benthic flux are plottedagainst depth-integrated sediment remineralization rate in Fig.11. Although the data base is limited, the DOC flux appears to
increase linearly with sediment remineralization for a widevariety of ocean margin environments. Mass balance dictatesthat at steady-state, the depth-integrated net DOC productionrate must equal the DOC benthic flux (ignoring advectivefluxes). Thus, the linear correlation between DOC flux and*RG
supports the assumption that net DOC production rates areproportional to overall sediment remineralization. The slope ofthe regression (1.66 0.2%) suggests that high retention ofdissolved organic matter is a common property of marinesediments.
The relatively constant ratio of DOC flux to sediment carbonremineralization provides a constraint on the global benthicDOC flux. Middelburg et al. (1997) estimate that global sedi-ment organic carbon remineralization at ocean depths less than2000 m is 2560 Tg Cz yr21. Applying the Flux:*RG ratio of1.6% (Fig. 11), we estimate a benthic DOC flux for depths#2000 m of 40 Tg Cz yr21, within the range predicted byBurdige et al. (1992) (10–90 Tg Cz yr21) and equivalent toabout 20% of the global riverine discharge of DOC to the ocean(200 Tg C z yr21; Meybeck, 1982). Because 80–90% of theremineralization in marine sediments occurs along the oceanmargin (Middelburg et al., 1997), the contribution of abyssalsediments to the global DOC benthic flux is likely to be small.
In summary, ocean margin sediments appear to be highlyefficient with respect to the retention of reduced carbon com-pounds. The small loss of organic carbon associated with theDOC benthic flux should have minimal effect on the sedimentcarbon cycle. The impact of the DOC benthic flux on watercolumn chemistry depends on the turnover time of the sedi-ment-derived DOC. If this material is unreactive, it couldconstitute a significant component (40%) of the deep oceanDOC pool (the steady-state input of DOC to the deep sea isestimated at 100 Tg Cz yr21; Williams and Druffel, 1987). Onthe other hand, even if sediment-derived DOC is remineralizedon time scales significantly less than the deep water circulationtime, its contribution to the water column O2 demand would benegligible.
6. CONCLUSIONS
1. Porewater obtained by centrifuging continental slope sedi-ment containing macrofauna may be enriched in DOC dueto rupturing of organisms and release of dissolved mole-cules. This artifact could give rise to enhanced DOC con-centration gradients near the sediment-water interface andsubsurface maxima in DOC depth profiles. For sedimentsthat harbor abundant macrofauna, benthic DOC fluxes cal-culated from concentration gradients in porewater obtainedby centrifugation are likely to be upper limits.
2. Depth distributions of porewater DOC concentrations alonga transect at 36°209N vary in a pattern that is consistent withother sediment parameters. Specifically, accumulation ofDOC, SCO2, and depletion of SO4
22 are greatest at Sta. C(750 m) followed by Sta. B (500 m), and Sta. D (1000 m)and Sta. A (300 m). Inventories and profiles of fallout Puindicate that the deposition rate of modern, fine-grainedparticles and bioturbation intensity follow a trend consistentwith the porewater constituents.
3. A simple diagenetic model suggests that DOC concentra-tions at depth in the sediment are controlled by two primary
444 M. J. Alperin et al.

factors: the depth-integrated organic matter remineralizationrate and the vertical extent of the active remineralizationzone. Total remineralization rates for the four stations at36°209N appear to be comparable. Thus, the main factorresponsible for observed differences in DOC concentrationsdeep in the sediment appears to be the depth of remineral-ization. This, in turn, appears to be controlled by the inten-sity of biological mixing.
4. Although the mechanisms by which biopolymers are trans-formed into dissolved organic molecules, sorbed organicmatter, and refractory geopolymers remain largely unre-solved, data from the North Carolina continental slopeclearly show that elevated DOC is not a major factor inpromoting organic carbon preservation. Furthermore, or-
ganic carbon loading on grain surfaces is not affected byDOC levels in the porewater.
5. DOC concentrations do not appear to vary in concert withsediment organic carbon, suggesting that porewater DOCconcentrations are not buffered by a large pool of reversibly-sorbed organic carbon.
6. The DOC flux from continental slope sediments is difficultto detect because of high background concentrations in thebottom water (60mM), analytical variability ($63% or62 mM), and numerous potential sources of contaminationduring sample collection, processing, and storage. DOCconcentrations increased by only 2mM z d21 during long-term (10-day) shipboard incubations in flux chambers thatwere designed to maximize the sediment-water interface
Fig. 11. Benthic DOC flux vs. depth-integrated remineralization rate at four continental margin locations (water depthsranging from 10 to 850 m). The dashed lines mark the 95% confidence interval for the zero-intercept regression line. Theplot includes only published DOC fluxes measured with benthic chambers—fluxes calculated from porewater concentrationgradients are omitted. Data were compiled from the following sources: Chesapeake Bay (Burdige and Homstead, 1994; plotshows average annual values for Stations M and S), Cape Lookout Bight (Alperin et al., 1994; Martens and Klump, 1984;plot shows values for October), Swedish fish farm (Hall et al., 1990; plot shows values for May and September), and NorthCarolina continental slope (this study). We are aware of two additional studies not included in this plot. Hulth et al. (1997)conducted shipboard incubations to determine DOC benthic fluxes at 15 stations in the Weddell Sea. They found norelationship between the measured DOC flux and total sediment remineralization rate (r2 5 0.005,n 5 14). Unfortunately,the data used to calculate DOC fluxes are not given and some of the values appear questionable. For example, one site hasa large DOC fluxinto the sediment (21.09 mmol Cz m22 z d21) despite high DOC concentrations (640mM) in the 0- to0.5-cm sediment interval. Another site has an efflux of DOC that is 50% greater thanSCO2. Four of 12 bottom watersamples were highly enriched in DOC (260 to 2100mM), suggesting a possible contamination problem. Burdige et al.(1999) used a free-vehicle benthic lander to measure in situ DOC fluxes at nine stations along the California continentalmargin. They found that the DOC flux is roughly proportional to the total sediment remineralization rate with a Flux:*RG
ratio of about 25% (range: 10 to 50%). This ratio is about tenfold higher than reported in the studies that are summarizedin this plot and may reflect a greater role for sediment–water column DOC exchange for the California continental margin.Alternatively, the high Flux:*RG ratio for California sediments may be related to the benthic flux calculation: Burdige etal. determinedDDOC/Dt by subtracting the final DOC concentration in the chamber from that in bottom water collected bya Niskin bottle. If we apply this approach to our benthic lander data (Fig. 8a), the DOC flux from North Carolina slopesediments increases to 1.0–1.5 mmol Cz m22 z d21, equivalent to about 25% of the depth-integrated sediment reminer-alization rate.
445

area:overlying-water volume ratio. If the shipboard fluxesare indicative of undisturbed sediment, in situ chamberdeployments of at least 3–4 days are required for reliableestimates of DOC benthic fluxes.
7. The DOC benthic flux measured by shipboard incubations isconsistent with the calculated flux based on Fick’s Law,provided that DOC concentrations were measured on sam-ples collected by the sipper technique. Thus, rapid DOCconsumption at the sediment surface is not required toreconcile measured and calculated fluxes for sediments fromthe North Carolina continental slope.
8. The measured benthic DOC flux for sediments from theNorth Carolina continental slope is equal to less than 2% ofthe depth-integrated organic carbon remineralization rate. Acomparison with several other studies suggests that efficientretention of dissolved organic molecules is a common fea-ture of marine sediments. Scaling-up the limited data basesuggests a global DOC flux of about 40 Tgz yr21. Althoughthis flux is equivalent to about 20% of the riverine dischargeof DOC to the ocean, it is unlikely to have a major impacton either sediment or water column carbon cycles.
Acknowledgments—We thank our numerous colleagues who contrib-uted ideas and data to this study: Joan Willey provided the inspirationand prototype for the porewater sipper, Bob Aller suggested testing theeffect of temperature on porewater DOC, Jeff White conducted thesulfate analyses, Krista Walter provided sulfur data, Gayle Plaia iden-tified the polychaete worms used in the centrifugation test, HowardMendlovitz measured organic carbon concentrations, C:N values, andstable isotope ratios, Larry Mayer graciously provided surface area datafor the inter-laboratory comparison, David Burdige shared his DOCbenthic flux data and provided many helpful discussions and reviews,Mark Green provided porewater calcium data, and Tamara Pease andCarol Hee helped in the field with sediment processing. We also thankthe crews of the R/V Cape Hatteras and R/V Edwin Link/DWS JohnsonSea-Link I for their support and assistance at sea. Finally, we thankCarol Arnosti and Tori Hoehler for their thoughtful comments on anearlier draft of this paper. Funding for this work was provided by theNational Science Foundation (OCE96-33456 [CSM, MJA, DBA],OCE96-17297 [RAJ], and OCE93-01793 [NEB]), Department of En-ergy (DE-FG05-95ER62073 [CSM, MJA, DBA], DE-FG05-92ER61413 [LKB, IBS], and DE-FG05-95ER62036 [RAJ]), and Na-tional Undersea Research Center (NOAA NA 36 RU 0060-02,subcontract 9428.1 [LKB, RAJ]).
REFERENCES
Alperin M. J., Albert D. B., and Martens C. S. (1994) Seasonalvariations in production and consumption rates of dissolved organiccarbon in an organic-rich coastal sediment.Geochim. Cosmochim.Acta 58, 4909–4930.
Anderson R. F. and Fleer A. P. (1982) Determination of naturalactinides and plutonium in marine particulate material.Anal. Chem.54, 1142–1147.
Anderson R. F., Rowe G. T., Kemp P. F., Trumbore S., and BiscayeP. E. (1994) Carbon budget for the mid-slope depocenter of theMiddle Atlantic Bight.Deep-Sea Res. 41, 669–703.
Arnosti C., Repeta D. J., and Blough N. V. (1994) Rapid bacterialdegradation of polysaccharides in anoxic marine systems.Geochim.Cosmochim. Acta58, 2639–2652.
Aston S. R. and Stanners D. A. (1981) Plutonium transport to anddeposition and immobility in Irish Sea intertidal sediments.Nature289,581–582.
Bauer J. E., Reimers C. E., Druffel E. R. M., and Williams P. M. (1995)Isotopic constraints on carbon exchange between deep ocean sedi-ments and sea water.Nature373,686–689.
Benner R. and Strom M. (1993) A critical evaluation of the analytical
blank associated with DOC measurements by high-temperature cat-alytic oxidation.Mar. Chem. 41, 153–160.
Benninger L. K. and Dodge R. E. (1986) Fallout plutonium and naturalradionuclides in annual bands of the coralMontastrea annularis,St.Croix, U.S. Virgin Islands.Geochim. Cosmochim. Acta50, 2785–2797.
Benninger L. K. and Wells J. T. (1993) Sources of sediment to theNeuse River estuary, North Carolina.Mar. Chem. 43, 137–156.
Berner R. A. (1976) Inclusion of adsorption in the modelling of earlydiagenesis.Earth Planet. Sci. Lett. 29, 333–340.
Berner R. A. (1980)Early Diagenesis. Princeton.Berner R. A. (1995) Sedimentary organic matter preservation: As
assessment and speculative synthesis—a comment.Mar. Chem. 49,121–122.
Blair N. E., Plaia G. R., Boehme S. E., DeMaster D. J., and Levin L. A.(1994) The remineralization of organic carbon on the North Carolinacontinental slope.Deep-Sea Res. 41, 755–766.
Blair N. E., Levin L. A., DeMaster D. J., and Plaia G. (1996) Theshort-term fate of fresh algal carbon in continental slope sediments.Limnol. Oceanogr. 41, 1208–1219.
Blake J. A. (1994) Vertical distribution of benthic infauna in continen-tal slope sediments off Cape Lookout, North Carolina.Deep-SeaRes. 41, 919–927.
Blake J. A. and Hilbig B. (1994) Dense infaunal assemblages on thecontinental slope off Cape Hatteras, North Carolina.Deep-Sea Res.41, 875–899.
Boudreau B. P. (1997)Diagenetic Models and Their Implementation.Springer.
Brunauer S., Emmett P. H., and Teller E. (1938) Adsorption of gases inmultimolecular layers.J. Amer. Chem. Soc. 60, 309–319.
Buchholtz-Ten Brink M. R., Gust G., and Chavis D. (1989) Calibrationand performance of a stirred benthic chamber.Deep-Sea Res. 36,1083–1101.
Bunn A. R. and McGregor B. A. (1980) Morphology of the NorthCarolina continental slope, western North Atlantic, shaped by deltaicsedimentation and slumping.Mar. Geol. 37, 253–266.
Burdige D. J. and Gardner K. G. (1998) Molecular weight distributionof dissolved organic carbon in marine sediment pore waters.Mar.Chem. 62, 45–64.
Burdige D. J. and Homstead J. (1994) Fluxes of dissolved organiccarbon from Chesapeake Bay sediments.Geochim. Cosmochim. Acta58, 3407–3424.
Burdige D. J., Alperin M. J., Homstead J., and Martens C. S. (1992)The role of benthic fluxes of dissolved organic carbon in oceanicand sedimentary carbon cycling.Geophys. Res. Lett. 19, 1851–1854.
Burdige D. J., Berelson W. M., Coale K. H., McManus J., and JohnsonK. S. (1999) Fluxes of dissolved organic carbon from continentalmargin sediments.Geochim. Cosmochim. Acta(in press).
Canfield D. (1994) Factors influencing organic carbon preservation inmarine sediments.Chem. Geol. 114,315–329.
Carignan R., Rapin F., and Tessier A. (1985) Sediment porewatersampling for metal analysis: A comparison of techniques.Geochim.Cosmochim. Acta49, 2493–2497.
Christensen E. R. and Bhunia P. K. (1986) Modeling radiotracers insediments: Comparison with observations in Lakes Huron and Mich-igan.J. Geophys. Res. 91, 8559–8571.
Chrost R. J. (1991) Environmental control of the synthesis and activityof aquatic microbial ectoenzymes. InMicrobial Enzymes in AquaticSediments(ed. R. J. Chro´st), 29–59. Springer-Verlag.
Colberg P. J. (1988) Anaerobic microbial degradation of cellulose,lignin, oligolignols, and monoaromatic lignin derivatives. InBiologyof Anaerobic Microorganisms(ed. A. J. B. Zehnder), 333–372.Wiley-Interscience.
Collins M. J., Bishop A. N., and Farrimond P. (1995) Sorption bymineral surfaces: Rebirth of the classical condensation pathwayfor kerogen formation?Geochim. Cosmochim. Acta59, 2387–2391.
Cornel P. K., Summers R. S., and Roberts P. V. (1986) Diffusion ofhumic acid in dilute aqueous solution.J. Colloid Interface Sci. 110,149–164.
de Leeuw J. W. and Largeau C. (1993) A review of macromolecularorganic compounds that comprise living organisms and their role in
446 M. J. Alperin et al.

kerogen, coal, and petroleum formation. In Organic Geochemistry(ed. M. H. Engel and S. A. Macko), 23–72. Plenum.
DeMaster D. J., Pope R. H., Levin L. A., and Blair N. E. (1994)Biological mixing intensity and rates of organic carbon accumu-lation in North Carolina slope sediments.Deep-Sea Res. 41,735–753.
Deming J. W. and Baross J. A. (1993) The early diagenesis of organicmatter: Bacterial activity. InOrganic Geochemistry(ed. M. Engeland S. A. Macko), 119–144. Plenum.
DeVito C. M. (1981) Radionuclides as tracers of sediment transportprocesses in North Carolina Continental Slope sediments. M.S. The-sis, University of North Carolina at Chapel Hill, 60 pp.
Hall P. O. J. and Aller R. C. (1992) Rapid, small-volume flow injectionanalysis forSCO2 and NH4
1 in marine and fresh waters.Limnol.Oceanogr. 37, 1113–1119.
Hall P. O. J., Anderson L. G., Holby O., Kollberg S., and SamuelssonM.-O. (1990) Chemical fluxes and mass balances in a marine fishcage farm. I. Carbon.Mar. Ecol. Progr. Ser. 61, 61–73.
Hatcher P. G. and Spiker E. C. (1988) Selective degradation of plantbiomolecules. InHumic Substances and Their Role in the Environ-ment(ed. F. H. Frimmel and R. F. Christman), 59–74. Wiley.
Health and Safety Laboratory. (1977) Final tabulation of monthly90Srfallout data: 1954–1976. U.S. Energy Research and DevelopmentAdministration Report HASL-329.
Hedges J. I. (1988) Polymerization of humic substances in naturalenvironments. InHumic Substances and Their Role in the Environ-ment(ed. F. H. Frimmel and R. F. Christman), 45–58. Wiley.
Hedges J. I. and Keil R. G. (1995) Sedimentary organic matter pres-ervation: An assessment and speculative synthesis.Mar. Chem. 49,81–115.
Hedges J. I. and Stern J. H. (1984) Carbon and nitrogen determinationsof carbonate-containing solids.Limnol. Oceanogr. 29, 657–663.
Henrichs S. M. (1992) Early diagenesis of organic matter in marinesediments: Progress and perplexity.Mar. Chem. 39, 119–149.
Henrichs S. M. (1995) Sedimentary organic matter preservation: Anassessment and speculative synthesis—A comment.Mar. Chem. 49,127–136.
Henrichs S. M. and Reeburgh W. S. (1987) Anaerobic mineralizationof marine sediment organic matter: Rates and the role of anaerobicprocesses in the oceanic carbon economy.Geomicrobiol. J. 5, 191–237.
Hulth S. Tengberg A., Lande´n A., and Hall P. O. J. (1997) Mineral-ization and burial of organic carbon in sediments of the southernWeddell Sea (Antarctica).Deep-Sea Res. 44, 955–981.
Jahnke R. A. (1996) The global ocean flux of particulate organiccarbon: Areal distribution and magnitude.Global Biogeochem. Cy-cles10, 71–88.
Jahnke R. A. and Christiansen M. B. (1989) A free-vehicle benthicchamber instrument for sea floor studies.Deep-Sea Res. 36, 625–637.
Jumars P. A. and Wheatcroft R. A. (1989) Responses of benthos tochanging food quality and quantity, with a focus on depositfeeding and bioturbation. InProductivity of the Ocean: Presentand Past (ed. W. H. Berger, V. S. Smetacek, and G. Wefer),235–253. Wiley.
Keil R. G., Montlucon D. B., Prahl F. G., and Hedges J. I. (1994)Sorptive preservation of labile organic matter in marine sediments.Nature370,549–552.
King G. M. (1986) Characterization ofb-glucosidase activity in inter-tidal marine sediments.Appl. Environ. Microbiol.51, 373–380.
Krom M. D. and Sholkovitz E. R. (1977) Nature and reactions ofdissolved organic matter in the interstitial waters of marine sedi-ments.Geochim. Cosmochim. Acta41, 1565–1573.
Kuehl S. A., Nittrouer C. A., DeMaster D. J., and Curfin T. B. (1985)A long, square-barrel gravity corer for sedimentological and geo-chemical investigation of fine-grained sediments.Mar. Geol. 62,365–370.
Largeau C. (1995) Formation of refractory organic matter from bio-logical precursors. InThe Role of Nonliving Organic Matter in theEarth’s Carbon Cycle(ed. R. G. Zepp and Ch. Sonntag), 275–292.Wiley.
Law B. A. (1980) Transport and utilization of proteins by bacteria. In
Microorganisms and Nitrogen Sources(ed. J. W. Payne), 381–409.Wiley.
Levin L., Blair N., DeMaster D., Plaia G., Fornes W., and Martin C.(1997) Rapid subduction of organic matter by maldanid polychaeteson the North Carolina slope.J. Mar. Res. 55, 595–611.
Li Y-.H. and Gregory S. (1974) Diffusion of ions in sea water and indeep-sea sediments.Geochim. Cosmochim. Acta38, 703–714.
Martens C. S. and Klump J. V. (1984) Biogeochemical cycling in anorganic-rich coastal marine basin 4. An organic carbon budget forsediments dominated by sulfate reduction and methanogenesis.Geochim. Cosmoshim. Acta48, 1987–2004.
Martin W. R. and McCorkle D. C. (1993) Dissolved organic carbonconcentrations in marine pore waters determined by high-tempera-ture oxidation.Limnol. Oceanogr. 38, 1464–1479.
Mayer L. M. (1989) Extracellular proteolytic enzyme activity in sedi-ments of an intertidal mudflat.Limnol. Oceanogr. 34, 973–981.
Mayer L. M. (1993) Organic matter at the sediment-water interface. InOrganic Geochemistry(ed. M. H. Engel and S. A. Macko), 171–184.Plenum.
Mayer L. M. (1994a) Surface area control of organic carbon accumu-lation in continental shelf sediments.Geochim. Cosmochim. Acta58,1271–1284.
Mayer L. M. (1994b) Relationships between mineral surfaces andorganic carbon concentrations in soils and sediments.Chem. Geol.114,347–363.
Mayer L. M. (1995) Sedimentary organic matter preservation: Anassessment and speculative synthesis—A comment.Mar. Chem. 49,123–126.
McCall P. L. and Tevesz M. J. S. (1982) The effects of benthos onphysical properties of freshwater sediments. InAnimal SedimentRelations: The Biogenic Alteration of Sediments(ed. P. L. McCalland M. J. S. Tevesz), 105–176, Plenum.
Mellor C. A. and Paull C. K. (1994) Sea beam bathymetry of theManteo 467 Lease Block off Cape Hatteras, North Carolina.Deep-Sea Res. 41, 711–718.
Meybeck M. (1982) Carbon, nitrogen, and phosphorous transport byworlds rivers.Amer. J. Sci. 282,401–450.
Meyer-Reil L.-A. (1991) Ecological aspects of enzymatic activity inmarine sediments. InMicrobial Enzymes in Aquatic Sediments(ed.R. J. Chro´st), 84–95. Springer-Verlag.
Middelburg J. J., Soetaert K., and Herman P. M. J. (1997) Empiricalrelationships for use in global diagenetic models.Deep-Sea Res. 44,327–344.
Nealson K. H. (1997) Sediment bacteria: Who’s there, what are theydoing, and what’s new?Annu. Rev. Earth Planet. Sci.25, 403–434.
Nissenbaum A. and Kaplan I. R. (1972) Chemical and isotopic evi-dence for the in situ origin of marine humic substances.Limnol.Oceanogr. 17, 570–582.
Pedersen T. F. (1995) Sedimentary organic matter preservation: Anassessment and speculative synthesis—A comment.Mar. Chem. 49,117–119.
Prior D. B., Doyle E. H., and Neurauter T. (1986) The CurrituckSlide, mid-Atlantic continental slope—revisited.Mar. Geol 73,25– 45.
Ransom B., Bennett R. H., Baerwald R., and Shea K. (1997) TEMstudy of in situ organic matter on continental margins: Occurrenceand the “monolayer” hypothesis.Mar. Geol. 138,1–9.
Robbins J. A. (1986) A model for particle-selective transport of tracersin sediments with conveyor belt deposit feeders.J. Geophys. Res. 91,8542–8558.
Schaff T. R. and Levin L. A. (1994) Spatial heterogeneity of benthosassociated with biogenic structures on the North Carolina continentalslope.Deep-Sea Res. 41, 901–918.
Schaff T., Levin L., Blair N., DeMaster D., Pope R., and Boehme S.(1992) Spatial heterogeneity of benthos on the Carolina continentalslope: Large (100 km)-scale variation.Mar. Ecol. Progr. Ser. 88,143–160.
Schwinghamer P., Hargrave B., Peer D., and Hawkins C. M. (1986)Partitioning of production and respiration among size groups oforganisms in an intertidal benthic community.Mar. Ecol. Progr. Ser.31, 131–142.
447

Sewell G. (1982)IMSL Software for Differential Equations in OneSpace Variable. IMSL Tech. Rep. Ser. No. 8202. IMSL, Inc.
Sholkovitz E. R. and Mann D. R. (1984) The pore water chemistry of239,240Pu and137Cs in sediments of Buzzards Bay, Massachusetts.Geochim. Cosmochim. Acta48, 1107–1114.
Smith C. R. (1992) Factors controlling bioturbation in deep-sea sedi-ments and their relation to models of carbon diagenesis. InDeep-SeaFood Chains and the Global Carbon Cycle(ed. G. T. Rowe and V.Pariente), 375–393. Kluwer.
Smith K. L., Carlucci A. F., Jahnke R. A., and Craven D. B. (1987)
Organic carbon mineralization in the Santa Catalina Basin: Benthicboundary layer metabolism.Deep-Sea Res. 34, 185–211.
Thimsen C. A. and Keil R. G. (1998) Potential interactions betweensedimentary dissolved organic matter and mineral surfaces.Mar.Chem. 62, 65–76.
Tissot B. P. and Welte D. H. (1984)Petroleum Formation and Occur-rence. Springer-Verlag.
Williams P. M. and Druffel E. R. M. (1987) Radiocarbon in dissolvedorganic matter in the central North Pacific ocean.Nature 330,246–248.
448 M. J. Alperin et al.