benthic biological monitoring program of elizabeth ... · three objectives of the benthic...
TRANSCRIPT
OLD DOMINION UNIVERSITY
Department of Biological SciencesOld Dominion University, Norfolk, Virginia 23529
BENTHIC BIOLOGICAL MONITORING PROGRAM OF THE ELIZABETH RIVERWATERSHED (2001) WITH A STUDY OF PARADISE CREEK
Prepared by
Principal Investigator:
Dr. Daniel M. Dauer
Submitted to:
Mr. Roger EvertonVirginia Department of Environmental QualityTidewater Regional Office5636 Southern BlvdVirginia Beach, VA 23462
October, 2002
2
EXECUTIVE SUMMARY
A study of the macrobenthic communities of the Elizabeth River watershed was initiatedin summer 1999. This report presents the data from the third year of sampling in 2001. Thethree objectives of the Benthic Biological Monitoring Program of the Elizabeth River watershedare: (1) To characterize the health of the tidal waters of the Elizabeth River watershed asindicated by the structure of the benthic communities. ( 2) To conduct trend analyses onlong-term data at 14 fixed-point stations to relate temporal trends in the benthic communities tochanges in water and/or sediment quality. Trend analyses will be updated annually as new dataare available. (3) To produce an historical data base that will allow annual evaluations of bioticimpacts by comparing trends in status within probability-based strata and trends at fixed-pointstations to changes in water and/or sediment quality. During the 2001 sampling the benthiccommunity condition of Paradise Creek of the Southern Branch of the Elizabeth River was alsocharacterized.
The health of the benthic communities of the Elizabeth River watershed is characterized in thisreport by combining previously developed benthic restoration goals, the Benthic Index of BioticIntegrity (BIBI) developed for the Chesapeake Bay and probability-based sampling. Aprobability-based sampling design allows calculation of confidence intervals around estimates ofcondition of the benthic communities and allows estimates of the areal extent of degradation ofthe benthic communities. In summer 1999 a spatially intensive sampling occurred. TheElizabeth River watershed was divided into five sampling strata - the Mainstem of the river, theLafayette River, the Southern Branch, Western Branch and Eastern Branch. Within each stratum25 samples were randomly allocated in a probability-based sampling design. In 2000 and insucceeding years a single stratum, the entire Elizabeth River watershed, will be sampled with 25random samples. In 2001 Paradise Creek was sampled as a separate stratum of 25 randomsamples.
Based upon probability-based sampling the estimate of benthic bottom not meeting the benthicrestoration goals was 52 % in 2001, 72 % in 2000, and 64 % in 1999. In general for theElizabeth River watershed, species diversity and biomass were below reference condition levelswhile abundance was above reference condition levels. Community composition wasunbalanced with levels of pollution indicative species above, and levels of pollution sensitivespecies, below reference conditions. The level of degradaton in Paradise Creek was 92%compared to 52% for the entire Elizabeth River watershed in 2001. Previously this same level ofdegradation was reported for the Southern Branch in the 1999 intensive sampling effort (Dauer2000; Dauer and Llansó 2002). The higher levels of degradation in Paradise Creek wereassociated with extremely high abundances, low species diversity due to high dominance by afew species, and low levels of biomass and pollution sensitive species compared to the ElizabethRiver watershed as a whole.
3
INTRODUCTION
A long-term monitoring program of the macrobenthic communities of the Elizabeth Riverwatershed was initiated in summer 1999. The three objectives of the Benthic BiologicalMonitoring Program of the Elizabeth River watershed are: (1) To characterize the health of thetidal waters of the Elizabeth River watershed as indicated by the structure of the benthiccommunities. This characterization is based upon application of benthic restoration goals andthe Benthic Index of Biotic Integrity (BIBI) developed for the Chesapeake Bay to the ElizabethRiver Watershed (Ranasinghe et al. 1994; Weisberg et al. 1997). In each year 25 samples are randomly allocated in a probability-based sampling design. A probability-based sampling designallows calculation of confidence intervals around estimates of condition of the benthiccommunities. ( 2) To conduct trend analyses on long-term data at 14 fixed-point stations torelate temporal trends in the benthic communities to changes in water and/or sediment quality. Trend analyses will be updated annually as new data are available. (3) To produce an historicaldata base that will allow annual evaluations of biotic impacts by comparing trends in statuswithin probability-based strata and trends at fixed-point stations to changes in water and/orsediment quality.
The macrobenthic communities of the Elizabeth River have been studied since the 1969sampling of Boesch (1973) with three stations in the Mainstem of the river. Other importantstudies were limited to the Southern Branch of the river including seasonal sampling at 10 sitesin 1977-1978 (Hawthorne and Dauer 1983), seasonal sampling at the same 10 sites a decade laterin 1987-1988 by Hunley (1993), the establishment of two long-term monitoring stations in 1989as part of the Virginia Chesapeake Bay Benthic Monitoring Program (Dauer et al. 1999) andsummarizations of the two Southern Branch long-term monitoring stations (Dauer 1993; Dauer etal. 1993). The condition of the benthic community of the Elizabeth River watershed wascharacterized by spatially extensive sampling of the river in 1999 with 175 locations sampledamong seven strata (Dauer 2000). In 2000 the Elizabeth River watershed was sampled as asingle stratum with the benthic community condition characterized at 25 random locations(Dauer 2001). This study updates the benthic community characterization of the Elizabeth Riverwatershed base upon data collected in 2001.
RATIONALE
Benthic invertebrates are used extensively as indicators of estuarine environmental statusand trends because numerous studies have demonstrated that benthos respond predictably tomany kinds of natural and anthropogenic stress (Pearson and Rosenberg 1978; Dauer 1993; Tappet al. 1993; Wilson and Jeffrey 1994). Many characteristics of benthic assemblages make themuseful indicators (Bilyard 1987), the most important of which are related to their exposure tostress and the diversity of their responses to stress. Exposure to hypoxia is typically greatest innear-bottom waters and anthropogenic contaminants often accumulate in sediments wherebenthos live. Benthic organisms generally have limited mobility and cannot avoid these adverseconditions. This immobility is advantageous in environmental assessments because, unlike most
4
pelagic fauna, benthic assemblages reflect local environmental conditions (Gray 1979). Thestructure of benthic assemblages responds to many kinds of stress because these assemblagestypically include organisms with a wide range of physiological tolerances, life history strategies,feeding modes, and trophic interactions (Pearson and Rosenberg 1978; Rhoads et al. 1978;Boesch and Rosenberg 1981). Recently benthic community condition in the Chesapeake Baywatershed has been related in a quantitative manner to water quality, sediment quality, nutrientloads, and land use patterns (Dauer et al. 2000).
METHODS
A glossary of selected terms used in this report is found on page 13.
Strata Sampled
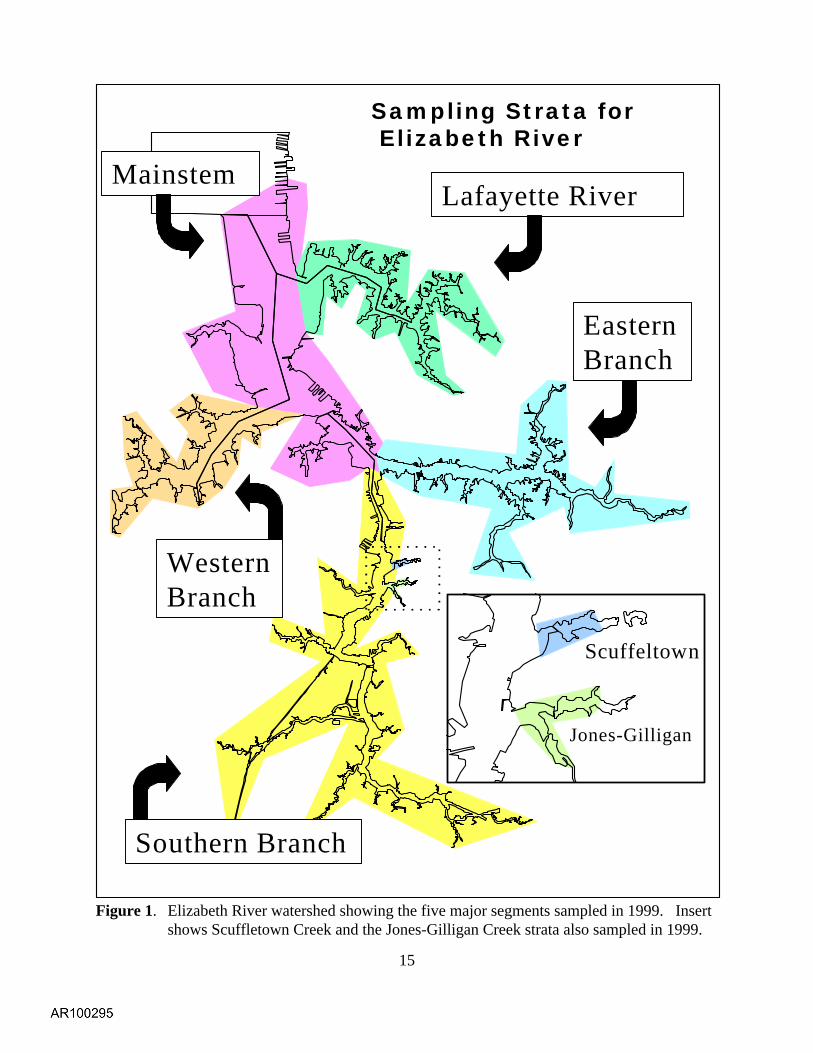
In the summer of 1999, the Elizabeth River watershed was divided into five primarystrata - the Mainstem of the river, the Lafayette River, the Southern Branch, Western Branch andEastern Branch (Fig. 1). In addition two small creeks of the Southern Branch of the river werealso sampled as part of a sediment contaminant remediation effort - Scuffletown Creek andJones-Gilligan Creek. In 2000 and 2001 the Elizabeth River was sampled as a single stratum of25 random samples. In 2001 Paradise Creek was sampled as a separate stratum.
Probability-based sampling
Sampling design and methodologies for probability-based sampling are based uponprocedures developed by EPA's Environmental Monitoring and Assessment Program (EMAP,Weisberg et al. 1993) and allow unbiased comparisons of conditions between strata (Dauer andLlansó 2002)
Within each probability-based stratum, 25 random locations were sampled using a 0.04m2 Young grab. The minimum acceptable depth of penetration of the grab was 7 cm. At eachstation one grab sample was taken for macrobenthic community analysis and a second grabsample for sediment particle size analysis and the determination of total volatile solids. A 50 gsubsample of the surface sediment was taken for sediment analysis. Salinity, temperature anddissolved oxygen were measured at the bottom and water depth was recorded.
Probability-Based Estimation of Degradation
Areal estimates of degradation of benthic community condition within a stratum can bemade because all locations in each stratum are randomly selected. The estimate of the proportionof a stratum failing the Benthic Restoration Goals developed for Chesapeake Bay (Ranasinghe etal. 1994; updated in Weisberg et al. 1997) is the proportion of the 25 samples with an B-IBIvalue of less than 3.0. The process produces a binomial distribution: the percentage of thestratum attaining goals versus the percentage not attaining the goals. With a binomial
5
distribution the 95% confidence limits for these percentages can be calculated as:
95% Confidence Limit = p ± 1.96 (SQRT(pq/N)) where p = percentage attaining goal, q = percentage not attaining goal and N = number ofsamples.
For each stratum, 50 random points were selected using the GIS system of Versar, Inc. Decimal degree reference coordinates were used with a precision of 0.000001 degrees(approximately 1 meter) which is a smaller distance than the accuracy of positioning; therefore,no area of a stratum is excluded from sampling and every point within a stratum has a chance ofbeing sampled. In the field the first 25 acceptable sites are sampled. Sites may be rejectedbecause of inaccessibility by boat, inadequate water depth or inability of the grab to obtain anadequate sample (e.g., on hard bottoms).
Fixed-Point Station sampling
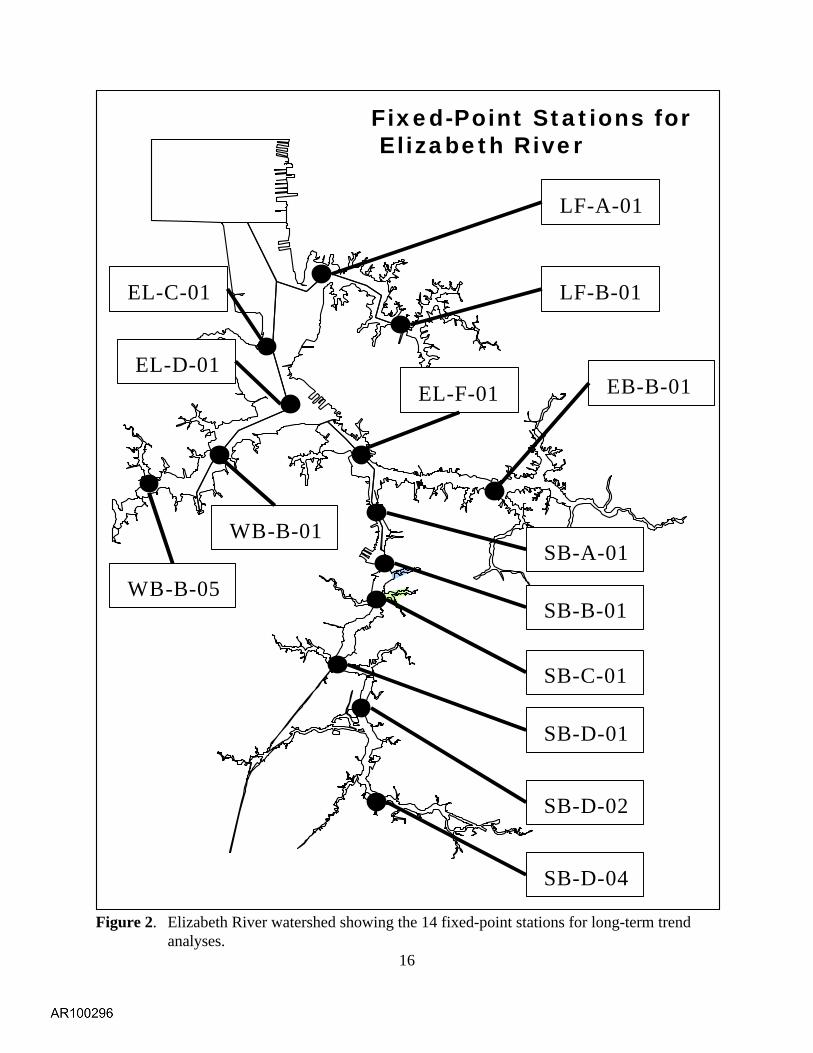
Fourteen fixed point stations were established for long-term trend analysis (Fig. 2). Allfield collection procedures were the same as for probability based sampling except that threereplicate Young grab sample were collected for macrobenthic community analysis.
Laboratory Analysis
Each replicate was sieved on a 0.5 mm screen, relaxed in dilute isopropyl alcohol andpreserved with a buffered formalin-rose bengal solution. In the laboratory each replicate wassorted and all the individuals identified to the lowest possible taxon and enumerated. Biomasswas estimated for each taxon as ash-free dry weight (AFDW) by drying to constant weight at 60oC and ashing at 550 oC for four hours. Biomass was expressed as the difference between the dryand ashed weight.
Particle-size analysis was conducted using the techniques of Folk (1974). Each sedimentsample is first separated into a sand fraction (> 63 µm) and a silt-clay fraction (< 63 µm). Thesand fraction was dry sieved and the silt-clay fraction quantified by pipette analysis. For randomstations, only the percent sand and percent silt-clay fraction were estimated. For the fixed-pointstations particle-size distribution parameters were determined by the graphic and momentmeasures methods of Folk (1974). Total volatile solids of the sediment was estimated by theloss upon ignition method as described above and presented as percentage of the wight of thesediment.
6
Benthic Index of Biotic Integrity
B-IBI and Benthic Community Status Designations
The B-IBI is a multiple-metric index developed to identify the degree to which a benthiccommunity meets the Chesapeake Bay Program's Benthic Community Restoration Goals(Ranasinghe et al. 1994; Weisberg et al. 1997; Alden et al. 2002). The B-IBI provides a meansfor comparing relative condition of benthic invertebrate communities across habitat types. It alsoprovides a validated mechanism for integrating several benthic community attributes indicativeof community health into a single number that measures overall benthic community condition.
The B-IBI is scaled from 1 to 5, and sites with values of 3 or more are considered to meetthe Restoration Goals. The index is calculated by scoring each of several attributes as either 5, 3,or 1 depending on whether the value of the attribute at a site approximates, deviates slightlyfrom, or deviates strongly from the values found at reference sites in similar habitats, and thenaveraging these scores across attributes. The criteria for assigning these scores are numeric anddependent on habitat type. Application of the index is limited to a summer index period fromJuly 15th through September 30th.
Benthic community condition was classified into four levels based on the B-IBI. Valuesless than 2 were classified as severely degraded; values form 2.0 to 2.6 were classified asdegraded; values greater than 2.6 but less than 3.0 were classified as marginal; and values of3.0 or more were classified as meeting the goal. Values in the marginal category do not meet theRestoration Goals, but they differ from the goals within the range of measurement error typicallyrecorded between replicate samples. These categories are used in annual characterizations of thecondition of the benthos in the Chesapeake Bay (Ranasinghe et al. 1994; Dauer et al. 1998a,1998b; Ranasinghe et al. 1998; Dauer et al. 2002).
Further Information concerning the B-IBI
The analytical approach used to develop the B-IBI was similar to the one Karr et al.(1986) used to develop comparable indices for freshwater fish communities. Selection of benthiccommunity metrics and metric scoring thresholds were habitat-dependent but by usingcategorical scoring comparisons between habitat types were possible. A six-step procedure wasused to develop the index: (1) acquiring and standardizing data sets from a number ofmonitoring programs, (2) temporally and spatially stratifying data sets to identify seasons andhabitat types, (3) identifying reference sites, (4) selecting benthic community metrics, (5)selecting metric thresholds for scoring, and (6) validating the index with an independent data set(Weisberg et al. 1997). The B-IBI developed for Chesapeake Bay is based upon subtidal,unvegetated, infaunal macrobenthic communities. Hard-bottom communities, e.g., oyster beds,were not sampled because the sampling gears could not obtain adequate samples to characterizethe associated infaunal communities. Infaunal communities associated with submerged aquatic
7
vegetation (SAV) were not avoided, but were rarely sampled due to the limited spatial extent ofSAV in Chesapeake Bay.
Only macrobenthic data sets based on processing with a sieve of 0.5 mm mesh apertureand identified to the lowest possible taxonomic level were used. A data set of over 2,000samples collected from 1984 through 1994 was used to develop, calibrate and validate the index(see Table 1 in Weisberg et al. 1997). Because of inherent temporal sampling limitations insome of the data sets, only data from the period of July 15 through September 30 were used todevelop the index. A multivariate cluster analysis of the biological data was performed to definehabitat types. Salinity and sediment type were the two important factors defining habitat typesand seven habitats were identified - tidal freshwater, oligohaline, low mesohaline, highmesohaline sand, high mesohaline mud, polyhaline sand and polyhaline mud habitats (see Table5 in Weisberg et al. 1997).
Reference sites were selected as those sites which met all three of the following criteria:no sediment contaminant exceeded Long et al.'s (1995) effects range-median (ER-M)concentration, total organic content of the sediment was less than 2%, and bottom dissolvedoxygen concentration was consistently high.
A total of 11 metrics representing measures of species diversity, community abundanceand biomass, species composition, depth distribution within the sediment, and trophiccomposition were used to create the index (see Appendix). The habitat-specific metrics werescored and combined into a single value of the B-IBI. Thresholds for the selected metrics werebased on the distribution of values for the metric at the reference sites. Data used for validationwere collected between 1992 and 1994 and were independent of data used to develop the index. The B-IBI classified 93% of the validation sites correctly (Weisberg et al. 1997).
In tables presenting B-IBI results salinity classes are as follows: 1- tidal freshwater, 2 -oligohaline, 3- low mesohaline, 4 - high mesohaline and 5 - polyhaline. The two sedimentclasses are as follows: 1 - silt clay content < 40% and 2 - silt clay content $ 40%. Allabundance values are individuals per m-2; biomass values are AFDW g per m-2; and pollutionindicative, pollution sensitive and cavnivore/omnivore metrics are percent of abundance orbiomass as indicated in tables.
RESULTS
Elizabeth River Watershed - Probability-Based Sampling
Environmental Parameters
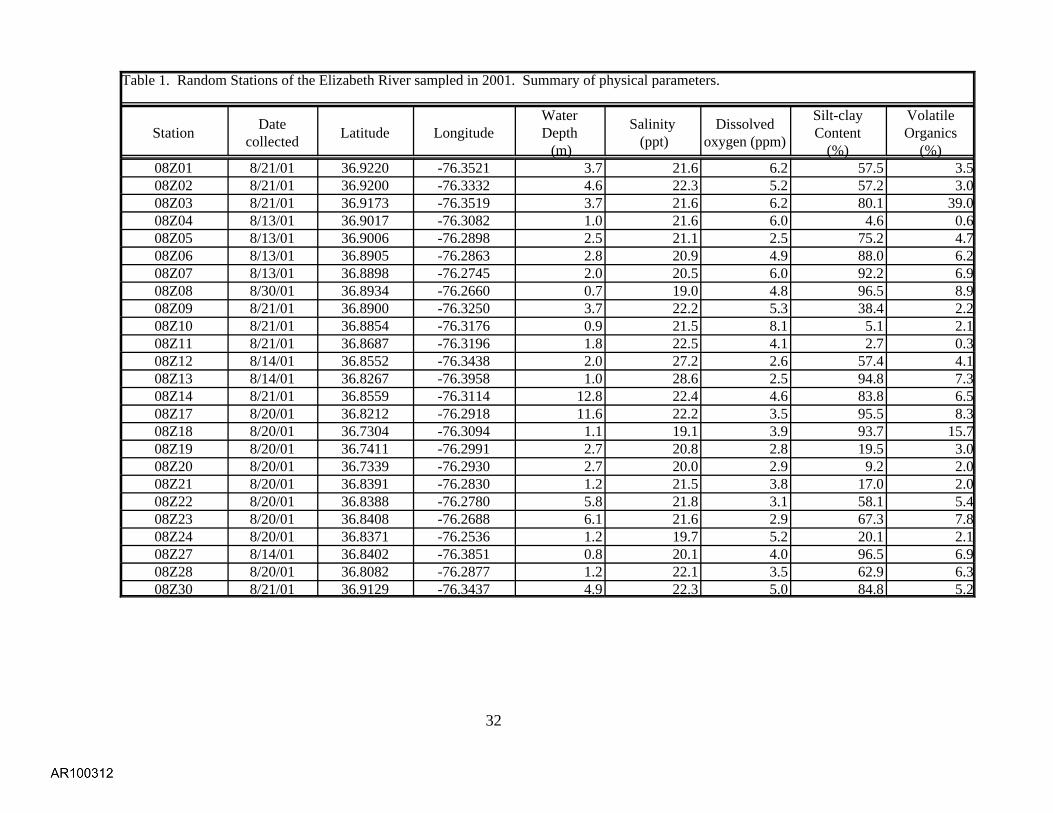
All physical, chemical and sedimentary parameters are summarized in Table 1. Waterdepths varied from less than 1m to nearly 13 m reflecting shoal and channel depths. All salinity
8
values were in the polyhaline range with values from 19.0 to 28.6 ppt. Bottom dissolved oxygenwas generally high and varied from 2.5 to 8.1 ppm. Silt-clay content varied from 1.9 to 97.3 %and total volatile solids from 0.3 to 14.8 %.
Benthic Community Condition
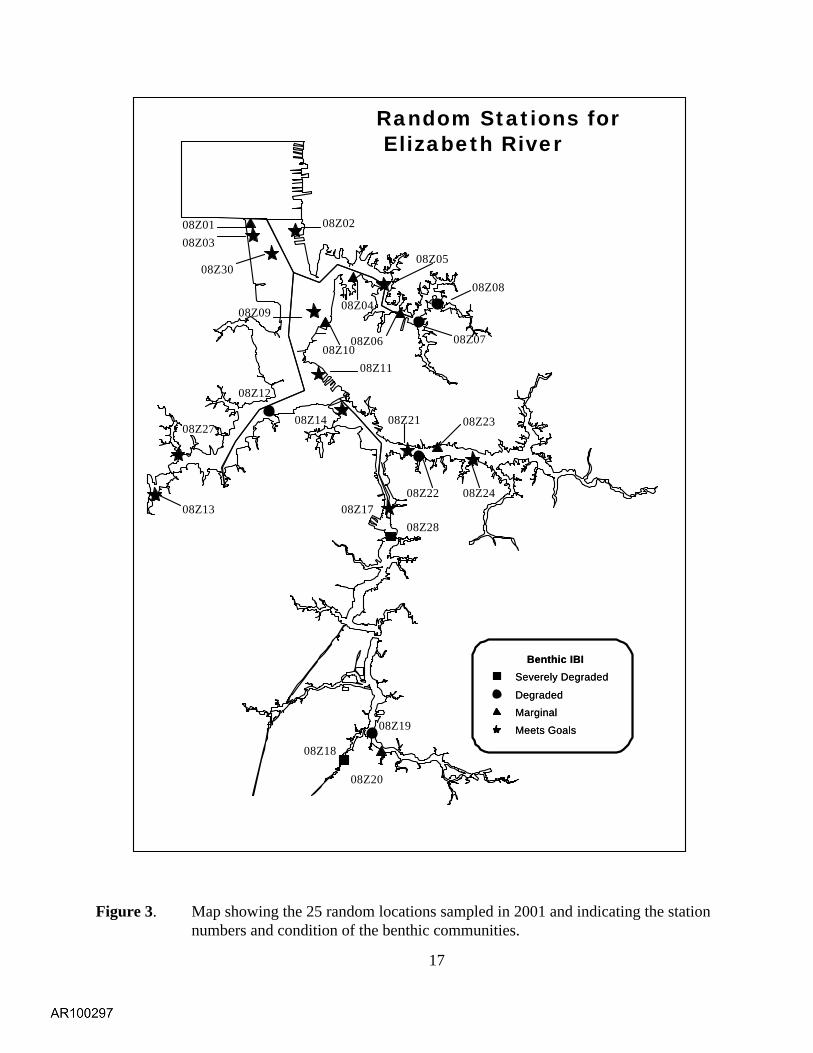
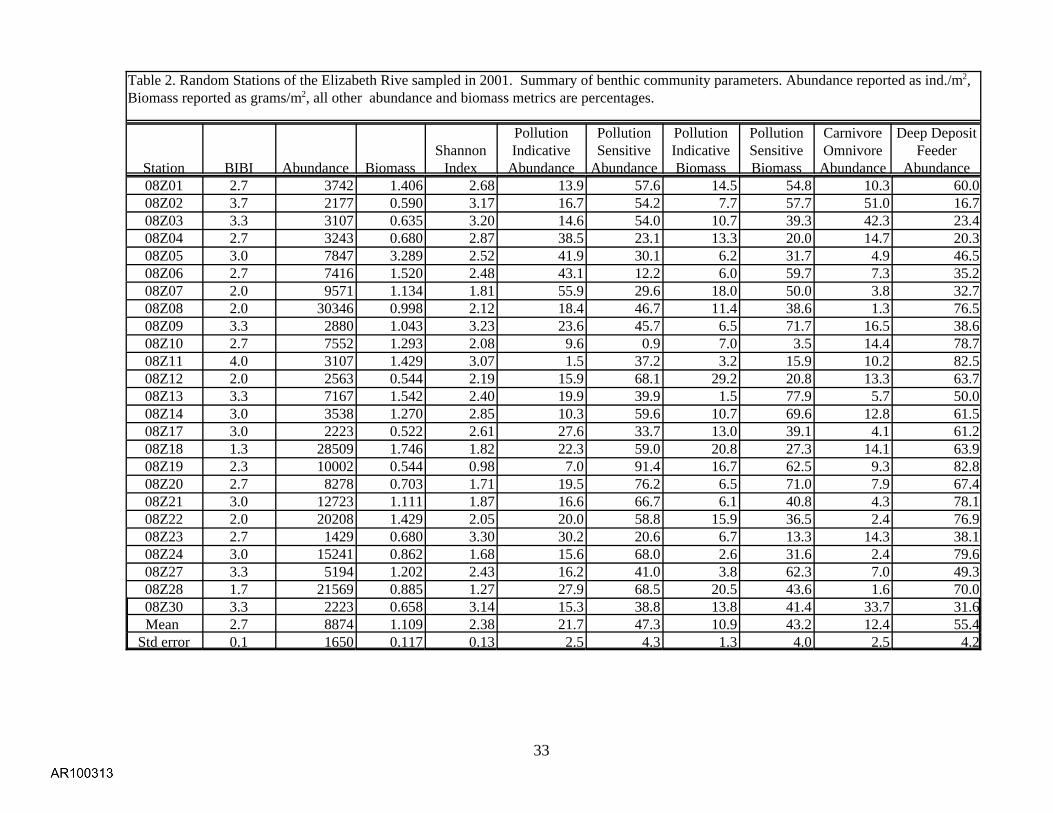
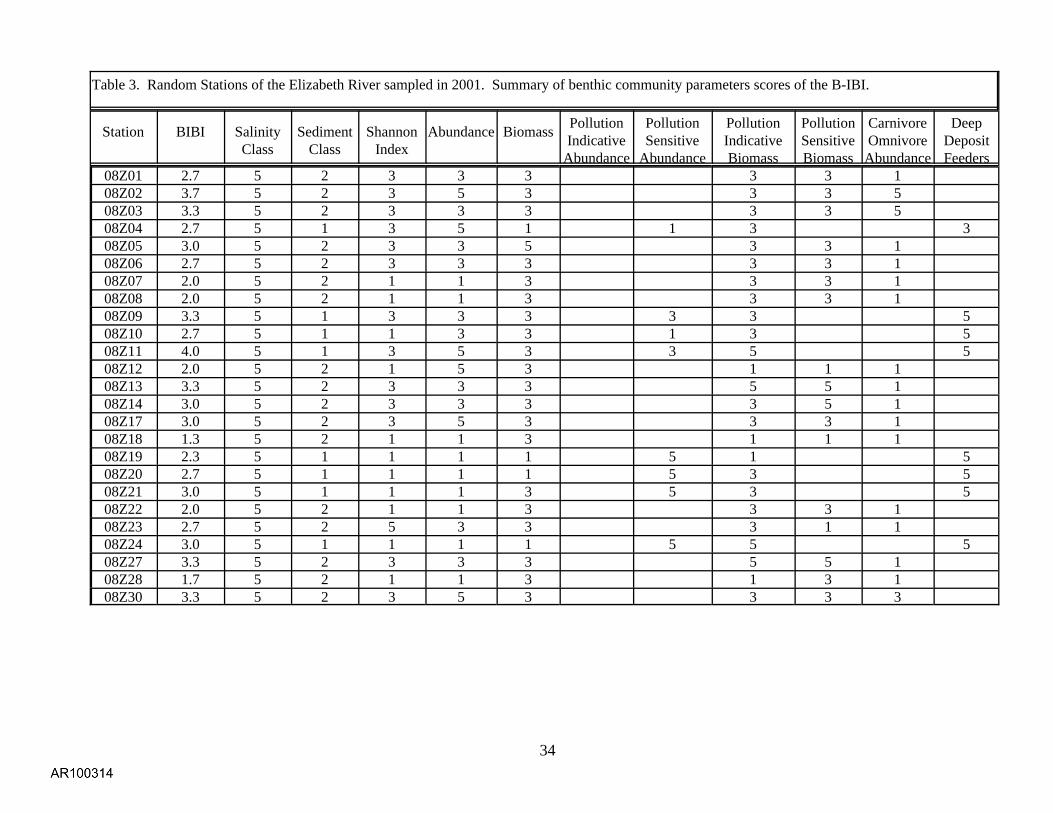
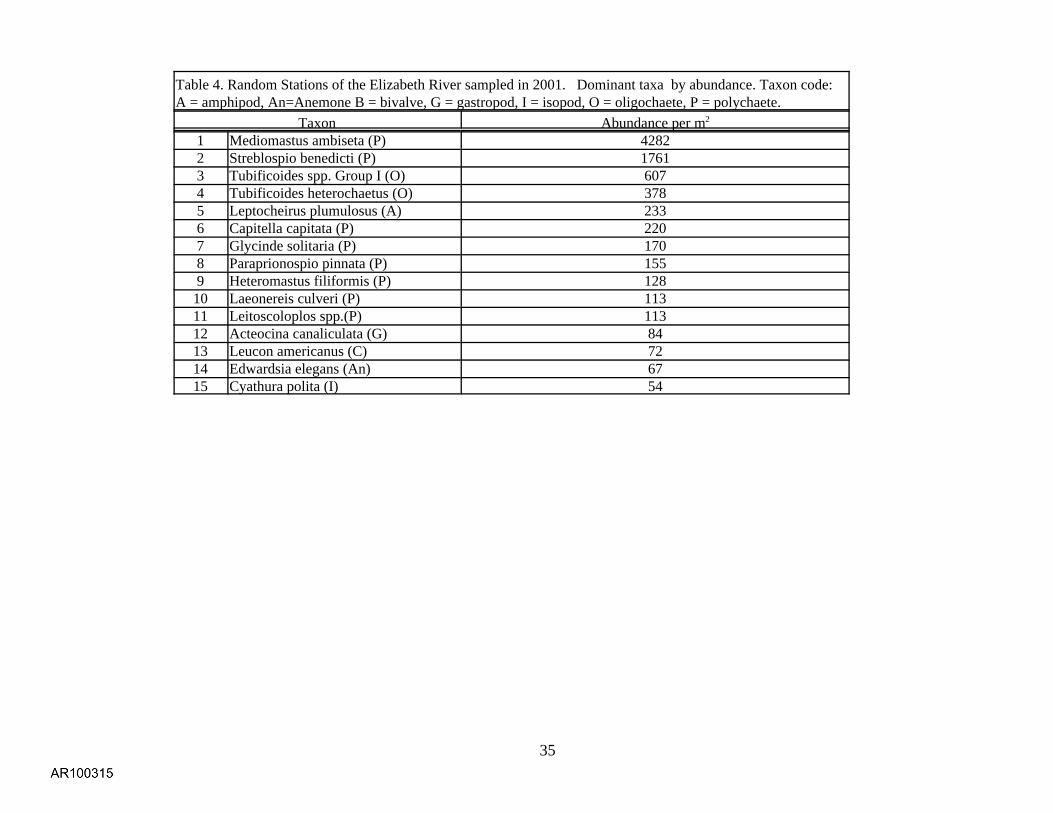
Benthic community parameters including the B-IBI value, abundance, biomass, Shannondiversity and selected metrics are summarized by station in Table 2. The average BIBI values forthe 25 random sites was 2.7. The distribution of the random sites and benthic communitycondition designations are shown in Figure 3. For the 2001 data 52 ± 9.7 % of the watershed haddegraded benthos. Individual metric scores incorporated in the B-IBI are presented in Table 3. The dominant taxa of the random sites are summarized in Table 4.
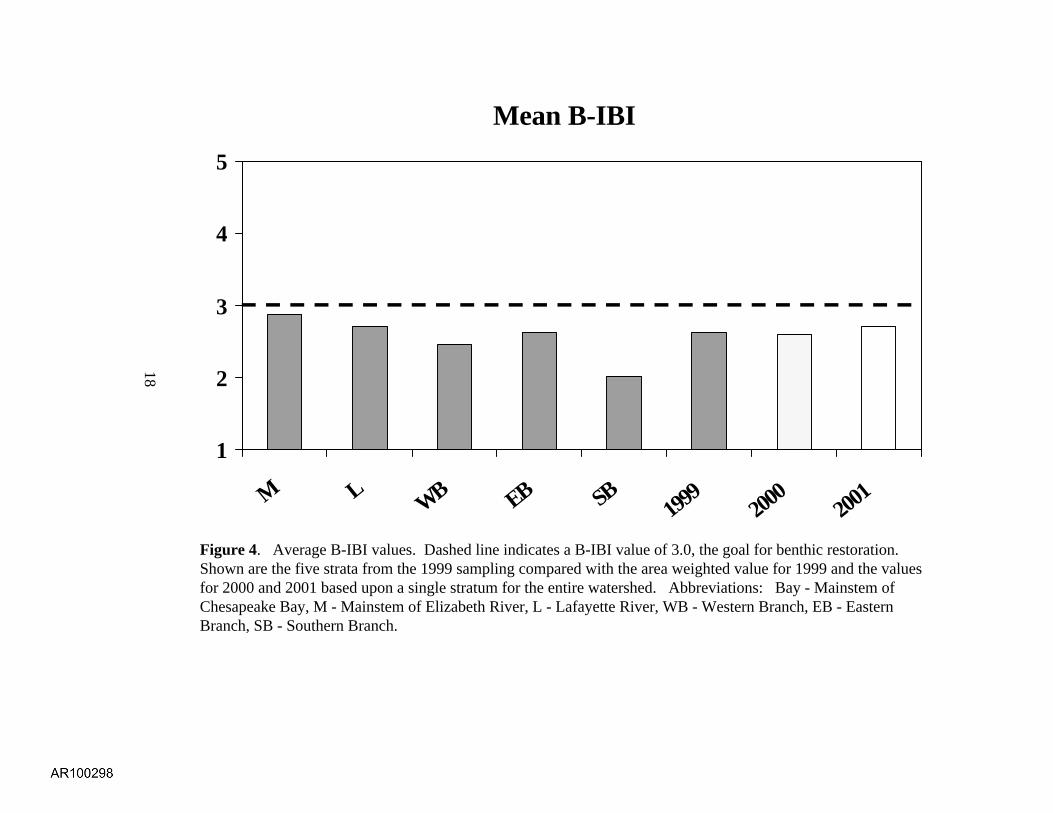
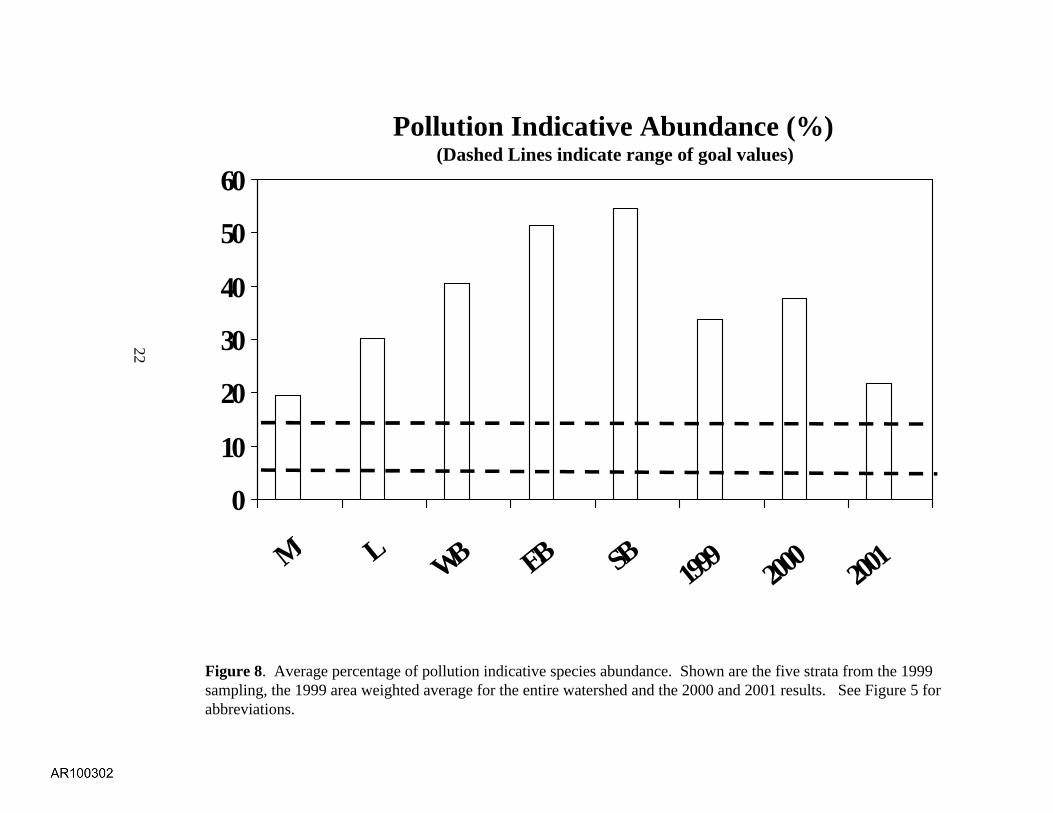
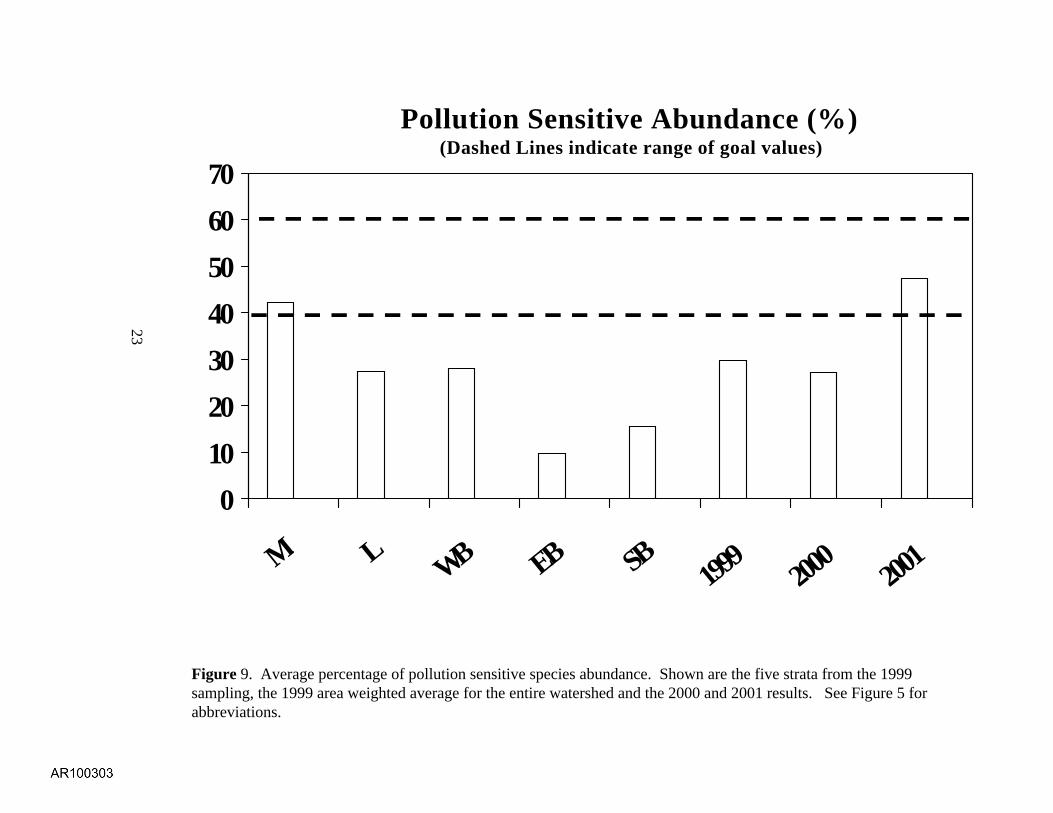
The B-IBI value, Shannon’s index, abundance, biomass and the proportion of pollutionsensitive and pollution indicative species are shown in Figs. 4-9. In these figures the five strataof the Elizabeth River sampled in 1999 are shown. Also shown is the area weighted average forall 125 random samples from the five strata sampled in 1999. The 2000 and 2001 values arebased upon the 25 random sampled from each respective year.
Elizabeth River Watershed - Fixed-Point Stations
Environmental Parameters
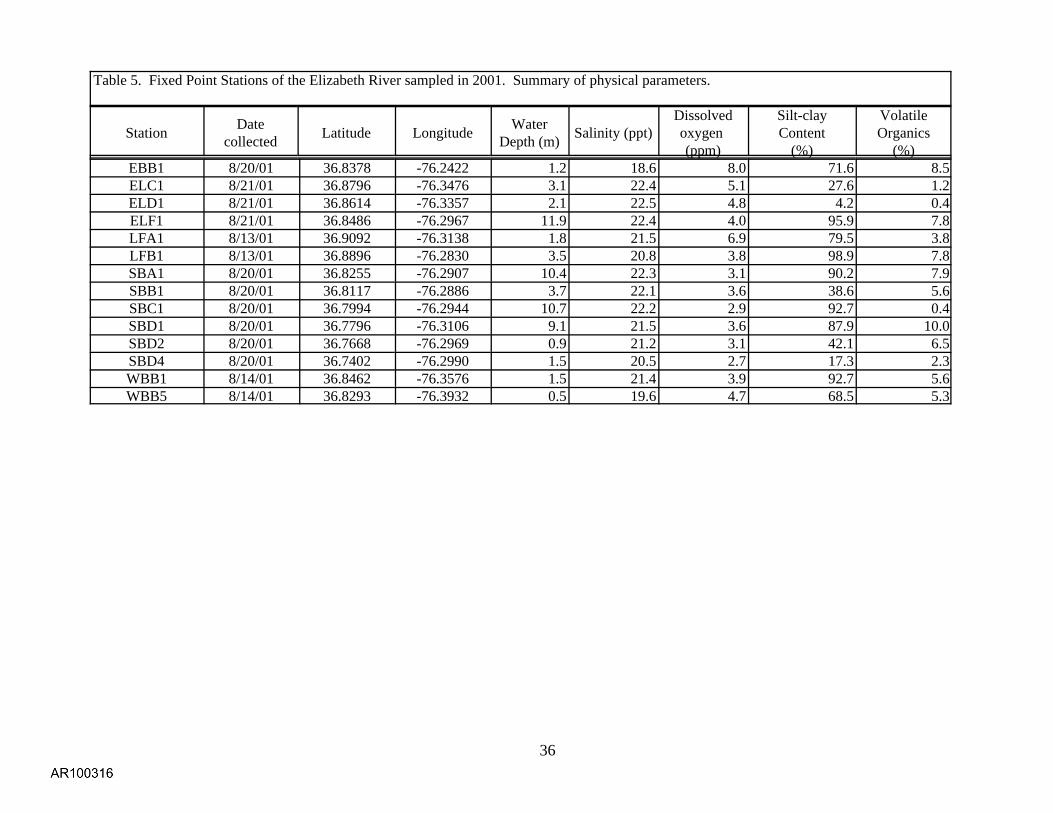
All physical, chemical and sedimentary parameters are summarized in Table 5.
Benthic Community
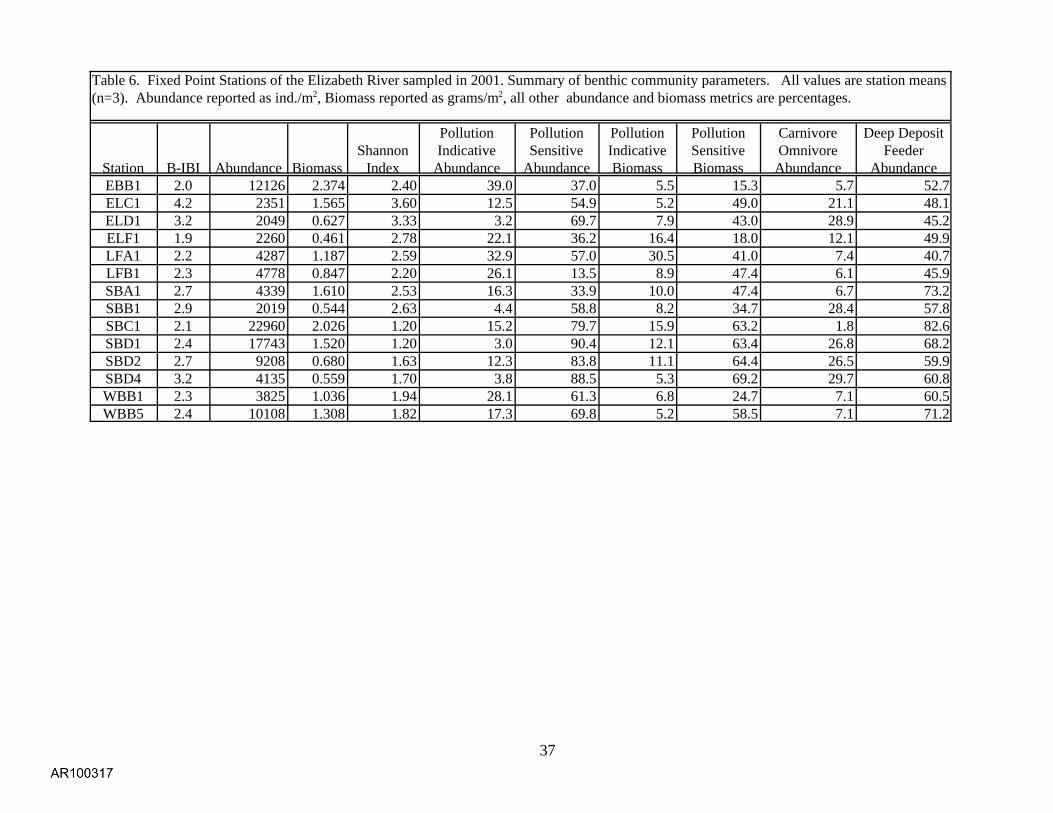
Benthic community parameters including the B-IBI value, abundance, biomass, Shannondiversity and selected metrics are summarized by station in Table 6. These stations will be thebasis for future long-term trend analyses.
Paradise Creek - Probability-Based Sampling
Environmental Parameters
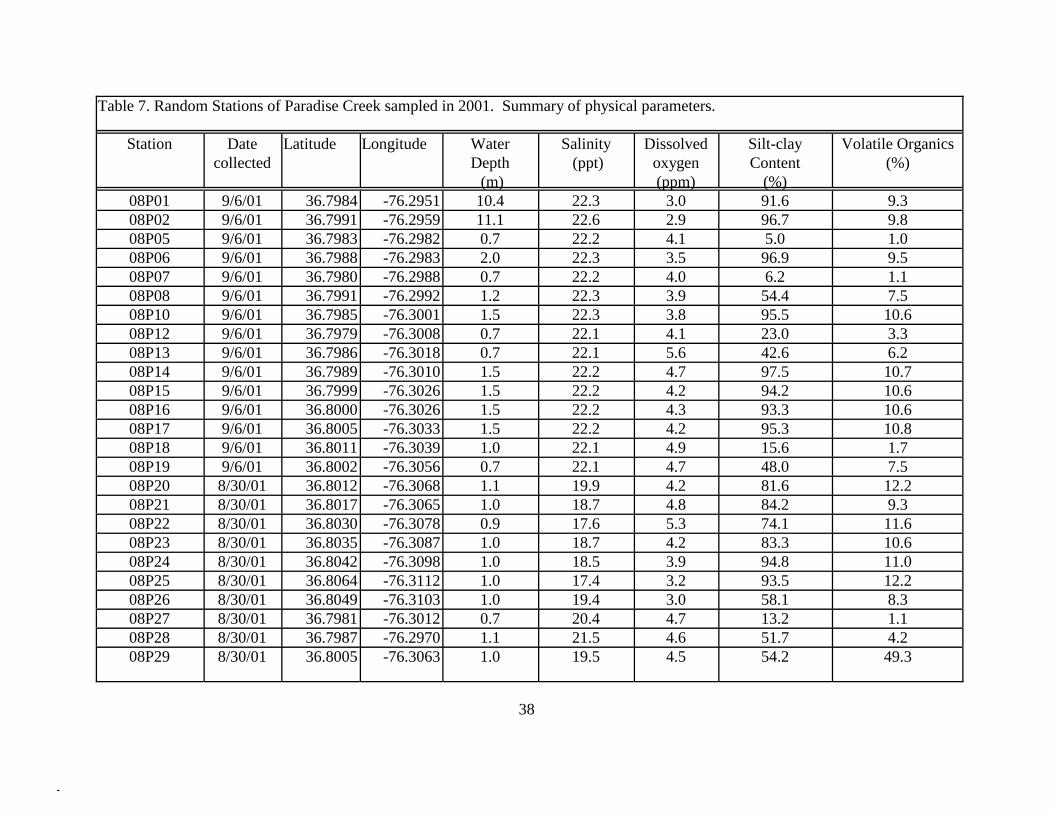
All physical, chemical and sedimentary parameters are summarized in Table 7. Waterdepths varied from less than 1m to over 11 m reflecting shoal and channel depths. All salinityvalues were in high mesohaline to the polyhaline range with values from 17.6 to 22.6 ppt. Bottom dissolved oxygen varied from 2.9 to 5.6 ppm. Silt-clay content was generally in the highrange with most values in excess of 50%. Reflecting the high silt-clay content, most total
9
volatile solids values were greater than than 5 %.
Benthic Community Condition
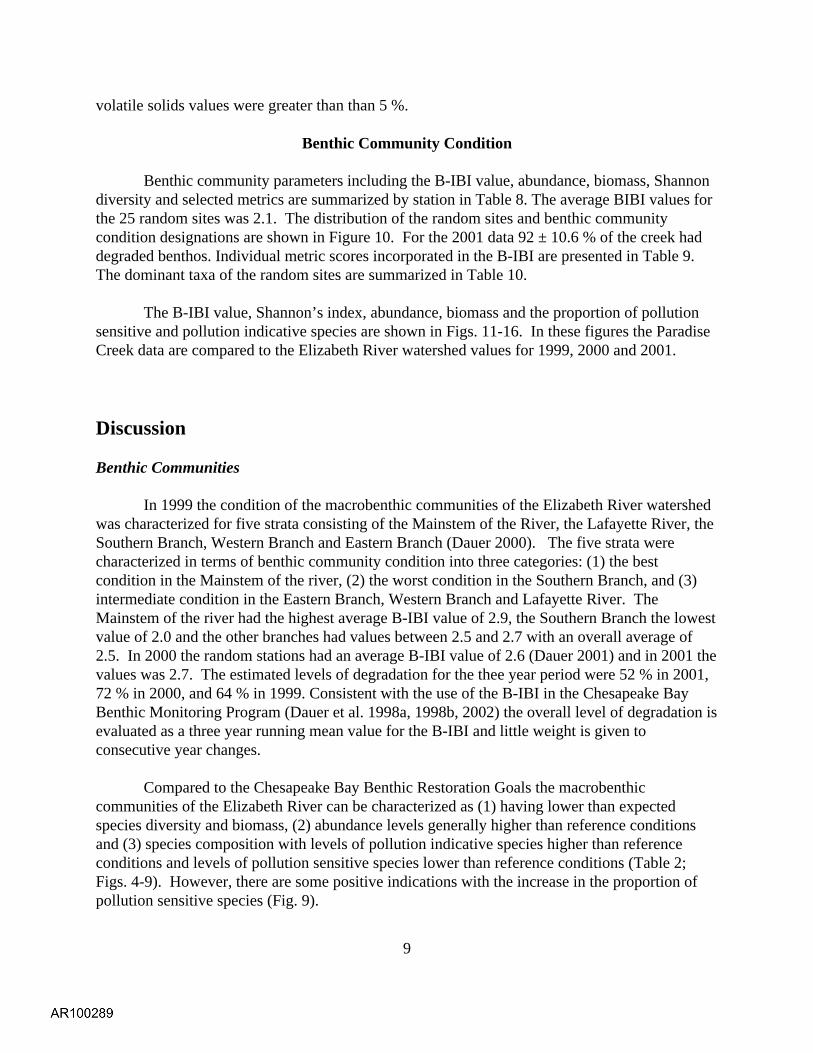
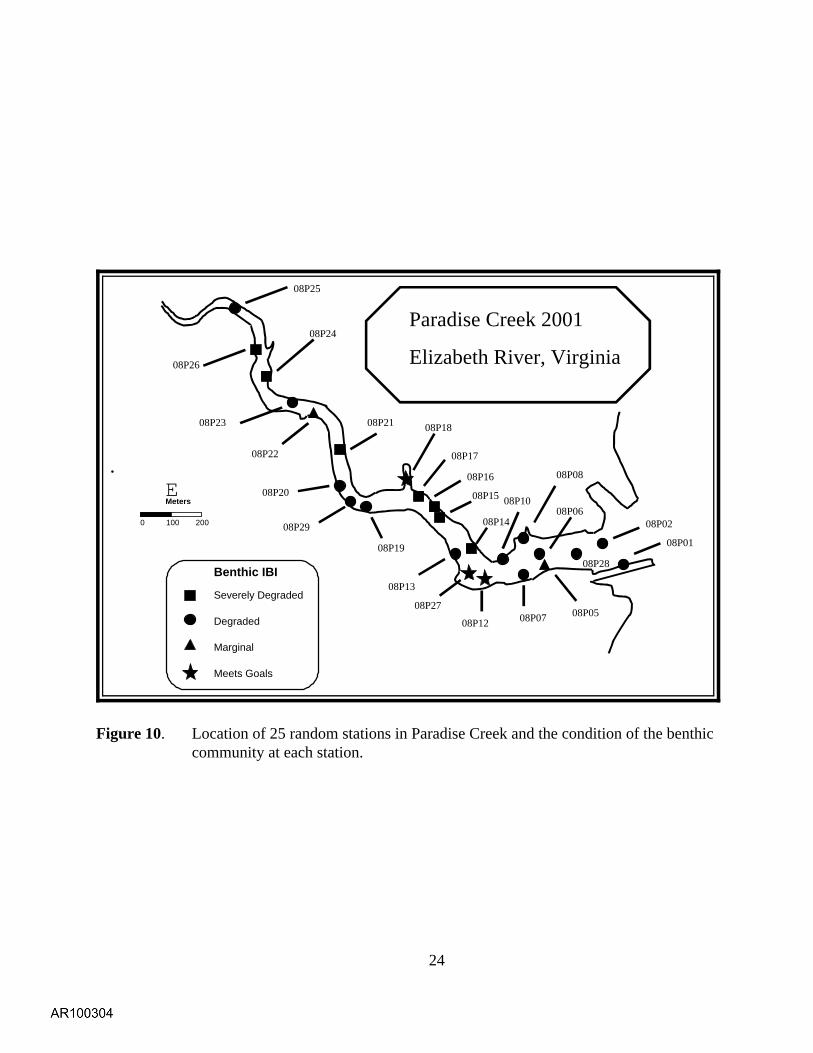
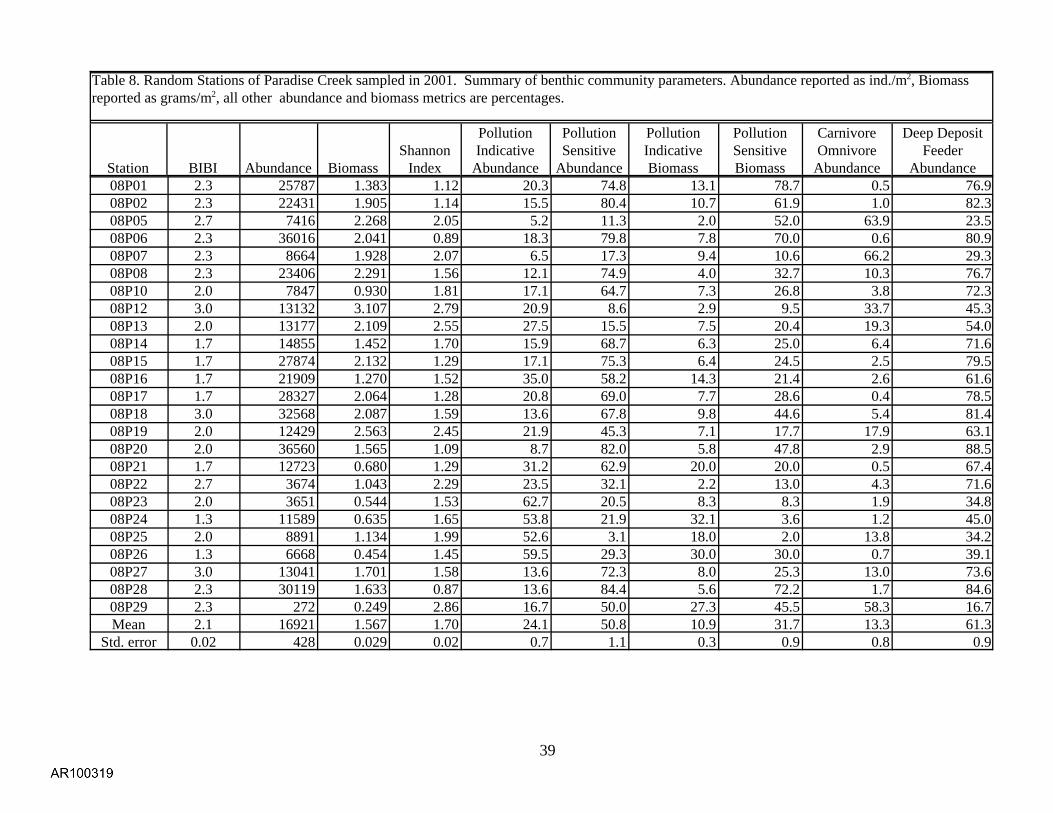
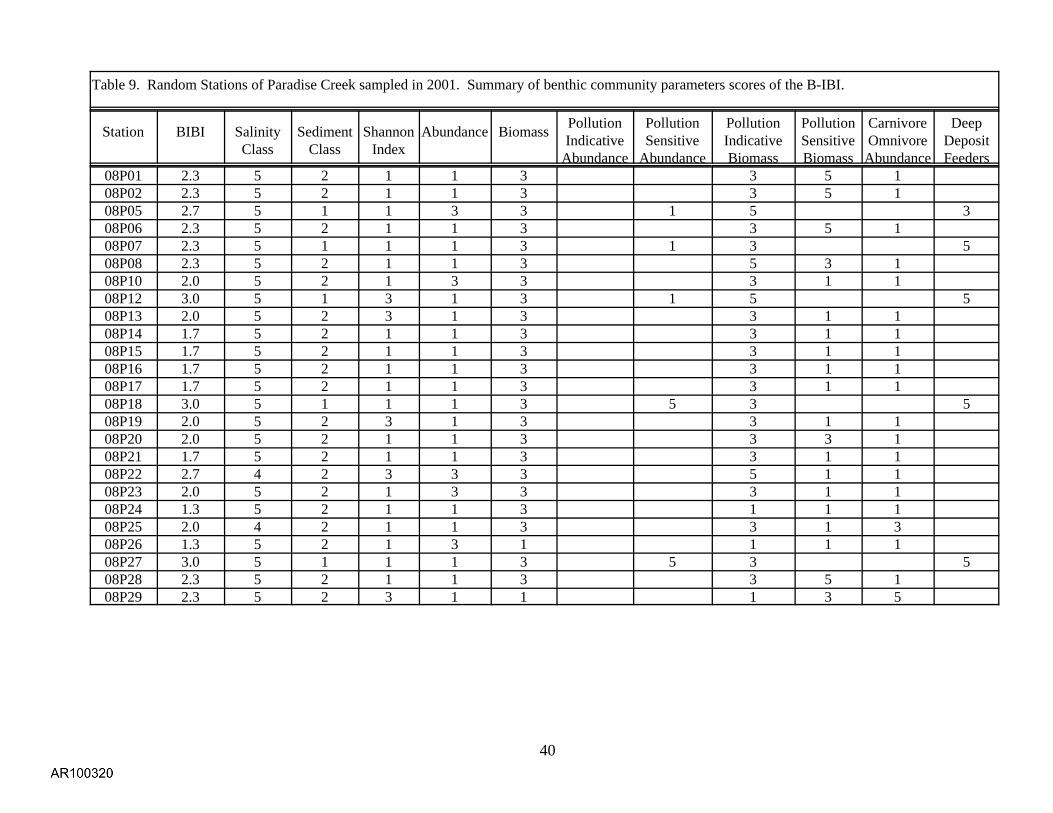
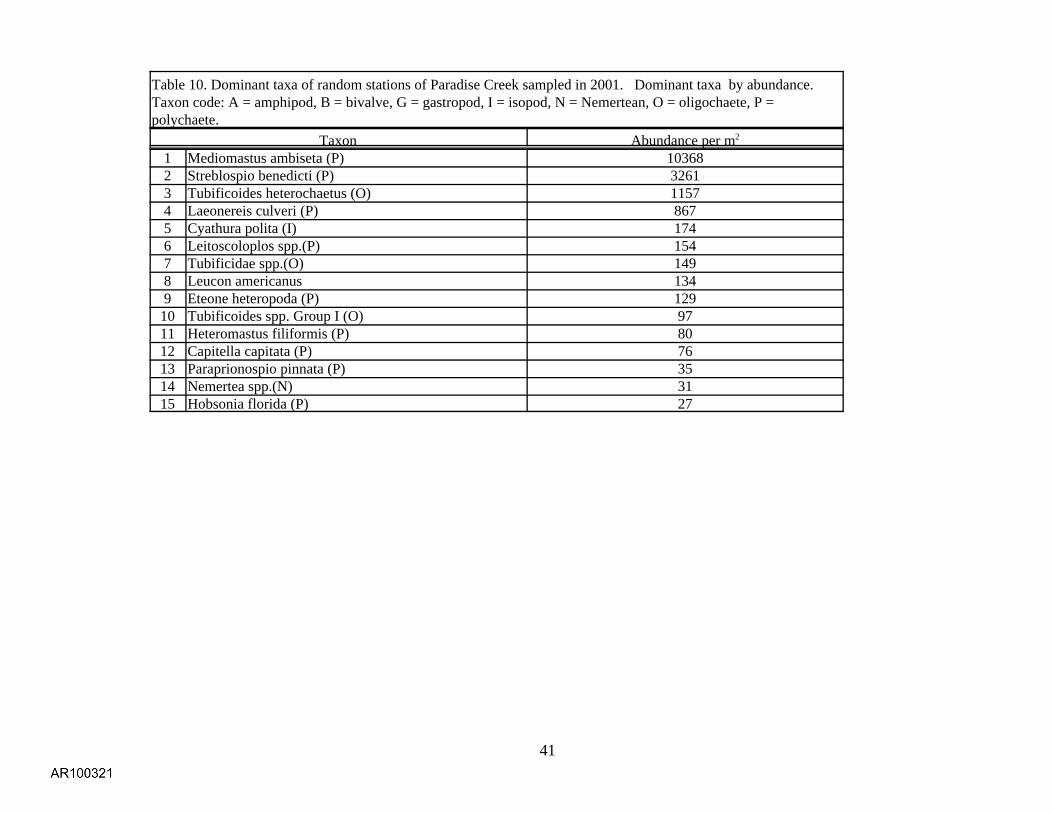
Benthic community parameters including the B-IBI value, abundance, biomass, Shannondiversity and selected metrics are summarized by station in Table 8. The average BIBI values forthe 25 random sites was 2.1. The distribution of the random sites and benthic communitycondition designations are shown in Figure 10. For the 2001 data 92 ± 10.6 % of the creek haddegraded benthos. Individual metric scores incorporated in the B-IBI are presented in Table 9. The dominant taxa of the random sites are summarized in Table 10.
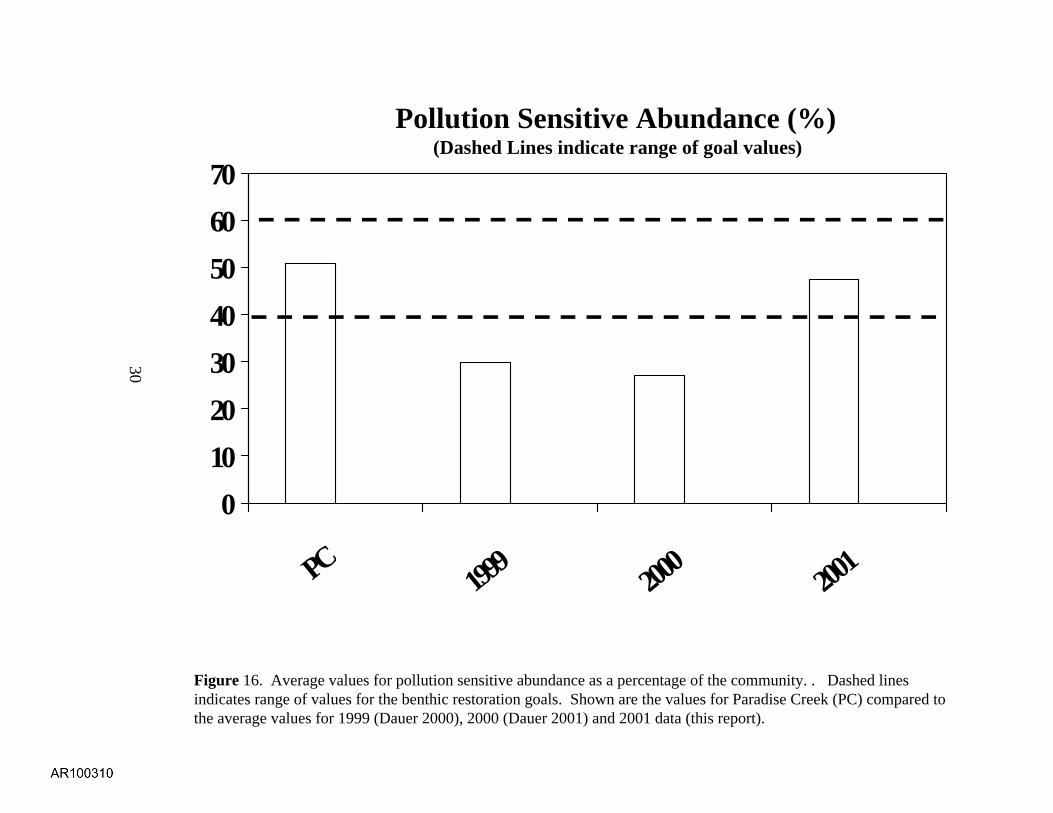
The B-IBI value, Shannon’s index, abundance, biomass and the proportion of pollutionsensitive and pollution indicative species are shown in Figs. 11-16. In these figures the ParadiseCreek data are compared to the Elizabeth River watershed values for 1999, 2000 and 2001.
Discussion
Benthic Communities
In 1999 the condition of the macrobenthic communities of the Elizabeth River watershedwas characterized for five strata consisting of the Mainstem of the River, the Lafayette River, theSouthern Branch, Western Branch and Eastern Branch (Dauer 2000). The five strata werecharacterized in terms of benthic community condition into three categories: (1) the bestcondition in the Mainstem of the river, (2) the worst condition in the Southern Branch, and (3)intermediate condition in the Eastern Branch, Western Branch and Lafayette River. TheMainstem of the river had the highest average B-IBI value of 2.9, the Southern Branch the lowestvalue of 2.0 and the other branches had values between 2.5 and 2.7 with an overall average of2.5. In 2000 the random stations had an average B-IBI value of 2.6 (Dauer 2001) and in 2001 thevalues was 2.7. The estimated levels of degradation for the thee year period were 52 % in 2001,72 % in 2000, and 64 % in 1999. Consistent with the use of the B-IBI in the Chesapeake BayBenthic Monitoring Program (Dauer et al. 1998a, 1998b, 2002) the overall level of degradation isevaluated as a three year running mean value for the B-IBI and little weight is given toconsecutive year changes.
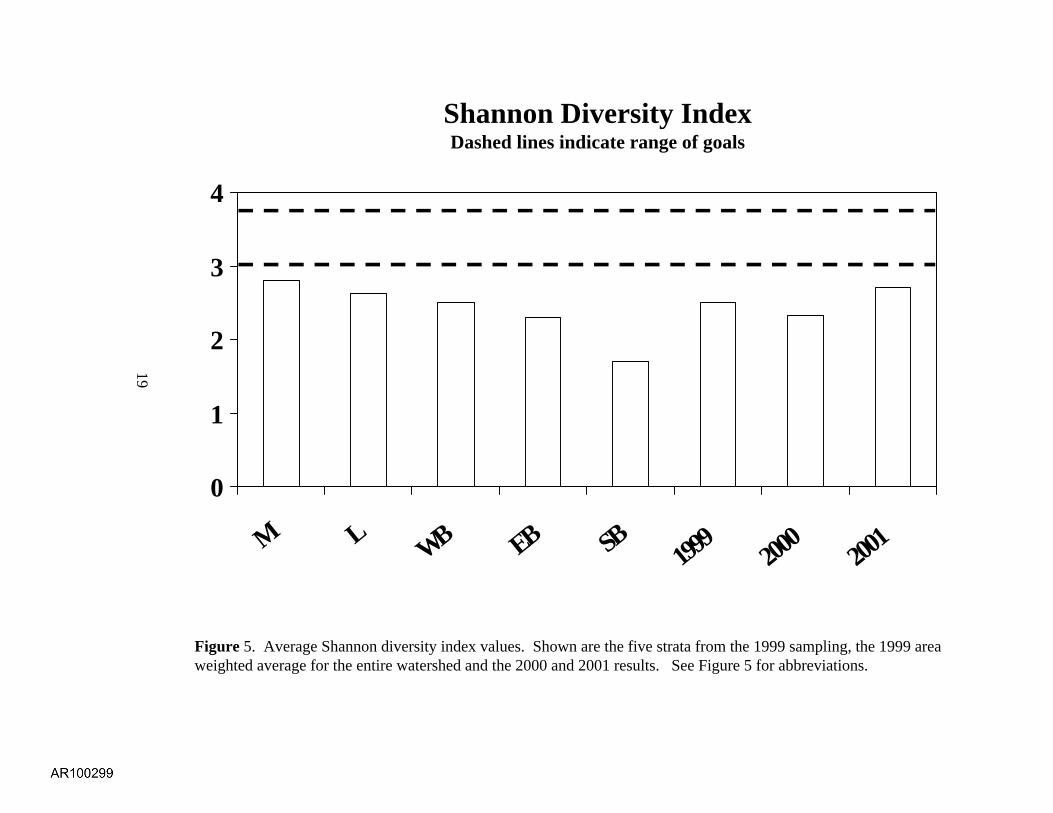
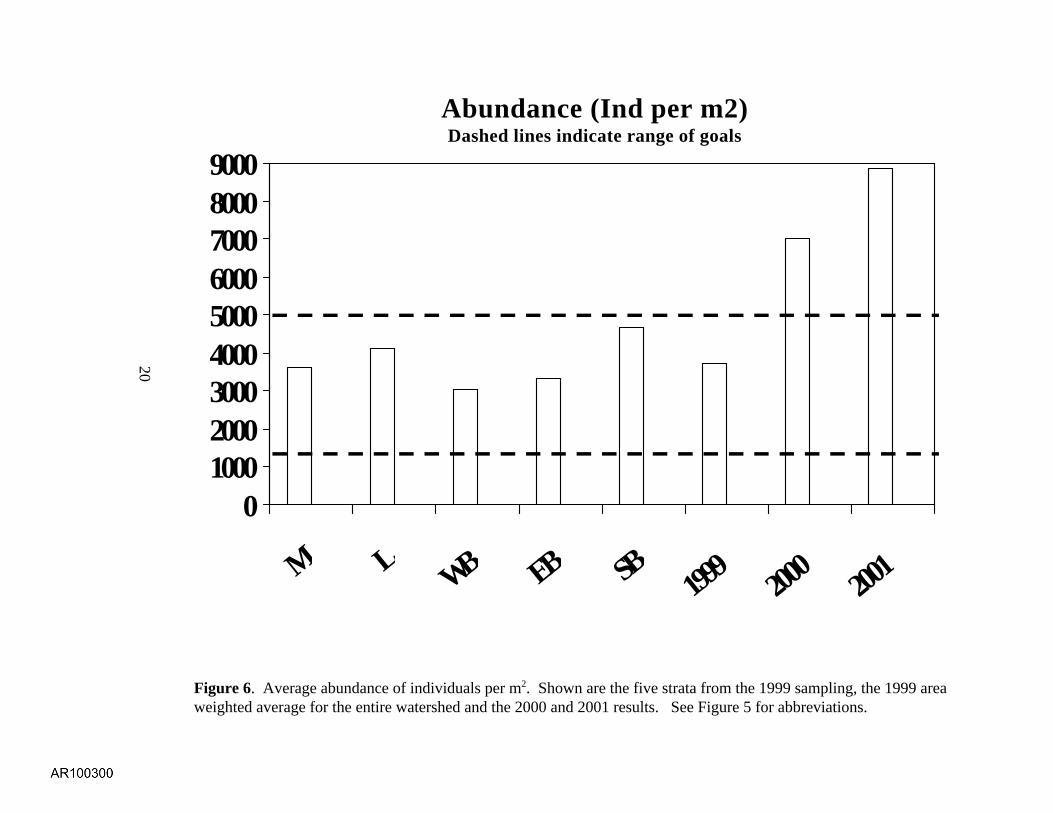
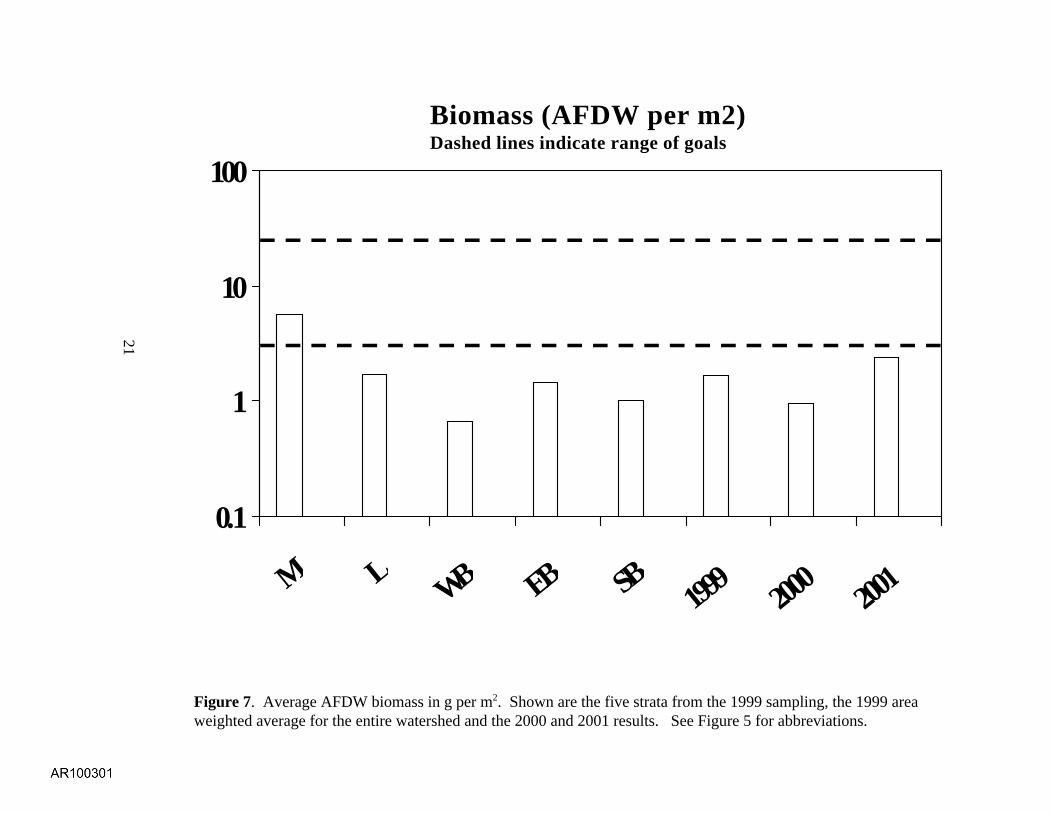
Compared to the Chesapeake Bay Benthic Restoration Goals the macrobenthiccommunities of the Elizabeth River can be characterized as (1) having lower than expectedspecies diversity and biomass, (2) abundance levels generally higher than reference conditionsand (3) species composition with levels of pollution indicative species higher than referenceconditions and levels of pollution sensitive species lower than reference conditions (Table 2;Figs. 4-9). However, there are some positive indications with the increase in the proportion ofpollution sensitive species (Fig. 9).
10
Paradise Creek
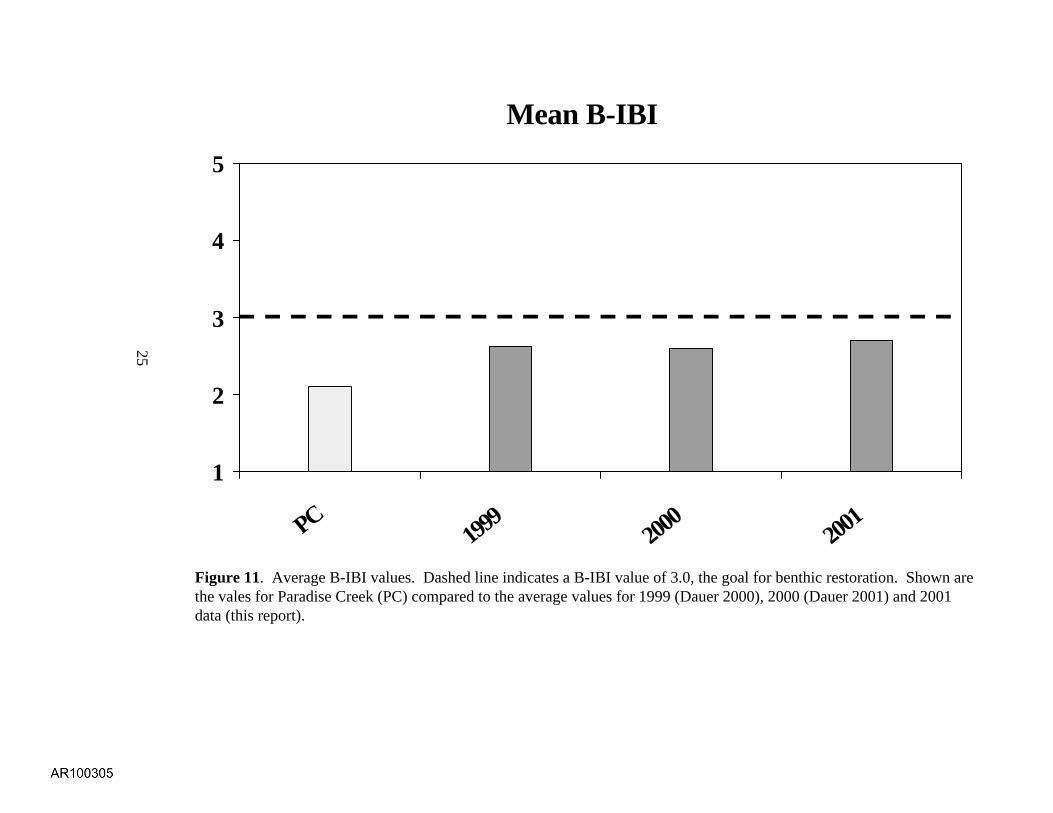
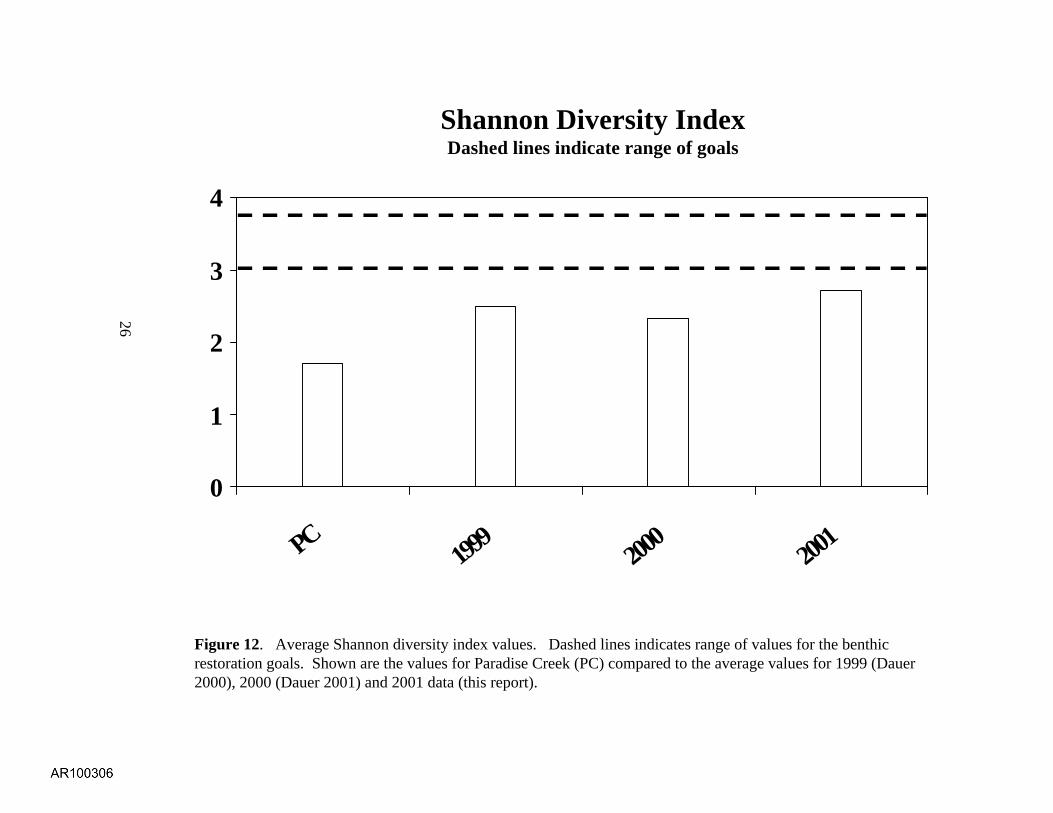
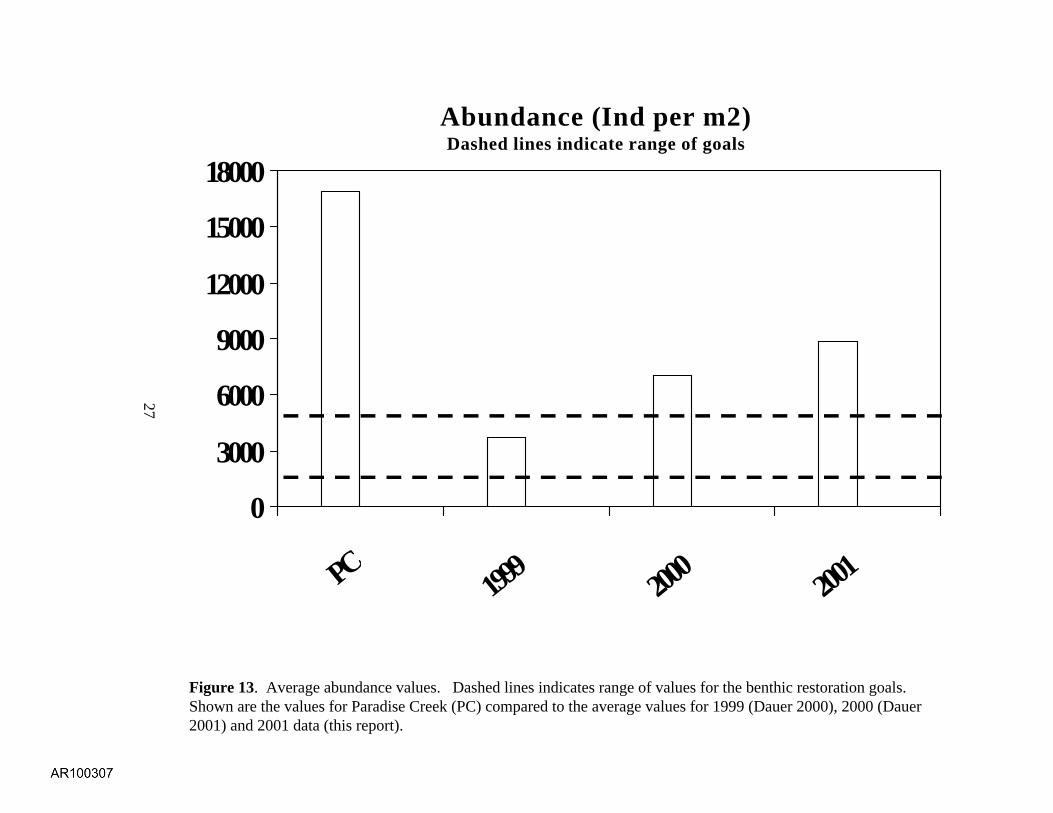
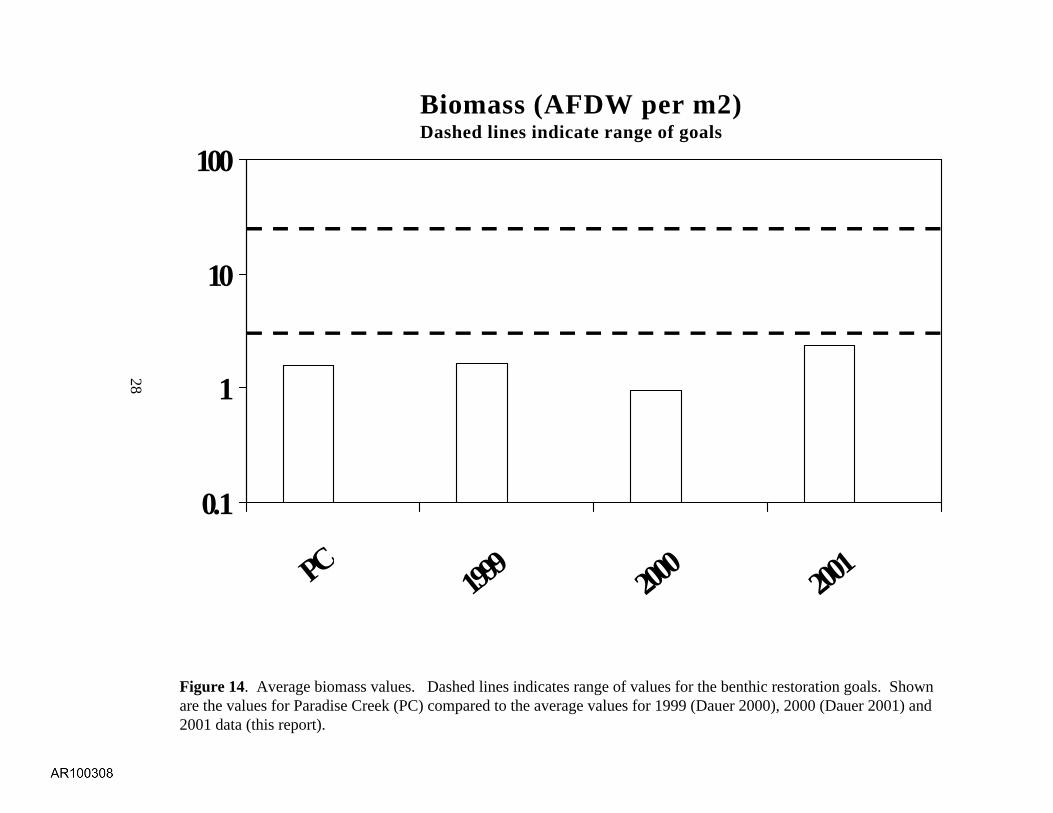
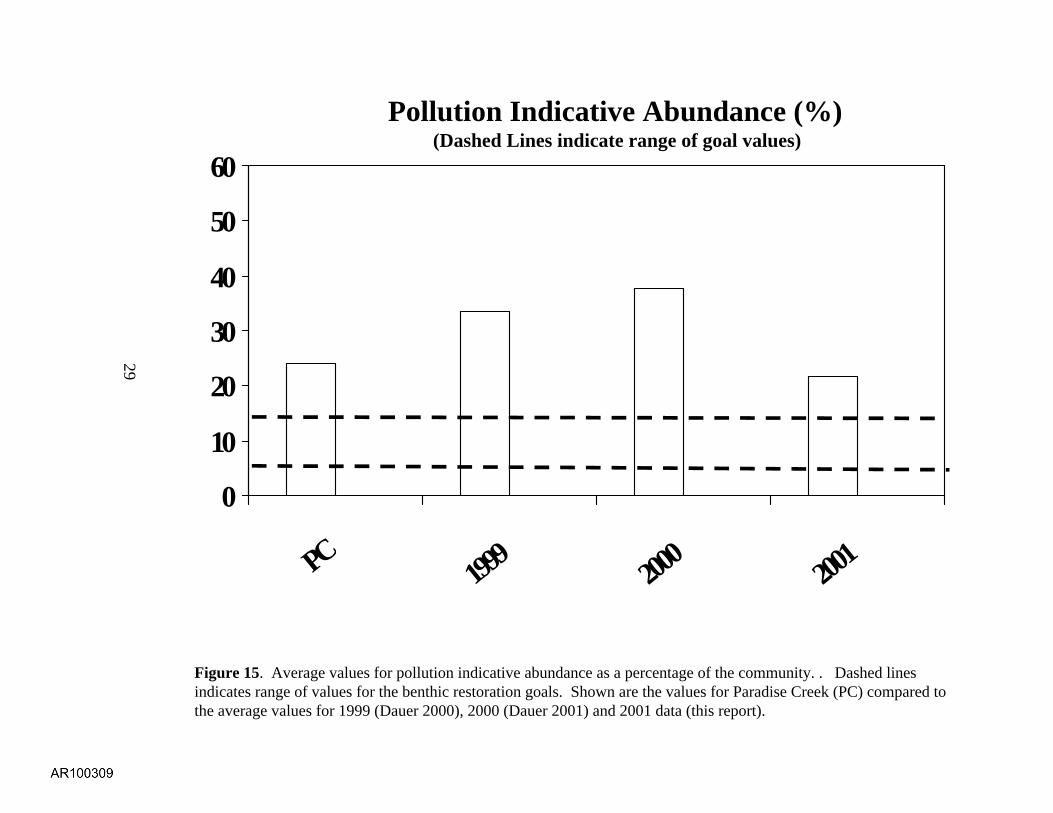
The level of degradation in Paradise Creek was 92%, the same value for the entireSouthern Branch from the intensive 1999 sampling (Dauer 2000). Over 50% of the stationssampled in Paradise Creek had BIBI values equal to or less than 2.0. The average BIBI value forParadise Creek was 2.1, lower than the Elizabeth River in general (Fig. 11). In general thecondition of the benthos of Paradise Creek is consistent with the description of the ElizabethRiver: (1) lower than expected species diversity and biomass (Figs. 12,14), (2) abundance levelsgenerally higher than reference conditions (Fig. 13) and (3) species composition with levels ofpollution indicative species higher than reference conditions (Fig. 15) and levels of pollutionsensitive species within reference conditions (Fig. 16). There are no major differences in thedominant species of Paradise Creek compared to the Elizabeth River (compare Tables 4 and 10). Both are dominated by the polychaetes Mediomastus ambiseta and Streblospio benedicti whichaccount for 86 % of all individuals in the Elizabeth River and 81% of the individuals in ParadiseCreek.
REFERENCES
Alden, R.W. III, D.M. Dauer, J.A. Ranasinghe, L.C. Scott, and R.J. Llansó. 2002. StatisticalVerification of the Chesapeake Bay Benthic Index of Biotic Integrity. Environmetrics INPRESS.
Bilyard, G. R. 1987. The value of benthic infauna in marine pollution monitoring studies. MarinePollution Bulletin 18:581-585.
Boesch, D.F. 1973. Classification and community structure of macrobenthos in the HamptonRoads area, Virginia. Marine Biology 21: 226-244.
Boesch, D. F. and R. Rosenberg. 1981. Response to stress in marine benthic communities, p.179-200. In G. W. Barret and R. Rosenberg (eds.), Stress Effects on Natural Ecosystems. John Wiley & Sons, New York.
Dauer, D.M. 1993. Biological criteria, environmental health and estuarine macrobenthiccommunity structure. Marine Pollution Bulletin 26: 249-257.
Dauer, D.M. 2000. Benthic Biological Monitoring Program of the Elizabeth River Watershed(1999). Final Report to the Virginia Department of Environmental Quality, ChesapeakeBay Program, 73 pp.
Dauer, D.M. 2001. Benthic Biological Monitoring Program of the Elizabeth River Watershed(2000). Final Report to the Virginia Department of Environmental Quality, ChesapeakeBay Program, 35 pp. Plus Appendix.
11
Dauer, D.M., M. F. Lane, H.G. Marshall, K.E. Carpenter. 1998a. Status and trends in waterquality and living resources in the Virginia Chesapeake Bay: 1985-1997. Final report tothe Virginia Department of Environmental Quality. 84 pages.
Dauer, D.M., M. F. Lane, H.G. Marshall, K.E. Carpenter and J.R. Donat. 2002. Status and trendsin water quality and living resources in the Virginia Chesapeake Bay: 1985-2000. Finalreport to the Virginia Department of Environmental Quality. 149 pp.
Dauer, D.M. and R. J. Llansó. 2002. Spatial scales and probability based sampling in determining levels of benthic community degradation in the Chesapeake Bay. Environmental Monitoring and Assessment IN PRESS.
Dauer, D.M, M.W. Luchenback, and A.J. Rodi, Jr. 1993. Abundance biomass comparisons(ABC method): Effects of an estuary gradient, anoxic/hypoxic events and contaminatedsediments. Marine Biology 116:507-518.
Dauer, D.M., H.G. Marshall, K.E. Carpenter, M. F. Lane, R.W. Alden, III, K.K. Nesius and L.W.Haas. 1998b. Virginia Chesapeake Bay water quality and living resources monitoringprograms: Executive Report, 1985-1996. Final report to the Virginia Department ofEnvironmental Quality. 28 pages.
Dauer, D.M., J. A. Ranasinghe, and S. B. Weisberg. 2000. Relationships between benthiccommunity condition, water quality, sediment quality, nutrient loads, and land usepatterns in Chesapeake Bay. Estuaries 23: 80-96.
Dauer, D.M. and A.J. Rodi, Jr. 1999. Baywide benthic community condition based upon 1998random probability based sampling. Final report to the Virginia Department ofEnvironmental Quality. 126 pp.
Folk, R.L. 1974. Petrology of sedimentary rocks. Hemphills, Austin, 170 pp.
Gray, J. S. 1979. Pollution-induced changes in populations. Transactions of the RoyalPhilosophical Society of London (B) 286:545-561.
Hawthorne, S.D. and D.M. Dauer. 1983. Macrobenthic communities of the lower ChesapeakeBay. III. Southern Branch of the Elizabeth River. Internationale Revue der gesamtenHydrobiologie 68: 193-205.
Hunley, W.S. 1993. Evaluation of long term changes in the macrobenthic community of theSouthern Branch of the Elizabeth River, Virginia. Master’s Thesis. Old DominionUniversity. 120 pp.
Karr, J. R., K. D. Fausch, P. L. Angermeier, P. R. Yant, and I. J. Schlosser. 1986. Assessing
12
biological integrity in running waters: A method and its rationale. Special Publication 5.Illinois Natural History Survey, Champaign, Illinois.
Long, E. R., D. D. McDonald, S. L. Smith, and F. D. Calder. 1995. Incidence of adversebiological effects within ranges of chemical concentrations in marine and estuarinesediments. Environmental Management 19:81-95.
Pearson, T. H. and R. Rosenberg. 1978. Macrobenthic succession in relation to organicenrichment and pollution of the marine environment. Oceanography and Marine BiologyAnnual Review 16:229-311.
Ranasinghe, J.A., L.C. Scott and F.S. Kelley. 1998. Chesapeake Bay water quality monitoringprogram: Long-term benthic monitoring and assessment component, Level 1Comprehensive Report (July 1984-December 1997). Prepared for the MarylandDepartment of Natural Resources by Versar, Ins, Columbia, MD.
Ranasinghe, J.A., S.B. Weisberg, D.M. Dauer, L.C. Schaffner, R.J. Diaz and J.B. Frithsen. 1994. Chesapeake Bay benthic community restoration goals. Report for the U.S. EnvironmentalProtection Agency, Chesapeake Bay Office and the Maryland Department of NaturalResources. 49 pp.
Rhoads, D. C., P. L. McCall, and J. Y. Yingst. 1978. Disturbance and production on the estuarinesea floor. American Scientist 66:577-586.
Tapp, J. F., N. Shillabeer, and C. M. Ashman. 1993. Continued observation of the benthic faunaof the industrialized Tees estuary, 1979-1990. Journal of Experimental Marine Biologyand Ecology 172:67-80.
Weisberg, S.B., J.A. Ranasinghe, D.M. Dauer, L.C. Schaffner, R.J. Diaz and J.B. Frithsen. 1997. An estuarine benthic index of biotic integrity (B-IBI) for Chesapeake Bay. Estuaries 20:149-158.
Wilson, J. G. and D. W. Jeffrey. 1994. Benthic biological pollution indices in estuaries, p. 311-327. In J. M. Kramer (ed.), Biomonitoring of Coastal Waters and Estuaries. CRC Press,Boca Raton, Florida.
13
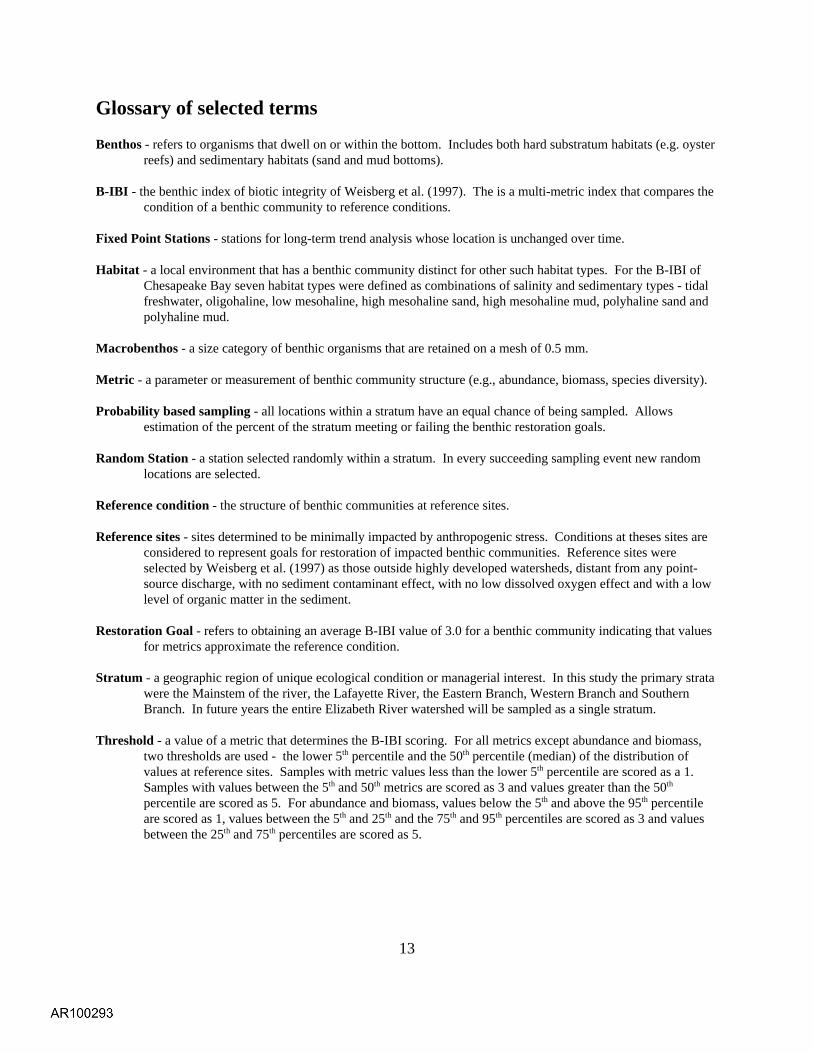
Glossary of selected terms
Benthos - refers to organisms that dwell on or within the bottom. Includes both hard substratum habitats (e.g. oysterreefs) and sedimentary habitats (sand and mud bottoms).
B-IBI - the benthic index of biotic integrity of Weisberg et al. (1997). The is a multi-metric index that compares thecondition of a benthic community to reference conditions.
Fixed Point Stations - stations for long-term trend analysis whose location is unchanged over time.
Habitat - a local environment that has a benthic community distinct for other such habitat types. For the B-IBI ofChesapeake Bay seven habitat types were defined as combinations of salinity and sedimentary types - tidalfreshwater, oligohaline, low mesohaline, high mesohaline sand, high mesohaline mud, polyhaline sand andpolyhaline mud.
Macrobenthos - a size category of benthic organisms that are retained on a mesh of 0.5 mm.
Metric - a parameter or measurement of benthic community structure (e.g., abundance, biomass, species diversity).
Probability based sampling - all locations within a stratum have an equal chance of being sampled. Allowsestimation of the percent of the stratum meeting or failing the benthic restoration goals.
Random Station - a station selected randomly within a stratum. In every succeeding sampling event new randomlocations are selected.
Reference condition - the structure of benthic communities at reference sites.
Reference sites - sites determined to be minimally impacted by anthropogenic stress. Conditions at theses sites areconsidered to represent goals for restoration of impacted benthic communities. Reference sites wereselected by Weisberg et al. (1997) as those outside highly developed watersheds, distant from any point-source discharge, with no sediment contaminant effect, with no low dissolved oxygen effect and with a lowlevel of organic matter in the sediment.
Restoration Goal - refers to obtaining an average B-IBI value of 3.0 for a benthic community indicating that valuesfor metrics approximate the reference condition.
Stratum - a geographic region of unique ecological condition or managerial interest. In this study the primary stratawere the Mainstem of the river, the Lafayette River, the Eastern Branch, Western Branch and SouthernBranch. In future years the entire Elizabeth River watershed will be sampled as a single stratum.
Threshold - a value of a metric that determines the B-IBI scoring. For all metrics except abundance and biomass,two thresholds are used - the lower 5th percentile and the 50th percentile (median) of the distribution ofvalues at reference sites. Samples with metric values less than the lower 5th percentile are scored as a 1. Samples with values between the 5th and 50th metrics are scored as 3 and values greater than the 50th
percentile are scored as 5. For abundance and biomass, values below the 5th and above the 95th percentileare scored as 1, values between the 5th and 25th and the 75th and 95th percentiles are scored as 3 and valuesbetween the 25th and 75th percentiles are scored as 5.

14
Figures
15
Sampling Strata for Elizabeth River
Jones-Gilligan
Scuffeltown
Lafayette RiverMainstem
EasternBranch
WesternBranch
Southern Branch
Figure 1. Elizabeth River watershed showing the five major segments sampled in 1999. Insertshows Scuffletown Creek and the Jones-Gilligan Creek strata also sampled in 1999.
16
Fixed-Point Stations for Elizabeth River
LF-B-01
LF-A-01
EB-B-01
SB-A-01
SB-B-01
SB-D-01
SB-D-02
SB-D-04
SB-C-01
WB-B-01
WB-B-05
EL-C-01
EL-D-01 EL-F-01
Figure 2. Elizabeth River watershed showing the 14 fixed-point stations for long-term trendanalyses.
17
Random Stations for Elizabeth River
Benthic IBI
Severely Degraded
Degraded
Marginal
Meets Goals
Benthic IBI
Severely Degraded
Degraded
Marginal
Meets Goals
08Z01 08Z02
08Z03
08Z04
08Z06 08Z07
08Z05
08Z08
08Z09
08Z1008Z11
08Z13
08Z12
08Z14
08Z17
08Z18
08Z19
08Z20
08Z21
08Z22
08Z23
08Z24
08Z27
08Z28
08Z30
Figure 3. Map showing the 25 random locations sampled in 2001 and indicating the stationnumbers and condition of the benthic communities.
18
1
2
3
4
5
M L WB EB SB 1999
2000
2001
Mean B-IBI
Figure 4. Average B-IBI values. Dashed line indicates a B-IBI value of 3.0, the goal for benthic restoration. Shown are the five strata from the 1999 sampling compared with the area weighted value for 1999 and the valuesfor 2000 and 2001 based upon a single stratum for the entire watershed. Abbreviations: Bay - Mainstem ofChesapeake Bay, M - Mainstem of Elizabeth River, L - Lafayette River, WB - Western Branch, EB - EasternBranch, SB - Southern Branch.
19
0
1
2
3
4
M L WB EB SB 1999
2000
2001
Shannon Diversity IndexDashed lines indicate range of goals
Figure 5. Average Shannon diversity index values. Shown are the five strata from the 1999 sampling, the 1999 areaweighted average for the entire watershed and the 2000 and 2001 results. See Figure 5 for abbreviations.
20
0100020003000400050006000700080009000
M L WB EB SB 1999
2000
2001
Abundance (Ind per m2)Dashed lines indicate range of goals
Figure 6. Average abundance of individuals per m2. Shown are the five strata from the 1999 sampling, the 1999 areaweighted average for the entire watershed and the 2000 and 2001 results. See Figure 5 for abbreviations.
21
0.1
1
10
100
M L WB EB SB 1999
2000
2001
Biomass (AFDW per m2)Dashed lines indicate range of goals
Figure 7. Average AFDW biomass in g per m2. Shown are the five strata from the 1999 sampling, the 1999 areaweighted average for the entire watershed and the 2000 and 2001 results. See Figure 5 for abbreviations.
22
0
10
20
30
40
50
60
M L WB EB SB 1999
2000
2001
Pollution Indicative Abundance (%) (Dashed Lines indicate range of goal values)
Figure 8. Average percentage of pollution indicative species abundance. Shown are the five strata from the 1999sampling, the 1999 area weighted average for the entire watershed and the 2000 and 2001 results. See Figure 5 forabbreviations.
23
0
10
20
30
40
50
60
70
M L WB EB SB 1999
2000
2001
Pollution Sensitive Abundance (%) (Dashed Lines indicate range of goal values)
Figure 9. Average percentage of pollution sensitive species abundance. Shown are the five strata from the 1999sampling, the 1999 area weighted average for the entire watershed and the 2000 and 2001 results. See Figure 5 forabbreviations.
24
Meters
2001000
E
Paradise Creek 2001
Elizabeth River, Virginia
Benthic IBI
Severely Degraded
Degraded
Marginal
Meets Goals
08P01
08P02
08P05
08P06
08P07
08P08
08P10
08P12
08P13
08P27
08P15
08P16
08P17
08P18
08P14
08P20
08P19
08P21
08P22
08P23
08P24
08P25
08P26
08P28
08P29
.
.
Figure 10. Location of 25 random stations in Paradise Creek and the condition of the benthic community at each station.
25
1
2
3
4
5
PC199
9200
0200
1
Mean B-IBI
Figure 11. Average B-IBI values. Dashed line indicates a B-IBI value of 3.0, the goal for benthic restoration. Shown arethe vales for Paradise Creek (PC) compared to the average values for 1999 (Dauer 2000), 2000 (Dauer 2001) and 2001data (this report).
26
0
1
2
3
4
PC199
9200
0200
1
Shannon Diversity IndexDashed lines indicate range of goals
Figure 12. Average Shannon diversity index values. Dashed lines indicates range of values for the benthicrestoration goals. Shown are the values for Paradise Creek (PC) compared to the average values for 1999 (Dauer2000), 2000 (Dauer 2001) and 2001 data (this report).
27
0
3000
6000
9000
12000
15000
18000
PC 1999
2000
2001
Abundance (Ind per m2)Dashed lines indicate range of goals
Figure 13. Average abundance values. Dashed lines indicates range of values for the benthic restoration goals. Shown are the values for Paradise Creek (PC) compared to the average values for 1999 (Dauer 2000), 2000 (Dauer2001) and 2001 data (this report).
28
0.1
1
10
100
PC 1999
2000
2001
Biomass (AFDW per m2)Dashed lines indicate range of goals
Figure 14. Average biomass values. Dashed lines indicates range of values for the benthic restoration goals. Shownare the values for Paradise Creek (PC) compared to the average values for 1999 (Dauer 2000), 2000 (Dauer 2001) and2001 data (this report).
0
10
20
30
40
50
60
PC 1999
2000
2001
Pollution Indicative Abundance (%) (Dashed Lines indicate range of goal values)
Figure 15. Average values for pollution indicative abundance as a percentage of the community. . Dashed linesindicates range of values for the benthic restoration goals. Shown are the values for Paradise Creek (PC) compared tothe average values for 1999 (Dauer 2000), 2000 (Dauer 2001) and 2001 data (this report).
29
0
10
20
30
40
50
60
70
PC 1999
2000
2001
Pollution Sensitive Abundance (%) (Dashed Lines indicate range of goal values)
Figure 16. Average values for pollution sensitive abundance as a percentage of the community. . Dashed linesindicates range of values for the benthic restoration goals. Shown are the values for Paradise Creek (PC) compared tothe average values for 1999 (Dauer 2000), 2000 (Dauer 2001) and 2001 data (this report).
30

31
Tables
32
Table 1. Random Stations of the Elizabeth River sampled in 2001. Summary of physical parameters.
Station Datecollected Latitude Longitude
WaterDepth (m)
Salinity (ppt)
Dissolvedoxygen (ppm)
Silt-clayContent
(%)
VolatileOrganics
(%)08Z01 8/21/01 36.9220 -76.3521 3.7 21.6 6.2 57.5 3.508Z02 8/21/01 36.9200 -76.3332 4.6 22.3 5.2 57.2 3.008Z03 8/21/01 36.9173 -76.3519 3.7 21.6 6.2 80.1 39.008Z04 8/13/01 36.9017 -76.3082 1.0 21.6 6.0 4.6 0.608Z05 8/13/01 36.9006 -76.2898 2.5 21.1 2.5 75.2 4.708Z06 8/13/01 36.8905 -76.2863 2.8 20.9 4.9 88.0 6.208Z07 8/13/01 36.8898 -76.2745 2.0 20.5 6.0 92.2 6.908Z08 8/30/01 36.8934 -76.2660 0.7 19.0 4.8 96.5 8.908Z09 8/21/01 36.8900 -76.3250 3.7 22.2 5.3 38.4 2.208Z10 8/21/01 36.8854 -76.3176 0.9 21.5 8.1 5.1 2.108Z11 8/21/01 36.8687 -76.3196 1.8 22.5 4.1 2.7 0.308Z12 8/14/01 36.8552 -76.3438 2.0 27.2 2.6 57.4 4.108Z13 8/14/01 36.8267 -76.3958 1.0 28.6 2.5 94.8 7.308Z14 8/21/01 36.8559 -76.3114 12.8 22.4 4.6 83.8 6.508Z17 8/20/01 36.8212 -76.2918 11.6 22.2 3.5 95.5 8.308Z18 8/20/01 36.7304 -76.3094 1.1 19.1 3.9 93.7 15.708Z19 8/20/01 36.7411 -76.2991 2.7 20.8 2.8 19.5 3.008Z20 8/20/01 36.7339 -76.2930 2.7 20.0 2.9 9.2 2.008Z21 8/20/01 36.8391 -76.2830 1.2 21.5 3.8 17.0 2.008Z22 8/20/01 36.8388 -76.2780 5.8 21.8 3.1 58.1 5.408Z23 8/20/01 36.8408 -76.2688 6.1 21.6 2.9 67.3 7.808Z24 8/20/01 36.8371 -76.2536 1.2 19.7 5.2 20.1 2.108Z27 8/14/01 36.8402 -76.3851 0.8 20.1 4.0 96.5 6.908Z28 8/20/01 36.8082 -76.2877 1.2 22.1 3.5 62.9 6.308Z30 8/21/01 36.9129 -76.3437 4.9 22.3 5.0 84.8 5.2
33
Table 2. Random Stations of the Elizabeth Rive sampled in 2001. Summary of benthic community parameters. Abundance reported as ind./m2,Biomass reported as grams/m2, all other abundance and biomass metrics are percentages.
Station BIBI Abundance BiomassShannon
Index
PollutionIndicative
Abundance
PollutionSensitive
Abundance
PollutionIndicativeBiomass
PollutionSensitiveBiomass
CarnivoreOmnivore
Abundance
Deep DepositFeeder
Abundance08Z01 2.7 3742 1.406 2.68 13.9 57.6 14.5 54.8 10.3 60.008Z02 3.7 2177 0.590 3.17 16.7 54.2 7.7 57.7 51.0 16.708Z03 3.3 3107 0.635 3.20 14.6 54.0 10.7 39.3 42.3 23.408Z04 2.7 3243 0.680 2.87 38.5 23.1 13.3 20.0 14.7 20.308Z05 3.0 7847 3.289 2.52 41.9 30.1 6.2 31.7 4.9 46.508Z06 2.7 7416 1.520 2.48 43.1 12.2 6.0 59.7 7.3 35.208Z07 2.0 9571 1.134 1.81 55.9 29.6 18.0 50.0 3.8 32.708Z08 2.0 30346 0.998 2.12 18.4 46.7 11.4 38.6 1.3 76.508Z09 3.3 2880 1.043 3.23 23.6 45.7 6.5 71.7 16.5 38.608Z10 2.7 7552 1.293 2.08 9.6 0.9 7.0 3.5 14.4 78.708Z11 4.0 3107 1.429 3.07 1.5 37.2 3.2 15.9 10.2 82.508Z12 2.0 2563 0.544 2.19 15.9 68.1 29.2 20.8 13.3 63.708Z13 3.3 7167 1.542 2.40 19.9 39.9 1.5 77.9 5.7 50.008Z14 3.0 3538 1.270 2.85 10.3 59.6 10.7 69.6 12.8 61.508Z17 3.0 2223 0.522 2.61 27.6 33.7 13.0 39.1 4.1 61.208Z18 1.3 28509 1.746 1.82 22.3 59.0 20.8 27.3 14.1 63.908Z19 2.3 10002 0.544 0.98 7.0 91.4 16.7 62.5 9.3 82.808Z20 2.7 8278 0.703 1.71 19.5 76.2 6.5 71.0 7.9 67.408Z21 3.0 12723 1.111 1.87 16.6 66.7 6.1 40.8 4.3 78.108Z22 2.0 20208 1.429 2.05 20.0 58.8 15.9 36.5 2.4 76.908Z23 2.7 1429 0.680 3.30 30.2 20.6 6.7 13.3 14.3 38.108Z24 3.0 15241 0.862 1.68 15.6 68.0 2.6 31.6 2.4 79.608Z27 3.3 5194 1.202 2.43 16.2 41.0 3.8 62.3 7.0 49.308Z28 1.7 21569 0.885 1.27 27.9 68.5 20.5 43.6 1.6 70.008Z30 3.3 2223 0.658 3.14 15.3 38.8 13.8 41.4 33.7 31.6Mean 2.7 8874 1.109 2.38 21.7 47.3 10.9 43.2 12.4 55.4
Std error 0.1 1650 0.117 0.13 2.5 4.3 1.3 4.0 2.5 4.2
34
Table 3. Random Stations of the Elizabeth River sampled in 2001. Summary of benthic community parameters scores of the B-IBI.
Station BIBI SalinityClass
SedimentClass
ShannonIndex
Abundance Biomass PollutionIndicative
Abundance
PollutionSensitive
Abundance
PollutionIndicativeBiomass
PollutionSensitiveBiomass
CarnivoreOmnivore
Abundance
DeepDepositFeeders
08Z01 2.7 5 2 3 3 3 3 3 108Z02 3.7 5 2 3 5 3 3 3 508Z03 3.3 5 2 3 3 3 3 3 508Z04 2.7 5 1 3 5 1 1 3 308Z05 3.0 5 2 3 3 5 3 3 108Z06 2.7 5 2 3 3 3 3 3 108Z07 2.0 5 2 1 1 3 3 3 108Z08 2.0 5 2 1 1 3 3 3 108Z09 3.3 5 1 3 3 3 3 3 508Z10 2.7 5 1 1 3 3 1 3 508Z11 4.0 5 1 3 5 3 3 5 508Z12 2.0 5 2 1 5 3 1 1 108Z13 3.3 5 2 3 3 3 5 5 108Z14 3.0 5 2 3 3 3 3 5 108Z17 3.0 5 2 3 5 3 3 3 108Z18 1.3 5 2 1 1 3 1 1 108Z19 2.3 5 1 1 1 1 5 1 508Z20 2.7 5 1 1 1 1 5 3 508Z21 3.0 5 1 1 1 3 5 3 508Z22 2.0 5 2 1 1 3 3 3 108Z23 2.7 5 2 5 3 3 3 1 108Z24 3.0 5 1 1 1 1 5 5 508Z27 3.3 5 2 3 3 3 5 5 108Z28 1.7 5 2 1 1 3 1 3 108Z30 3.3 5 2 3 5 3 3 3 3
35
Table 4. Random Stations of the Elizabeth River sampled in 2001. Dominant taxa by abundance. Taxon code:A = amphipod, An=Anemone B = bivalve, G = gastropod, I = isopod, O = oligochaete, P = polychaete.
Taxon Abundance per m2
1 Mediomastus ambiseta (P) 42822 Streblospio benedicti (P) 17613 Tubificoides spp. Group I (O) 6074 Tubificoides heterochaetus (O) 3785 Leptocheirus plumulosus (A) 2336 Capitella capitata (P) 2207 Glycinde solitaria (P) 1708 Paraprionospio pinnata (P) 1559 Heteromastus filiformis (P) 12810 Laeonereis culveri (P) 11311 Leitoscoloplos spp.(P) 11312 Acteocina canaliculata (G) 8413 Leucon americanus (C) 7214 Edwardsia elegans (An) 6715 Cyathura polita (I) 54
36
Table 5. Fixed Point Stations of the Elizabeth River sampled in 2001. Summary of physical parameters.
Station Datecollected Latitude Longitude Water
Depth (m) Salinity (ppt)Dissolvedoxygen (ppm)
Silt-clayContent
(%)
VolatileOrganics
(%)EBB1 8/20/01 36.8378 -76.2422 1.2 18.6 8.0 71.6 8.5ELC1 8/21/01 36.8796 -76.3476 3.1 22.4 5.1 27.6 1.2ELD1 8/21/01 36.8614 -76.3357 2.1 22.5 4.8 4.2 0.4ELF1 8/21/01 36.8486 -76.2967 11.9 22.4 4.0 95.9 7.8LFA1 8/13/01 36.9092 -76.3138 1.8 21.5 6.9 79.5 3.8LFB1 8/13/01 36.8896 -76.2830 3.5 20.8 3.8 98.9 7.8SBA1 8/20/01 36.8255 -76.2907 10.4 22.3 3.1 90.2 7.9SBB1 8/20/01 36.8117 -76.2886 3.7 22.1 3.6 38.6 5.6SBC1 8/20/01 36.7994 -76.2944 10.7 22.2 2.9 92.7 0.4SBD1 8/20/01 36.7796 -76.3106 9.1 21.5 3.6 87.9 10.0SBD2 8/20/01 36.7668 -76.2969 0.9 21.2 3.1 42.1 6.5SBD4 8/20/01 36.7402 -76.2990 1.5 20.5 2.7 17.3 2.3WBB1 8/14/01 36.8462 -76.3576 1.5 21.4 3.9 92.7 5.6WBB5 8/14/01 36.8293 -76.3932 0.5 19.6 4.7 68.5 5.3
37
Table 6. Fixed Point Stations of the Elizabeth River sampled in 2001. Summary of benthic community parameters. All values are station means(n=3). Abundance reported as ind./m2, Biomass reported as grams/m2, all other abundance and biomass metrics are percentages.
Station B-IBI Abundance BiomassShannon
Index
PollutionIndicative
Abundance
PollutionSensitive
Abundance
PollutionIndicativeBiomass
PollutionSensitiveBiomass
CarnivoreOmnivore
Abundance
Deep DepositFeeder
AbundanceEBB1 2.0 12126 2.374 2.40 39.0 37.0 5.5 15.3 5.7 52.7ELC1 4.2 2351 1.565 3.60 12.5 54.9 5.2 49.0 21.1 48.1ELD1 3.2 2049 0.627 3.33 3.2 69.7 7.9 43.0 28.9 45.2ELF1 1.9 2260 0.461 2.78 22.1 36.2 16.4 18.0 12.1 49.9LFA1 2.2 4287 1.187 2.59 32.9 57.0 30.5 41.0 7.4 40.7LFB1 2.3 4778 0.847 2.20 26.1 13.5 8.9 47.4 6.1 45.9SBA1 2.7 4339 1.610 2.53 16.3 33.9 10.0 47.4 6.7 73.2SBB1 2.9 2019 0.544 2.63 4.4 58.8 8.2 34.7 28.4 57.8SBC1 2.1 22960 2.026 1.20 15.2 79.7 15.9 63.2 1.8 82.6SBD1 2.4 17743 1.520 1.20 3.0 90.4 12.1 63.4 26.8 68.2SBD2 2.7 9208 0.680 1.63 12.3 83.8 11.1 64.4 26.5 59.9SBD4 3.2 4135 0.559 1.70 3.8 88.5 5.3 69.2 29.7 60.8WBB1 2.3 3825 1.036 1.94 28.1 61.3 6.8 24.7 7.1 60.5WBB5 2.4 10108 1.308 1.82 17.3 69.8 5.2 58.5 7.1 71.2
38
Table 7. Random Stations of Paradise Creek sampled in 2001. Summary of physical parameters.
Station Datecollected
Latitude Longitude WaterDepth (m)
Salinity (ppt)
Dissolvedoxygen(ppm)
Silt-clayContent
(%)
Volatile Organics(%)
08P01 9/6/01 36.7984 -76.2951 10.4 22.3 3.0 91.6 9.308P02 9/6/01 36.7991 -76.2959 11.1 22.6 2.9 96.7 9.808P05 9/6/01 36.7983 -76.2982 0.7 22.2 4.1 5.0 1.008P06 9/6/01 36.7988 -76.2983 2.0 22.3 3.5 96.9 9.508P07 9/6/01 36.7980 -76.2988 0.7 22.2 4.0 6.2 1.108P08 9/6/01 36.7991 -76.2992 1.2 22.3 3.9 54.4 7.508P10 9/6/01 36.7985 -76.3001 1.5 22.3 3.8 95.5 10.608P12 9/6/01 36.7979 -76.3008 0.7 22.1 4.1 23.0 3.308P13 9/6/01 36.7986 -76.3018 0.7 22.1 5.6 42.6 6.208P14 9/6/01 36.7989 -76.3010 1.5 22.2 4.7 97.5 10.708P15 9/6/01 36.7999 -76.3026 1.5 22.2 4.2 94.2 10.608P16 9/6/01 36.8000 -76.3026 1.5 22.2 4.3 93.3 10.608P17 9/6/01 36.8005 -76.3033 1.5 22.2 4.2 95.3 10.808P18 9/6/01 36.8011 -76.3039 1.0 22.1 4.9 15.6 1.708P19 9/6/01 36.8002 -76.3056 0.7 22.1 4.7 48.0 7.508P20 8/30/01 36.8012 -76.3068 1.1 19.9 4.2 81.6 12.208P21 8/30/01 36.8017 -76.3065 1.0 18.7 4.8 84.2 9.308P22 8/30/01 36.8030 -76.3078 0.9 17.6 5.3 74.1 11.608P23 8/30/01 36.8035 -76.3087 1.0 18.7 4.2 83.3 10.608P24 8/30/01 36.8042 -76.3098 1.0 18.5 3.9 94.8 11.008P25 8/30/01 36.8064 -76.3112 1.0 17.4 3.2 93.5 12.208P26 8/30/01 36.8049 -76.3103 1.0 19.4 3.0 58.1 8.308P27 8/30/01 36.7981 -76.3012 0.7 20.4 4.7 13.2 1.108P28 8/30/01 36.7987 -76.2970 1.1 21.5 4.6 51.7 4.208P29 8/30/01 36.8005 -76.3063 1.0 19.5 4.5 54.2 49.3
39
Table 8. Random Stations of Paradise Creek sampled in 2001. Summary of benthic community parameters. Abundance reported as ind./m2, Biomassreported as grams/m2, all other abundance and biomass metrics are percentages.
Station BIBI Abundance BiomassShannon
Index
PollutionIndicative
Abundance
PollutionSensitive
Abundance
PollutionIndicativeBiomass
PollutionSensitiveBiomass
CarnivoreOmnivore
Abundance
Deep DepositFeeder
Abundance08P01 2.3 25787 1.383 1.12 20.3 74.8 13.1 78.7 0.5 76.908P02 2.3 22431 1.905 1.14 15.5 80.4 10.7 61.9 1.0 82.308P05 2.7 7416 2.268 2.05 5.2 11.3 2.0 52.0 63.9 23.508P06 2.3 36016 2.041 0.89 18.3 79.8 7.8 70.0 0.6 80.908P07 2.3 8664 1.928 2.07 6.5 17.3 9.4 10.6 66.2 29.308P08 2.3 23406 2.291 1.56 12.1 74.9 4.0 32.7 10.3 76.708P10 2.0 7847 0.930 1.81 17.1 64.7 7.3 26.8 3.8 72.308P12 3.0 13132 3.107 2.79 20.9 8.6 2.9 9.5 33.7 45.308P13 2.0 13177 2.109 2.55 27.5 15.5 7.5 20.4 19.3 54.008P14 1.7 14855 1.452 1.70 15.9 68.7 6.3 25.0 6.4 71.608P15 1.7 27874 2.132 1.29 17.1 75.3 6.4 24.5 2.5 79.508P16 1.7 21909 1.270 1.52 35.0 58.2 14.3 21.4 2.6 61.608P17 1.7 28327 2.064 1.28 20.8 69.0 7.7 28.6 0.4 78.508P18 3.0 32568 2.087 1.59 13.6 67.8 9.8 44.6 5.4 81.408P19 2.0 12429 2.563 2.45 21.9 45.3 7.1 17.7 17.9 63.108P20 2.0 36560 1.565 1.09 8.7 82.0 5.8 47.8 2.9 88.508P21 1.7 12723 0.680 1.29 31.2 62.9 20.0 20.0 0.5 67.408P22 2.7 3674 1.043 2.29 23.5 32.1 2.2 13.0 4.3 71.608P23 2.0 3651 0.544 1.53 62.7 20.5 8.3 8.3 1.9 34.808P24 1.3 11589 0.635 1.65 53.8 21.9 32.1 3.6 1.2 45.008P25 2.0 8891 1.134 1.99 52.6 3.1 18.0 2.0 13.8 34.208P26 1.3 6668 0.454 1.45 59.5 29.3 30.0 30.0 0.7 39.108P27 3.0 13041 1.701 1.58 13.6 72.3 8.0 25.3 13.0 73.608P28 2.3 30119 1.633 0.87 13.6 84.4 5.6 72.2 1.7 84.608P29 2.3 272 0.249 2.86 16.7 50.0 27.3 45.5 58.3 16.7Mean 2.1 16921 1.567 1.70 24.1 50.8 10.9 31.7 13.3 61.3
Std. error 0.02 428 0.029 0.02 0.7 1.1 0.3 0.9 0.8 0.9
40
Table 9. Random Stations of Paradise Creek sampled in 2001. Summary of benthic community parameters scores of the B-IBI.
Station BIBI SalinityClass
SedimentClass
ShannonIndex
Abundance Biomass PollutionIndicative
Abundance
PollutionSensitive
Abundance
PollutionIndicativeBiomass
PollutionSensitiveBiomass
CarnivoreOmnivore
Abundance
DeepDepositFeeders
08P01 2.3 5 2 1 1 3 3 5 108P02 2.3 5 2 1 1 3 3 5 108P05 2.7 5 1 1 3 3 1 5 308P06 2.3 5 2 1 1 3 3 5 108P07 2.3 5 1 1 1 3 1 3 508P08 2.3 5 2 1 1 3 5 3 108P10 2.0 5 2 1 3 3 3 1 108P12 3.0 5 1 3 1 3 1 5 508P13 2.0 5 2 3 1 3 3 1 108P14 1.7 5 2 1 1 3 3 1 108P15 1.7 5 2 1 1 3 3 1 108P16 1.7 5 2 1 1 3 3 1 108P17 1.7 5 2 1 1 3 3 1 108P18 3.0 5 1 1 1 3 5 3 508P19 2.0 5 2 3 1 3 3 1 108P20 2.0 5 2 1 1 3 3 3 108P21 1.7 5 2 1 1 3 3 1 108P22 2.7 4 2 3 3 3 5 1 108P23 2.0 5 2 1 3 3 3 1 108P24 1.3 5 2 1 1 3 1 1 108P25 2.0 4 2 1 1 3 3 1 308P26 1.3 5 2 1 3 1 1 1 108P27 3.0 5 1 1 1 3 5 3 508P28 2.3 5 2 1 1 3 3 5 108P29 2.3 5 2 3 1 1 1 3 5
41
Table 10. Dominant taxa of random stations of Paradise Creek sampled in 2001. Dominant taxa by abundance.Taxon code: A = amphipod, B = bivalve, G = gastropod, I = isopod, N = Nemertean, O = oligochaete, P =polychaete.
Taxon Abundance per m2
1 Mediomastus ambiseta (P) 103682 Streblospio benedicti (P) 32613 Tubificoides heterochaetus (O) 11574 Laeonereis culveri (P) 8675 Cyathura polita (I) 1746 Leitoscoloplos spp.(P) 1547 Tubificidae spp.(O) 1498 Leucon americanus 1349 Eteone heteropoda (P) 12910 Tubificoides spp. Group I (O) 9711 Heteromastus filiformis (P) 8012 Capitella capitata (P) 7613 Paraprionospio pinnata (P) 3514 Nemertea spp.(N) 3115 Hobsonia florida (P) 27
42
Appendix
43
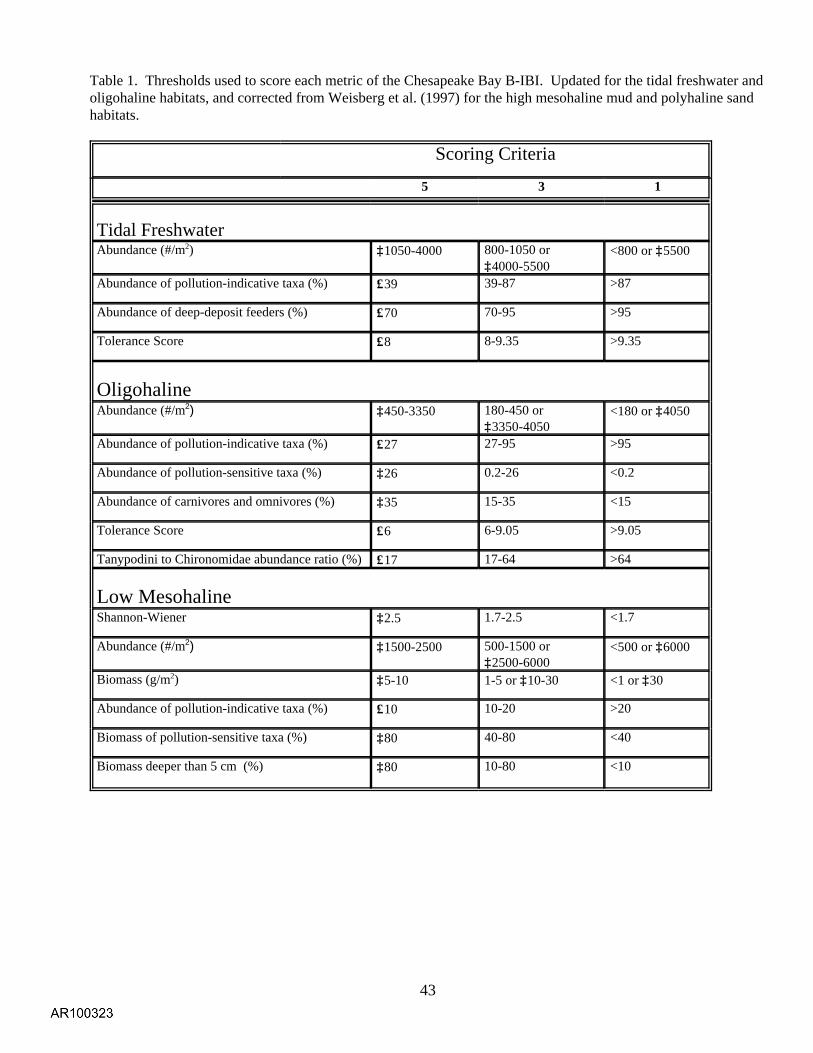
Table 1. Thresholds used to score each metric of the Chesapeake Bay B-IBI. Updated for the tidal freshwater andoligohaline habitats, and corrected from Weisberg et al. (1997) for the high mesohaline mud and polyhaline sandhabitats.
Scoring Criteria
5 3 1
Tidal FreshwaterAbundance (#/m2) ≥1050-4000 800-1050 or
≥4000-5500<800 or ≥5500
Abundance of pollution-indicative taxa (%) ≤39 39-87 >87
Abundance of deep-deposit feeders (%) ≤70 70-95 >95
Tolerance Score ≤8 8-9.35 >9.35
Oligohaline Abundance (#/m2) ≥450-3350 180-450 or
≥3350-4050<180 or ≥4050
Abundance of pollution-indicative taxa (%) ≤27 27-95 >95
Abundance of pollution-sensitive taxa (%) ≥26 0.2-26 <0.2
Abundance of carnivores and omnivores (%) ≥35 15-35 <15
Tolerance Score ≤6 6-9.05 >9.05
Tanypodini to Chironomidae abundance ratio (%) ≤17 17-64 >64
Low Mesohaline Shannon-Wiener ≥2.5 1.7-2.5 <1.7
Abundance (#/m2) ≥1500-2500 500-1500 or ≥2500-6000
<500 or ≥6000
Biomass (g/m2) ≥5-10 1-5 or ≥10-30 <1 or ≥30
Abundance of pollution-indicative taxa (%) ≤10 10-20 >20
Biomass of pollution-sensitive taxa (%) ≥80 40-80 <40
Biomass deeper than 5 cm (%) ≥80 10-80 <10
44
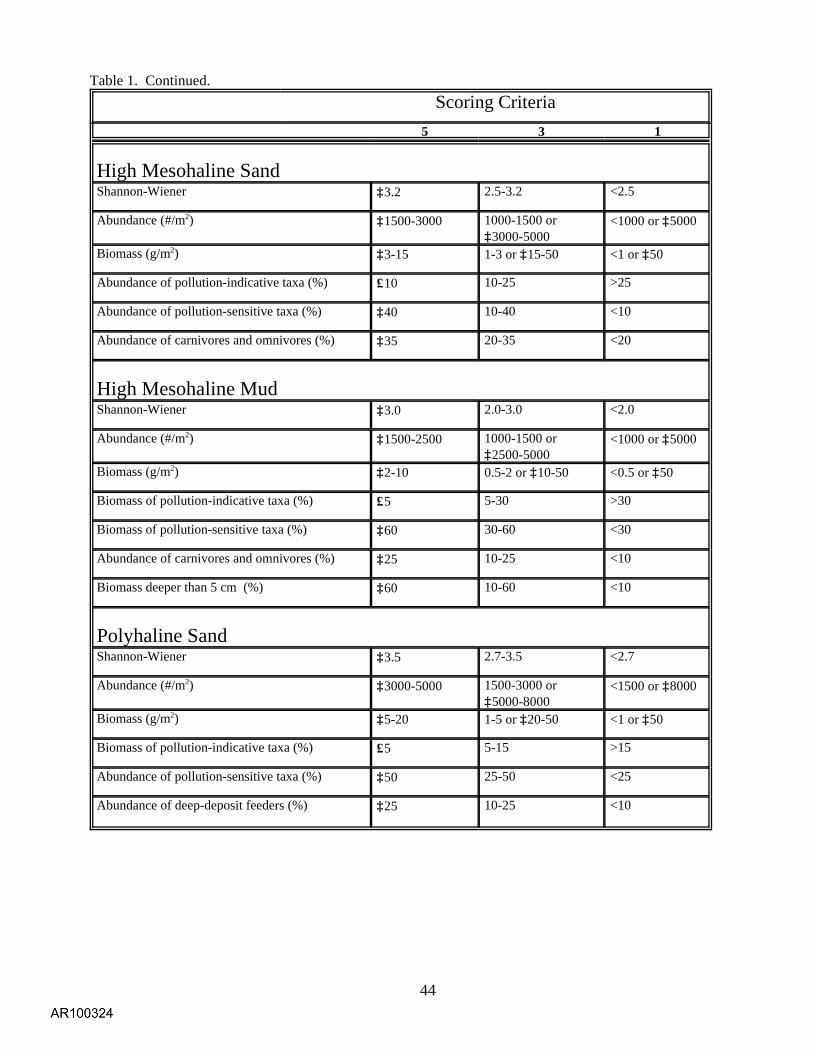
Table 1. Continued.
Scoring Criteria5 3 1
High Mesohaline SandShannon-Wiener ≥3.2 2.5-3.2 <2.5
Abundance (#/m2) ≥1500-3000 1000-1500 or≥3000-5000
<1000 or ≥5000
Biomass (g/m2) ≥3-15 1-3 or ≥15-50 <1 or ≥50
Abundance of pollution-indicative taxa (%) ≤10 10-25 >25
Abundance of pollution-sensitive taxa (%) ≥40 10-40 <10
Abundance of carnivores and omnivores (%) ≥35 20-35 <20
High Mesohaline MudShannon-Wiener ≥3.0 2.0-3.0 <2.0
Abundance (#/m2) ≥1500-2500 1000-1500 or≥2500-5000
<1000 or ≥5000
Biomass (g/m2) ≥2-10 0.5-2 or ≥10-50 <0.5 or ≥50
Biomass of pollution-indicative taxa (%) ≤5 5-30 >30
Biomass of pollution-sensitive taxa (%) ≥60 30-60 <30
Abundance of carnivores and omnivores (%) ≥25 10-25 <10
Biomass deeper than 5 cm (%) ≥60 10-60 <10
Polyhaline SandShannon-Wiener ≥3.5 2.7-3.5 <2.7
Abundance (#/m2) ≥3000-5000 1500-3000 or≥5000-8000
<1500 or ≥8000
Biomass (g/m2) ≥5-20 1-5 or ≥20-50 <1 or ≥50
Biomass of pollution-indicative taxa (%) ≤5 5-15 >15
Abundance of pollution-sensitive taxa (%) ≥50 25-50 <25
Abundance of deep-deposit feeders (%) ≥25 10-25 <10
45
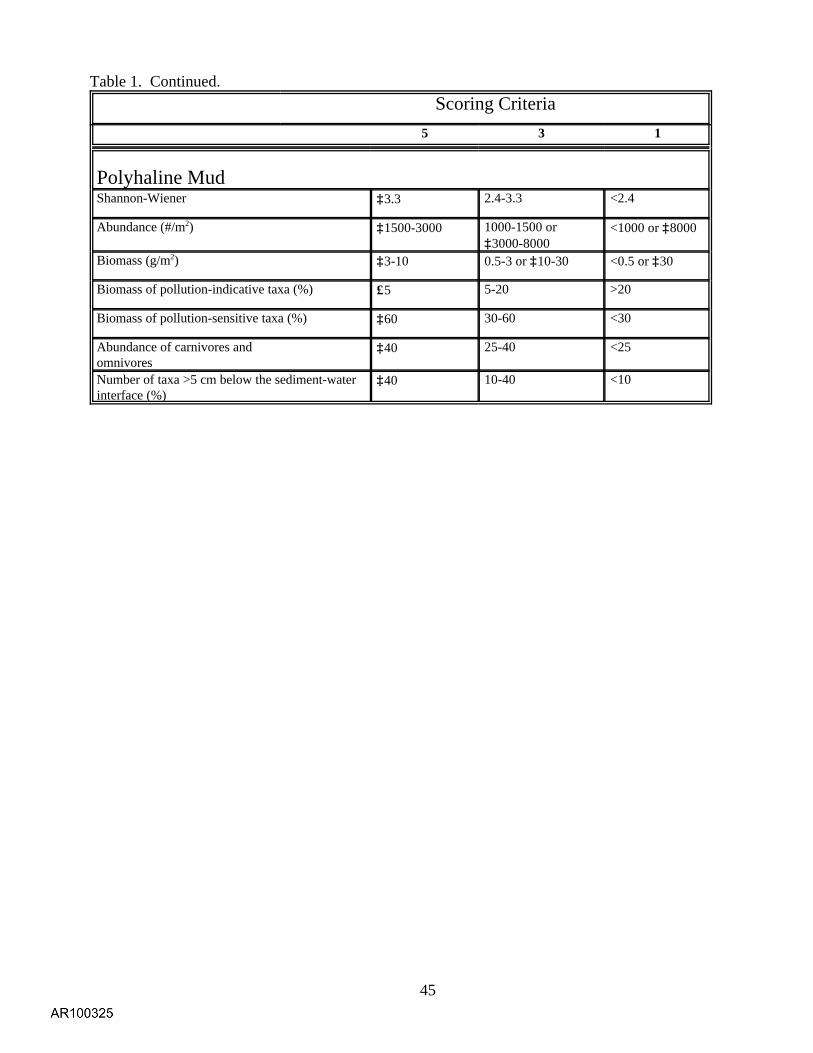
Table 1. Continued.Scoring Criteria
5 3 1
Polyhaline MudShannon-Wiener ≥3.3 2.4-3.3 <2.4
Abundance (#/m2) ≥1500-3000 1000-1500 or≥3000-8000
<1000 or ≥8000
Biomass (g/m2) ≥3-10 0.5-3 or ≥10-30 <0.5 or ≥30
Biomass of pollution-indicative taxa (%) ≤5 5-20 >20
Biomass of pollution-sensitive taxa (%) ≥60 30-60 <30
Abundance of carnivores andomnivores
≥40 25-40 <25
Number of taxa >5 cm below the sediment-waterinterface (%)
≥40 10-40 <10