bennington canyon mine preliminary assessment report
TRANSCRIPT

Bennington Canyon Mine Preliminary Assessment Report
Bear Lake County State of Idaho
Department of Environmental Quality November 2007
Submitted to: U. S. Environmental Protection Agency
Region 10 1200 Sixth Avenue Seattle, WA 98101

Benn ing ton Canyon M ine Pre l im ina ry Assessment Repor t
November 2007
ii

Benn ing ton Canyon M ine Pre l im ina ry Assessment Repor t
November 2007
iii
Table of Contents
List of Acronyms........................................................................................................... v
Section 1. Introduction.............................................................................................. 1 1.1 Background of the Inactive Mine Assessments..................................................... 1 1.2 Site Overview ........................................................................................................ 2
Section 2. Site Description, Operational History, and Waste Characteristics...... 6 2.1 Ownership ............................................................................................................. 6 2.2 Historical Perspective............................................................................................ 6 2.3 Regional Climate ................................................................................................... 8 2.4 General Geology ................................................................................................... 8 2.5 Stratigraphy and Lithology..................................................................................... 9 2.6 Structure................................................................................................................ 9 2.7 Hydrogeology ...................................................................................................... 10 2.8 Current and Potential Future Land Uses............................................................. 10 2.9 Area Fish Species ............................................................................................... 10 2.10 Wetlands ............................................................................................................. 11
Section 3. Site Overview, Sampling, and Waste Characterization ...................... 15 3.1 Area Wide Risk Management Plan Action Levels ............................................... 15 3.2 Sampling ............................................................................................................. 16 3.3 Sampling Results ................................................................................................ 16 3.4 Inspection Findings ............................................................................................... 5
Section 4. Pathway and Environmental Hazard Assessment ................................ 7 4.1 Surface Water ....................................................................................................... 7 4.2 Groundwater.......................................................................................................... 7 4.3 Soil Exposure and Air .......................................................................................... 10 4.4 Potential Receptors ............................................................................................. 10
4.4.1 Schools, Day-Care Facilities, Private Residences ........................................ 10 4.4.2 Plant and Animal Species of Concern........................................................... 10 4.4.3 Soil Sample Concentrations .......................................................................... 11

Benn ing ton Canyon M ine Pre l im ina ry Assessment Repor t
November 2007
iv
Section 5. Conclusions and Recommendations................................................... 15 5.1 Presence of Wetlands ......................................................................................... 15 5.2 Impacts on Water Quality .................................................................................... 15 5.3 Potential Exposure for Wildlife and Vegetation ................................................... 15 5.4 Potential Exposure for Humans........................................................................... 16 5.5 Recommendations .............................................................................................. 16
References................................................................................................................... 17
Appendix: Photographs.............................................................................................. 19
Report Index ................................................................................................................ 24
List of Figures Figure 1. Location of the Bennington Canyon Mine within the state of Idaho and delineation of the Southeast Idaho Phosphate Mining Resource Area (green boundary). ....................................................................................................3 Figure 2. Aerial overview of the Bennington Canyon Mine area. ...................................................................................4 Figure 3. Geologic Map of Bennington Canyon Mine Area. .........................................................................................12 Figure 4. Wetlands in the Bennington Canyon Mine Area............................................................................................13 Figure 5. Bennington Canyon Mine Sample Locations. .................................................................................................1 Figure 6. Bennington Canyon Mine Site Sketch from DEQ (2004).................................................................................6 Figure 7. Domestic and Public Water System wells within a 4-mile radius. ...................................................................9 Figure 8. Species of Concern within the Bennington Canyon Mine Area. ....................................................................12
List of Tables Table 1. Generalized Stratigraphic Setting of Project Area1...........................................................................................9 Table 2. Bennington Canyon Mine Soil Sampling Analytical Results .............................................................................3 Table 3. Bennington Canyon Mine Vegetation Sampling Analytical Results..................................................................3 Table 4. Bennington Canyon Mine Surface Water Analytical Results ............................................................................4

Benn ing ton Canyon M ine Pre l im ina ry Assessment Repor t
November 2007
v
List of Acronyms
Acronym Definition
bgs below ground surface
BLM U.S. Bureau of Land Management
CERCLA Comprehensive Environmental Response, Compensation, and Liability Act
DEQ Idaho Department of Environmental Quality
EPA United States Environmental Protection Agency
IDFG Idaho Department of Fish and Game
IDL Idaho Department of Lands
IDWR Idaho Department of Water Resources
PA Preliminary Assessment
SDWIS Safe Drinking Water Information System
TDL Target Distance Limit
USFS United States Forest Service
USGS US Geological Survey

Benn ing ton Canyon M ine Pre l im ina ry Assessment Repor t
November 2007
vi
This page intentionally left blank for correct double-sided printing.

Benn ing ton Canyon M ine Pre l im ina ry Assessment Repor t
November 2007
1
Section 1. Introduction
The Department of Environmental Quality (DEQ) was contracted by Region 10 of the United States Environmental Protection Agency (EPA) to provide technical support for completion of preliminary assessments at various mines within Idaho.
The DEQ often receives complaints or information about sites that may be contaminated with hazardous waste. These sites can include abandoned mines, rural airfields that have served as bases for aerial spraying, old landfills, illegal dumps, and abandoned industrial facilities that have known or suspected releases.
In February 2002, DEQ initiated a Preliminary Assessment Program to evaluate and prioritize assessment of such potentially contaminated sites. Due to accessibility and funding considerations, priority is given to sites where potential contamination poses the most substantial threat to human health or the environment.
For additional information about the Preliminary Assessment Program, see the following:
http://www.deq.idaho.gov/waste/prog_issues/mining/pa_program.cfm
This report presents the results of the preliminary assessment (PA) of the Bennington Canyon Mine and also documents the interagency PA and risk screening activities conducted for this inactive mine site located within the boundaries of the Southeast Idaho Phosphate Mining Resource Area (Figure 1; the green border outlines the resource area). The interagency PA was prepared by the DEQ, in collaboration with the United States Bureau of Land Management (BLM), the United States Forest Service (USFS), and the Idaho Department of Lands (IDL)—the primary mining administration agencies in southeast Idaho. Site descriptions, conditions, data, and photos are taken directly from the Orphan Mine Site Preliminary Assessment Screening Report published in 2004 (DEQ, 2004a). Recommendations from the earlier report have been expanded upon in this report, based on DEQ evaluation of the earlier screening report and any additional information DEQ was able to obtain through literature review. A site visit and sampling were not conducted as part of this PA process.
1.1 Background of the Inactive Mine Assessments Inactive mine sites consist of those historic mining operations not previously scheduled for Comprehensive Environmental Response, Compensation, and Liability Act (CERCLA) site-specific investigations conducted under the ongoing selenium investigation activities (DEQ, 2007). This PA was conducted to ensure all historic mining sites within the Idaho Phosphate Mining Resource Area have been inspected and evaluated in accordance with the goals and objectives outlined in the Area Wide Risk Management Plan (DEQ, 2004b):
• Protecting southeast Idaho’s surface water resources by reducing risks to existing aquatic life and sensitive species from selenium and related trace metal concentrations in regional subbasins and stream segments through (a) compliance
Benn ing ton Canyon M ine Pre l im ina ry Assessment Repor t
November 2007
2
with the National Toxics Rule and State Water Quality Regulation numeric criteria (b) development and demonstration of Best Management Practices (BMPs) to prevent future mining releases and associated risks from selenium and related trace metals in receiving streams and water bodies, and (c) development of a long-term monitoring plan for regional surface water resources to ensure effectiveness of risk reduction measures.
• Protecting wildlife, habitat, and ecological resources in southeast Idaho by reducing subpopulation risks to local wildlife to acceptable levels as established by risk-based action levels and by minimizing wildlife risks through the development and demonstration of effective BMPs for future mines.
• Maintaining and protecting multiple beneficial uses of the Southeast Idaho Phosphate Mining Resource Area by reducing livestock grazing risks and associated losses from selenium exposures in forage and drinking water sources and by preventing potential future public health risks by prohibiting residential land use and development in the immediate vicinity of phosphate mining waste units and/or impacted areas.
• Protecting southeast Idaho’s ground water resources by identifying, characterizing, and responding to groundwater contamination sources that may present potential public health or ecological risks and by developing and demonstrating BMPs to control future mining releases and associated risks from selenium and related trace metals in groundwater.
The earlier orphan mine site screening effort (DEQ, 2004a) included preliminary assessment activities at fourteen historic mine sites identified through lease records and literature reviews of past mining activities. Preliminary site inspections and environmental sampling of potentially impacted media (surface water, soil, sediment, and vegetation) was conducted by interagency sampling teams in May and July of 2002. Risk evaluation consisted of reviewing site data in terms of site conditions, areas of impact, potential for continued releases, and regional risk-based action levels developed for the Area Wide Risk Management Plan.
1.2 Site Overview The Bennington Canyon Mine is located in Bear Lake County, Section 8, Township 12 South, Range 44 East, approximately three miles east of Bennington, Idaho (Figure 2). The site is located on private land between the mouths of Bennington and Hardscrabble Canyons, less than one-tenth of a mile east of Bloomington Canyon road. The former mine can be reached from Bennington by driving east along Bennington Canyon Road to the site.
The mine area consists of one collapsed production adit, one sinkhole (or another collapsed adit), one open pit, five waste dumps, and a wooden building. A small seep exits the sinkhole. The seep has eroded through the waste dump from which it exits, and there is an old irrigation pipe protruding from the seep.

Benn ing ton Canyon M ine Pre l im ina ry Assessment Repor t
November 2007
3
Figure 1. Location of the Bennington Canyon Mine within the state of Idaho and delineation of the Southeast Idaho Phosphate Mining Resource Area (green boundary).

Benn ing ton Canyon M ine Pre l im ina ry Assessment Repor t
November 2007
4
Montpelier
Bennington
89
30
30
4th
89
Main
Montpelier Canyo
n
Canyon
Washington
30
Montpelier
B O I S EB O I S E
M c C A L LM c C A L L
L E W I S T O NL E W I S T O N
P O C A T E L L OP O C A T E L L OT W I N F A L L ST W I N F A L L S
S U N V A L L E YS U N V A L L E Y
C O E U R D ' A L E N EC O E U R D ' A L E N E
Yellowstone NP
Glacier NP
I d a h o
M o n t a n a
O r e g o n
U t a hN e v a d a
W a s h i n g t o n
0 0.8 1.60.4 Miles
Bennington Canyon Mine
Figure 2. Aerial overview of the Bennington Canyon Mine area.

Benn ing ton Canyon M ine Pre l im ina ry Assessment Repor t
November 2007
5
This page intentionally left blank for correct double-sided printing.
Benn ing ton Canyon M ine Pre l im ina ry Assessment Repor t
November 2007
6
Section 2. Site Description, Operational History, and Waste Characteristics
Physical characteristics of the Bennington Canyon Mine site are presented in the following, along with the mines’ operational histories and characteristics of the wastes that remain.
2.1 Ownership According to the Bear Lake County Tax Assessor, the current owner of record is George W. Lane, 306 N. Third St., Montpelier, ID 83254 (DEQ, 2004a). Originally, the San Francisco Chemical Company (SFCC) gathered mining claims and did minor exploratory work on the Bennington Canyon Mine in 1909. In 1914, the land on which the mine was located was patented to John C. Nelson under the Homestead Laws.
On November 25 1939, the Teton Phosphate Company of Boise, Idaho obtained the rights to mine the area. The eight incorporators, namely, Houston T. Hitt, C. Van Clark, F. P. Van Horn, J.C. McKinley, Sr., Milton Robison, Conover Wright, Frank D. Maxwell, and Edward G. Rosenheim, started exploratory work in 1940 and began open pit operations in 1941. In 1946, the property was leased to J.L. Ogilvy of Spokane, Washington.
2.2 Historical Perspective The Bennington Canyon Mine is located in the SE¼, NE¼, Section 14, T. 12 S., R. 44 E., BM (Figure 1). According to Lee (2000), C. C. Jones published the first report on the occurrence of phosphate at the Bennington Canyon site in 1907. The San Francisco Chemical Company (SFCC), an operating division of the Mountain Copper Company, Ltd. (a British company) apparently paid attention to the 1907 report, and the company located mining claims between 1907 and 1912 on the deposit and opened prospects on the phosphate ore zone (BLM unpublished data). J. J. Taylor, local superintendent of the SFCC, excavated three short adits, the two northernmost openings consisted of a tunnel about 75 feet long and a tunnel about 50 feet long. Little is known about the third opening, which was situated somewhere in the Joe’s Gap drainage just south of the mine. Mansfield (1927) reported making measurements in the tunnel openings in 1909 but stated that no work had been conducted at the tunnel sites from 1909 to 1920, when the bed was opened again. In this same period, the mining claims were apparently relinquished as the land was offered for homesteading. The land on which the mine was to be later developed left federal ownership December 15, 1914 under the Homestead Laws and was patented to John C. Nelson. Mr. Nelson is probably the one who reopened the deposit in 1920. Mansfield (1927) also reports that prospects were opened by F. R. Richards of Montpelier, Idaho on the hillside south of Joe’s Gap in section 23.

Benn ing ton Canyon M ine Pre l im ina ry Assessment Repor t
November 2007
7
None of this early activity resulted in economic development of this deposit. It wasn’t until 1939 that there was serious interest in mining. On November 25, 1939, a new company was formed to mine the Bennington Canyon phosphate deposits: the Teton Phosphate Company of Boise, Idaho. On that date, the new company filed to do business in Idaho with the Secretary of State’s office. The Paris Post (1939) reported that there were eight incorporators: Houston T. Hitt, C. Van Clark, F. P. Van Horn, J. C. McKinley, Sr., Milton Robison, Conover Wright, Frank D. Maxwell, and Edward G. Rosenheim. The new company obtained mining rights on 160 acres (Service, 1966).
Exploration started in 1940, with the excavation of several shallow trenches, all of which are now caved and indistinguishable. In October 1941, the Teton Phosphate Company started a small open pit operation. Overburden was stripped from about 1,300 square yards of the flat-lying Phosphoria Formation, and a prospect tunnel about 150 feet long was driven in the open pit to explore the phosphate at depth. A 40-ton hammer mill with crusher, rotary barrel dryer, trommel screens, and storage bins were placed in the open pit below the stripped phosphate (Service, 1966; Anaconda Collection, 1942).
The ore was crushed, dried, ground, sacked, and sold for direct application on farmlands throughout southern Idaho. One carload of 43 tons was mined and shipped to the Vasser Produce Company in Caldwell, Idaho (Anaconda Collection, 1942). Campbell (1943, 1944) reported that production amounted to about 1,000 cubic yards and that five men were employed. Many mines, including this one, have been opened in the phosphate field with the object to market the phosphate rock for direct application to the soil as fertilizer. Unfortunately, natural phosphate, even when finely ground, is not sufficiently soluble to benefit plant growth. The unanimous fate of small mines opened with soil amendments as a product was a short mine life (Butner, 1949).
Labor trouble and poor economic conditions closed the mine in 1942. Due to demand from former users of the phosphate product, the mine reopened for a short period in 1943, but lack of volume capacity and stiff competition from larger phosphate mines in the area spelled doom for this mine; it closed again, never to reopen. The Teton Phosphate Company started to negotiate with several processors for a lease on parts of the property on a royalty basis. In 1946, the property was leased to J. L. Ogilvy of Spokane, Washington but there is no record that Mr. Ogilvy mined any ore (Service, 1966).
McDowell (1951) reported that the property was being operated by Soilife, Inc. Officers of this new company included Houston T. Hitt, President, D. Charles Regan, Secretary, and J. P. Gilmore, Manager, all of Boise, Idaho. However, records of the Secretary of State’s office do not show that Soilife, Inc. was licensed to do business in Idaho. This may have been a brief and unsuccessful name change by Teton Phosphate Company. Successive reports by the Idaho Inspector of Mines show the property as idle, and, in fact, the Teton Phosphate Company forfeited its right to do business in Idaho November 11, 1967. The mine only exists today as a scar on the hillside east of the small town of Bennington, Idaho.

Benn ing ton Canyon M ine Pre l im ina ry Assessment Repor t
November 2007
8
2.3 Regional Climate Climate in southeast Idaho is influenced by major topographic features, including the Pacific Coast, and local mountain ranges. The mountains affect local wind, precipitation, and temperature patterns.
Summer temperatures in the valleys are typically dry with average maximum temperatures in the low 80s (˚F) and average minimum temperatures in low to mid 40s (˚F). Summer precipitation is usually associated with thunderstorms. Fall and winter are dominated by cold, dry continental air and by cyclonic storms. The average maximum temperatures during February are in the low 30s (˚F) with the average minimums below 10 ˚F. Most precipitation during fall and winter falls as snow accumulating in the valleys and on the surrounding mountains. Spring precipitation usually results from cool marine air flowing in from the south.
The average annual precipitation varies widely throughout the resource area and with elevation. Lifton pumping station, located at the north end of Bear Lake, has an average total annual precipitation of 10.62 inches, based on a 1935 to 2007 period of record, while, on the north end of the resource area, Conda reports an annual total average precipitation of 18.91 inches over a period of record from 1948 to 1978 (Western Regional Climate Center [WRCC], 2007). Precipitation in the surrounding mountains ranges from 25 to 35 inches annually (BLM, 2000). The heaviest 1-day rainfall during the period of record at Montpelier was 2.50 inches on June 16, 1939. Thunderstorms occur on about 24 days each year, and most occur between May and August (Natural Resource Conservation Service [NRCS], 2007).
“The average seasonal snowfall is 58.3 inches. The greatest snow depth at any one time during the period of record at Montpelier was 31 inches recorded on March 4, 1952. On an average, 108 days per year have at least 1 inch of snow on the ground. The heaviest 1-day snowfall on record was 13.0 inches recorded on December 19, 1951”.
(Natural Resource Conservation Service, 2007)
The prevailing wind direction is from the west southwest, causing accumulation of snow on east and north facing ridges. Ralston et al. (1980) states that snow melt is the largest source of ground water recharge to the areas bedrock aquifers giving the east and north facing ridges the greatest potential for significant recharge.
2.4 General Geology The Bennington Canyon Mine lies within the northern region of the Basin and Range physiographic province and is characterized by linear, north-trending fault-bounded ranges and basins created by extensional tectonism initiated during the last 10 to 20 million years (Figure 3).
Ranges in southeastern Idaho are generally composed of deformed Paleozoic and Mesozoic sedimentary rocks, including thick marine clastic units, comprising cherts and limestones. The valleys are largely in-filled with Quaternary alluvium and colluvium that overlie Pleistocene basalt flows. Middle Pleistocene rhyolite flows of the Snake River Plain region cover much of the area and complete the geologic sequences in the region.
Benn ing ton Canyon M ine Pre l im ina ry Assessment Repor t
November 2007
9
Massive accumulations of marine sediment occurred during the Paleozoic era over large areas of eastern Idaho. During the Permian Era, the Phosphoria Formation was deposited, forming the western phosphate field, part of which is located in the Idaho Phosphate Mining Resource Area.
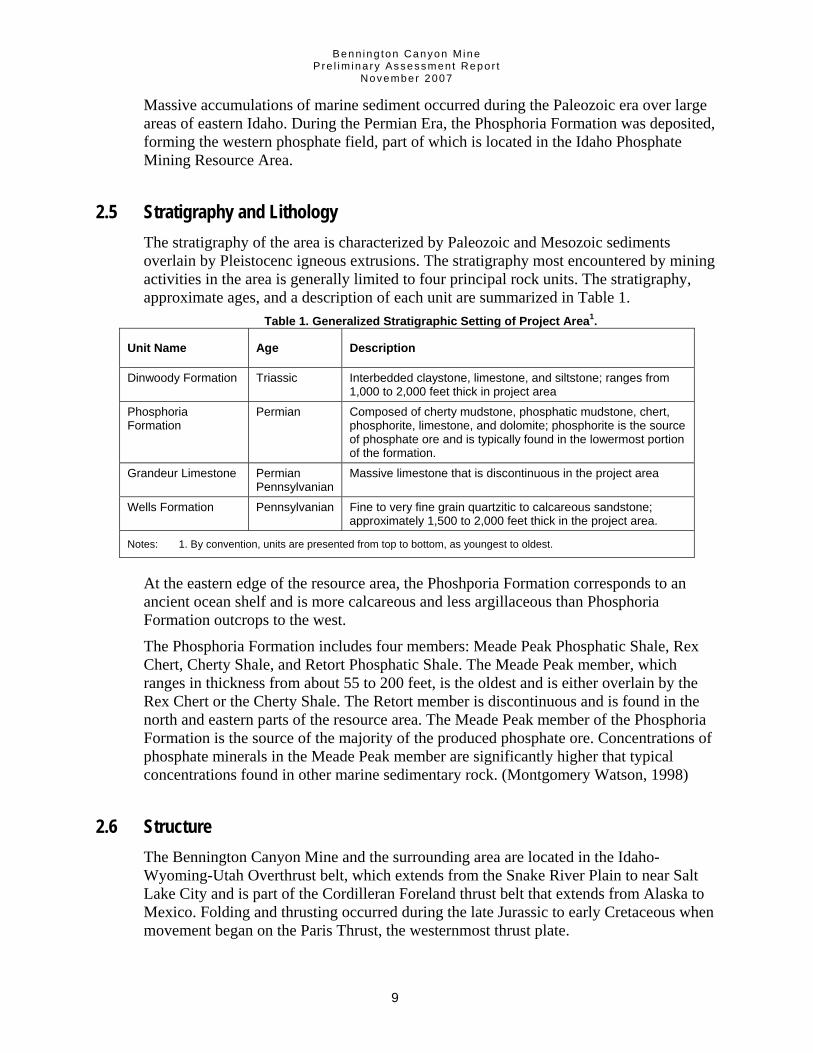
2.5 Stratigraphy and Lithology The stratigraphy of the area is characterized by Paleozoic and Mesozoic sediments overlain by Pleistocenc igneous extrusions. The stratigraphy most encountered by mining activities in the area is generally limited to four principal rock units. The stratigraphy, approximate ages, and a description of each unit are summarized in Table 1.
Table 1. Generalized Stratigraphic Setting of Project Area1.
Unit Name Age Description
Dinwoody Formation Triassic Interbedded claystone, limestone, and siltstone; ranges from 1,000 to 2,000 feet thick in project area
Phosphoria Formation
Permian Composed of cherty mudstone, phosphatic mudstone, chert, phosphorite, limestone, and dolomite; phosphorite is the source of phosphate ore and is typically found in the lowermost portion of the formation.
Grandeur Limestone Permian Pennsylvanian
Massive limestone that is discontinuous in the project area
Wells Formation Pennsylvanian Fine to very fine grain quartzitic to calcareous sandstone; approximately 1,500 to 2,000 feet thick in the project area.
Notes: 1. By convention, units are presented from top to bottom, as youngest to oldest.
At the eastern edge of the resource area, the Phoshporia Formation corresponds to an ancient ocean shelf and is more calcareous and less argillaceous than Phosphoria Formation outcrops to the west.
The Phosphoria Formation includes four members: Meade Peak Phosphatic Shale, Rex Chert, Cherty Shale, and Retort Phosphatic Shale. The Meade Peak member, which ranges in thickness from about 55 to 200 feet, is the oldest and is either overlain by the Rex Chert or the Cherty Shale. The Retort member is discontinuous and is found in the north and eastern parts of the resource area. The Meade Peak member of the Phosphoria Formation is the source of the majority of the produced phosphate ore. Concentrations of phosphate minerals in the Meade Peak member are significantly higher that typical concentrations found in other marine sedimentary rock. (Montgomery Watson, 1998)
2.6 Structure The Bennington Canyon Mine and the surrounding area are located in the Idaho-Wyoming-Utah Overthrust belt, which extends from the Snake River Plain to near Salt Lake City and is part of the Cordilleran Foreland thrust belt that extends from Alaska to Mexico. Folding and thrusting occurred during the late Jurassic to early Cretaceous when movement began on the Paris Thrust, the westernmost thrust plate.

Benn ing ton Canyon M ine Pre l im ina ry Assessment Repor t
November 2007
10
Compressional tectonics ended in the Cretaceous Period. Subsequently, the resource area underwent a period of extensional tectonics in the Miocene Epoch, during which high-angle normal faults cut across the older rocks and Mesozoic folds and thrusts. These large and extensive block fault systems formed the north-trending ranges and valleys of the Basin and Range province.
The major thrust plate in the study area is the Paris Overthrust. The ore bearing units at the mine consist of Pennsylvanian to Triassic age rock (see Table 1) within an overturned syncline. The strata in the mine area are overturned and dip 70˚ to 80˚ westward and strike approximately north.
2.7 Hydrogeology The major ground water flow systems within the phosphate mining resource area exist in the valley fill sediments, Thaynes, Dinwoody, and Wells formations. The Phosphoria formation has not been found to support any major ground water flow systems and generally acts as a confining unit between the Dinwoody and Wells formations.
Ground water flow in the valley sediments is generally from the valley margins towards the valley center, then down-valley towards lower elevations. Ground water flow within the bedrock aquifers is often controlled by stratigraphy and structural geology, flowing along the bedding in the direction of dip and/or plunge. Regional and localized faulting may form preferential flow paths or boundaries to ground water flow within the bedrock systems.
2.8 Current and Potential Future Land Uses Current land uses in the area include, a national wildlife refuge, a commercial business relying on the local hot spring(s), boating, fishing, swimming, biking, hiking, horseback riding, off-road vehicle touring, and grazing.
Future land use is likely to remain consistent with current practices on public lands, waterways, and wetlands in the area. Future land use on private parcels of property could potentially include some year-round and/or seasonal homes, as is typical else where around Bear Lake.
2.9 Area Fish Species According to the Idaho Department of Fish and Game (IDFG) database fish presence in Bear River include; redband rainbow trout [Oncorhynchhus mykiss gairdneri], Bonneville cutthroat trout [Oncorhynhus clarki Utah], Rainbow (hatchery) trout, brown trout [Salmo trutta], mountain whitefish [Prosopium williamsoni] (IDFG, 2000). There is no information concerning potential fish population in Bennington Canyon.

Benn ing ton Canyon M ine Pre l im ina ry Assessment Repor t
November 2007
11
2.10 Wetlands Official wetland surveys for the area indicate that the Bennington Canyon contains no wetland areas. However, there are wetlands, located within the 15-mile target distance limit (TDL) southwest of the mine, totalling approximately 21,937 total acres in size and supporting a number of sensitive plant and animal species. (See Figure 8, page 12). The majority of the total acreage is occupied by the Beal Lake National Wildlife Refuge, which extends beyond the 15-mile TDL.

Benn ing ton Canyon M ine Pre l im ina ry Assessment Repor t
November 2007
12
Qa
Ju
Tpd
TRl
Jl
Qg
O
Tpd
Z2s
Qa
Jl
PPNc
TRl
Ms
Tpd
TRl
Ju
TRl
Tpd
Z2s
Qg
Jl
Qg
TRu
TRl
TRl
Tpd
PPNcJl
TpdTRl
PPNc
PPNc
Jl
TRu
Ms TRl
TRu
Ms PPNc
0 1 20.5 Miles
Key
Bennington Canyon Mine
Thrust FaultNormal Fault
Geologic DescriptionQuaternary alluvium
Quaternary colluvium fanglomerate and talus
Pliocene stream and lake deposits
Upper Jurassic glauconitic and variegated sandstone siltstone and oolitic limestone
Lower Jurassic shaley sandy limestone overlaying red crossbedded sandstone
Upper Triassic oxidized shale siltstone limestone and conglomeratic sandstone
Lower Triassic limestone and chert above shaley sandstone siltstone and limestone
Lower Permian to Middle Pennsylvanian thrusted marine detritus
Mississippian shallow-water coralline limestone
Ordovician marine dolomite quartzite and limestone
Uppermost Precambrian massive quartzite with carbonate beds
Figure 3. Geologic Map of Bennington Canyon Mine Area.

Benn ing ton Canyon M ine Pre l im ina ry Assessment Repor t
November 2007
13
0 0.8 1.60.4 Miles
Legend
TDL
Wetlands
Field Site
Figure 4. Wetlands in the Bennington Canyon Mine Area.

Benn ing ton Canyon M ine Pre l im ina ry Assessment Repor t
November 2007
14
This page intentionally left blank for correct double-sided printing.

Benn ing ton Canyon M ine Pre l im ina ry Assessment Repor t
November 2007
15
Section 3. Site Overview, Sampling, and Waste Characterization
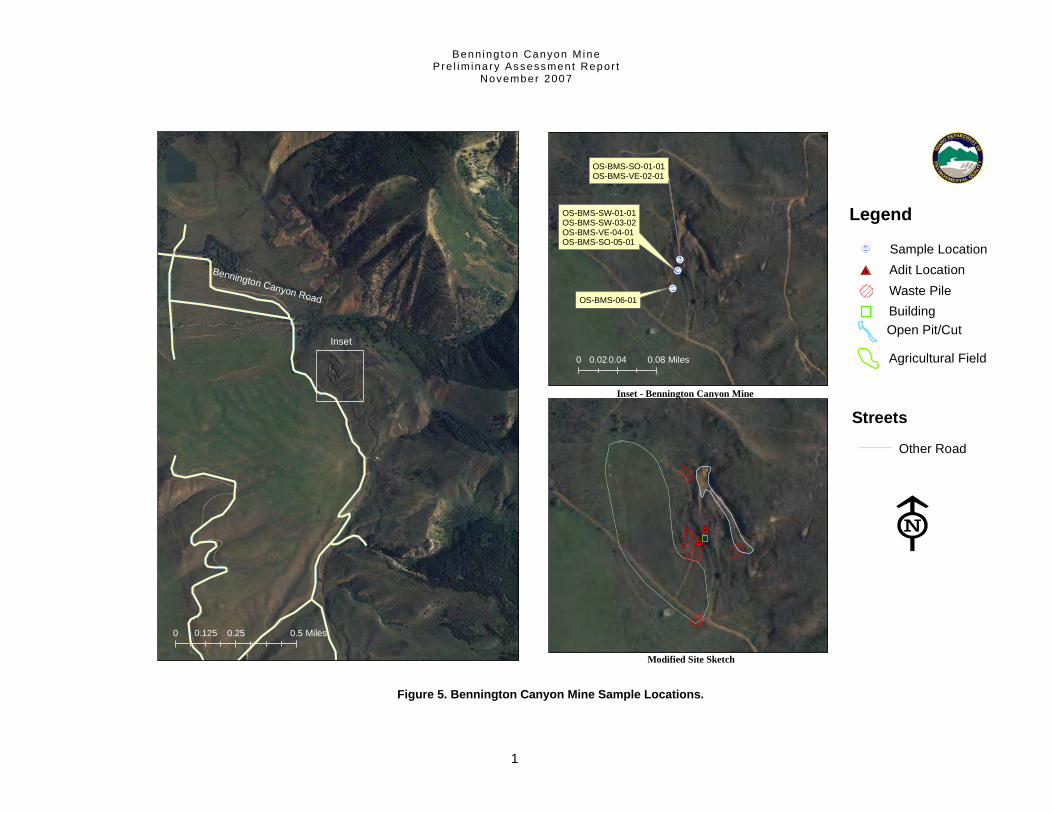
An interagency team conducted a site visit to the Bennington Canyon Mine during May 2002 (DEQ, 2004a) in accordance with the goals and objectives in the Area Wide Risk Management Plan. The visit included a visual inspection of the mine and the collection of three (3) vegetation samples (grasses), five (5) soil and sediment samples, and one (1) duplicate soil sample. Sampling locations are shown in Figure 5 and Photos 6.1 through 6.6 in the Appendix. Samples were analyzed for trace metals and compared to action levels developed for the Area Wide Rick Management Plan (DEQ, 2004b).
3.1 Area Wide Risk Management Plan Action Levels The Area Wide Risk Management Plan (RMP) was written as a discretionary guidance document to assist lead and support agency representatives with their mine-specific risk management decision-making responsibilities regarding historic mining operation releases and associated impacts from selenium and related trace metals in the Southeast Idaho Phosphate Mining Resource Area. The plan provides removal action goals, objectives, and action levels intended to assist in identifying site-specific areas of concern, focusing regulatory resources, and supporting consistent decision-making using a regional perspective.
The risk-based action levels were developed using deterministic single media dose proportions as the initial basis. These action levels were tested and validated using probabilistic methods that assume simultaneous exposure from all action level media to numerous limited home range surrogate species representing sensitive receptors from the various feeding guilds present in the Resource Area. Due to the limited area of impact and low likelihood of population-level effects, the action level development approach used by DEQ applied slightly less conservative assumptions regarding acceptable hazard quotient ranges than a typical population-level ecological risk assessment might. However, many of the receptor dose model parameters, such as site use, bioavailability and secondary media exposure point concentrations, remained conservatively-biased to represent receptors residing exclusively in impacted areas during toxicologically critical periods such as spawning, nesting, and breeding. The DEQ’s risk management decisions focus resources in areas where efforts to minimize potential impacts to ecological subpopulations will provide the greatest benefit.
Action levels were established for the primary media that support sensitive habitats and are most amenable to standard industry measurement and mitigation techniques, which were surface water, groundwater, sediments, fluvial/riparian soils, and vegetation. Elevated contaminant concentrations in the selected action level media are also indicative of the presence of past and/or ongoing releases.
Benn ing ton Canyon M ine Pre l im ina ry Assessment Repor t
November 2007
16
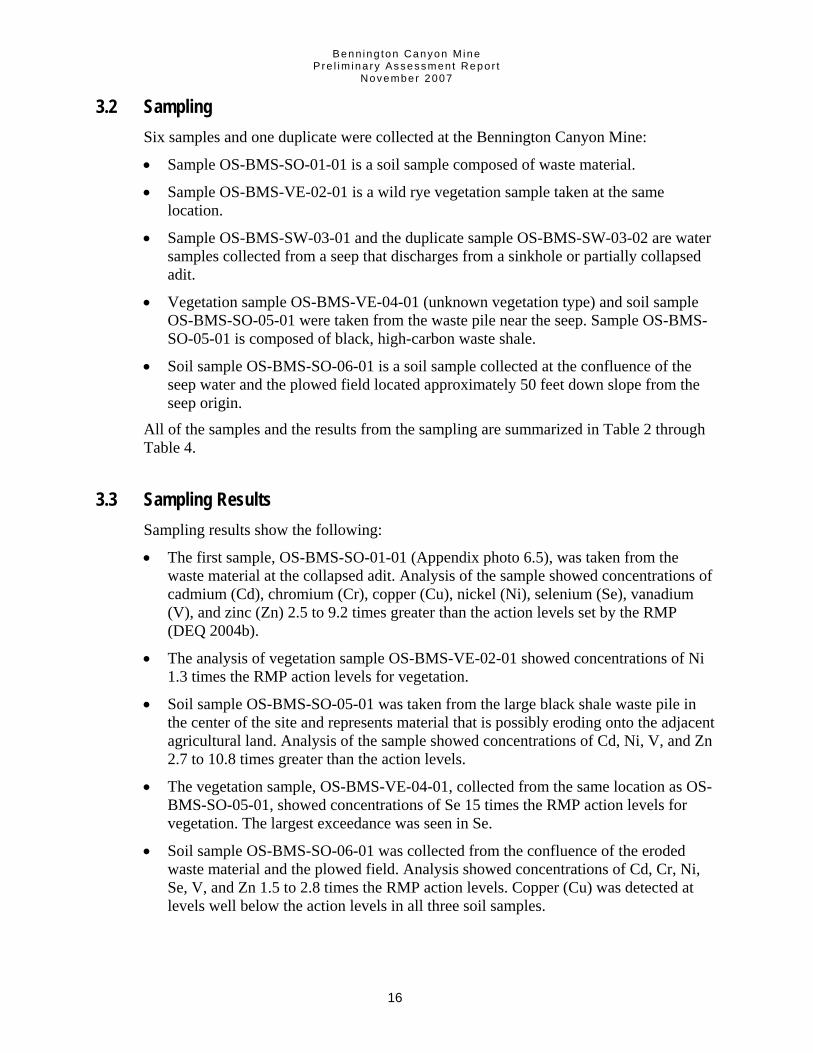
3.2 Sampling Six samples and one duplicate were collected at the Bennington Canyon Mine:
• Sample OS-BMS-SO-01-01 is a soil sample composed of waste material.
• Sample OS-BMS-VE-02-01 is a wild rye vegetation sample taken at the same location.
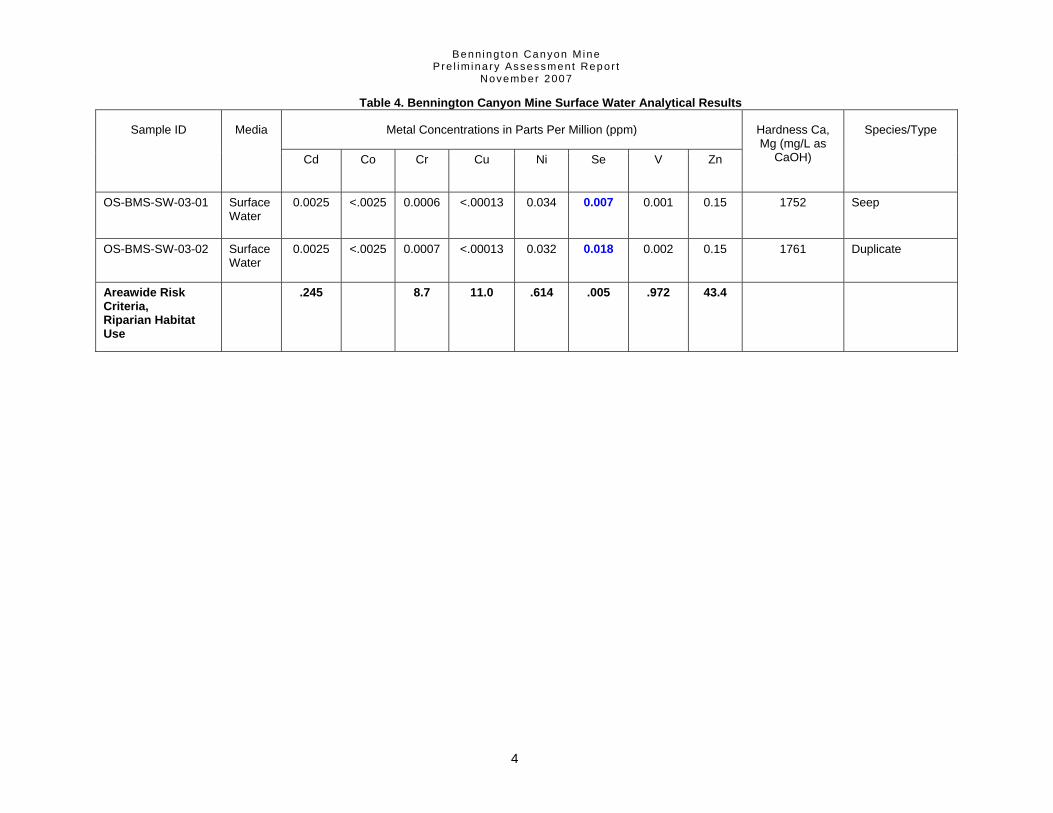
• Sample OS-BMS-SW-03-01 and the duplicate sample OS-BMS-SW-03-02 are water samples collected from a seep that discharges from a sinkhole or partially collapsed adit.
• Vegetation sample OS-BMS-VE-04-01 (unknown vegetation type) and soil sample OS-BMS-SO-05-01 were taken from the waste pile near the seep. Sample OS-BMS-SO-05-01 is composed of black, high-carbon waste shale.
• Soil sample OS-BMS-SO-06-01 is a soil sample collected at the confluence of the seep water and the plowed field located approximately 50 feet down slope from the seep origin.
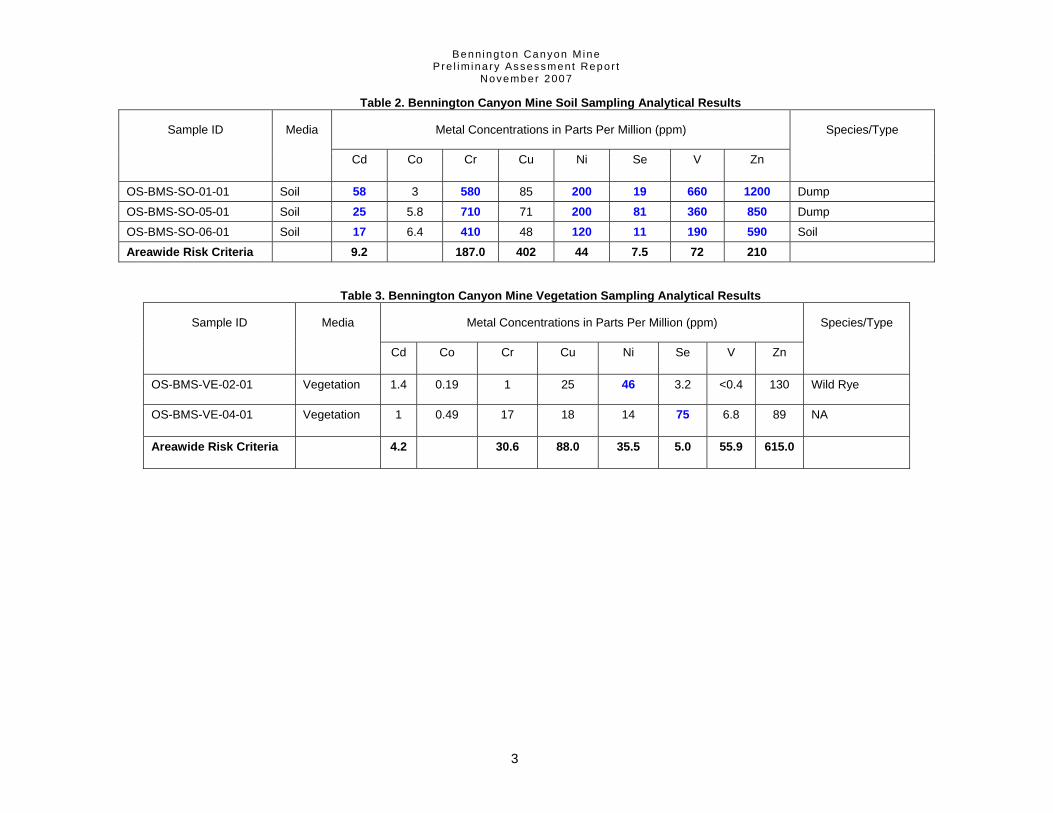
All of the samples and the results from the sampling are summarized in Table 2 through Table 4.
3.3 Sampling Results Sampling results show the following:
• The first sample, OS-BMS-SO-01-01 (Appendix photo 6.5), was taken from the waste material at the collapsed adit. Analysis of the sample showed concentrations of cadmium (Cd), chromium (Cr), copper (Cu), nickel (Ni), selenium (Se), vanadium (V), and zinc (Zn) 2.5 to 9.2 times greater than the action levels set by the RMP (DEQ 2004b).
• The analysis of vegetation sample OS-BMS-VE-02-01 showed concentrations of Ni 1.3 times the RMP action levels for vegetation.
• Soil sample OS-BMS-SO-05-01 was taken from the large black shale waste pile in the center of the site and represents material that is possibly eroding onto the adjacent agricultural land. Analysis of the sample showed concentrations of Cd, Ni, V, and Zn 2.7 to 10.8 times greater than the action levels.
• The vegetation sample, OS-BMS-VE-04-01, collected from the same location as OS-BMS-SO-05-01, showed concentrations of Se 15 times the RMP action levels for vegetation. The largest exceedance was seen in Se.
• Soil sample OS-BMS-SO-06-01 was collected from the confluence of the eroded waste material and the plowed field. Analysis showed concentrations of Cd, Cr, Ni, Se, V, and Zn 1.5 to 2.8 times the RMP action levels. Copper (Cu) was detected at levels well below the action levels in all three soil samples.

Benn ing ton Canyon M ine Pre l im ina ry Assessment Repor t
November 2007
17
• Water sample OS-BMS-SW-03-01, and its duplicate, OS-BMS-SW-03-02, were collected from the seep exiting the sinkhole in the center of the site. Analysis showed concentrations of Se 1.4 and 3.6 times the RMP action levels. All other analytes were below the RMP action levels.
Benn ing ton Canyon M ine Pre l im ina ry Assessment Repor t
November 2007
1
Bennington Canyon
Inset - Bennington Canyon Mine
Modified Site Sketch
0 0.25 0.50.125 Miles
0 0.04 0.080.02 Miles
Legend
Streets
Other Road
Inset
Bennington Canyon Road
OS-BMS-SO-01-01OS-BMS-VE-02-01
OS-BMS-SW-01-01OS-BMS-SW-03-02OS-BMS-VE-04-01OS-BMS-SO-05-01
OS-BMS-06-01
Sample LocationAdit LocationWaste Pile
Open Pit/CutBuilding
Agricultural Field
Figure 5. Bennington Canyon Mine Sample Locations.

Benn ing ton Canyon M ine Pre l im ina ry Assessment Repor t
November 2007
2
Benn ing ton Canyon M ine Pre l im ina ry Assessment Repor t
November 2007
3
Table 2. Bennington Canyon Mine Soil Sampling Analytical Results
Metal Concentrations in Parts Per Million (ppm) Sample ID Media
Cd Co Cr Cu Ni Se V Zn
Species/Type
OS-BMS-SO-01-01 Soil 58 3 580 85 200 19 660 1200 Dump
OS-BMS-SO-05-01 Soil 25 5.8 710 71 200 81 360 850 Dump
OS-BMS-SO-06-01 Soil 17 6.4 410 48 120 11 190 590 Soil
Areawide Risk Criteria 9.2 187.0 402 44 7.5 72 210
Table 3. Bennington Canyon Mine Vegetation Sampling Analytical Results
Metal Concentrations in Parts Per Million (ppm) Sample ID Media
Cd Co Cr Cu Ni Se V Zn
Species/Type
OS-BMS-VE-02-01 Vegetation 1.4 0.19 1 25 46 3.2 <0.4 130 Wild Rye
OS-BMS-VE-04-01 Vegetation 1 0.49 17 18 14 75 6.8 89 NA
Areawide Risk Criteria 4.2 30.6 88.0 35.5 5.0 55.9 615.0
Benn ing ton Canyon M ine Pre l im ina ry Assessment Repor t
November 2007
4
Table 4. Bennington Canyon Mine Surface Water Analytical Results
Metal Concentrations in Parts Per Million (ppm) Sample ID Media
Cd Co Cr Cu Ni Se V Zn
Hardness Ca, Mg (mg/L as
CaOH)
Species/Type
OS-BMS-SW-03-01 Surface Water
0.0025 <.0025 0.0006 <.00013 0.034 0.007 0.001 0.15 1752 Seep
OS-BMS-SW-03-02 Surface Water
0.0025 <.0025 0.0007 <.00013 0.032 0.018 0.002 0.15 1761 Duplicate
Areawide Risk Criteria, Riparian Habitat Use
.245 8.7 11.0 .614 .005 .972 43.4

Benn ing ton Canyon M ine Pre l im ina ry Assessment Repor t
November 2007
5
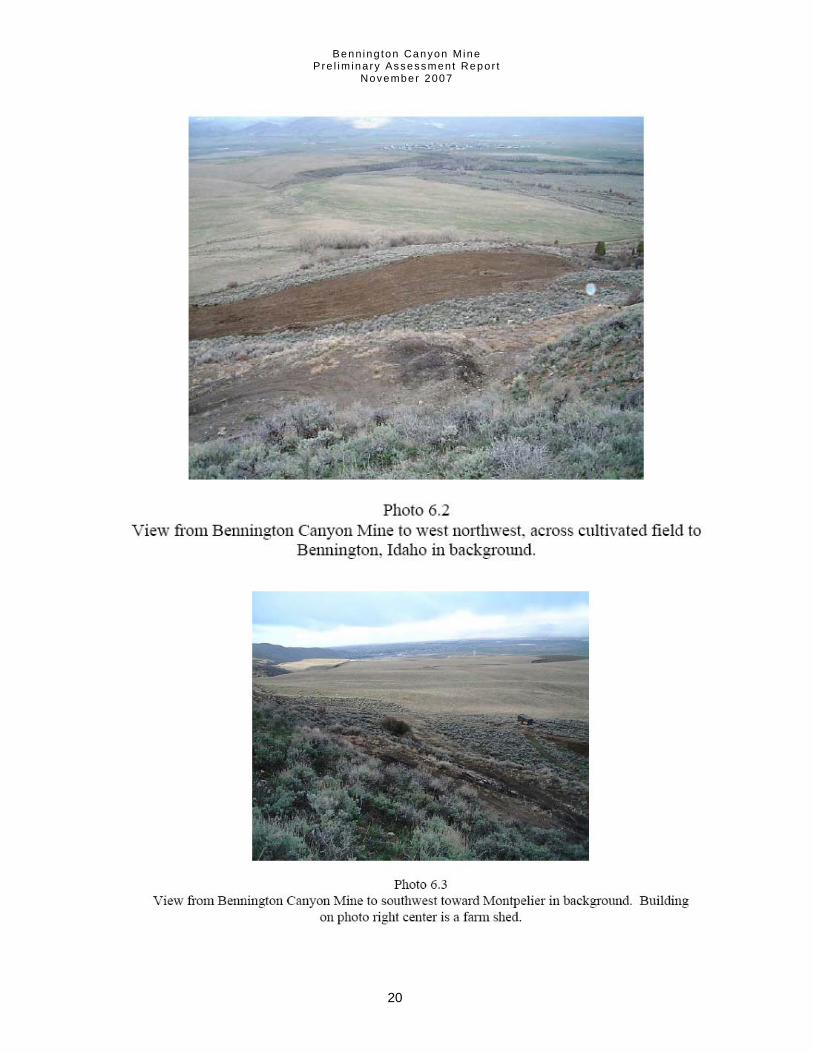
3.4 Inspection Findings The site supports an open pit, an old wooden structure, protruding metal works, a collapsed adit, a sinkhole and five waste rock dumps, one of which is being eroded by a seep that exits the sinkhole. (Appendix, Photo 6.6). The site has no reported signs or fencing.
An open pit is located approximately 75 feet up-slope to the east of an agricultural field. The main cut (open pit) is approximately 200 feet long and 50 feet wide, an it is almost completely void of vegetation and strikes north/south. Directly below the cut is a collapsed production adit. A remnant metal track protrudes from the adit, and the wooden structure that sits next to the adit retains some of the original metalwork and timbers. Directly south of the collapsed adit is a decrepit wooden structure that may have served as part of the production facility. A large sinkhole exists approximately 25 feet west (down slope) from the wooden structure. The sinkhole appears to be a partially collapsed adit.
The seep that emanates from the sinkhole has eroded the waste pile on which it flows and intersects a second waste pile down-slope. An irrigation pipe protrudes from the seep; indicating the possibility that the owner is using the seep to irrigate his field. Material eroding from the dumps appears to be migrating to the adjacent farm field.
There are five waste piles located on and near the mine. The largest is a pile of waste shale located at the north end of the cut that is approximately 50 feet across. Some of the waste has been excavated, possibly for use as road grade. Another, smaller pile of black waste shale is located at the south end of the cut and is approximately 35 feet across, and on the opposite (west) side of the field, between the field and the access road, is a small waste pile that is approximately 5 feet in diameter (Figure 6).

Benn ing ton Canyon M ine Pre l im ina ry Assessment Repor t
November 2007
6
Collapsed Adit
Wood Shed
Bennington Canyon Road
Open Pit
Unkn
own
Road
Waste Pile
Waste Pile
Waste Pile
Cultivated Field
Discharge from collapsed adit or sinkhole
Sample Location
100 feet
Figure 6. Bennington Canyon Mine Site Sketch modified from DEQ (2004).

Benn ing ton Canyon M ine Pre l im ina ry Assessment Repor t
November 2007
7
Section 4. Pathway and Environmental Hazard Assessment
Risk pathways and environmental hazards were assessed for groundwater, surface water, and soil/air exposure. The findings from these assessments are presented in the following.
4.1 Surface Water A sinkhole (possibly a collapsed adit) in the middle of the site is seeping water at a very low rate. The seep has eroded through the black shale waste dump from where it emerges, and is intersected with another waste pile down slope that spills onto the adjacent agricultural land. It is not known if the seep flows year round, and it does not appear to reach or connect with any other surface water bodies as no water is evident beyond the mine site. It appears the farmer may use the water for irrigation.
Bennington Canyon Creek drains west into Bear River, approximately 3.6 miles downstream from the site. It is not known whether this surface flow is continuous throughout the year.
There are approximately 21,937 acres of wetland within the 15 mile Target Distance Limit (TDL) of the site. (See Figure 4.) This area encompasses the large wetlands around the northern perimeter of Bear Lake.
4.2 Groundwater Idaho Department of Water Resources (IDWR) records show ground water flow in the area moves from the highlands westward toward the Bear Lake Valley floor. This flow is consistent with the topography of the area. It should be noted that the mine is located on or close to a fault (see Figure 3), which may also affect local ground water flow patterns. There is only one identified spring (seep) in the immediate vicinity, and that is on site.
Water levels of domestic wells nearest the site vary from 176 feet below ground surface (bgs) on the ridge near the mine to approximately 18 feet bgs near Joe’s Gap, to approximately 8 feet bgs on the valley floor near the town of Bennington.
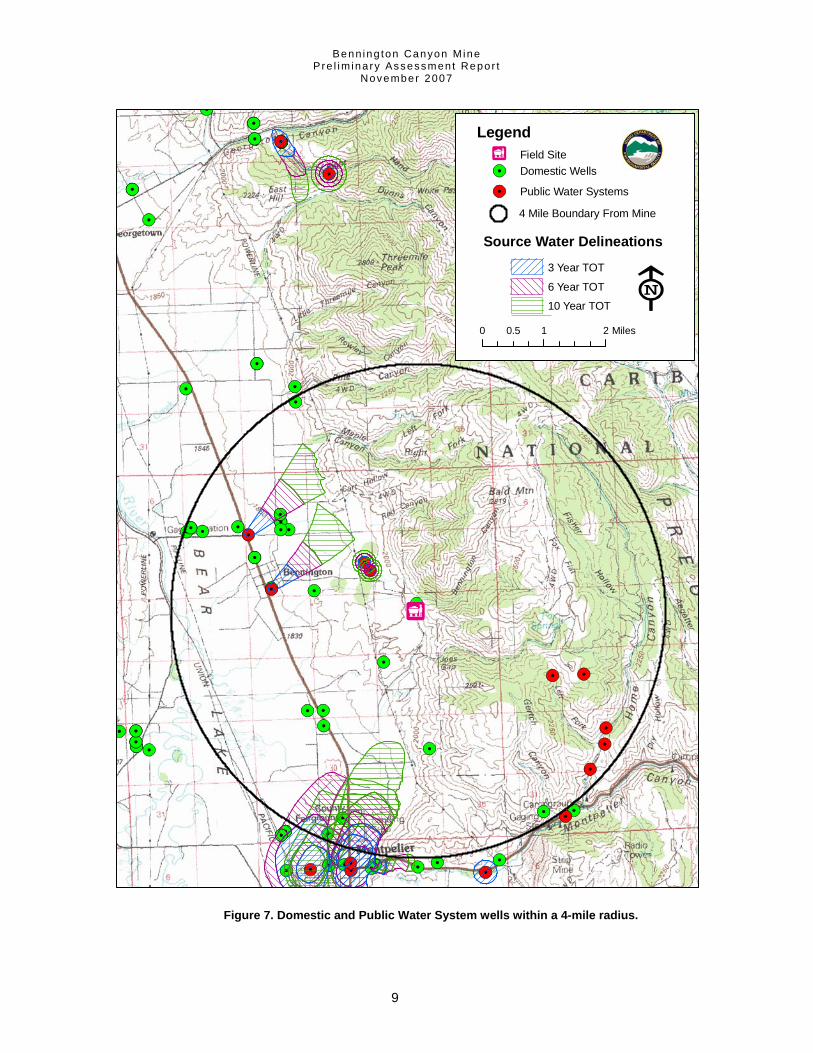
According to IDWR records, 23 domestic water wells are reported to be located within a 4-mile radius of the site (Figure 7). The majority of these wells are located along Bear Lake Valley, close to the nearby towns of Bennington and Montpelier. Nine public water systems are located within a 4-mile radius of the site:
• The Bennington Water System CRI well is located 3 miles NW of the site. According to Safe Drinking Water Information System (SDWIS) data (DEQ, 2006), this system services 279 users and has no water issues.
• The Bennington Water System spring well #1 is located 1.2 miles NW of the site. According to Safe Drinking Water Information System (SDWIS) data (DEQ, 2006), this system services 279 users and has no water issues.

Benn ing ton Canyon M ine Pre l im ina ry Assessment Repor t
November 2007
8
• The Bennington Water System spring well # 2 is located 1.2 miles NW of the site. According to Safe Drinking Water Information System (SDWIS) data (DEQ, 2006), this system services 279 users and has no water issues.
• The Bennington Water System well #1 is located 2.5 miles WNW of the site. According to Safe Drinking Water Information System (SDWIS) data (DEQ, 2006), this system services 279 users and has no water issues.
• The City of Montpelier spring well #1 is located 2.5 miles SE of the site. According to Safe Drinking Water Information System (SDWIS) data (DEQ, 2006), this system services 3,000 users and has no water issues.
• The City of Montpelier spring well #2 is located 3.5 miles SE of the site. According to Safe Drinking Water Information System (SDWIS) data (DEQ, 2006), this system services 3,000 users and has no water issues.
• The City of Montpelier spring well #3 is located 3.5 miles SE of the site. According to Safe Drinking Water Information System (SDWIS) data (DEQ, 2006), this system services 3,000 users and has no water issues.
• The City of Montpelier spring well #4 is located 2.5 miles SE of the site. According to Safe Drinking Water Information System (SDWIS) data (DEQ, 2006), this system services 3,000 users and has no water issues.
• The City of Montpelier spring well #5 is located 2.5 miles SE of the site. According to Safe Drinking Water Information System (SDWIS) data (DEQ, 2006), this system services 3,000 users and has no water issues.
Benn ing ton Canyon M ine Pre l im ina ry Assessment Repor t
November 2007
9
0 1 20.5 Miles
Legend
Source Water Delineations
10 Year TOT
3 Year TOT
6 Year TOT
Domestic Wells
Public Water Systems
Field Site
4 Mile Boundary From Mine
Figure 7. Domestic and Public Water System wells within a 4-mile radius.

Benn ing ton Canyon M ine Pre l im ina ry Assessment Repor t
November 2007
10
The public water wells shown in Figure 7 are down-gradient and cross-gradient from any of the mining activities; the blue hatching represents travel time for groundwater to migrate from the perimeter of the hatching to the extraction well. This gives a relative groundwater travel time for the area west of the mine. West of the mine site, wells appear to be completed in the alluvial materials associated with the Bear Lake Valley. Here, groundwater is very shallow and would travel at a much faster rate than in the surrounding highlands.
4.3 Soil Exposure and Air Access to the mine site is not restricted or posted. A spur road from Bennington Canyon Road allows public access to the site. Four-wheel drive vehicles may be able to drive down through Bennington Canyon on old abandoned roadways.
Due to the proximity of the site to access roads and actively plowed lands, soil ingestion for occasional recreation users and nonresidential workers is possible. Additionally, exposure to air borne contaminants should be considered due to the active farming of land in contact with mine waste and the reported poor vegetation on the excavation.
4.4 Potential Receptors Potential receptors include local residents, hunters, anglers, farmers, cattlemen, trail riders (motorized and non-motorized), campers, and, rarely, tourists. Cattle activity surrounding and within the mine site is unknown. Farmers, residents, and outdoor enthusiasts remain the likeliest potential receptors, as they reside nearby, till the soil, or use surrounding land for recreational activities.
The land within a two-mile radius of the site is primarily USFS and private land. The parcel of land occupied by the mine and waste dumps are owned by a private party.
4.4.1 Schools, Day-Care Facilities, Private Residences There are no schools, day-care facilities, or private residences within 200 feet of the site, but farmers and Forest Service workers, in addition to outdoor recreation enthusiasts, may occasionally be within 200 feet of the site.
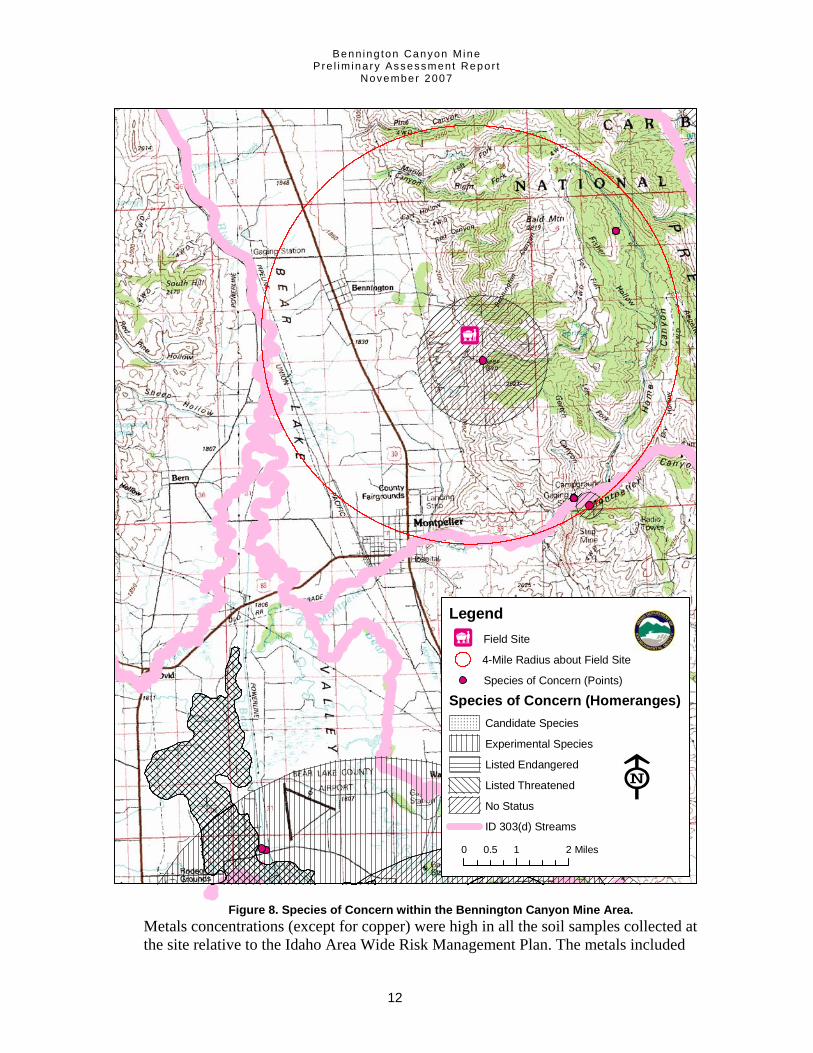
4.4.2 Plant and Animal Species of Concern Species of concern in the proximity of the site are shown in Figure 8. Species of concern within four miles of the site include the Peregrine Falcon, Northern Goshawk, Uinta Chipmunk, Townsend’s Big-eared Bat, Western small Footed Myotis, Long-eared Myotis, and Long-legged Myotis.
Red Glasswort and Purple Meadow-rue are the only plant species of concern within the 15 mile TDL of the site. Animal species listed as a species of concern located within the 15 mile TDL include the Eared Grebe, Western Grebe, Northern Leopard Frog,

Benn ing ton Canyon M ine Pre l im ina ry Assessment Repor t
November 2007
11
Townsend’s Big-eared Bat, Bald Eagle, Great Gray Owl, Trumpeter Swan and Whooping Crane (IDFG, 2002).
4.4.3 Soil Sample Concentrations Soil sample contained the following concentrations:
• Selenium (Se) from 11 to 81 mg/kg
• Copper (Cu) from 48 to 85 mg/kg
• Cadmium (Cd) from 17 to 58 mg/kg
• Chromium (Cr) from 410 to 710 mg/kg
• Vanadium (V) from 190 to 660 mg/kg
• Nickel (Ni) from 120 to 200 mg/kg
• Zinc (Zn) from 590 to 1,200 mg/kg
Complete analytical results are presented in Table 2 through Table 4. Arsenic was not analyzed for during this sampling event.
Benn ing ton Canyon M ine Pre l im ina ry Assessment Repor t
November 2007
12
Species of Concern (Homeranges)Candidate Species
Experimental Species
Listed Endangered
Listed Threatened
No Status
ID 303(d) Streams
0 1 20.5 Miles
Legend
Species of Concern (Points)
Field Site
4-Mile Radius about Field Site
Figure 8. Species of Concern within the Bennington Canyon Mine Area.
Metals concentrations (except for copper) were high in all the soil samples collected at the site relative to the Idaho Area Wide Risk Management Plan. The metals included

Benn ing ton Canyon M ine Pre l im ina ry Assessment Repor t
November 2007
13
cadmium, chromium, nickel selenium, vanadium, and zinc. These exposure criteria are considered for ecological receptors, as they are generally more sensitive to metals than human receptors.
The Risk Management Plan is intended to provide discretionary guidance for lead and support agency representatives responsible for administering site-specific activities under CERCLA at the mines within the Idaho Phosphate Mining Resource Area. Specific removal actions, goals, objectives, and action levels presented in the plan were developed to assist in focusing resources, identifying releases and areas of concern, minimizing future site-specific risk assessment needs, and making decisions about mine-specific risk management that use a regional perspective and that are consistent.

Benn ing ton Canyon M ine Pre l im ina ry Assessment Repor t
November 2007
14
This page intentionally left blank for correct double-sided printing.
Benn ing ton Canyon M ine Pre l im ina ry Assessment Repor t
November 2007
15
Section 5. Conclusions and Recommendations
The recommendations contained herein address not only localized release pathways and associated ecological risks but also any public safety concerns regarding the presence of open adits, portals, or mine shafts. The Bennington Canyon Mine is recommended for additional sampling, potential erosion control, and reclamation improvements. Additional actions, in the form of further site investigations, waste consolidation, erosion controls, and reclamation improvements, are also recommended.
5.1 Presence of Wetlands Based on official wetland surveys and aerial photographs of the area, approximately 21,937 acres of wetlands exist near the site or within the 15-mile TDL. However, potential impacts to wetland areas by this mine site appear minimal.
5.2 Impacts on Water Quality The surface water sample collected from the seep showed elevated concentrations of selenium (13 µg/l) above the Area Wide Risk Management Plan criteria for riparian habitat use and state water quality rule for regulated surface water (5 µg/l). As this was the only surface water quality sample collected, it is difficult to evaluate the impacts of the site on all surface water within the area of the mine site; however, this water does not appear to connect with existing surface water bodies in the area. It is important to note that the property owner appears to be using this water to irrigate his field.
Ground water impacts related to the mine site are currently unknown. However, there are no known impacts, and the nearby public water systems are located east and down/cross-gradient from the site. Potential down-gradient receptors are less than one-half mile away.
5.3 Potential Exposure for Wildlife and Vegetation The waste rock piles may present potential exposure for wildlife and vegetation. According the PA (DEQ 2004), the open pit had very little vegetation, and waste shale dumps are eroding onto an adjacent cultivated field. Vegetation appears to flourish around the mine area, and vegetation samples showed elevated levels of selenium and nickel. Native plant species may bio-accumulate high concentrations of metals that may be consumed by the local wildlife. Wildlife, such as deer and elk, that may be exposed to elevated concentrations of metals (via water, soil, or plant material) may be harvested and consumed by humans.

Benn ing ton Canyon M ine Pre l im ina ry Assessment Repor t
November 2007
16
5.4 Potential Exposure for Humans The public has access to the mine via the roads. There are no locked gates or posted signs in proximity to the mine site (DEQ 2004a).
Commercial or subsistence fishing does not occur within the 15-mile downstream distance, but sport fishing does. According to the Idaho Department of Fish and Game (IDFG) database fish presence in Bear River include; Redband Rainbow trout [Oncorhynchhus mykiss gairdneri], Bonneville Cutthroat trout [Oncorhynhus clarki Utah], Rainbow (hatchery) trout, Brown trout [Salmo trutta], Mountain Whitefish [Prosopium williamsoni] (IDFG, 2000). There is no information concerning potential fish population in Bennington Canyon.
Observations made during the site visit indicated evidence of recent human activity on site. The site also abuts a cultivated field, and there is evidence the farmer is using water from a mine seep for irrigation. Mountain bikers, hikers, hunters, snowmobile operators, off-road four wheeling enthusiasts, and various other outdoor recreation enthusiasts may also potentially frequent the area because access is not restricted.
Fugitive dust and direct contact with the waste piles are the two main mechanisms through which humans could be exposed to the metal concentrations at the site. These sources do not appear to present any immediate threat. Although the waste piles have been shown to have high metal concentrations, exposure for humans to elevated metal concentrations is low due to the remoteness of the site.
5.5 Recommendations Overall, the soil, vegetation, and surface water samples from the site showed elevated metal concentrations with respect to the Area Wide Risk Management Plan criteria. As a result, the agencies performing the 2002 PA recommended additional actions at the Bennington Canyon Mine site in the form of further site investigation, waste consolidation, erosion controls, closing adits and openings on the site, and reclamation improvements.
Additional recommendations based on DEQ’s current evaluation of the data include the following:
• Elimination of seep waters as a potential irrigation source.
• Re-contouring and revegetating those waste piles where natural vegetation has not established itself, and, if necessary, placement of clean soils and re-vegetation of these locations.
• Reclamation improvements to prevent impacted soils deposition on developed agricultural lands.

Benn ing ton Canyon M ine Pre l im ina ry Assessment Repor t
November 2007
17
References
Idaho Department of Fish and Game (IDFG), 2002. Available URL: http://www2.state.id.us/fishgame/info/cdc/plants/vasc_plants&status_n-r.htm
Idaho Department of Fish and Game (IDFG), 2000. Redband Trout Distribution. Available URL: http://www2.state.id.us/fishgame/info/cdc/plants/vasc_plants&status_n-r.htm
Idaho Department of Environmental Quality (DEQ), 2007. Mine Waste Management in Idaho: Selenium Investigations in Southeast Idaho. Available URL: http://www.deq.idaho.gov/waste/prog_issues/mining/selenium.cfm
Idaho Department of Environmental Quality (DEQ), 2006. Safe Drinking Water Information System (SDWIS).
Idaho Department of Environmental Quality (DEQ), 2004a. Orphan Mine Site Preliminary Assessment Screening Report. Prepared jointly by DEQ, Idaho Department of Lands, U.S. Bureau of Land Management, and the U.S. Forest Service. Available URL: http://giscenter-ims.isu.edu/SISP/Area_Wide_Reports.html
Idaho Department of Environmental Quality (DEQ, 2004b). Area Wide Risk Management Plan: Removal Action Goals And Objectives, And Action Levels For Addressing Releases And Impacts From Historic Phosphate Mining Operations In Southeast Idaho. Available URL: http://giscenter-ims.isu.edu/SISP/Area_Wide_Reports.html
Idaho Department of Environmental Quality (DEQ), 1998.1998 303(d) list. Available URL: http://www.deq.idaho.gov/water/data_reports/surface_water/monitoring/integrated_report.cfm#2002
Idaho Department of Water Resources (IDWR), 1997. COVERAGE IDOWN -- Idaho Surface Ownership.
IDWR2, 2002. GIS shapefile of well database. Montgomery Watson, 1998. Regional Investigation Report. Cited from Draft Final Investigation
Report for central Farmers Fertilizer Facility, Georgetown Canyon, August 2006. United States Geological Survey (USGS), 1991. Digital map file of major land uses in the United
States. United States Geological Survey (USGS), 2000. A History of Phosphate Mining in Southeast
Idaho. Available URL: http://pubs.usgs.gov/of/2000/of00-425/

Benn ing ton Canyon M ine Pre l im ina ry Assessment Repor t
November 2007
18
This page intentionally left blank for correct double-sided printing.

Benn ing ton Canyon M ine Pre l im ina ry Assessment Repor t
November 2007
19
Appendix: Photographs
The following photographs were taken during the Preliminary Assessment (DEQ, 2004a).
Benn ing ton Canyon M ine Pre l im ina ry Assessment Repor t
November 2007
20

Benn ing ton Canyon M ine Pre l im ina ry Assessment Repor t
November 2007
21

Benn ing ton Canyon M ine Pre l im ina ry Assessment Repor t
November 2007
22

Benn ing ton Canyon M ine Pre l im ina ry Assessment Repor t
November 2007
23
This page intentionally left blank for correct double-sided printing.
Benn ing ton Canyon M ine Pre l im ina ry Assessment Repor t
November 2007
24
Report Index
action level, 15 action levels, 15, 16 anglers, 25 aquatic life, 1 Area Wide Rick Management Plan, 15 Area Wide Risk Management Plan, 15 Beal Lake National Wildlife Refuge, 11 Bear Lake, i, 2, 6, 8, 10, 22, 25 Bear Lake County Tax Assessor, 6 Bear Lake National Wildlife Refuge, 11 Bear River, 10, 22, 31 Best Management Practices (BMPs), 2 bikers, 31 biking, 10 Bloomington, 22, 23 boating, 10 brook trout, 10, 31 Bureau of Land Management (BLM), 1 C. C. Jones, 6 C. Van Clark, 6, 7 campers, 25 cattle, 25 cattlemen, 25 Cherty Shale., 9 City of Bloomington, 22, 23 Comprehensive Environmental Response,
Compensation, and Liability Act (CERCLA), 1
Conover Wright, 6, 7 Croy Creek Road, 2 D. Charles Regan, 7 deer, 30 Dinwoody Formation, 9 domestic wells, 22, 30 dust, 31 Earth Sciences, Inc., 6 Edward G. Rosenheim, 6, 7 elk, 30 exploration trench, 2 F. P. Van Horn, 6, 7 F. R. Richards, 6
farmer, 22, 31 farmers, 25 fence, 31 fish population, 10, 31 fishing, 10, 31 Forest Service (USFS), 1 Frank D. Maxwell, 6, 7 Grandeur Limestone, 9 grazing, 2, 10 ground water flow, 22 hammer mill, 7 hikers, 31 hiking, 10 Homestead Laws, 6 hot spring, 10 Houston T. Hitt, 6, 7 hunters, 25, 31 Idaho Department of Water Resources
(IDWR), 22 Idaho Inspector of Mines, 7 Idaho Phosphate Mining Resource Area, 1,
2, 3, 9, 28 Idaho-Wyoming-Utah Overthrust belt, 9 Initial Default Target Levels, 28 Initial Default Target Levels (IDTLs), 28 J. J. Taylor, 6 J. P. Gilmore, 7 J.C. McKinley, Sr., 6 J.L. Ogilvy, 6 Joe’s Gap, 6, 22 John C. Nelson, 6 John Lemp, 6 Lemp Development Company, Inc, 6 limestone, 9 Mesozoic, 8, 9 Middle Pleistocene, 8 Milligen formation, 9 Milton Robison, 6, 7 Mineral Hill Mining District, 2 Mountain Copper Company, Ltd, 6 mountainwhitefish, 10, 31

Benn ing ton Canyon M ine Pre l im ina ry Assessment Repor t
November 2007
25
National Toxics Rule, 2 national wildlife refuge, 10 off-road vehicle, 10 orphan mine site, 1, 2 Paleozoic, 8, 9 Paris Overthrust, 10 Permian Era, 9 Phosphoria Formation, 9 public access, 25 public water systems, 30 rainbow trout, 10, 31 residents, 25 Rex Chert, 9 rhyolite, 8 San Francisco Chemical Company (SFCC),
6 schools,, 25 sedimentary rocks, 8
selenium, 1, 2, 28, 30, 32 shale, 16, 20, 22, 30 snowmobile, 31 soil ingestion, 25 Soilife, Inc., 7 swimming, 10 target distance limit (TDL), 11 Target Distance Limit (TDL), 22 Teton Phosphate Company, 6, 7 tourists, 25 trail riders, 25 waste piles, 30, 31 waterways, 10 Wells Formation, 9 wetland, 11, 22, 30 wetlands, 10, 11, 22, 30 wild rye, 16 wood river sculpin, 10, 31