benefits of water safety plans: microbiology, compliance ... · benefits of water safety plans:...
TRANSCRIPT

Benefits of Water Safety Plans Microbiology Compliance and PublicHealthMaria J Gunnarsdottirdagger Sigurdur M Gardarssondagger Mark ElliottDagger Gudrun Sigmundsdottirsect
and Jamie BartramDagger
daggerFaculty of Civil and Environmental Engineering University of Iceland Hjardarhaga 2-6 107 Reykjavik IcelandDaggerWater Institute Gillings School of Global Public Health University of North Carolina at Chapel Hill Chapel Hill North CarolinaUnited StatessectDirectorate of Health Baronsstig 47 101 Reykjavik Iceland
S Supporting Information
ABSTRACT The Water Safety Plan (WSP) methodology which aims toenhance safety of drinking water supplies has been recommended by theWorld Health Organization since 2004 WSPs are now used worldwide and arelegally required in several countries However there is limited systematicevidence available demonstrating the effectiveness of WSPs on water qualityand health Iceland was one of the first countries to legislate the use of WSPsenabling the analysis of more than a decade of data on impact of WSP Theobjective was to determine the impact of WSP implementation on regulatorycompliance microbiological water quality and incidence of clinical cases ofdiarrhea Surveillance data on water quality and diarrhea were collected andanalyzed The results show that HPC (heterotrophic plate counts)representing microbiological growth in the water supply system decreasedstatistically significant with fewer incidents of HPC exceeding 10 cfu per mL insamples following WSP implementation and noncompliance was alsosignificantly reduced (p lt 0001 in both cases) A significant decrease in incidence of diarrhea was detected where a WSPwas implemented and furthermore the results indicate that population where WSP has been implemented is 14 less likely todevelop clinical cases of diarrhea
INTRODUCTIONThe Water Safety Plan (WSP) methodology for ensuring thesafety of drinking water supplies with its approach tosystematic preventive management and risk assessment hasbeen recommended by the World Health Organization(WHO) since its incorporation in the third edition of theWHO Guidelines for Drinking Water Quality in 2004 and againin the fourth edition in 201112 WSPs have become widely usedand are incorporated into legal requirements for water utilitiesin several countries However systematic evidence for theeffectiveness of WSPs in improving water quality and health islacking and stakeholders recognize the need for research tostrengthen the evidence base3 In Iceland the use of the WSPsby drinking water utilities was legislated in 19954 Implementa-tion has progressed steadily and by 2008 over 80 of thepopulation was served by a water utility with a WSP5 Thestaggered implementation and long duration of WSP use inIceland as well as availability of water quality data andsurveillance data on diarrhea in humans provide a uniqueopportunity to evaluate systematically the impacts of WSPs onwater quality and public healthThe WSP methodology is more comprehensive than
conventional approaches to drinking water safety addressing
the whole water system from catchment to consumer with thegoal of preventing contamination at each stage6 This is incontrast to conventional approaches to drinking water qualitythat focus primarily on ensuring that drinking water meetsgovernment standards for biological and chemical parameterswith end-point testing The WSP approach includes forexample improved maintenance policies and proceduressystematic repair of pipes a cleaning plan (eg regular flushingof fire hydrants and cleaning of reservoir tanks) andimprovements in the system (eg backflow prevention) Suchinterventions are expected to reduce microbial growth in thesystem prevent infiltration of contaminants and result in saferwaterIceland is a developed country with a population of 320 000
inhabitants with well-run municipal water utilities and 100piped drinking water supply7 Iceland is also one of thefreshwater-richest countries in the world estimated at around600 thousand m3 per person per year8 with good access to
Received January 29 2012Revised June 5 2012Accepted June 7 2012Published June 7 2012
Article
pubsacsorgest
copy 2012 American Chemical Society 7782 dxdoiorg101021es300372h | Environ Sci Technol 2012 46 7782minus7789
quality groundwater About 95 of the countryrsquos pipeddrinking water supply originates from groundwater Ground-water is typically not treated prior to distribution unless there isa danger of surface water intrusion Surface water (used by lessthan 5 of the population) and groundwater under directinfluence of surface water are typically treated by filtrationfollowed by UV disinfection9 Residual disinfection withchlorine or other disinfectants is not practiced in Iceland5
Local Competent Authority (LCA) is responsible forsurveillance of drinking water protection and complianceLegal requirements on protecting the sources of drinking waterhave been included in the Icelandic Drinking Water Regulation(IDWR) since 2001 obligating the LCA to define protectionaround water intakes The Primary Health Care Centers(PHCCs) are required to collect and report data on diarrhealdiseases to the Chief Epidemiologist at the Directorate ofHealthIn 1995 Iceland became one of the first countries to legislate
the use of WSPs4 implementation began with ReykjavikEnergy in the spring of 19975 Five years later eleven utilitiesserving 63 of the population had implemented a WSP and bythe end of 2008 thirty-one utilities serving 81 had WSP inplace510 Preliminary evidence indicates that WSP implemen-tation in Iceland has resulted in increased compliance withIDWR A preliminary evaluation carried out in 2008 at twowater utilities City of Reykjavik and Akureyri town showedcompliance increasing following WSP implementation from94 to 99 at Reykjavik and from 88 to 99 at Akureyrirespectively10 Research at sixteen water utilities in 2009 anddevelopment of a scoring system to evaluate performance ofWSP showed that nine out of sixteen utilities got a satisfactoryscore however the range in scoring was great5 Results fromthat research also indicated that the process of implementing asystematic preventive approach to water safety improved theutility culture regarding drinking water as a public health issueBut the question of whether there are measurable benefits fromhaving a WSP was unansweredAlthough waterborne disease is a much greater burden in
developing countries it is essential that the causes of bothendemic and epidemic diarrheal disease from drinking watersupply be addressed in wealthy countries like Iceland Therewere 12 confirmed waterborne disease outbreaks in Icelandbetween 1984 and 2011 Six were due to Campylobacter and sixwere due to norovirus11 The last confirmed outbreak was in2004 and at least one contamination event has been confirmedsince 2004 but was not associated with adverse healthimpacts12 All of these outbreaks were at small water utilitiesHowever absence of detected outbreaks of disease is not areason for complacency11314 as endemic and sporadic cases ofgastrointestinal illness and small waterborne outbreaks can beundetected by surveillance systems15 Research also indicatesincreased risk for gastrointestinal illness during pressure loss ina distribution system A cohort-study among recipients of waterfrom seven larger water utilities in urban areas in Norwayduring the years 2003minus04 showed that breaks and maintenancework in the distribution systems were associated with anincreased risk for gastrointestinal illness among waterrecipients16 and a similar study in England and Wales showeda strong association between self-reported diarrhea andreported low water pressure at the faucet17 These examplesindicate that addressing health risk from drinking water indeveloped countries requires an approach like WSPs that canaddress risk at all stages of supply particularly in the
distribution system and establish appropriate procedures formaintenance and operationThe aim of this study was to determine the impact of WSP
implementation on (a) regulatory compliance (b) micro-biological water quality and (c) incidence of clinical cases ofdiarrhea using comprehensive surveillance data
MATERIALS AND METHODSDesign of Study The design of this study is an
observational retrospective cohort study The uptake areaswithout WSP were considered risk exposed (nonintervention)and the uptake areas with WSP were nonrisk exposed(intervention) The following indicators were compared inwater utilities before and after implementing WSP (1)percentage of annual compliance with drinking water regulationin heterotrophic plate counts (HPC) total coliform and E colibacteria (2) the number of colony forming units (cfu) by HPCin water and (3) incidence of diarrhea per 1000 inhabitants permonthFor (1) and (2) five utilities were chosen for analysis of water
quality and compliance data based on the following criteria (a)available data for water quality and compliance (b) at least twofull years of data with and two full years of data without WSPand (c) at least 100 regular water quality compliance samplesreported during the study periodFor (3) the inclusion criteria for the PHCCs were the
following (a) data availability of reported monthly number ofcases of diarrhea during the study period (defined below) (b)that the entire population in the uptake area for the PHCC hadreceived piped drinking water from a single water utility and(c) the geographic boundary of service for the PHCC wasstable over the period of study (eg two community clinicswere not consolidated into one during the study period) Thesecriteria eliminated 42 of the 60 PHCCs leaving 18 for inclusionin the study whereof 7 could be tested for before and afterWSP
Data Collection for Water Quality Regular monitoring ofmicrobiological and chemical parameters is carried outaccording to Icelandic Drinking Water Regulation (IDWR)18
and the European drinking water directive19 at all water utilitiesover a certain size (gt50 users) with frequency of samplingaccording to population To be in compliance with IDWR theHPC in a water sample must contain less than 100 cfu per mLat 22 degC and zero value for both total coliform and E coli in100 mLData for compliance of HPC total coliform and E coli were
collected from five water utilities either from the LCA or fromthe utility where sufficient data and period before and afterWSP implementation were available Results from 1562 regularmonitoring samples were included Repeated monitoring thatwas carried out because of deviation incidence real orsuspected and monitoring after complaints from users wereexcluded to increase conformity between cases and avoid biasThe five water utilities serve around 24 of the population ofIceland WSP were implemented in the five water utilitiesbetween 1998 and 2007 and data on water quality extendedfrom 8 up to 13 years before implementation and 3 to 10 yearsafter Time of implementation was based on the month whenthe WSP was certified by the LCA In some of the water utilitiesthe frequency of sampling was reduced as regulatorycompliance improved as permitted in the IDWR since 2001Scope of data available for the five water utilities as well as theperiods before and after WSP implementation is shown in
Environmental Science amp Technology Article
dxdoiorg101021es300372h | Environ Sci Technol 2012 46 7782minus77897783
Supporting Information (SI) Tables S1 and S5 In no casewere electronic data available In subsequent analysis the waterutilities are labeled with V followed by a number forsimplification and in order to keep them anonymousData Collection on Diarrhea in Humans The Chief
Epidemiologist for Iceland at the Directorate of Health isresponsible for maintaining a register of communicable diseasesaccording to Act no 191997 on Health Security andCommunicable Diseases Diarrhea is a notifiable disease withmonthly reporting of number of cases from the PHCCs to theChief Epidemiologist The reporting is based on the Interna-tional Classification of Diseases (ICD-10)20 for standarddiagnostic classification of diseases which is used almost forthe entire health care system in Iceland For every patientseeking health care one or more ICD-10 codes are selected bythe physician and entered into each patient record For thisstudy data from the monthly reporting for the two followingICD-10 codes representing diarrhea were selected and collectedfrom the Chief Epidemiologists register on communicablediseases
bull A09 - Diarrhea and gastroenteritis of presumed infectiousorigin
bull A05 - Other bacterial food-borne intoxications notelsewhere classified
These codes are notifiable without personal identification Alldata available from individual PHCCs on the above ICD-10codes were collected from January 1997 to the end of 2009Over the 13-year (156-month) period of the study the totalnumber of clinic-months of data available was 2408 (see SITable S2) Delivery of data for these eighteen PHCCs wasapproximately 90 Nonconformity and missing data wereobserved at each PHCC and rectified with the help of ChiefEpidemiologist and regional or local PHCC if possibleAdequate data on diarrhea in humans were available forPHCCs with uptake areas served by seven water utilities beforeand after the implementation of WSP of these two alsoprovided adequate water quality data The seven water utilitiesare sufficiently localized so minimal commuting exists betweenthe service areas Additionally data for eleven PHCCs werecollected four had an uptake area served by water utilities witha WSP during the entire study period and seven had uptakeareas that were served by water utilities without a WSP at anytime during the study period The uptake areas for theseeighteen PHCCs covered approximately 38 of the populationof Iceland Scope of data and population for the PHCCs wheredata on diarrhea were obtained is shown in SI Tables S2 andS5Data on population in the uptake areas for the PHCCs were
obtained from the Web site of Statistics Iceland21 and from theAdministration Office of PHCC in the capital area Thepopulations served by the PHCCs are generally connected topostal codes in the uptake areas one exception is in the capitalarea where people can more easily choose among PHCCsThere are nineteen PHCCs in the greater capital area five ofwhich were included in this study
Testing for Confounders and Strength of the DataCorrelation tests between diarrhea and pneumonia wereconducted at three PHCCs (V1 V16 and V17) The threePHCCs selected had significant difference in incidence ofdiarrhea before and after WSP implementation and sufficientmonths of data that coincided The correlation test examinesfactors other than WSP that could affect these diseasessimultaneously such as changes in definitions or methods forreportingregistering Pneumonia was selected as it is acommon disease which is notifiable to the Chief Epidemiol-ogist and reported in the same way as diarrhea using the ICD-10 codes J12minusJ18 with subcodes for pneumonia Whileassociated with water supply through the impact of wateravailability on hygiene there is no evidence to suggest anassociation of pneumonia with water qualityIn addition the correlation between interventions in water
utilities and diarrhea incidence was investigated This wasassessed by testing the correlation between the WSP scoring ofsixteen water utilities and the diarrheal incidence in thePHCCs uptake areas that the water utilities were serving Tenof the water utilities had implemented a WSP and were ratedaccording to the WSP scoring system reported in a previousstudy5 and six were without WSP and were given a score ofzero Surveillance data on diarrhea from the Chief Epidemiol-ogists register were available for all PHCCs uptake areas servedby these sixteen water utilities Data availability is given in SITable S3
Statistical Analysis Statistical analysis was conducted withSPSS 19 For all data sets mean median 5th and 95thpercentiles and range were calculated before and after WSPimplementation Statistical significance was set as two tail and at5 (p = 005)The binary logistic regression test was used when analyzing
the relative frequency of two possible outcomes (egcompliance vs noncompliance) It tests whether noncomplianceto drinking water regulation in the parameters HPC totalcoliform and E coli was significantly more frequent before thanafter WSP implementation The binary logistic regression testwas also used to examine if there was difference in HPC beforeand after the WSP implementation this comparison was basedon an HPC concentration of 10 cfu per mLWhen analyzing the difference in numerical values (eg
bacterial concentration or diarrheal incidence) two tests wereused the t test was used for parametric analysis and the MannminusWhitney U test was used for nonparametric analysisUnivariate two-way ANOVA test was used to compare
diarrheal incidence before and after WSP implementation in allseven PHCCs The difference in mean before and after WSPimplementation at each of the seven PHCCs was then testedwith a posthoc t test To adjust for multiple comparisons theBonferroni correction was used accordingly the significancelevel was divided by number of tests conducted (n = 7) p =000714 (0057) For the supporting evidence of correlationbetween diarrhea and pneumonia a nonparametric Kendalls tautest was used and Persons correlation was used for WSPscoring and incidence of diarrhea
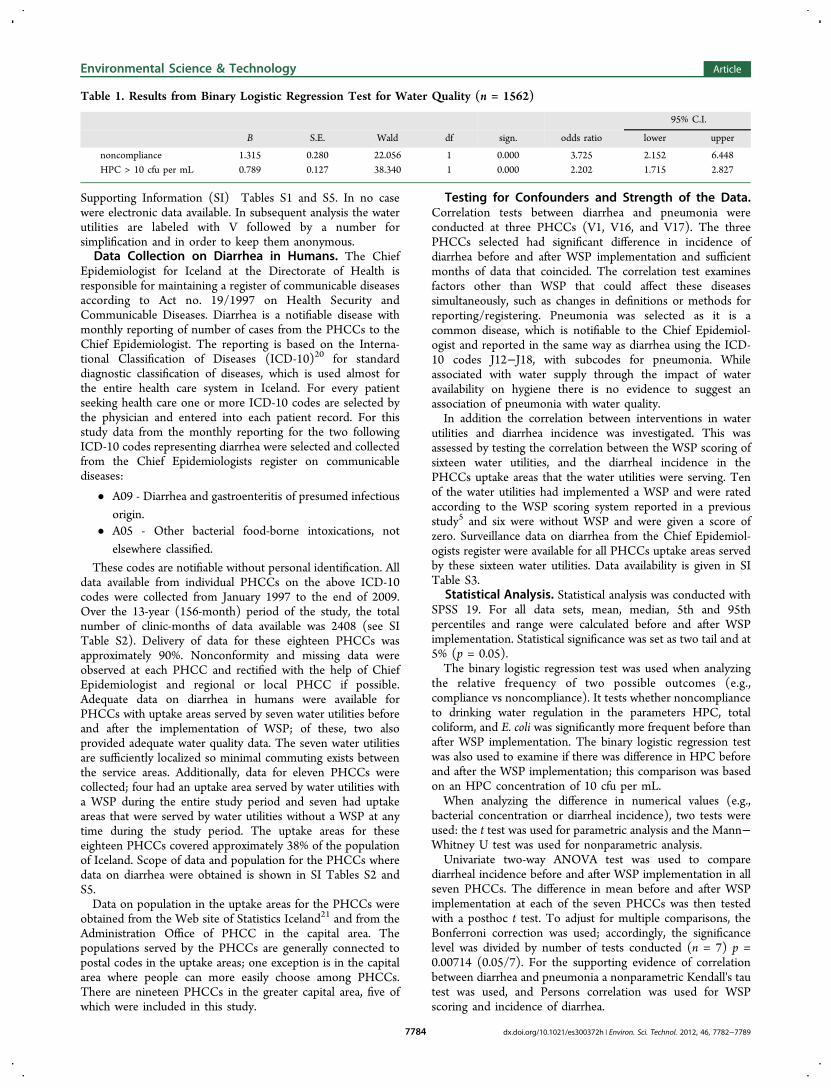
Table 1 Results from Binary Logistic Regression Test for Water Quality (n = 1562)
95 CI
B SE Wald df sign odds ratio lower upper
noncompliance 1315 0280 22056 1 0000 3725 2152 6448HPC gt 10 cfu per mL 0789 0127 38340 1 0000 2202 1715 2827
Environmental Science amp Technology Article
dxdoiorg101021es300372h | Environ Sci Technol 2012 46 7782minus77897784
RESULTS
Compliance with Icelandic Drinking Water Regulation(IDWR) Surveillance data for drinking water showed a decreasein noncompliance with IDWR requirements following WSPimplementation (p lt 0001) as shown in Table 1 Mean annualnoncompliance declined following implementation of a WSP atfour of the five water utilities investigated as shown in Figure 1Mean noncompliance across all five utilities declinedapproximately 80 (from 77 of samples to 15)
Noncompliance can result from a violation in any or all ofthe three following parameters HPC total coliform or E colibacteria (as described in Materials and Methods) The totalnumber of incidents of noncompliance decreased from 85 (outof 955 samples) before WSP implementation down to 16 (out
of 607 samples) after WSP in all five water utilities combinedHPC violations were the most common cause of non-compliance both before and after WSP implementation seeSI Table S6 for detailsAccording to IDWR water samples should be obtained at
both the source (eg at the borehole or a well from whichgroundwater is pumped) and from the piped distributionsystem For the 1562 samples 33 were taken at the source and67 were taken from the distribution network Samples fromthe source were in compliance more often than those from thedistribution network Noncompliance at the source reducedfrom 48 to 23 following WSP implementation while thereduction was from 107 to 28 in the distribution network
Heterotrophic Plate Count (HPC) in Drinking Water InFigure 2 HPC is plotted for the five utilities before and afterWSP implementation The figure shows that number of HPCthat were above the upper cutoff level 10 cfu per mL at all fiveutilities decreased following a WSP implementation A binarylogistic regression test showed that the decrease was significant(p lt 0001) as shown in Table 1Table 2 provides detailed information on HPC bacteria in
samples taken before and after WSP implementation at the fivewater utilities It shows that the median is higher before thanafter WSP implementation at all water utilities except at V15although at V15 there were only 2 noncompliances before WSP(during 8 years) and 2 after WSP (during 7 years) and lowHPC both before and after WSP yielding unreliable resultsHowever the difference in the median is only significant for twoof the five utilities V5 and V16 according to nonparametrictest Table 2 shows also that when all sample results werecombined and also when samples at the source and in thedistribution system were compared separately the median HPC
Figure 1 Mean annual noncompliance with IDWR at five waterutilities before and after WSP
Figure 2 Boxplot of HPC before and after WSP implementation at five water utilities showing sampling site of outliers (S = water source D =distribution network) The broken line shows 10 HPC in samples
Environmental Science amp Technology Article
dxdoiorg101021es300372h | Environ Sci Technol 2012 46 7782minus77897785
was significantly lower after WSP implementation (p lt 0001for all three comparisons)Additionally HPC concentrations were more consistent
following WSP implementation with a decreased range and adecrease of the 95th percentile value as can be seen in Table 2Most outliers were recorded before WSP implementation andmore often in the distribution network than at the source as canbe seen in Figure 2Incidence of Diarrhea Figure 3 and Table 3 show the
difference in diarrheal incidence before and after WSPimplementation The mean incidence of diarrhea for all thesurveillance data set studied here which covers about 38 ofthe population of Iceland is 17 per 1000 inhabitants per
month or 002 per person year as shown in SI Table S4 Whendata from all seven PHCCs were combined univariate two-wayANOVA indicated an overall significant reduction of diarrhealincidence (F (1982) = 232 p lt 0001 ηp
2 = 019) this test alsoindicated that there was a significant interaction betweenPHCC and WSP status (eg that the difference in diarrhealincidence varied between PHCCs) (F (6982) = 53 p lt 0001ηp
2 = 024) Diarrheal incidence was significantly reduced at fiveout of seven PHCCs (Table 3) this finding was confirmedusing the Bonferroni correction to account for the problem ofmultiple comparisons (tested at significance level αn of p lt000714)
Table 2 Statistical Summary of HPC in Water Samples at Five Water Utilities Before and After WSP
water utility status no of water samples meana mediana percentilesa (5th 95th) rangea (min max) Pnonparam (2 tail)
V4 before WSP 159 197 1 0 1215 0 540 0617after WSP 96 54 08 0 210 0 140
V5 before WSP 250 330 2 0 1467 0 1300 0001after WSP 103 51 1 0 188 0 200
V12 before WSP 100 450 2 0 2060 0 1500 0104after WSP 35 37 1 0 213 0 26
V15 before WSP 51 75 1 0 574 0 105 0082after WSP 78 22 1 0 131 0 25
V16 before WSP 395 612 11 1 182 0 2800 lt0001after WSP 295 214 6 1 846 0 1300
all samples before WSP 955 423 5 0 1440 0 2800 lt0001after WSP 607 126 3 0 450 0 1300
all samples at source before WSP 294 160 2 0 744 0 580 lt0001after WSP 218 67 1 0 210 0 200
all samples in distribution network before WSP 657 540 6 0 1810 0 2800 lt0001after WSP 393 159 4 0 543 0 1300
acfumL HPC colony forming units per milliliter in water sample
Figure 3 Incidence of diarrhea before and after WSP at seven PHCCs
Environmental Science amp Technology Article
dxdoiorg101021es300372h | Environ Sci Technol 2012 46 7782minus77897786
Supporting Information Table S4 shows diarrheal incidencefor both those groups of PHCCs that experienced a change inWSP status during the study and those with and without WSPfor the entire study period both the mean and the median rateof diarrhea were lower when WSPs were in use and 95percentile was reduced by halfConfounders and Strength of the Data It was
hypothesized that decreases in diarrheal incidence over timecould possibly be attributable to changes in the Iceland healthcare system or broader improvements in population health Totest whether the decline in diarrhea was not attributable tothese factors but rather to WSP implementation data forpneumonia for three PHCCs were collected as a controlvariable A nonparametric correlation test between pneumoniaand diarrhea for these three PHCCs did not show significantrelation between the rate of the two diseases (V1 r = 0094 p =0119 n = 129 V16 r = 0053 p = 0363 n = 135 V17 r =minus0053 p = 0377 n = 144) providing further evidence that thereduction in diarrheal incidence was attributable to WSPimplementationFigure 4 shows the incidence of diarrhea as a function of
WSP scoring for sixteen water utilities for 20095 The figureshows a trend suggesting a lower incidence for water utilities
with high WSP score but the trend is not significant accordingto parametric test (r = minus0443 p = 0086 n = 16)
DISCUSSION
This study provides systematic evidence of the positive impactsof WSPs on drinking water quality and health These dataindicate that WSP implementation in Iceland resulted insubstantial and measurable reductions in drinking waternoncompliance amount of HPC in water (both at the sourceand in the distribution system) and incidence of diarrhea incommunities served by utilities implementing WSPThe strength of the study is that it covers a large proportion
of a national population well over one-third of the populationfor diarrhea incidence and nearly one-fourth for water qualityTherefore there is a substantial amount of data behind theresults The uniformity of the Icelandic society both sociallyand culturally is a further strength Additionally bothconsumers and health workers were unaware of the WSPimplementation and were therefore effectively blinded to theintervention These results are further supported by the factthat there is no correlation between incidence of diarrhea andpneumonia indicating that the findings on diarrheal diseaseincidence were not influenced by broader trends in theIcelandic health care system Using a previous analysis thatscored the strength of WSP implementation at various utilitiesin Iceland revealed a possible correlation between betterfunctioning WSP and lower diarrheal incidence howeverlimited data were available and the trend was not statisticallysignificantThere were some limitations that could have influenced the
results obtained There was some nonconformity in deliveringand recording data from the PHCCs into the nationalsurveillance system There was a variation in how the physiciansused the ICD-10 codes as different physicians used differentICD-10 codes for the same diseases and symptoms Addition-ally physicians change frequently in some areas while in othersthere was greater staffing stability To control for this potentialbias data from all PHCCs were reviewed in detail andadditional data were pursued if there were abnormal or largegaps If these gaps could not be rectified the associated PHCCwas left out of the analysis In addition to this the usual
Table 3 Statistical Summary of Incidence of Diarrhea Per Month Per 1000 Inhabitants at Seven PHCCs Before and After WSP
PHCCs status no of months with data meana mediana percentilesa (5th 95th) rangea pposthoc
V0 before WSP 68 112 104 030 213 256 lt0001after WSP 87 084 073 025 166 217
V1 before WSP 48 216 188 050 476 804 0005after WSP 93 159 145 049 278 506
V3 before WSP 17 601 591 230 1099 1011 lt0001after WSP 103 215 109 0 727 1267
V9 before WSP 117 207 158 029 595 1026 0362after WSP 32 176 150 046 455 429
V15 before WSP 53 084 080 010 212 234 0056after WSP 80 102 100 027 205 237
V16 before WSP 34 522 516 174 940 799 lt0001after WSP 116 248 230 106 450 586
V17 before WSP 21 1119 1222 457 2000 1621 lt0001after WSP 127 259 154 0 761 2852
all before WSP 358 274 160 030937 2037 lt0001after WSP 638 188 137 0 490 2852
sum 996aMonthly incidence of diarrhea per 1000 inhabitants served by the PHCC
Figure 4 Incidence of diarrhea per 1000 inhabitant per month versusWSP scoring at 16 water utilities Iceland 2009
Environmental Science amp Technology Article
dxdoiorg101021es300372h | Environ Sci Technol 2012 46 7782minus77897787
disadvantages of an ecological study apply such as lack ofcontrol for confounding factors (partly addressed with thecomparison with pneumonia in Results section) and the studyaddresses population as data on individuals was not availableThe mean incidence of diarrhea for the surveillance data set
studied here is 17 per 1000 inhabitants per month with samplevariance of mean 45 and range 2852 This gives 002 perperson per year but the proportion seeking medical care andthe true incidence of diarrhea in the community is not knownin Iceland Cross-sectional telephone surveys in AustraliaCanada Ireland and the United States found that approx-imately one in five with diarrhea sought medical care22 Asimilar result is reported from a study in Norway with 17consulting a physician23 If the situation is similar in Iceland itcould be concluded that incidence of diarrhea in Iceland isaround 010 per person per year This is low compared to othercountries for example in Norway the rate is 12 per personyear23 in Ireland 044 per person year in Australia 083 and inCanada and United States 09922 FoodNet in the US hasestimated a rate of 065 per person year of acute gastrointestinalillness based on 33 studies24 There is insufficient informationto enable estimation of the global burden of water-bornedisease which has proven complex because of the complexrelationships among sources of hazards and routes oftransmission Estimates suggest that 66 of the total globalburden of disease (measured in disability-adjusted life years orDALYs) could be prevented through well-recognized inter-ventions in drinking-water supply and quality sanitation andhygiene2526 Hunter et al17 concluded that up to 15 ofgastrointestinal illness in the United Kingdom could beassociated with contamination of drinking water in thedistribution system Colford et al27 estimated attributable riskpercent (AR) of acute gastrointestinal illness to drinkingwater by reviewing five household drinking water interventiontrials two in Canada two in the US and one in Australia withthe median estimate of AR of 12 The US EnvironmentalProtection Agency (EPA) has estimated the mean incidence ofacute gastrointestinal illness attributable to drinking water to be85 of all cases in the population served by community watersystem28 The median value of incidence of diarrhea betweenthe seven PHCCs before and after WSP (shown in SI TableS4) obtained in the present study yields a conservative estimateof AR of about 14 for Iceland which can be attributed todrinking water and cause endemic or sporadic cases of diarrheaResidual disinfection is not used in Iceland due to high
availability of good quality groundwater which provides insightinto what happens in the distribution system Noncompliancewas higher in the network than at the source and the maindecrease of HPC following WSP implementation was in thenetwork This indicates that it may be possible to keep watersafe by preventing contamination and bacterial growth in thepipe network rather than with disinfection In some countries inNorthern Europe disinfection of drinking water with chlorine isnot used or used in a limited way These are countries wherethe dominant source is groundwater as in Iceland such as TheNetherlands where chlorine is not used at all neither forprimary disinfection or to maintain a residual disinfectant in thenetwork29 and Denmark where most systems are notchlorinated30 The reason for higher noncompliance in thedistribution network than at the source in this study could bethe fact that water and sewage pipes are most often in the sameditch In all pipe system there are some leaks and soil willbecome contaminated around sewage pipes A common theory
is that this contamination does not enter the water pipes ifsufficient internal pressure is maintained in the water pipesystem But some pressure events may cause low or negativepressure that result in intrusion of pathogens31minus33 Theseevents can be because of pipe break pump shutdown orsudden increase in water demand They can be short-lived andstill cause many incidents and that risk is greater where there isno residual disinfectionThe results from this study show significant benefit from
WSP implementation in the form of improved regulatorycompliance with drinking water standard water quality andreduced disease risk It indicates that there are measurablebenefits from implementing water safety plans in water utilitiesThe general conclusion of the study is that a WSP is animportant instrument in improving water quality and reducingthe occurrence of waterborne illnesses and as such improvespublic health
ASSOCIATED CONTENTS Supporting InformationTables showing scope of data for the research and some resultsThis material is available free of charge via the Internet athttppubsacsorg
AUTHOR INFORMATIONCorresponding AuthorE-mail mariaghiis phone +354 8966308 fax +3545254632
NotesThe authors declare no competing financial interest
ACKNOWLEDGMENTSThis research was supported by the Environmental and EnergyResearch Fund of Reykjavik Energy (ORUS-2010-06-3000109731) We are grateful for the support and thecooperation of the water utilities Local Competent Authoritiesand the Chief Epidemiologist at the Directorate of Health forsharing their experience and with the collection of data We arespecially grateful to Juliana Hedinsdottir at the Directorate ofHealth Ludvik Olafsson at the Primary Health Care of theCapital Area Stefan Thorarinsson at the Primary Health Careof East Iceland for help and advice regarding health data andalso for assistance of the Statistics Centre of University ofIceland with statistical analysis We also acknowledge thehelpful comments on the draft of this paper given by JackColford at the University of California Berkeley
REFERENCES(1) Guidelines for Drinking-water Quality 3rd ed Vol 1Recommendations World Health Organization Geneva 2004(2) Guidelines for Drinking-water Quality 4th ed World HealthOrganization Geneva 2011(3) A Conceptual Framework to Evaluate the Impacts of Water SafetyPlans Centers for Disease Control and Prevention US Departmentof Health and Human Services Atlanta GA 2011 httpcdcgovncehehsGWASHPublicationsWSP_Evaluation_-Frameworkpdf(4) The Foodstuffs Act No931995 httpengumhverfisraduneytiislegislationnr375 Article 4 2 pgr(5) Gunnarsdottir M J Gardarsson S M Bartram J IcelandicExperience with Water Safety Plans Water Sci Technol 2012 65 (2)277minus288(6) Bartram J Corrales I Davison A Deere D Drury DGordonB Howard G Rinehold A Stevens M Water Safety Plan
Environmental Science amp Technology Article
dxdoiorg101021es300372h | Environ Sci Technol 2012 46 7782minus77897788
Manual Step-by-Step Risk Management for Drinking-Water SuppliersWorld Health Organization Geneva 2009(7) Progress on Sanitation and Drinking Water 2010 Update WHOUNICEF Joint Monitoring Programme for Water Supply andSanitation 2010(8) UNESCO-WWAP Water a Shared Responsibility The UnitedNations World Water Development Report 2 New York 2006 p 132(9) European Environment Agency The European Environment minusState and Outlook 2010 minus Iceland 2010 http eeaeuropaeusoercountriesissoertopic_viewtopic=freshwater (accessed 28 February2012)(10) Gunnarsdottir M J Gissurarson L R HACCP and watersafety plans in Icelandic water supply Preliminary evaluation ofexperience J Water Health 2008 6 (3) 377minus382(11) Geirsdottir M Unofficial List of Waterborne Outbreaks from theIcelandic Food and Biotech RampD 2011(12) Report on contamination of drinking water in Eskifjordur in July2010 Local Competent Authority for Eastern Iceland httpfjardabyggdismediaPDF2010_08_neylsuvatnsmengun_a_Eskifirdipdf(13) Payment P Siemiatycki J Richardson L Renaud G FrancoE Prevost M A prospective epidemiological study of gastrointestinalhealth effects due to the consumption of drinking water Int J EnvironHealth Res 1997 5minus31(14) Payment P Hunter P Endemic and epidemic infectiousintestinal disease and its relation to drinking water In Water QualityGuidelines Standards amp Health Risk Assessment and Management forWater-related Infectious Diseases Fewtrell L Bartram J Eds IWAPublishing London 2001 pp 61minus88(15) Craun G F Calderon R L Wade T Assessing waterbornerisks an introduction J Water Health 2006 4 (suppl 2) 3minus18(16) Nygaard K Wahl E Krogh T Tveit O A Bohleng ETverdal A Aavitsland P Breaks and maintenance work in the waterdistribution systems and gastrointestinal illness A cohort study Int JEpidemiol 2007 39 (4) 873minus880(17) Hunter P R Chalmers R M Huges S Syed Q Self-Reported Diarrhoea in a Control Group A Strong Association withReporting of Low-Pressure Events in Tap Water Clin Infect Dis 200540 32minus34(18) Icelandic Drinking Water Regulation no 5362001(19) Council Directive 9883EC of 3 November 1998 on thequality of water intended for human consumption(20) International Statistical Classification of Diseases and RelatedHealth Problems 10th Revision Version for 2007 World HealthOrganization 2007(21) Population According to Postcode Statistics Iceland 2011httpwwwstaticeisStatisticsPopulationUrban-nuclei-and-zip-codes(22) Scallan E Majowicz S E Hall G Banerjee A Bowman CL Daly L Jones T Kirk M D Fitzgerald M Angulo F JPrevalence of diarrhea in the community in Australia Canada Irelandand the United States Int J Epidemiol 2005 34 454minus460(23) Kuusi M Aavitsland P Gondrosen B Kapperud GIncidence of gastroenteritis in Norway minus a population-based surveyEpidemiol Infect 2003 131 591minus597(24) Roy S L Scallan E Beach M J The rate of acutegastrointestinal illness in developed countries J Water Health 2006 04(suppl 2) 31minus70(25) Bartram J Cairncross S Hygiene Sanitation and WaterForgotten Foundations of Health PLoS Med 2010 7 (11) e1000367DOI 101371journalpmed1000367(26) Pruess-Ustun A Bos R Gore F Bartram J Safer WaterBetter Health WHO Geneva 2008(27) Colford J M Jr Roy S Beach M J Hightower A Shaw SE Wade T J A review of household drinking water intervention trialsand an approach to the estimation of endemic waterborne gastro-enteritis in the United States J Water Health 2006 4 (suppl 2) 71minus88
(28) Messner M Shaw S Regli S Robert K Blank V Soller JAn approach for developing a national estimate of waterborne diseasedue to drinking water and a national estimate model application JWater Health 2006 04 (suppl 2) 201minus240(29) Smeets P W M H Medema G J van Dijk J C The Dutchsecret how to provide safe drinking water without chlorine in theNetherlands Drink Water Eng Sci 2009 2 1minus4(30) Neimann J Engberg J Molbak K Wegner H C A casecontrol study of risk factor for sporadic campylobacter infections inDenmark Epidemiol Infect 2003 130 353minus366(31) LeChevallier M W Gullick R W Karim M R FriedmanM Funk J E The potential for health risks from intrusion ofcontaminants into the distribution system from pressure transients JWater Health 2003 1 (1) 3minus14(32) Teunis P F M Xu M Fleming K K Yang J Moe L CLeChevallier M W Enteric virus Infection Risk from Intrusion ofSewage into a Drinking Water Distribution Network Environ SciTechnol 2010 44 8561minus8566(33) Besner M-C Prevost M Regli S Assessing the public healthrisk of microbial intrusion events in distribution systems Conceptualmodel available data and challenges Water Res 2011 45 961minus979
Environmental Science amp Technology Article
dxdoiorg101021es300372h | Environ Sci Technol 2012 46 7782minus77897789
quality groundwater About 95 of the countryrsquos pipeddrinking water supply originates from groundwater Ground-water is typically not treated prior to distribution unless there isa danger of surface water intrusion Surface water (used by lessthan 5 of the population) and groundwater under directinfluence of surface water are typically treated by filtrationfollowed by UV disinfection9 Residual disinfection withchlorine or other disinfectants is not practiced in Iceland5
Local Competent Authority (LCA) is responsible forsurveillance of drinking water protection and complianceLegal requirements on protecting the sources of drinking waterhave been included in the Icelandic Drinking Water Regulation(IDWR) since 2001 obligating the LCA to define protectionaround water intakes The Primary Health Care Centers(PHCCs) are required to collect and report data on diarrhealdiseases to the Chief Epidemiologist at the Directorate ofHealthIn 1995 Iceland became one of the first countries to legislate
the use of WSPs4 implementation began with ReykjavikEnergy in the spring of 19975 Five years later eleven utilitiesserving 63 of the population had implemented a WSP and bythe end of 2008 thirty-one utilities serving 81 had WSP inplace510 Preliminary evidence indicates that WSP implemen-tation in Iceland has resulted in increased compliance withIDWR A preliminary evaluation carried out in 2008 at twowater utilities City of Reykjavik and Akureyri town showedcompliance increasing following WSP implementation from94 to 99 at Reykjavik and from 88 to 99 at Akureyrirespectively10 Research at sixteen water utilities in 2009 anddevelopment of a scoring system to evaluate performance ofWSP showed that nine out of sixteen utilities got a satisfactoryscore however the range in scoring was great5 Results fromthat research also indicated that the process of implementing asystematic preventive approach to water safety improved theutility culture regarding drinking water as a public health issueBut the question of whether there are measurable benefits fromhaving a WSP was unansweredAlthough waterborne disease is a much greater burden in
developing countries it is essential that the causes of bothendemic and epidemic diarrheal disease from drinking watersupply be addressed in wealthy countries like Iceland Therewere 12 confirmed waterborne disease outbreaks in Icelandbetween 1984 and 2011 Six were due to Campylobacter and sixwere due to norovirus11 The last confirmed outbreak was in2004 and at least one contamination event has been confirmedsince 2004 but was not associated with adverse healthimpacts12 All of these outbreaks were at small water utilitiesHowever absence of detected outbreaks of disease is not areason for complacency11314 as endemic and sporadic cases ofgastrointestinal illness and small waterborne outbreaks can beundetected by surveillance systems15 Research also indicatesincreased risk for gastrointestinal illness during pressure loss ina distribution system A cohort-study among recipients of waterfrom seven larger water utilities in urban areas in Norwayduring the years 2003minus04 showed that breaks and maintenancework in the distribution systems were associated with anincreased risk for gastrointestinal illness among waterrecipients16 and a similar study in England and Wales showeda strong association between self-reported diarrhea andreported low water pressure at the faucet17 These examplesindicate that addressing health risk from drinking water indeveloped countries requires an approach like WSPs that canaddress risk at all stages of supply particularly in the
distribution system and establish appropriate procedures formaintenance and operationThe aim of this study was to determine the impact of WSP
implementation on (a) regulatory compliance (b) micro-biological water quality and (c) incidence of clinical cases ofdiarrhea using comprehensive surveillance data
MATERIALS AND METHODSDesign of Study The design of this study is an
observational retrospective cohort study The uptake areaswithout WSP were considered risk exposed (nonintervention)and the uptake areas with WSP were nonrisk exposed(intervention) The following indicators were compared inwater utilities before and after implementing WSP (1)percentage of annual compliance with drinking water regulationin heterotrophic plate counts (HPC) total coliform and E colibacteria (2) the number of colony forming units (cfu) by HPCin water and (3) incidence of diarrhea per 1000 inhabitants permonthFor (1) and (2) five utilities were chosen for analysis of water
quality and compliance data based on the following criteria (a)available data for water quality and compliance (b) at least twofull years of data with and two full years of data without WSPand (c) at least 100 regular water quality compliance samplesreported during the study periodFor (3) the inclusion criteria for the PHCCs were the
following (a) data availability of reported monthly number ofcases of diarrhea during the study period (defined below) (b)that the entire population in the uptake area for the PHCC hadreceived piped drinking water from a single water utility and(c) the geographic boundary of service for the PHCC wasstable over the period of study (eg two community clinicswere not consolidated into one during the study period) Thesecriteria eliminated 42 of the 60 PHCCs leaving 18 for inclusionin the study whereof 7 could be tested for before and afterWSP
Data Collection for Water Quality Regular monitoring ofmicrobiological and chemical parameters is carried outaccording to Icelandic Drinking Water Regulation (IDWR)18
and the European drinking water directive19 at all water utilitiesover a certain size (gt50 users) with frequency of samplingaccording to population To be in compliance with IDWR theHPC in a water sample must contain less than 100 cfu per mLat 22 degC and zero value for both total coliform and E coli in100 mLData for compliance of HPC total coliform and E coli were
collected from five water utilities either from the LCA or fromthe utility where sufficient data and period before and afterWSP implementation were available Results from 1562 regularmonitoring samples were included Repeated monitoring thatwas carried out because of deviation incidence real orsuspected and monitoring after complaints from users wereexcluded to increase conformity between cases and avoid biasThe five water utilities serve around 24 of the population ofIceland WSP were implemented in the five water utilitiesbetween 1998 and 2007 and data on water quality extendedfrom 8 up to 13 years before implementation and 3 to 10 yearsafter Time of implementation was based on the month whenthe WSP was certified by the LCA In some of the water utilitiesthe frequency of sampling was reduced as regulatorycompliance improved as permitted in the IDWR since 2001Scope of data available for the five water utilities as well as theperiods before and after WSP implementation is shown in
Environmental Science amp Technology Article
dxdoiorg101021es300372h | Environ Sci Technol 2012 46 7782minus77897783
Supporting Information (SI) Tables S1 and S5 In no casewere electronic data available In subsequent analysis the waterutilities are labeled with V followed by a number forsimplification and in order to keep them anonymousData Collection on Diarrhea in Humans The Chief
Epidemiologist for Iceland at the Directorate of Health isresponsible for maintaining a register of communicable diseasesaccording to Act no 191997 on Health Security andCommunicable Diseases Diarrhea is a notifiable disease withmonthly reporting of number of cases from the PHCCs to theChief Epidemiologist The reporting is based on the Interna-tional Classification of Diseases (ICD-10)20 for standarddiagnostic classification of diseases which is used almost forthe entire health care system in Iceland For every patientseeking health care one or more ICD-10 codes are selected bythe physician and entered into each patient record For thisstudy data from the monthly reporting for the two followingICD-10 codes representing diarrhea were selected and collectedfrom the Chief Epidemiologists register on communicablediseases
bull A09 - Diarrhea and gastroenteritis of presumed infectiousorigin
bull A05 - Other bacterial food-borne intoxications notelsewhere classified
These codes are notifiable without personal identification Alldata available from individual PHCCs on the above ICD-10codes were collected from January 1997 to the end of 2009Over the 13-year (156-month) period of the study the totalnumber of clinic-months of data available was 2408 (see SITable S2) Delivery of data for these eighteen PHCCs wasapproximately 90 Nonconformity and missing data wereobserved at each PHCC and rectified with the help of ChiefEpidemiologist and regional or local PHCC if possibleAdequate data on diarrhea in humans were available forPHCCs with uptake areas served by seven water utilities beforeand after the implementation of WSP of these two alsoprovided adequate water quality data The seven water utilitiesare sufficiently localized so minimal commuting exists betweenthe service areas Additionally data for eleven PHCCs werecollected four had an uptake area served by water utilities witha WSP during the entire study period and seven had uptakeareas that were served by water utilities without a WSP at anytime during the study period The uptake areas for theseeighteen PHCCs covered approximately 38 of the populationof Iceland Scope of data and population for the PHCCs wheredata on diarrhea were obtained is shown in SI Tables S2 andS5Data on population in the uptake areas for the PHCCs were
obtained from the Web site of Statistics Iceland21 and from theAdministration Office of PHCC in the capital area Thepopulations served by the PHCCs are generally connected topostal codes in the uptake areas one exception is in the capitalarea where people can more easily choose among PHCCsThere are nineteen PHCCs in the greater capital area five ofwhich were included in this study
Testing for Confounders and Strength of the DataCorrelation tests between diarrhea and pneumonia wereconducted at three PHCCs (V1 V16 and V17) The threePHCCs selected had significant difference in incidence ofdiarrhea before and after WSP implementation and sufficientmonths of data that coincided The correlation test examinesfactors other than WSP that could affect these diseasessimultaneously such as changes in definitions or methods forreportingregistering Pneumonia was selected as it is acommon disease which is notifiable to the Chief Epidemiol-ogist and reported in the same way as diarrhea using the ICD-10 codes J12minusJ18 with subcodes for pneumonia Whileassociated with water supply through the impact of wateravailability on hygiene there is no evidence to suggest anassociation of pneumonia with water qualityIn addition the correlation between interventions in water
utilities and diarrhea incidence was investigated This wasassessed by testing the correlation between the WSP scoring ofsixteen water utilities and the diarrheal incidence in thePHCCs uptake areas that the water utilities were serving Tenof the water utilities had implemented a WSP and were ratedaccording to the WSP scoring system reported in a previousstudy5 and six were without WSP and were given a score ofzero Surveillance data on diarrhea from the Chief Epidemiol-ogists register were available for all PHCCs uptake areas servedby these sixteen water utilities Data availability is given in SITable S3
Statistical Analysis Statistical analysis was conducted withSPSS 19 For all data sets mean median 5th and 95thpercentiles and range were calculated before and after WSPimplementation Statistical significance was set as two tail and at5 (p = 005)The binary logistic regression test was used when analyzing
the relative frequency of two possible outcomes (egcompliance vs noncompliance) It tests whether noncomplianceto drinking water regulation in the parameters HPC totalcoliform and E coli was significantly more frequent before thanafter WSP implementation The binary logistic regression testwas also used to examine if there was difference in HPC beforeand after the WSP implementation this comparison was basedon an HPC concentration of 10 cfu per mLWhen analyzing the difference in numerical values (eg
bacterial concentration or diarrheal incidence) two tests wereused the t test was used for parametric analysis and the MannminusWhitney U test was used for nonparametric analysisUnivariate two-way ANOVA test was used to compare
diarrheal incidence before and after WSP implementation in allseven PHCCs The difference in mean before and after WSPimplementation at each of the seven PHCCs was then testedwith a posthoc t test To adjust for multiple comparisons theBonferroni correction was used accordingly the significancelevel was divided by number of tests conducted (n = 7) p =000714 (0057) For the supporting evidence of correlationbetween diarrhea and pneumonia a nonparametric Kendalls tautest was used and Persons correlation was used for WSPscoring and incidence of diarrhea
Table 1 Results from Binary Logistic Regression Test for Water Quality (n = 1562)
95 CI
B SE Wald df sign odds ratio lower upper
noncompliance 1315 0280 22056 1 0000 3725 2152 6448HPC gt 10 cfu per mL 0789 0127 38340 1 0000 2202 1715 2827
Environmental Science amp Technology Article
dxdoiorg101021es300372h | Environ Sci Technol 2012 46 7782minus77897784
RESULTS
Compliance with Icelandic Drinking Water Regulation(IDWR) Surveillance data for drinking water showed a decreasein noncompliance with IDWR requirements following WSPimplementation (p lt 0001) as shown in Table 1 Mean annualnoncompliance declined following implementation of a WSP atfour of the five water utilities investigated as shown in Figure 1Mean noncompliance across all five utilities declinedapproximately 80 (from 77 of samples to 15)
Noncompliance can result from a violation in any or all ofthe three following parameters HPC total coliform or E colibacteria (as described in Materials and Methods) The totalnumber of incidents of noncompliance decreased from 85 (outof 955 samples) before WSP implementation down to 16 (out
of 607 samples) after WSP in all five water utilities combinedHPC violations were the most common cause of non-compliance both before and after WSP implementation seeSI Table S6 for detailsAccording to IDWR water samples should be obtained at
both the source (eg at the borehole or a well from whichgroundwater is pumped) and from the piped distributionsystem For the 1562 samples 33 were taken at the source and67 were taken from the distribution network Samples fromthe source were in compliance more often than those from thedistribution network Noncompliance at the source reducedfrom 48 to 23 following WSP implementation while thereduction was from 107 to 28 in the distribution network
Heterotrophic Plate Count (HPC) in Drinking Water InFigure 2 HPC is plotted for the five utilities before and afterWSP implementation The figure shows that number of HPCthat were above the upper cutoff level 10 cfu per mL at all fiveutilities decreased following a WSP implementation A binarylogistic regression test showed that the decrease was significant(p lt 0001) as shown in Table 1Table 2 provides detailed information on HPC bacteria in
samples taken before and after WSP implementation at the fivewater utilities It shows that the median is higher before thanafter WSP implementation at all water utilities except at V15although at V15 there were only 2 noncompliances before WSP(during 8 years) and 2 after WSP (during 7 years) and lowHPC both before and after WSP yielding unreliable resultsHowever the difference in the median is only significant for twoof the five utilities V5 and V16 according to nonparametrictest Table 2 shows also that when all sample results werecombined and also when samples at the source and in thedistribution system were compared separately the median HPC
Figure 1 Mean annual noncompliance with IDWR at five waterutilities before and after WSP
Figure 2 Boxplot of HPC before and after WSP implementation at five water utilities showing sampling site of outliers (S = water source D =distribution network) The broken line shows 10 HPC in samples
Environmental Science amp Technology Article
dxdoiorg101021es300372h | Environ Sci Technol 2012 46 7782minus77897785
was significantly lower after WSP implementation (p lt 0001for all three comparisons)Additionally HPC concentrations were more consistent
following WSP implementation with a decreased range and adecrease of the 95th percentile value as can be seen in Table 2Most outliers were recorded before WSP implementation andmore often in the distribution network than at the source as canbe seen in Figure 2Incidence of Diarrhea Figure 3 and Table 3 show the
difference in diarrheal incidence before and after WSPimplementation The mean incidence of diarrhea for all thesurveillance data set studied here which covers about 38 ofthe population of Iceland is 17 per 1000 inhabitants per
month or 002 per person year as shown in SI Table S4 Whendata from all seven PHCCs were combined univariate two-wayANOVA indicated an overall significant reduction of diarrhealincidence (F (1982) = 232 p lt 0001 ηp
2 = 019) this test alsoindicated that there was a significant interaction betweenPHCC and WSP status (eg that the difference in diarrhealincidence varied between PHCCs) (F (6982) = 53 p lt 0001ηp
2 = 024) Diarrheal incidence was significantly reduced at fiveout of seven PHCCs (Table 3) this finding was confirmedusing the Bonferroni correction to account for the problem ofmultiple comparisons (tested at significance level αn of p lt000714)
Table 2 Statistical Summary of HPC in Water Samples at Five Water Utilities Before and After WSP
water utility status no of water samples meana mediana percentilesa (5th 95th) rangea (min max) Pnonparam (2 tail)
V4 before WSP 159 197 1 0 1215 0 540 0617after WSP 96 54 08 0 210 0 140
V5 before WSP 250 330 2 0 1467 0 1300 0001after WSP 103 51 1 0 188 0 200
V12 before WSP 100 450 2 0 2060 0 1500 0104after WSP 35 37 1 0 213 0 26
V15 before WSP 51 75 1 0 574 0 105 0082after WSP 78 22 1 0 131 0 25
V16 before WSP 395 612 11 1 182 0 2800 lt0001after WSP 295 214 6 1 846 0 1300
all samples before WSP 955 423 5 0 1440 0 2800 lt0001after WSP 607 126 3 0 450 0 1300
all samples at source before WSP 294 160 2 0 744 0 580 lt0001after WSP 218 67 1 0 210 0 200
all samples in distribution network before WSP 657 540 6 0 1810 0 2800 lt0001after WSP 393 159 4 0 543 0 1300
acfumL HPC colony forming units per milliliter in water sample
Figure 3 Incidence of diarrhea before and after WSP at seven PHCCs
Environmental Science amp Technology Article
dxdoiorg101021es300372h | Environ Sci Technol 2012 46 7782minus77897786
Supporting Information Table S4 shows diarrheal incidencefor both those groups of PHCCs that experienced a change inWSP status during the study and those with and without WSPfor the entire study period both the mean and the median rateof diarrhea were lower when WSPs were in use and 95percentile was reduced by halfConfounders and Strength of the Data It was
hypothesized that decreases in diarrheal incidence over timecould possibly be attributable to changes in the Iceland healthcare system or broader improvements in population health Totest whether the decline in diarrhea was not attributable tothese factors but rather to WSP implementation data forpneumonia for three PHCCs were collected as a controlvariable A nonparametric correlation test between pneumoniaand diarrhea for these three PHCCs did not show significantrelation between the rate of the two diseases (V1 r = 0094 p =0119 n = 129 V16 r = 0053 p = 0363 n = 135 V17 r =minus0053 p = 0377 n = 144) providing further evidence that thereduction in diarrheal incidence was attributable to WSPimplementationFigure 4 shows the incidence of diarrhea as a function of
WSP scoring for sixteen water utilities for 20095 The figureshows a trend suggesting a lower incidence for water utilities
with high WSP score but the trend is not significant accordingto parametric test (r = minus0443 p = 0086 n = 16)
DISCUSSION
This study provides systematic evidence of the positive impactsof WSPs on drinking water quality and health These dataindicate that WSP implementation in Iceland resulted insubstantial and measurable reductions in drinking waternoncompliance amount of HPC in water (both at the sourceand in the distribution system) and incidence of diarrhea incommunities served by utilities implementing WSPThe strength of the study is that it covers a large proportion
of a national population well over one-third of the populationfor diarrhea incidence and nearly one-fourth for water qualityTherefore there is a substantial amount of data behind theresults The uniformity of the Icelandic society both sociallyand culturally is a further strength Additionally bothconsumers and health workers were unaware of the WSPimplementation and were therefore effectively blinded to theintervention These results are further supported by the factthat there is no correlation between incidence of diarrhea andpneumonia indicating that the findings on diarrheal diseaseincidence were not influenced by broader trends in theIcelandic health care system Using a previous analysis thatscored the strength of WSP implementation at various utilitiesin Iceland revealed a possible correlation between betterfunctioning WSP and lower diarrheal incidence howeverlimited data were available and the trend was not statisticallysignificantThere were some limitations that could have influenced the
results obtained There was some nonconformity in deliveringand recording data from the PHCCs into the nationalsurveillance system There was a variation in how the physiciansused the ICD-10 codes as different physicians used differentICD-10 codes for the same diseases and symptoms Addition-ally physicians change frequently in some areas while in othersthere was greater staffing stability To control for this potentialbias data from all PHCCs were reviewed in detail andadditional data were pursued if there were abnormal or largegaps If these gaps could not be rectified the associated PHCCwas left out of the analysis In addition to this the usual
Table 3 Statistical Summary of Incidence of Diarrhea Per Month Per 1000 Inhabitants at Seven PHCCs Before and After WSP
PHCCs status no of months with data meana mediana percentilesa (5th 95th) rangea pposthoc
V0 before WSP 68 112 104 030 213 256 lt0001after WSP 87 084 073 025 166 217
V1 before WSP 48 216 188 050 476 804 0005after WSP 93 159 145 049 278 506
V3 before WSP 17 601 591 230 1099 1011 lt0001after WSP 103 215 109 0 727 1267
V9 before WSP 117 207 158 029 595 1026 0362after WSP 32 176 150 046 455 429
V15 before WSP 53 084 080 010 212 234 0056after WSP 80 102 100 027 205 237
V16 before WSP 34 522 516 174 940 799 lt0001after WSP 116 248 230 106 450 586
V17 before WSP 21 1119 1222 457 2000 1621 lt0001after WSP 127 259 154 0 761 2852
all before WSP 358 274 160 030937 2037 lt0001after WSP 638 188 137 0 490 2852
sum 996aMonthly incidence of diarrhea per 1000 inhabitants served by the PHCC
Figure 4 Incidence of diarrhea per 1000 inhabitant per month versusWSP scoring at 16 water utilities Iceland 2009
Environmental Science amp Technology Article
dxdoiorg101021es300372h | Environ Sci Technol 2012 46 7782minus77897787
disadvantages of an ecological study apply such as lack ofcontrol for confounding factors (partly addressed with thecomparison with pneumonia in Results section) and the studyaddresses population as data on individuals was not availableThe mean incidence of diarrhea for the surveillance data set
studied here is 17 per 1000 inhabitants per month with samplevariance of mean 45 and range 2852 This gives 002 perperson per year but the proportion seeking medical care andthe true incidence of diarrhea in the community is not knownin Iceland Cross-sectional telephone surveys in AustraliaCanada Ireland and the United States found that approx-imately one in five with diarrhea sought medical care22 Asimilar result is reported from a study in Norway with 17consulting a physician23 If the situation is similar in Iceland itcould be concluded that incidence of diarrhea in Iceland isaround 010 per person per year This is low compared to othercountries for example in Norway the rate is 12 per personyear23 in Ireland 044 per person year in Australia 083 and inCanada and United States 09922 FoodNet in the US hasestimated a rate of 065 per person year of acute gastrointestinalillness based on 33 studies24 There is insufficient informationto enable estimation of the global burden of water-bornedisease which has proven complex because of the complexrelationships among sources of hazards and routes oftransmission Estimates suggest that 66 of the total globalburden of disease (measured in disability-adjusted life years orDALYs) could be prevented through well-recognized inter-ventions in drinking-water supply and quality sanitation andhygiene2526 Hunter et al17 concluded that up to 15 ofgastrointestinal illness in the United Kingdom could beassociated with contamination of drinking water in thedistribution system Colford et al27 estimated attributable riskpercent (AR) of acute gastrointestinal illness to drinkingwater by reviewing five household drinking water interventiontrials two in Canada two in the US and one in Australia withthe median estimate of AR of 12 The US EnvironmentalProtection Agency (EPA) has estimated the mean incidence ofacute gastrointestinal illness attributable to drinking water to be85 of all cases in the population served by community watersystem28 The median value of incidence of diarrhea betweenthe seven PHCCs before and after WSP (shown in SI TableS4) obtained in the present study yields a conservative estimateof AR of about 14 for Iceland which can be attributed todrinking water and cause endemic or sporadic cases of diarrheaResidual disinfection is not used in Iceland due to high
availability of good quality groundwater which provides insightinto what happens in the distribution system Noncompliancewas higher in the network than at the source and the maindecrease of HPC following WSP implementation was in thenetwork This indicates that it may be possible to keep watersafe by preventing contamination and bacterial growth in thepipe network rather than with disinfection In some countries inNorthern Europe disinfection of drinking water with chlorine isnot used or used in a limited way These are countries wherethe dominant source is groundwater as in Iceland such as TheNetherlands where chlorine is not used at all neither forprimary disinfection or to maintain a residual disinfectant in thenetwork29 and Denmark where most systems are notchlorinated30 The reason for higher noncompliance in thedistribution network than at the source in this study could bethe fact that water and sewage pipes are most often in the sameditch In all pipe system there are some leaks and soil willbecome contaminated around sewage pipes A common theory
is that this contamination does not enter the water pipes ifsufficient internal pressure is maintained in the water pipesystem But some pressure events may cause low or negativepressure that result in intrusion of pathogens31minus33 Theseevents can be because of pipe break pump shutdown orsudden increase in water demand They can be short-lived andstill cause many incidents and that risk is greater where there isno residual disinfectionThe results from this study show significant benefit from
WSP implementation in the form of improved regulatorycompliance with drinking water standard water quality andreduced disease risk It indicates that there are measurablebenefits from implementing water safety plans in water utilitiesThe general conclusion of the study is that a WSP is animportant instrument in improving water quality and reducingthe occurrence of waterborne illnesses and as such improvespublic health
ASSOCIATED CONTENTS Supporting InformationTables showing scope of data for the research and some resultsThis material is available free of charge via the Internet athttppubsacsorg
AUTHOR INFORMATIONCorresponding AuthorE-mail mariaghiis phone +354 8966308 fax +3545254632
NotesThe authors declare no competing financial interest
ACKNOWLEDGMENTSThis research was supported by the Environmental and EnergyResearch Fund of Reykjavik Energy (ORUS-2010-06-3000109731) We are grateful for the support and thecooperation of the water utilities Local Competent Authoritiesand the Chief Epidemiologist at the Directorate of Health forsharing their experience and with the collection of data We arespecially grateful to Juliana Hedinsdottir at the Directorate ofHealth Ludvik Olafsson at the Primary Health Care of theCapital Area Stefan Thorarinsson at the Primary Health Careof East Iceland for help and advice regarding health data andalso for assistance of the Statistics Centre of University ofIceland with statistical analysis We also acknowledge thehelpful comments on the draft of this paper given by JackColford at the University of California Berkeley
REFERENCES(1) Guidelines for Drinking-water Quality 3rd ed Vol 1Recommendations World Health Organization Geneva 2004(2) Guidelines for Drinking-water Quality 4th ed World HealthOrganization Geneva 2011(3) A Conceptual Framework to Evaluate the Impacts of Water SafetyPlans Centers for Disease Control and Prevention US Departmentof Health and Human Services Atlanta GA 2011 httpcdcgovncehehsGWASHPublicationsWSP_Evaluation_-Frameworkpdf(4) The Foodstuffs Act No931995 httpengumhverfisraduneytiislegislationnr375 Article 4 2 pgr(5) Gunnarsdottir M J Gardarsson S M Bartram J IcelandicExperience with Water Safety Plans Water Sci Technol 2012 65 (2)277minus288(6) Bartram J Corrales I Davison A Deere D Drury DGordonB Howard G Rinehold A Stevens M Water Safety Plan
Environmental Science amp Technology Article
dxdoiorg101021es300372h | Environ Sci Technol 2012 46 7782minus77897788
Manual Step-by-Step Risk Management for Drinking-Water SuppliersWorld Health Organization Geneva 2009(7) Progress on Sanitation and Drinking Water 2010 Update WHOUNICEF Joint Monitoring Programme for Water Supply andSanitation 2010(8) UNESCO-WWAP Water a Shared Responsibility The UnitedNations World Water Development Report 2 New York 2006 p 132(9) European Environment Agency The European Environment minusState and Outlook 2010 minus Iceland 2010 http eeaeuropaeusoercountriesissoertopic_viewtopic=freshwater (accessed 28 February2012)(10) Gunnarsdottir M J Gissurarson L R HACCP and watersafety plans in Icelandic water supply Preliminary evaluation ofexperience J Water Health 2008 6 (3) 377minus382(11) Geirsdottir M Unofficial List of Waterborne Outbreaks from theIcelandic Food and Biotech RampD 2011(12) Report on contamination of drinking water in Eskifjordur in July2010 Local Competent Authority for Eastern Iceland httpfjardabyggdismediaPDF2010_08_neylsuvatnsmengun_a_Eskifirdipdf(13) Payment P Siemiatycki J Richardson L Renaud G FrancoE Prevost M A prospective epidemiological study of gastrointestinalhealth effects due to the consumption of drinking water Int J EnvironHealth Res 1997 5minus31(14) Payment P Hunter P Endemic and epidemic infectiousintestinal disease and its relation to drinking water In Water QualityGuidelines Standards amp Health Risk Assessment and Management forWater-related Infectious Diseases Fewtrell L Bartram J Eds IWAPublishing London 2001 pp 61minus88(15) Craun G F Calderon R L Wade T Assessing waterbornerisks an introduction J Water Health 2006 4 (suppl 2) 3minus18(16) Nygaard K Wahl E Krogh T Tveit O A Bohleng ETverdal A Aavitsland P Breaks and maintenance work in the waterdistribution systems and gastrointestinal illness A cohort study Int JEpidemiol 2007 39 (4) 873minus880(17) Hunter P R Chalmers R M Huges S Syed Q Self-Reported Diarrhoea in a Control Group A Strong Association withReporting of Low-Pressure Events in Tap Water Clin Infect Dis 200540 32minus34(18) Icelandic Drinking Water Regulation no 5362001(19) Council Directive 9883EC of 3 November 1998 on thequality of water intended for human consumption(20) International Statistical Classification of Diseases and RelatedHealth Problems 10th Revision Version for 2007 World HealthOrganization 2007(21) Population According to Postcode Statistics Iceland 2011httpwwwstaticeisStatisticsPopulationUrban-nuclei-and-zip-codes(22) Scallan E Majowicz S E Hall G Banerjee A Bowman CL Daly L Jones T Kirk M D Fitzgerald M Angulo F JPrevalence of diarrhea in the community in Australia Canada Irelandand the United States Int J Epidemiol 2005 34 454minus460(23) Kuusi M Aavitsland P Gondrosen B Kapperud GIncidence of gastroenteritis in Norway minus a population-based surveyEpidemiol Infect 2003 131 591minus597(24) Roy S L Scallan E Beach M J The rate of acutegastrointestinal illness in developed countries J Water Health 2006 04(suppl 2) 31minus70(25) Bartram J Cairncross S Hygiene Sanitation and WaterForgotten Foundations of Health PLoS Med 2010 7 (11) e1000367DOI 101371journalpmed1000367(26) Pruess-Ustun A Bos R Gore F Bartram J Safer WaterBetter Health WHO Geneva 2008(27) Colford J M Jr Roy S Beach M J Hightower A Shaw SE Wade T J A review of household drinking water intervention trialsand an approach to the estimation of endemic waterborne gastro-enteritis in the United States J Water Health 2006 4 (suppl 2) 71minus88
(28) Messner M Shaw S Regli S Robert K Blank V Soller JAn approach for developing a national estimate of waterborne diseasedue to drinking water and a national estimate model application JWater Health 2006 04 (suppl 2) 201minus240(29) Smeets P W M H Medema G J van Dijk J C The Dutchsecret how to provide safe drinking water without chlorine in theNetherlands Drink Water Eng Sci 2009 2 1minus4(30) Neimann J Engberg J Molbak K Wegner H C A casecontrol study of risk factor for sporadic campylobacter infections inDenmark Epidemiol Infect 2003 130 353minus366(31) LeChevallier M W Gullick R W Karim M R FriedmanM Funk J E The potential for health risks from intrusion ofcontaminants into the distribution system from pressure transients JWater Health 2003 1 (1) 3minus14(32) Teunis P F M Xu M Fleming K K Yang J Moe L CLeChevallier M W Enteric virus Infection Risk from Intrusion ofSewage into a Drinking Water Distribution Network Environ SciTechnol 2010 44 8561minus8566(33) Besner M-C Prevost M Regli S Assessing the public healthrisk of microbial intrusion events in distribution systems Conceptualmodel available data and challenges Water Res 2011 45 961minus979
Environmental Science amp Technology Article
dxdoiorg101021es300372h | Environ Sci Technol 2012 46 7782minus77897789
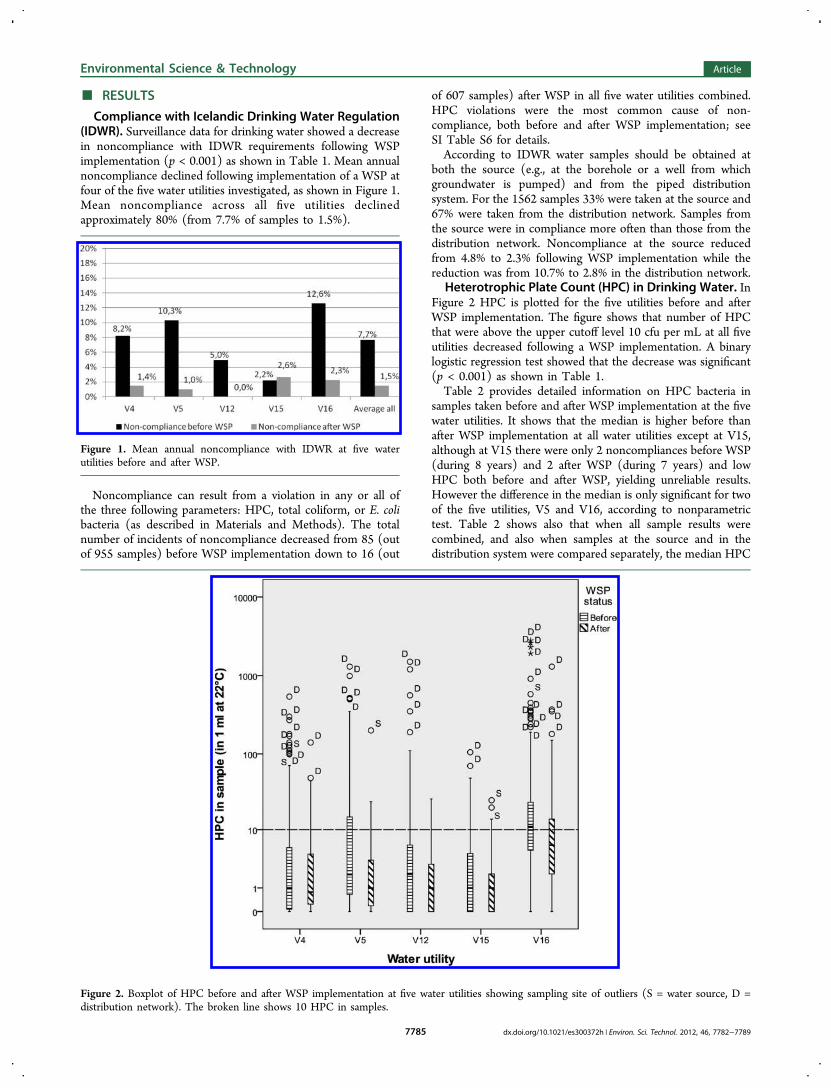