benefits of theft reform summary report
TRANSCRIPT

5th Review of the NMVTRC
Benefits of Theft Reform— Summary Report October 2014
Prepared by: MM Starrs Pty Ltd

Benefits of Theft Reform – Summary Report 2
Report outline
Date October 2014
Title Benefits of Theft Reform—Summary Report
Address National Motor Vehicle Theft Reduction Council Suite 1, 50-52 Howard Street North Melbourne Victoria 3051
Email [email protected]
Type of report Evaluation – Summary Paper
Objectives To provide a summary of the independent assessment of the costs and benefits of vehicle theft reform in Australia and the NMVTRC’s performance in overseeing the reform process.
NMVTRC Program 2014 Review
Key milestones Final Report
Abstract In accordance with the terms of the inter-government/insurance industry agreement under which it operates, the NMVTRC is required to present an evaluation of its operations to State and Territory Ministers and the Insurance Council of Australia (ICA) during 2014/15. There are three discrete elements to the Review:
This study of the economic and social benefits (the benefits element) of the NMVTRC’s theft reform activities;
A survey of stakeholders’ perceptions of the NMVTRC’s performance in meeting its objectives and support for its dissolution or extension (the stakeholder element); and
The development of a set of recommendations by the NMVTRC on whether it should be wound-up or extended.
This report deals solely with the benefits element. The report demonstrates the economic value of vehicle theft reform to Australia and the NMVTRC’s considerable contribution to delivering those benefits.
Purpose The study was commissioned to fulfil part of the NMVTRC’s obligation for independent review under the terms of the intergovernmental/insurance industry agreement which establishes it.
Key words Review, cost-benefit analysis, impacts, vehicle theft

Benefits of Theft Reform – Summary Report 3
Contents
1. Introduction ............................................................................................................................... 1
2. Evaluation Period ...................................................................................................................... 1
3. Analysis Method ....................................................................................................................... 1 3.1 Identifying the Benefits Attributable to the NMVTRC ................................................................. 2 3.2 Defining NMVTRC’s Impact on Vehicle Theft ............................................................................ 2 3.3 Estimating the NMVTRC’s Impact on Short Term Theft ............................................................ 2 3.4 Estimating the NMVTRC’s Impact on Profit-motivated Theft ..................................................... 3
4. The Level of Motor Vehicle Theft ............................................................................................. 4 4.1 Forecasting Theft Rates to 2018/19 .......................................................................................... 4
5. The Cost of Stolen Vehicles ..................................................................................................... 6
6. The Costs of Reform ................................................................................................................. 7 6.1 Costs Borne By Other Parties ................................................................................................... 7 6.2 Costs Borne by the NMVTRC ................................................................................................... 7
7. Overall Results .......................................................................................................................... 8
8. Beneficiaries of Theft Reform .................................................................................................. 9
9. Reasonableness of the Results ............................................................................................... 9

5th Review of the NMVTRC Benefits of Theft Reform— Summary Report 1
1. Introduction This report was commissioned by the National Motor Vehicle Theft Reduction Council (NMVTRC), a joint initiative of Australian governments and the insurance industry to facilitate the implementation of strategic responses to combat motor vehicle theft. The NMVTRC’s term is subject to programmed triennial reviews, with its current term ending in mid-2015. Under the terms of the current inter-government/insurance industry agreement, the NMVTRC is required to present an evaluation of its operations to State and Territory Ministers and the Insurance Council of Australia by the end of 2014. This report is concerned with the economic benefits of vehicle theft reform that can be attributed to the activities of the NMVTRC and comprises part of the triennial review and evaluation. This document provides a summary of the evaluation methodology, the underlying assumptions that have been utilised and the overall results which are expressed in terms of Net Present Value (NPV) and the Benefit-Cost Ratio (BCR). For a more detailed description of the rationale and calculations underpinning this summary please refer to the companion Technical Working Paper.
2. Evaluation Period The NMVTRC has operated since 1999 and similar benefit analyses were undertaken as part of equivalent reviews in 2005, 2008 and 2011. The analysis of the NMVTRC’s performance examines the benefits of theft reforms that have occurred since 2009/10; to fully assess the benefits, the evaluation period extends through to 2018/19, which gives a 5 year period of actual theft reduction and a 5 year forecast period. The forecast period is required because the effect of many reforms extends over more than a single year. For example, once a vehicle has security devices fitted then it is protected from theft for the rest of its life; the benefits over the life of a vehicle are relevant to the comparison of the cost of securing the vehicle not just the benefits in the year in which the expenditure on the security devices occurred. Other programs need to be repeated if they are to continue to have an effect on motor vehicle theft, so their costs need to be continued into the future. For example, public education programs aimed at increasing awareness of motor vehicle theft and actions required to minimise the likelihood that a vehicle will be stolen.
3. Analysis Method Essentially two outcomes are required to meet the objectives being sought, and these can be achieved by two separate, although closely related, analyses: 1 What are the net benefits of the NMVTRC’s motor vehicle theft reforms?
This question can be answered by a cost-benefit analysis, which identifies all the gains and losses from an action to all members of society and attempts to express them in monetary terms so they can be combined into a single measure. If the total benefits exceed the total costs, then the theft reform activity of the NMVTRC will be economically worthwhile. All costs, whether incurred by the NMVTRC, other bodies or by motor vehicle owners, should be included in the cost-benefit analysis if they have contributed to the benefits, ie the reduction in motor vehicle theft.
2 How has the NMVTRC performed in reducing motor vehicle theft?
This question can be answered by examining only the costs of the NMVTRC relative to the net benefits of motor vehicle theft reform. In other words, how effective has the NMVTRC been in meeting its objective to reduce motor vehicle theft, either by expending resources itself or by encouraging others to do so. In practice, the only difference to the cost-benefit analysis is that costs incurred by others are excluded.

Benefits of Theft Reform – Summary Report 2
3.1 Identifying the Benefits Attributable to the NMVTRC The objective of this report is to quantify the costs and benefits of motor vehicle theft reduction that are attributable to NMVTRC activity in the five years from 2009/10 to present; including any benefits that will accrue over the following five years from that activity. In order to do this the analysis requires, to the extent possible, estimates of the proportions of vehicle theft reduction over the period: that would have occurred even if there had been no specific vehicle theft reforms of any type,
for example identifying the trend in all property crime and discounting this level of reduction from the trend in vehicle theft accordingly;
that could have been expected as a result of vehicle theft initiatives that would have taken place even if NMVTRC did not exist and/or have subsequently occurred without the input or influence of the NMVTRC; and
that occurred as a result of the NMVTRC’s direct action or influence. Only the benefits from that proportion of vehicle theft reduction that is identified as occurring as a result of direct action or influence of the NMVTRC are included in the evaluation results.
3.2 Defining NMVTRC’s Impact on Vehicle Theft The NMVTRC’s Strategic Plan is structured so that the two main motivations for vehicle crime are addressed by programs and projects, specifically: The volume of vehicle crime is primarily driven by theft for short term use, which are vehicles
that are stolen for a purpose and then abandoned. Vehicles that are stolen and recovered are classified as Short Term Theft.
The cost of vehicle crime is primarily driven by theft for profit, which are vehicles that are stolen and converted to cash in a variety of ways and are never found. Vehicles that are stolen and not recovered are classified as Profit-motivated Theft.
All of the NMVTRC’s reform activities and programs can be allocated to one or other of these theft types. As the level of the NMVTRC’s impact or influence on these two categories of theft varies, the evaluation results are calculated and presented separately for short term and profit-motivated theft and are then combined for a total theft result.
3.3 Estimating the NMVTRC’s Impact on Short Term Theft At the same time as motor vehicle theft has been decreasing, other types of crime have also decreased. Arguably some of the motor vehicle theft reduction is therefore due to factors other than specific programs aimed at reducing motor vehicle theft. This proposition was explored by examining growth rates in the various types of other related crimes and the correlations between the numbers of crimes committed. There are high correlations between short term motor vehicle theft and other property crime, although they are not as strong as in earlier reviews. Since 2009 the links between other property crime and motor vehicle theft have reduced, with respective reductions of 9 per cent and 11 per cent. The reduction in motor vehicle theft is 1.3 times more than the reduction in other property crimes. This suggests that around one third of the reduction in short term theft could be regarded as independent of specific theft reduction measures. In previous reviews, 40 per cent was used and that has been retained in this review so that the forecasts remain conservative. An estimate is then required for the proportion of the remaining 60 per cent of the reduction that can be directly attributable to the NMVTRC. The objective of the NMVTRC’s programs in this category is the development and implementation of cost-effective measures that: reduce the incidence of vehicle theft by young people; and raise community awareness of vehicle theft and security.

Benefits of Theft Reform – Summary Report 3
NMVTRC activities that were examined and their contributing impact assessed in this category include the U Turn program, Youth Education Resources, the Immobilise Now Program, Operation Bounce Back, various media campaigns and extensive distribution of a range of community education resources to police and other local initiatives. Some theft reduction could be attributed directly to the NMVTRC’s programs but as is the case in all evaluations of this nature some assumptions had to be made based on incomplete data. One of the significant factors influencing the NMVTRC’s results was to exclude reductions attributable to engine immobilisers fitted to new vehicles and retrofitted to older vehicles via WA’s compulsory immobiliser scheme. The quantum of this exclusion is based on the relative theft rates for immobilised and non-immobilised vehicles and estimates of the number of stolen vehicles if all were stolen at the non-immobilised theft rate. It is noted however, that the NMVTRC was material in accelerating the establishment of the Australian Design Rule for immobilisation of new vehicles in 2001. After allowing for the reforms and increasing immobilisation of the vehicle fleet, the analysis assumes that 40 per cent of the 60 per cent reduction affected by short term theft reduction measures in total can be attributable to the work of the NMVTRC. In effect, 24 per cent of the total reduction in short term theft in the period is attributed to the NMVTRC in the analysis (ie 40 per cent of the 60 per cent reduction over and above the reduction in other property crime). The selection of the NMVTRC’s share is still not without uncertainty but seems reasonable in view of the known links between immobilisation and motor vehicle theft.
3.4 Estimating the NMVTRC’s Impact on Profit-motivated Theft While there is a very high correlation between the movements in short term theft and other property crime, in the last five years there is effectively no correlation with profit-motivated theft and there are significant variations when data are disaggregated by jurisdiction. No adjustment for other property crime is therefore made in the forecasts of profit-motivated theft. The data suggest it is difficult to achieve once and for all reductions in profit-motivated theft, as was forecast in the previous reviews, and is confirmed by later actual theft behaviour. This is not surprising as professional theft is carried out by criminals who will attempt to find new ways to maintain their livelihood once one path is closed off. The objective of the programs in this theft category is the development and implementation of cost-effective systems and infrastructure practices that: disrupt the separated parts markets; and disrupt vehicle laundering markets. Programs that were examined and their contributing impact assessed in this category include: vehicle identification (both microdots and secure labels), the management of vehicle components, management of written off vehicles, information exchange, and investigative responses. The assessment is that 80 per cent of the trend changes in profit-motivated theft remain attributable to the work of the NMVTRC as they were in previous reviews. This assumption is based on the comprehensiveness of the NMVTRC’s activities in this area, consultations as part of previous reviews, and the success of the reform programs discussed in detail in the Technical Working Paper.

Benefits of Theft Reform – Summary Report 4
4. The Level of Motor Vehicle Theft Figure 1 shows the number of vehicles stolen in the two categories: short term theft, represented by the number of recovered vehicles; and profit-motivated theft, represented by the number of unrecovered vehicles. Figure 1: Number of Stolen Vehicles by category, January 2000 to June 2014
0
2,000
4,000
6,000
8,000
10,000
12,000
20
00
-01
20
00
-07
20
01
-01
20
01
-07
20
02
-01
20
02
-07
20
03
-01
20
03
-07
20
04
-01
20
04
-07
20
05
-01
20
05
-07
20
06
-01
20
06
-07
20
07
-01
20
07
-07
20
08
-01
20
08
-07
20
09
-01
20
09
-07
20
10
-01
20
10
-07
20
11
-01
20
11
-07
20
12
-01
20
12
-07
20
13
-01
20
13
-07
20
14
-01
- - - - Short term theft
------- Profit motivated theft
Since 2001, the reduction in short term theft has been 67 per cent or 8.3 per cent per year. The trend rate of growth has decreased over time with the decrease being 4.8 per cent in the most recent 5 years. This is almost the same as the forecast of 5 per cent used in the 2011 Review. The number of vehicles subject to profit-motivated theft has decreased over the 13 years by 12 per cent (1.3 per cent per year). A significant proportion of the decline was in the early years and the number of vehicles stolen shows a variable pattern over time, with year-on-year rises in 8 of the years (2001, 2004 to 2008, and 2011 to 2012), and falls in the other 6 years.
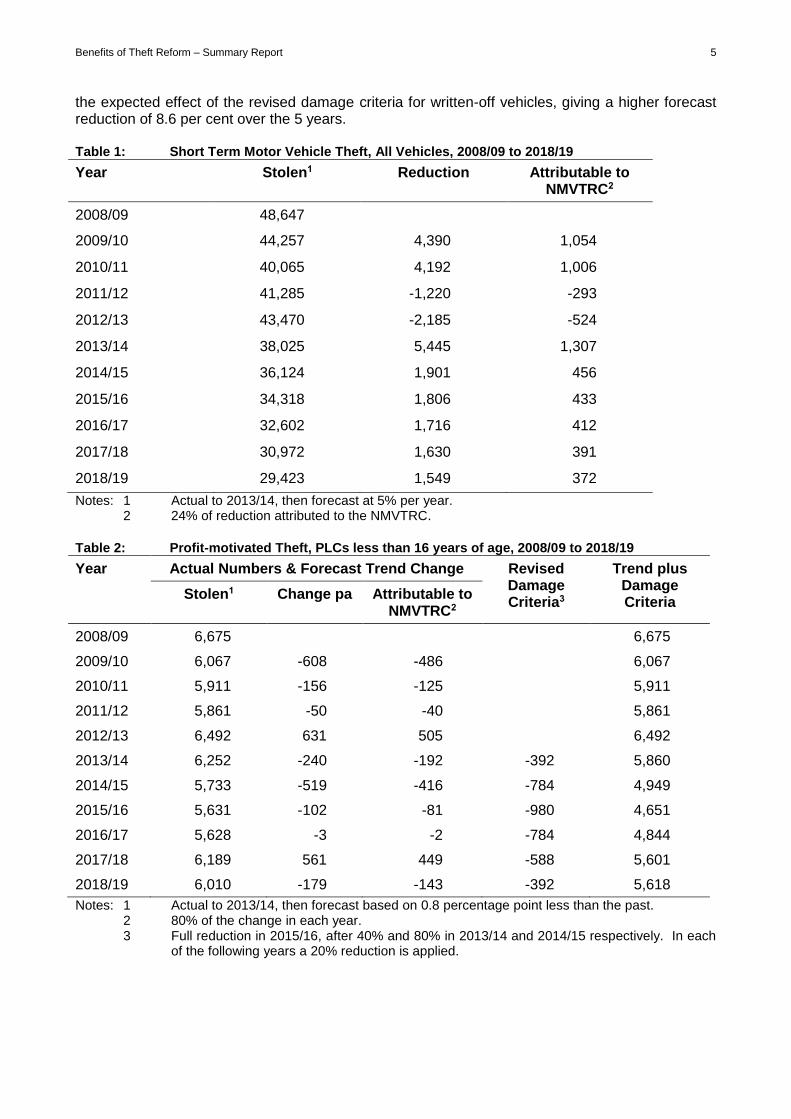
4.1 Forecasting Theft Rates to 2018/19 The short term theft forecast, shown in Table 1, is that the number of stolen vehicles will reduce by 5 per cent per year over the 5 year forecast period. The selection of a trend growth rate for forecasting purposes is not without uncertainty; the 5 per cent continues the downward trend in motor vehicle theft at a rate similar to the actual rate in the last 5 years (4.8 per cent). A lower rate could be used: it is not used because the national figure was dragged down by Queensland and WA, which experienced increases in short term theft of 3.9 and 0.9 per cent respectively, and these increases are unlikely to continue over the forecast period. The forecast rate is the same as that used in the 2011 Review. The 24 per cent share attributed to the work of the NMVTRC is also carried forward into the forecast period. The forecast for profit-motivated theft does not follow a smooth pattern as is the case for short term theft as shown in Table 2. This forecast trend is based on the actual numbers of vehicles stolen in each of the last 5 years less 0.8 percentage points so that there is an increase in one year and decreases in the other 4 years. Overall there is a decrease of 3.9 per cent over the 5 forecast years while there was a decrease of 6.3 per cent in the last 5 years. Added to this trend forecast is
Benefits of Theft Reform – Summary Report 5
the expected effect of the revised damage criteria for written-off vehicles, giving a higher forecast reduction of 8.6 per cent over the 5 years. Table 1: Short Term Motor Vehicle Theft, All Vehicles, 2008/09 to 2018/19
Year Stolen1 Reduction Attributable to NMVTRC2
2008/09 48,647
2009/10 44,257 4,390 1,054
2010/11 40,065 4,192 1,006
2011/12 41,285 -1,220 -293
2012/13 43,470 -2,185 -524
2013/14 38,025 5,445 1,307
2014/15 36,124 1,901 456
2015/16 34,318 1,806 433
2016/17 32,602 1,716 412
2017/18 30,972 1,630 391
2018/19 29,423 1,549 372
Notes: 1 Actual to 2013/14, then forecast at 5% per year. 2 24% of reduction attributed to the NMVTRC.
Table 2: Profit-motivated Theft, PLCs less than 16 years of age, 2008/09 to 2018/19
Year Actual Numbers & Forecast Trend Change Revised Damage Criteria3
Trend plus Damage Criteria
Stolen1 Change pa Attributable to NMVTRC2
2008/09 6,675 6,675
2009/10 6,067 -608 -486 6,067
2010/11 5,911 -156 -125 5,911
2011/12 5,861 -50 -40 5,861
2012/13 6,492 631 505 6,492
2013/14 6,252 -240 -192 -392 5,860
2014/15 5,733 -519 -416 -784 4,949
2015/16 5,631 -102 -81 -980 4,651
2016/17 5,628 -3 -2 -784 4,844
2017/18 6,189 561 449 -588 5,601
2018/19 6,010 -179 -143 -392 5,618
Notes: 1 Actual to 2013/14, then forecast based on 0.8 percentage point less than the past. 2 80% of the change in each year. 3 Full reduction in 2015/16, after 40% and 80% in 2013/14 and 2014/15 respectively. In each of the following years a 20% reduction is applied.

Benefits of Theft Reform – Summary Report 6
The forecast is higher than the 2011 Review and the actual theft reduction appears to have been less than forecast1 so it might be expected that a lower forecast would be appropriate. This is not supported by the pattern of increases/decreases in profit-motivated theft by jurisdiction: decreases only occurred in NSW (6.1 per cent) and the ACT (21 per cent), while increases in the larger jurisdictions of Queensland (9.1 per cent), WA (5.1 per cent) and Victoria (3.9 per cent) reduced the national figure. As is the case with short term theft, these increases are unlikely to continue over the forecast period. The forecast for short term theft includes all vehicles while the forecast for profit-motivated theft only covers PLCs that are less than 16 years of age. The implications are that the NMVTRC’s programs implemented to date have not affected the profit-motivated theft of vehicles older than 15 years to any great extent and will not do so to any great extent in the next five years.
5. The Cost of Stolen Vehicles The second component of the benefits of theft reform is the unit cost per stolen vehicle (see Table 3). The cost of stolen vehicles is made up of four components; vehicle damage or loss, personal cost to owners, injury costs arising from stolen vehicle crashes, and insurance administration costs. The unit costs of vehicles subject to profit-motivated theft are significantly higher than for short term thefts. This is partly because only PLCs under 16 years of age are included in the profit-motivated analysis but mainly because it is newer vehicles that are targeted by professional thieves. Compared to the 2011 Review, vehicle damage or loss costs increased significantly for short term thefts ($3,560) and slightly for profit-motivated thefts ($260), due to more precise data from the Nexus survey on the insurance status of stolen vehicles. Personal costs decreased for both types of theft, and more significantly for profit-motivated thefts, again due to the data from the Nexus survey. The decreases are $740 for vehicles subject to short term theft and $910 for profit-motivated thefts. Injury costs increased by $720 due to more recent accident cost data and relative changes in the number of stolen vehicles and crashes. The injury cost is only applied to recovered vehicles; it is unlikely that profit-motivated thieves would be involved in road accidents relative to opportunistic thieves. No new insurance administration costs were sought so those from the 2011 Review were increased by the CPI (resulting in increases of $50 for short term thefts and $60 for profit-motivated thefts). Compared to the unit costs used in the 2011 Review, the overall figure for short term theft has increased by about 30 per cent and that for profit-motivated theft is about the same. Table 3: Unit Cost per Stolen Vehicle by Cost Component and Type of Theft ($)
Cost Component Short Term Theft Profit-motivated Theft
Vehicle damage or loss 6,520 16,500
Personal 2,350 2,890
Injury 1,500 na
Insurance administration 780 1,110
Total unit cost 11,150 20,500
1 It is not possible to be precise because only 2 and a half years of stolen vehicle data were available for comparison purposes while the forecast period was 5 years.

Benefits of Theft Reform – Summary Report 7
6. The Costs of Reform The presentation of the costs of vehicle theft reform follows the NMVTRC’s four programs in the 2013 Strategic Plan. In the 2011 Review costs were based on two goals of theft reform (reducing the volume of motor vehicle theft and reducing the costs of motor vehicle theft) so it is not possible to directly compare costs; in addition, costs reported below are in 2014 price levels.
6.1 Costs Borne By Other Parties Some of the projects of the NMVTRC require other parties to invest costs for their success. The calculations and rationale for the estimated costs of those projects are discussed in detail in the Technical Working paper, including some commentary on the reasons for not including costs for some of the projects. The costs by project are shown in Table 4. Costs to others include the cost to manufacturers of applying secure labels and microdots, fitting of immobilisers as a result of NMVTRC programs, and young offender program costs. The revised damage criteria commenced operation from September 2012 with all jurisdictions, except the Northern Territory, having implemented the reform by September 2013 so costs in relation to that project have been included. Costs are derived from the project’s Regulatory Impact Statement and a net figure is used covering loss in salvage values to insurers, loss of profits to auction houses and reduction in costs to vehicle inspection authorities. Some implementation costs to jurisdictions were paid by NMVTRC and they are included in NMVTRC costs. No other costs are included for States/Territories as the work is assumed to be part of their “normal business”. Table 4: Costs to Other Bodies and Individuals of Identification Projects, 2009/10 to 2018/19
($’000)
Year Identification Written-off Vehicles
Young Offenders
Immobilisers Total
2009/10 2,174 960 20,800 23,933
2010/11 2,616 653 20,800 24,069
2011/12 2,414 768 3,182
2012/13 2,664 624 3,287
2013/14 2,604 7,572 1,007 11,183
2014/15 2,520 15,145 830 18,494
2015/16 2,013 12,873 830 15,716
2016/17 1,506 10,601 830 12,937
2017/18 1,574 8,329 1,277 11,180
2018/19 1,641 6,058 1,009 8,708
6.2 Costs Borne by the NMVTRC The costs of NMVTRC programs and operations for the last 5 years and forecasts for the next 5 years are shown in Table 5. The distribution of costs between programs that meet the two main goals of the NMVTRC are reasonably evenly split over time with some variation from year to year. The NMVTRC corporate costs cannot be uniquely attributed to either short term or profit-motivated theft, but are jointly attributable so they are included only in the all theft total.

Benefits of Theft Reform – Summary Report 8
Table 5: NMVTRC Program and Operating Costs, 2009/10 to 2018/19 ($’000)
Year DSPM DVLM DYO CBI Corporate Total
2009/10 450 367 171 822 679 2,488
2010/11 145 360 225 926 694 2,351
2011/12 195 705 287 832 682 2,701
2012/13 166 432 459 326 670 2,053
2013/14 391 200 395 589 650 2,225
2014/15 300 300 350 600 675 2,225
2015/16 300 300 300 600 675 2,175
2016/17 350 300 300 600 675 2,225
2017/18 325 325 250 600 675 2,175
2018/19 350 350 250 600 675 2,225
DSPM = Disrupt Separated Parts Markets, DVLM = Disrupt Vehicle Laundering Markets, DYO = Divert Young Offenders, CBI = Capacity Building and Innovation.
7. Overall Results The net benefits of vehicle theft reform are derived by multiplying the change in the estimated number of vehicle thefts from NMVTRC reforms by the unit costs of vehicle theft in each of the categories of Short Term and Profit-motivated theft and deducting the cost of implementing the reforms. As the costs and benefits occur over several years, it is necessary to express them in a common unit of account. This is achieved by expressing them in current day price levels (June 2014) and discounting them at 5 per cent pa. The evaluation criteria used are net present value (NPV) and benefit-cost ratio (BCR). The NPV is the difference between the discounted benefits and the discounted costs, and represents the overall economic worth of motor vehicle theft reform. The BCR is discounted benefits divided by the discounted costs, and can be a useful mechanism to rank projects where there are several of them competing for funds. Table 6 shows the component costs and benefits that make up the overall cost-benefit analysis results. Table 6: Components of Costs and Benefits ($ million), discounted at 5 per cent pa
Component Short Term Theft
Profit-motivated Theft
All Theft
NMVTRC costs -7.8 -5.4 -13.2
Costs of others -47.6 -62.4 -110.0
Written-off vehicle costs1 na -44.4 -44.4
NMVTRC Corporate costs na na 5.5
Vehicle loss & damage/Insurer 132.4 90.9 223.4
Vehicle loss & damage/Owner 82.2 21.3 103.5
Personal 34.3 16.6 50.8
Injury 47.3 na 47.3
Insurance administration 16.6 7.7 24.3
NPV 257.4 24.2 276.1
BCR 5.6 1.2 2.6

Benefits of Theft Reform – Summary Report 9
The cost-benefit analysis results are summarised in Table 7. The returns from all theft reform (“All Theft” column in the table) are economically worthwhile. The benefits are greater than the costs by $276 million, as measured by the NPV, and the return from $1 of expenditure on theft reform is $2.60, as measured by the BCR. The benefits of the reduction in short term theft are larger than for profit-motivated theft. Indeed, the results suggest that there is a marginal economic case for the costs expended on profit-motivated theft compared to the estimated theft reduction benefits. This is despite the fact that the costs and benefits of the revised damage criteria are included. Table 7: Cost-benefit Analysis Evaluation Results, discounted at 5 per cent pa
Indicator Short Term Theft
Profit-motivated Theft
All Theft
Present value of costs ($m) 55.4 112.2 173.1
Present value of benefits ($m) 312.8 136.5 449.3
Net present value ($m) 257.4 24.2 276.1
Benefit-cost ratio 5.6 1.2 2.6
NPV = the present value of benefits minus the present value of costs. BCR = the present value of benefits divided by the present value of costs.
The performance of the NMVTRC results are summarised in Table 8. The results suggest that the performance of the NMVTRC continues to be impressive, with an overall return of 24.1, which is slightly higher than that estimated in the 2011 Review. The profit-motivated theft return remains lower than the short term theft return, but is improved somewhat relative to the cost-benefit analysis results. The NMVTRC costs are about 11 per cent of the total costs, which explains the better results for the performance of the NMVTRC than for the cost-benefit analysis. Table 8: Performance of the NMVTRC, discounted at 5 per cent
Indicator Short Term Theft
Profit-motivated Theft
All Theft
Present value of costs ($m) 7.8 5.4 18.6
Present value of benefits ($m) 312.8 136.5 449.3
Net present value ($m) 305.0 131.1 430.6
Benefit-cost ratio 40.2 25.3 24.1
NPV = the present value of benefits minus the present value of costs. BCR = the present value of benefits divided by the present value of costs.
8. Beneficiaries of Theft Reform There are two main beneficiaries from motor vehicle theft reform (derived from Table 6). First, insurers benefit with savings from vehicle loss and damage and administration totalling $223 million. Their net benefit will be lower due to the costs of the revised damage criteria for written-off vehicles (losses in salvage values) and their contribution to the NMVTRC’s funding. The net benefit is estimated at about $170 million.
Second, vehicle owners benefit with savings from vehicle loss and damage costs, and personal costs of $154 million. Their net benefit may be reduced to $96 million if they pay the full cost of fitting security measures to their vehicles, estimated at $58 million for identification and retrofitting immobilisers.
9. Reasonableness of the Results The economic results and the performance of the NMVTRC are similar to those in the 2011 Review, with some positive and negative variations. The benefits in that review appear to

Benefits of Theft Reform – Summary Report 10
have been overestimated for profit-motivated theft but not for short term theft. Essentially the same methods of estimating the theft reductions and unit costs are used and the forecasts of theft reductions are similar. There has been an increase in unit costs of vehicles subject to short term theft while those for profit-motivated theft are almost the same. The question arises whether the forecasts remain too high, especially for profit-motivated theft. The trend improvement in profit-motivated theft has been very low in the last five years (6.3 per cent) and is forecast to be somewhat lower over the next five years (3.9 per cent). When the effect of the revised damage criteria for written-off vehicles is included the reduction is forecast to be 8.6 per cent. The original theft reductions for the revised damage criteria were subject to separate and extensive analysis; for this analysis they have been reduced by 10 per cent and the benefits over time reduced. If this project were not included in the benefits of theft reform, the discounted benefits of projects concerned with profit-motivated theft would approximately equal their discounted costs, resulting in a return of $1 for every $1 invested (BCR = 1). With respect to short term theft, the forecast theft reduction for the next five years is 5 per cent per year, the same as in the 2011 Review and almost the same as the actual theft reduction in the last 5 years. The assumptions used to forecast the share attributable to the work of the NMVTRC results in a share of 24 per cent, although it could have been higher due to the lower correlation between motor vehicle theft and other property crime. This proportion would need to fall to 5 per cent for costs to outweigh benefits. This seems most unlikely in view of the reform programs and their assessed effects.