benefits of seat belt reminder systems - monash university · pdf filei department of...
TRANSCRIPT

i
Department of Transport and Regional Services Australian Transport Safety Bureau
Benefits of Seat Belt Reminder Systems
Brian Fildes, Michael Fitzharris, Sjaanie Koppel and Peter Vulcan
Monash University Accident Research Centre
Victoria, Australia

ii
AUSTRALIAN TRANSPORT SAFETY BUREAU DOCUMENT RETRIEVAL INFORMATION
Report No. Date Pages ISBN ISSN CR 211a December 2002 56 0 642 25503 2 1445 4467
Title and Subtitle Benefits of seat belt reminder systems
Author(s) Fildes B.N., Fitzharris M., Koppel S. & Vulcan A.P.
Performing Organisation Monash University Accident Research Centre Wellington Road, Clayton, Victoria, 3168, Australia.
Sponsor [Available from] Australian Transport Safety Bureau P.O. Box 594, Canberra, ACT. 2601, Australia.
Abstract This study set out to examine whether a more aggressive seat belt reminder would be cost-beneficial for Australia. While seat belt wearing rates have been observed at around 95% in the front seat, non-wearing rates in casualty crashes are as high as 33% among persons killed and 19% among seriously injured occupants. Benefits were computed for three device options (simple, simple-2 and complex) and three introduction scenarios (driver-only, front seat occupants and all occupants). Four levels of effectiveness were assumed, from 10% to 40%, depending on the type of device fitted. Unit benefits were computed for 4%, 5% and 7% discount rates, and for fleet life periods of 15 and 25 years. Costs were derived from data provided by industry experts. The findings from this study show that Benefit-Cost-Ratios ranged from 5.1:1 at best (simple device for the driver only) to 0.7:1 (simple device for all passengers) depending on the type of device fitted, its assumed effectiveness, the discount rate, and the fleet life figure applied. It is not clear if a simple device (consistent flashing light and warning tone) would suffice given the high level of seat belt wearing rates that currently exist in Australia, and hence a more aggressive unit that embarrasses non-wearers may be required.
Keywords Safety, Accident, Vehicle Occupant, Injury, Counter-Measure, Cost-Benefit, Economic, Harm, Evaluation
Notes (1) ATSB reports are disseminated in the interest of information exchange. (2) The views expressed are those of the author(s) and do not necessarily represent those of the Commonwealth
Government. (3) This report was updated in June 2003 to correct calculation errors in CR 211. As a result the benefit cost ratios have
changed slightly but the overall findings and conclusions are not affected.

iii
ACKNOWLEDGMENTS
The authors are indebted to the Australian Transport Safety Bureau, Department of Transport and Regional Services, Australia, for their sponsorship, interest and assistance with this project. The study team is also grateful to the many local and international specialists who willingly gave up their time to provide advice on various aspects of the study and/or report. These people included:
Mr. Anders Abrahamsson, Saab Automotive, Trollhatten, Sweden
Dr. Ola Boström, Autoliv AB Research, Vårgårda, Sweden
Mr. Bill Bridgens, Ford Australia
Mr. Chris Brooks, Australian Transport Safety Bureau
Dr. Yngve Håland, Autoliv AB Research, Vårgårda, Sweden
Mr. Robert Judd, Autoliv, Australia
Dr. Anders Lie, Swedish National Road Administration, Börlange, Sweden
Mr. Håkan Lundsten, Saab Automotive, Trollhatten, Sweden
Dr. Michael Regan, Monash University Accident Research Centre
Ms. Olivia Sherwood, Australian Transport Safety Bureau
Professor Claes Tingvall, Swedish National Road Administration, Börlange, Sweden

iv

v
TABLE OF CONTENTS
ACKNOWLEDGMENTS III
EXECUTIVE SUMMARY VII CALCULATING BENEFITS VII EQUIPMENT COSTS VIII BENEFIT-COST-RATIOS VIII INDUSTRY VIEW AND HARMONISATION IX CONCLUSIONS IX
CHAPTER 1 INTRODUCTION 1 1.1 BACKGROUND. 1 1.2 PREVIOUS RESEARCH BY MUARC. 1 1.3 PROJECT OBJECTIVES. 2 1.4 USE OF THE REPORT. 2
CHAPTER 2 LITERATURE REVIEW 3 2.1 PREVIOUS AND EXISTING SEAT BELT REMINDER SYSTEMS 3 2.2 LIKELY EFFECTIVENESS OF SEAT BELT REMINDER SYSTEMS 4 2.3 ACCEPTABILITY OF SEAT BELT REMINDER SYSTEMS. 6
2.3.1 Target Audience 6 2.3.2 Implications for Australia 7
2.4 EURO-NCAP. 7 2.5 INDUSTRY REACTION. 8
CHAPTER 3 ANNUAL BENEFIT OF SEAT BELT REMINDERS 11
3.1 HARM & INJURY MITIGATION 11 3.1.1 National Statistics & HARM Estimates 11 3.1.2 Relevance of Figures 13
3.2 INJURY REDUCTIONS 13 3.2.1 Seat Belt Reminders 13 3.2.2 Effectiveness of these Units 14 3.2.3 Implementation Strategy 14
3.3 ANNUAL HARM SAVED BY SEATING POSITION 15 3.3.1 Summary 15
CHAPTER 4 UNIT HARM AND COSTS 17 4.1 CALCULATING INDIVIDUAL VEHICLE SAVINGS 17
4.1.1 Immediate Past History 17 4.1.2 Discounting Procedure & Rate 18 4.1.3 Period over which the Benefits are calculated 18 4.1.4 Unit HARM Values 19
4.2 SEAT BELT REMINDER COSTS 19 4.3 BENEFIT-COST-RATIOS 20
CHAPTER 5 GENERAL DISCUSSION 25 5.1 BENEFITS AND COSTS 25
5.1.1 Effectiveness of These Devices 25 5.1.2 Future Savings and Life of the Device 26 5.1.3 Costs of the Devices 26
5.2 STANDARD EQUIPMENT AND VISIBILITY OF THE DEVICE 26 5.3 EURO-NCAP AND HARMONISATION 27 5.4 CONCLUSION 28

vi
REFERENCES 29
APPENDIX A: NASS CRASHWORTHINESS DATA SYSTEM 1993–2000: ESTIMATATION OF EFFECT OF SEAT-BELT EFFECTIVENESS IN INJURY MITIGATION 33
APPENDIX B: CALCULATION OF UNIT BENEFITS 41

vii
EXECUTIVE SUMMARY Historically Australia has played a leading role in promoting seat belt use, principally through government legislation since the 1970s. Australian Design Rule 69 (ADR69), mandated to apply from 1995, saw the introduction of a five-second warning light designed to act as a seat belt reminder system. Despite seat belt wearing rates for front seat occupants being in the vicinity of 95% for the past decade, current non-wearing rates in casualty crashes are as high as 33% of killed occupants and 20% of seriously injured occupants. These statistics reflect the effectiveness of seat belts in preventing injuries, and potentially a tendency for unrestrained drivers to be higher risk takers. Within this context this study set out to determine whether the introduction of a more aggressive seat belt reminder system would be cost-beneficial for Australia.
Several devices have been developed in recent years to remind vehicle occupants to buckle up. The BeltminderTM developed by Ford is one recent example, which comprises a flashing light on the dashboard and a warning tone of reasonable intensity. Variants of this include an option for the flashing rate and tone intensity to increase at higher travel speeds.
The effectiveness of these devices will depend on the occupant’s response to them. Safety experts argue that those who forget to put on their belts are likely to be the target audience for seat belt reminders, rather than the “hard-core” non-wearers. The Insurance Institute of Highway Safety and Ford have reported increased wearing rates of around 17% for the BeltminderTM system.
The European New Car Assessment Program (Euro-NCAP) has announced they intend to provide added point bonuses for cars they assess for crashworthiness if vehicles are fitted with seat belt reminders. The auto manufacturers generally support the introduction of these devices.
CALCULATING BENEFITS
The benefits of seat belt reminders were computed using the HARM Reduction method developed in Australia by the Monash University Accident Research Centre (MUARC) and used for previous benefit studies for the Department of Transport and Regional Services. HARM is a metric for quantifying injury costs from road trauma. It is a function of the number and type of injuries sustained, expressed in terms of community costs.
Three design options of the seat belt reminder were assessed; these included a simple flashing light and warning tone, the simple design with an increasing intensity with higher speeds and a complex two-stage model where the hazard lights flash after a set period of non-compliance. Introduction strategies included providing the device for the driver only, for both front seat occupants and finally for all occupant seats.
Based on previous evidence, effectiveness rates were assumed to be 10% for the simple device, 20% for the simple-2 device and between 30% and 40% for the complex design unit. It was estimated that these would increase seat belt wearing up to 97% in the front seat.
Annual HARM benefits were computed for three implementation strategies and four effectiveness rates. These varied from around $40 million to $235 million annually if all vehicles in the fleet were fitted with the devices. This would amount to an annual HARM reduction of between 0.45% and 2.65%.

viii
Unit HARM benefits were calculated using three levels of discount factors (4%, 5% and 7%) and two levels of fleet life periods, namely 15 and 25 years. In the light of a recent report by the Bureau of Transport and Regional Economics (BTRE, 2001), it was argued that a 5% discount rate and a 15-year fleet life were the most appropriate for this analysis.
EQUIPMENT COSTS
The costs established for the three design options were based on advice from equipment suppliers and current prices of available equipment. Estimates of economic cost (price less GST) varied from approximately $9.00 to $150, depending on the level of technology and the number of seats to be fitted out.
These prices were again “best estimates” of current technology likely to be required to meet the outcomes sought. It is likely though that when setting up to meet these criteria, manufacturers will find efficiencies and production savings to minimise costs even further. No allowance was included for these savings; hence the Benefit-Cost-Ratios (BCRs) would seem to be somewhat conservative. In computing the BCRs, it was assumed that these devices would be fitted as standard equipment in the vehicles.
BENEFIT-COST-RATIOS This information was then used to compute BCRs for the various design options, implementation options and the appropriate discount rates and life of the fleet as shown in Table 1 below.
Table 1.1 – Preferred Benefit-Cost-Ratios for the three seat belt reminder systems used in this analysis (assuming a 15 year fleet life and a 5% discount rate).
Seating Position SIMPLE 1 SIMPLE 2 COMPLEX COMPLEX 40%
Driver only
Unit HARM Benefit Economic Cost Benefit-Cost-Ratio Annual HARM Saved
$36.37 $9.09 4.0:1
0.45%
$72.75 $36.36 2.0:1 0.9%
$109.12 $40.91 2.7:1
1.35%
$145.50 $40.91 3.6:1
1.79%
Front seat occupants
Unit HARM Benefit Economic Cost Benefit-Cost-Ratio Annual HARM Saved
$46.92 $22.73 2.1:1
0.58%
$93.84 $59.09 1.6:1
1.16%
$140.76 $68.18 2.1:1
1.74%
$187.68 $68.18 2.8:1
2.31%
All occupants
Unit HARM Benefit Economic Cost Benefit-Cost-Ratio Annual HARM Saved
$53.81 $63.64 0.8:1
0.66%
$107.61 $127.27
0.8:1 1.33%
$161.42 $150.00
1.1:1 1.99%
$215.23 $150.00
1.4:1 2.65%

ix
These figures show that a regulation requiring manufacturers to provide a more “aggressive” seat belt reminder system in passenger cars is appropriate for Australia. The BCRs calculated for either a simple or a complex device would be cost-beneficial for both the driver-only and front seat occupant options. While driver-only BCRs were highest, the annual HARM savings were greater if the devices were also available for passengers.
INDUSTRY VIEW AND HARMONISATION There is general support for a more aggressive seat belt reminder in passenger cars by local and overseas manufacturers. Euro-NCAP are considering awarding bonus points to manufacturers in their assessment of new cars for those who fit seat belt reminders that provide a continuous flashing light and tone by each seating position.
There is a consistent push for harmonisation by the industry. However, no government at this stage has mandated seat belt reminders to our knowledge. As seat belt reminders are add-on fittings that do not require major re-structuring of vehicles, there seems little reason at this stage to reject the opportunity to increase seat belt use only because of harmonisation concerns.
It is important to point out that this would not be the first time that Australia has opted for a non-international standard when compliance did not involve manufacturers undertaking major bodywork changes. Because Australia’s occupant protection standards, unlike those of other countries, assume belted occupants, it can be argued that ADRs as a whole should do everything possible to ensure that seat belts are used. Adopting a more demanding seat belt reminder system in passenger vehicles would make the real world outcome more consistent with the assumptions behind the Australian Design Rule system.
CONCLUSIONS
The findings from this study show that it would be cost-beneficial for vehicles in Australia to be required to fit a more aggressive seat belt reminder system. There would be resultant reductions in fatal and serious injuries on Australian roads and modest reductions in vehicle occupant HARM annually when all vehicles in the fleet have these devices as standard equipment.
The preferred strategy would be for the device to be fitted for both front seat occupants. It is not clear if a simple device (consistent flashing light and warning tone) would suffice given the high level of seat belt wearing that exists already in Australia and hence a more aggressive unit that embarrasses non-wearers may be required.
Mandating an appropriate Australian Design Rule for seat belt reminders would be another first for Australia in demonstrating to the rest of the world the advantages to the community of increased seat belt wearing and the benefits in reduced HARM that would accrue.

x

BENEFITS OF SEATBELT REMINDER SYSTEMS 1
CHAPTER 1 INTRODUCTION 1.1 BACKGROUND.
In 1972, it became compulsory to wear a seat belt while travelling in a motor vehicle throughout Australia. In all states, this legislation had an immediate and significant effect on seat belt usage rates (Milne, 1979). In Melbourne, for example, one month after the introduction of legislation, seat belt usage rates rose from 25% to 50% and after one month of enforcement the usage rate rose to over 75%, and has generally remained high across all Australian states since (Ungers, 1974). A large exposure survey conducted in Victoria in 1994 reported that approximately 97% of drivers wore seat belts, with front passengers having a slightly lower usage rate, and the seat belt usage rate for rear seat occupants was 85% (ARUP, 1995). A recent exposure survey conducted by MUARC in metropolitan Melbourne in 2002 reported seat wearing rates similar to that reported in the 1994 ARUP exposure survey, indicating little improvement in seat belt usage rates in the 1990’s (Whelan, Diamantopoulou, Senserrick, & Cameron, 2003). Despite Australia having one of the highest seat belt wearing rates in the world, approximately 30% of fatally injured car occupants are unbelted (ATSB, 2002; Regan, Oxley, Godley & Tingvall, 2001; VicRoads, 1998).
It is widely accepted that the consistent use of seat belts in motor vehicles substantially reduces the incidence of fatalities and serious injuries resulting from motor vehicle crashes (e.g. Evans, 1996). Several Swedish studies have shown that half of the motor vehicle occupants with severe, critical or fatal injuries had not been wearing their seat belt (Bylund & Björnstig, 1996; Turbell & Larsson, 1998).
Bylund and Björnstig (2001) claim that if restraint wearing could be improved, the number of serious injuries or fatalities could drop dramatically. It has been shown that unrestrained motor vehicle occupants are three times more likely to be hospitalised in frontal crashes than those who were restrained (Fildes, Lane, Lenard & Vulcan, 1991) and up to seven times more likely to be killed (McLean, Aust, Brewer & Sandow, 1979). These figures reflect both elevated crash risk as well as seat belt effectiveness. While seat belt wearing rates in Australia in the front seat are high, this report estimates that unrestrained occupants account for 21% of HARM, equating to approximately $1883 million per annum. In this report, HARM is used as a metric for quantifying injury costs from road trauma, and is a function of the number and type of injuries sustained, expressed in terms of community costs.
1.2 PREVIOUS RESEARCH BY MUARC. In 1990, the Monash University Accident Research Centre (MUARC) undertook a study for the Federal Office of Road Safety (FORS, now the Australian Transport Safety Bureau) that estimated the likely benefits of a range of in-vehicle occupant protection countermeasures such as airbags, belt pretensioners and webbing clamps, improved seats and seat belt systems and padding (MUARC, 1992). This study also examined the likely effectiveness of a seat belt warning system, which was claimed to have a BCR of between 4:1 and 7:1 depending on cost of the device.
On the basis of that report, in 1996 the Department of Transport (now the Department of Transport and Regional Services) introduced a new Australian Design Rule ADR 69 that required manufacturers to meet certain crash performance criteria in a dynamic full frontal crash. It also called for the mandatory fitment of a seat belt reminder system, comprising a warning light that remained illuminated for five seconds after the ignition was switched on.

BENEFITS OF SEATBELT REMINDER SYSTEMS 2
In most current model cars, the warning system is generally easy to ignore or deactivate. Unfortunately, this was a less demanding system than what MUARC (1992) had specified when calculating the BCR for this device (the system called for a reminder system that would cause the hazard lights of the vehicle to continually flash, thereby potentially embarrassing front seat occupants who failed to wear their seat belts).
Given the large proportion of unrestrained crash-involved occupants and the apparent plateau in seat belt usage rates since the introduction of ADR 69, it is timely therefore to reconsider the introduction of a more stringent seat belt reminder system than that mandated in ADR 69.
1.3 PROJECT OBJECTIVES. This research set out to estimate the likely HARM benefits of a more aggressive seat belt reminder system for new cars sold in Australia. It was assumed that:
• The device would need to be invisible for those who normally wear their seat belts, and
• The device would be standard fitment on all new vehicles sold in Australia.
A number of specific tasks were to be addressed, namely assessing:
• What local and overseas evidence there was of the types and effectiveness of seat belt reminder systems planned or currently in use;
• What would be the likelihood of industry support for a seat belt reminder system, and
• Any concerns about international harmonisation issues.
The analysis was to use the same methodology as that used in an earlier study by the Monash University Accident Research Centre (MUARC, 1992) for FORS (now ATSB), with a number of revisions to take account of the special nature of the task.
1.4 USE OF THE REPORT. This report is a scientific evaluation of the benefits of mandating a more aggressive seat belt reminder system to that specified in ADR69 when fitted to new passenger cars in Australia. It uses the HARM reduction method of calculating injury benefits, used in a number of previous benefit-cost estimates for the ATSB. It is based on the best information available at the time of analysis and all assumptions and limitations of the analyses are detailed in relevant sections of the document. The benefits are calculated for different future discount rates and fleet life estimates using injury costs specified by the Bureau of Transport and Regional Economics (BTRE, 2001).
It is hoped that the process is sufficiently transparent that the reader should be able to assess the merit of the assumptions and the process and to gauge the effect of possible variations. The strength of the approach is its ability to re-calculate the benefits at any time, should more recent data or better assumptions be forthcoming. The report has been prepared to provide guidance to the Department of Transport and Regional Services in Australia in deciding whether to mandate a more aggressive seat belt reminder system. While the results and recommendations are based on the findings of the analysis, it is ultimately a policy decision of the Australian Government whether to mandate or not. This decision is beyond the scope of this technical document.

BENEFITS OF SEATBELT REMINDER SYSTEMS 3
CHAPTER 2 LITERATURE REVIEW 2.1 PREVIOUS AND EXISTING SEAT BELT REMINDER SYSTEMS
It is widely accepted that seat belts are one of the most efficient ways to prevent severe injuries in cars. Even when usage rates are high, the potential gains from further improvements are substantial (Chapter 1). Seat belt reminder technology is becoming increasingly important as it has the potential to ensure that all vehicle occupants can benefit from the protective value of seat belts in the event of a crash (Regan et al., 2001). Indeed, several car manufacturers have introduced or are currently experimenting with different seat belt reminder systems, of which several are presented here.
An early seat belt reminder system was introduced in the U.S. from 1973 to 1975. In this system, seat belt interlocks were connected to both front seats so that the vehicle’s engine would not start unless all front seat occupants had their seat belt fastened. In addition, an auditory warning was activated if the seat belt was later unfastened during the trip. While the National Highway Traffic Safety Administration (NHTSA) noted improvements in seat belt wearing rates, there was also an adverse consumer reaction to starter interlocks. Many motorists opposed the interlock because they believed that it infringed on their personal freedom and it was reported that many drivers disconnected the interlock. There were also reported difficulties experienced during emergency situations such as drivers getting caught on railway tracks and not being able to start the vehicle. Consequently in 1974, the U.S. Congress withdrew the standard and outlawed any future federal requirement for interlocks. The U.S. Congress also restricted the standards for auditory signals in future reminder systems, specifying that the government could only require signals that lasted for eight seconds or less.
As a consequence of the U.S. experience, recent seat belt reminder systems have tended to be less aggressive. For example, Volvo introduced a seat belt reminder system into a number of Volvo models. In this system, an intermittent visual and auditory signal was activated if the vehicle’s engine was started and the driver’s or front passenger’s seat belt was unfastened.
In 1995, the Swedish National Road Authority (SNRA) formed a special working group to develop a specification for an in-vehicle Intelligent Transport System (ITS) device capable of increasing seat belt wearing rates. The working group represented researchers, insurance companies and the car industry, and developed a generic specification for a ‘seat belt reminder’ system. The system would include:
• A sensor in the belt assembly and a presence sensor in the seat;
• An auditory and visual reminder system;
• A system that would only become activated if a front seat occupant was not wearing a seat belt whilst the vehicle was travelling over a minimum speed, and
• A signal that would become increasingly aggressive the longer that the seat belt was unfastened.
In 1999, Saab implemented a seat belt reminder system, which was consistent with the system advocated by the SNRA. Specifically, a visual and low auditory signal began to sound if a seat belt was unfastened and the vehicle had exceeded 15 km/h. The signal frequency increased as the travelling speed increased.

BENEFITS OF SEATBELT REMINDER SYSTEMS 4
Most recently, Ford has implemented the BeltminderTM seat belt reminder system. In this system a red light in the instrument panel illuminates and an audio signal chimes for six seconds, pauses for 30 seconds, and then repeats for up to five minutes if a driver remains unbelted while the vehicle is in motion. The system deactivates as soon as the driver puts the seat belt on. The BeltminderTM differs from the standard mandated by the U.S. government that requires that the system remain activated for no more than eight seconds once the motor vehicle has started.
While developing the reminder system, Ford addressed several “basic principles”:
• The system should be invisible to full time seat belt wearers;
• The system should not affect the performance of the restraint system or the driveability of the vehicle;
• The target group should be part time seat belt users who generally accept the benefits of seat belts;
• The intensity of the reminder signal should be “reminding” not “annoying”, and
• Methods for disconnection should be allowed.
The reminder system has so far been installed in some 2000 models, most 2001 models, and all 2002 models of Ford passenger vehicles in the U.S. In time, Ford intends to introduce the system to all front-seat passengers. Similarly, Volvo vehicles sold in the U.S. are also equipped with BeltminderTM.
It should be noted that it is possible to permanently deactivate Ford’s reminder system by following a complicated sequence of instructions outlined in the owner’s manual. Furthermore, buckling and then unbuckling the driver’s belt can also circumvent the system.
2.2 LIKELY EFFECTIVENESS OF SEAT BELT REMINDER SYSTEMS In deciding whether to mandate a more aggressive seat belt reminder system in Australia, it is critical to investigate the likely effectiveness of such systems on seat belt wearing compliance. Several overseas studies have specifically investigated the effectiveness of reminder systems of seat belt wearing rates and are presented here.
Bylund and Björnstig (2001) recently investigated the effectiveness of different seat belt reminder systems on Swedish seat belt wearing rates. Ambulance personnel documented the use of seat belts while taking care of injured motor vehicle drivers. The car manufacturer’s general agents in Sweden later identified the type of seat belt reminder system in each crash vehicle. The different systems were allocated into three categories: reminder systems with both a light and sound signal, reminder systems with only a light signal, and no reminder system.
The ambulance personnel reported that the overall unbelted sample was twenty percent and that on average, seat belt non-users were younger, male, driving at night and more often under the influence of alcohol or drugs than seat belt users. In terms of the effectiveness of different seat belt reminder systems, the seat belt non-usage rate in vehicles with a reminder system that had both a light and sound signal (12%) was significantly lower than the non-usage rate in vehicles without a reminder system (23%). In addition, the seat belt non-usage rate was the approximately the same for those in vehicles equipped with only a light reminder (22%) as those in vehicles without a reminder system (23%). The authors concluded that the reminder system with only a light signal has a very limited or negligible effect on increasing seat belt wearing rates.

BENEFITS OF SEATBELT REMINDER SYSTEMS 5
In 2002, Ford and Insurance Institute for Highway Safety (IIHS) researchers reported that the new BeltMinderTM seat belt reminder system installed in late model Ford passenger vehicles had increased the drivers’ seat belt wearing rate over a two month period (Williams, 2002).
In this study, researchers observed drivers’ seat belt use, licence number and gender when cars were brought in for service at 12 dealerships in Tulsa and Oklahoma City during August and September 2001. Specifically, seat belt wearing rates were significantly higher for drivers of vehicles with the BeltMinderTM system (76%) than for drivers with vehicles without the BeltMinderTM (71%). This represents a 17% improvement in seat belt wearing that can be attributed to the BeltMinderTM. Williams reported that this increase in the seat belt wearing rate is statistically significant and that if this system was implemented in every vehicle on U.S. roads, it could save approximately 700 lives each year.
Consistent with the findings of Bylund and Björnstig (2001), Williams (2002) reported that female drivers tended to have higher seat belt wearing rates in both vehicles with and without a reminder (84% and 79% respectively) than male drivers (72% and 67% respectively).
Turbell and colleagues (1996) reported that seat belt use reduces the risk of injury by up to 50%. Using Swedish seat belt usage rates, Turbell et al (1996) estimated that an effective seat belt reminder system, such as an interlock system, has the potential to reduce the number of fatalities by approximately 7600 persons annually in Europe if seat belts were worn by 100% of occupants. Similarly, the European Transport Safety Council (ETSC) estimated a potential reduction of 7174 fatalities in Europe given a 95% seat belt wearing compliance rate (ETSC 1996). The ETSC breakdown of the estimated number of fatalities saved each year (ETSC, 1996) and the seat belt wearing rate for front seat occupants in the fifteen European nations are shown in Table 2.1 (ETSC, In Press). It should be noted that only fatalities are represented in Table 2.1, however an effective reminder system would also be expected to have a similar effect on the number of seriously injured occupants, which is approximately five to ten times larger than the number of fatalities (Turbell et al, 1996; Turbell & Larsson, 1998). While not represented in Table 2.1, it is noteworthy to mention that the OECD (1997) estimates seat belt wearing rates for car drivers in the U.S. to be 62% in 1994, and hence increased restraint use has the potential to significantly reduce the mortality and morbidity associated with motor vehicle crashes in the U.S.
Table 2.1 Estimated number of fatalities saved each year by increasing seat belt wearing rates to 95 percent.
Nation % Front Seat
Belt use1
Potential fatalities saved2
Nation % Front Seat
Belt use1
Potential fatalities saved2
Austria 70 236 Italy 50 1384 Belgium 55 351 Luxembourg 55 18 Denmark 70 76 Netherlands 75 173 Finland 87 63 Portugal 45 331 France 85 1456 Spain 61 978
Germany 95 1335 Sweden 85 87 Greece 45 256 United Kingdom 93 369 Ireland 53 61
TOTAL 0F 7174 FATALITIES COULD BE SAVED EACH YEAR IN THESE 15 COUNTRIES 1 ETSC, In Press; Reference values are based on ETSC 1996 and OECD 2000 2 ETSC, 1996

BENEFITS OF SEATBELT REMINDER SYSTEMS 6
2.3 ACCEPTABILITY OF SEAT BELT REMINDER SYSTEMS.
Regan et al. (2001) suggested that acceptability is the most important issue in the introduction of a seat belt reminder system and highlighted the “failed” starter interlock system requirement in the U.S. as an example of poor consumer acceptability of a device. However it should be noted that while the consumer reaction to the interlock was extremely negative, the interlock was an aggressive approach introduced at a time when it was not compulsory to wear a seat belt in most U.S. states and therefore seat belt usage was very low. Furthermore, failure of the interlock system was largely due to its lack of sophistication and difficulty of use. For example, the system did not allow low speed manoeuvres (such as parking) or sitting unbelted in the vehicle with the engine idling without activating.
However, today’s attitudes towards vehicle safety and seat belts are very different to those of the 1970’s. Recent research has shown that reminder systems are likely to be well received by the majority of Australian drivers because they have a strong commitment to the use of seat belts (Regan et al., 2001). For example, Harrison, Senserrick and Tingvall (2000) reported that Australian road users generally had a positive reaction to the prospect of the introduction of a seat belt reminder system. The authors reported that participants in the study who reported that they did not always use their belt generally acknowledged that a reminder system would help vehicle occupants to develop better seat belt wearing habits. However Australian road users raised several concerns about the introduction of a reminder system such as:
• The potential impact of the devices on vehicle prices;
• The reliability of the system, and
• The volume of the reminder tone in terms of its ability to capture attention and to annoy vehicle occupants without interfering with the task of driving.
Turbell and Larsson (1998) reported similar attitudes to seat belt reminder systems among a group of Swedish road users.
In order to assess customer acceptability of the BeltminderTM system, Ford conducted consumer research over the phone with approximately 1,200 owners of U.S. Ford Lincoln and Mercury cars and trucks. Eighty nine percent of car drivers, 88% of sports utility vehicle drivers and 84% of pickup drivers reported being satisfied with the BeltminderTM system. Furthermore, 90% of car and sports utility vehicle drivers and all pickup drivers reported that they considered the system to be an effective reminder to buckle up. Finally, more than 75% of drivers in vehicles equipped with the BeltminderTM system reported that they would recommend the reminder system to other drivers.
2.3.1 Target Audience It is also important to note that the traditional view that vehicle occupants are either full time seat belt users or non-users is not valid (Fay, Sferco & Scott, Unpublished). Recent Swedish studies indicate that there are three types of vehicle occupant users of seat belts:
• Full-time belt wearers;
• Part-time belt wearers, and
• Dedicated non-users of seat belts.
They argued that part-time seat belt users generally accept the benefits of seat belts but often forget to put them on, while dedicated non-users are those who will actively refuse to wear belts and are likely to disconnect any reminder system.

BENEFITS OF SEATBELT REMINDER SYSTEMS 7
Dahlstedt (1999) has reported that dedicated non-users of seat belt use only account for a small percent of all non-users (0.2%), and that the majority of non-users are “inconsistent” wearers because they are neglectful or forget. This is consistent with the findings of Harrison et al. (2000) who reported that that there are three groups of motor vehicle occupants: consistent seat belt wearers, inconsistent wearers and non-wearers.
It is also reported that the motivational factors underlying non-use are quite different for inconsistent and non-wearers. For example, it has been reported that while inconsistent wearers generally accept the benefits of seat belts, the act of putting the belt on is not automatic and a technical reminder could help them (Harrison et al., 2000).
Given that it has been reported that the percentage of real opponents to seat belt use is very small, Dahlstedt (2001) has argued that efforts to increase seat belt wearing rates may be more effective if they focus on encouraging or reminding inconsistent wearers to use seat belts full time, rather than attempting to force non-users to become consistent users. Indeed several studies have reported that it may be redundant to concentrate on non-users, as real opponents to seat belt use would probably try to disconnect the reminder system if it was installed (Anderson, McLellan, Pagliarello, & Nelson, 1990; Dahlstedt, 1999). By contrast, it has been reported that inconsistent seat belt wearers are generally not opposed to the use of seat belts and are likely to respond positively to a gentle reminder system (Fay et al., Unpublished).
2.3.2 Implications for Australia Given the high wearing rates that are typical in Australia, it is difficult to estimate what the likely distribution of part-time and dedicated non-users of seat belts is in this country. Harrison et al (2000) claimed that the proportion of dedicated non-users is still relatively small in Australia, although they failed to estimate what proportion of non-users fitted this category.
The alternative view is that with seat belt wearing rates already so high in Australia, the proportion of dedicated non-users (i.e., the people most likely to disconnect any aggressive reminder system) may be quite large. Anecdotal evidence suggests that young adults today who have grown up with seat belts are much more predisposed to seat belt wearing. Thus, the proportion of part-time seat belt users (the people most likely to respond to a gentle reminder system) may be quite small. This suggests that seat belt reminder systems in Australia may need to be quite aggressive to ensure that the potential benefits are realised.
2.4 EURO-NCAP. Drawing on the U.S. experience, the European New Car Assessment program (Euro-NCAP) has emphasised the importance of customer acceptability in the effectiveness of seat belt reminder systems and has stated that “The system shall remind the occupants about using seat belts when driving, not warn them”. Furthermore, Euro-NCAP has taken the initiative to propose that the safety evaluation of vehicles shall also include the function of the seat belt reminder system. For example, one point shall be offered for the driver, front passenger seat and rear seat occupants respectively if they have seat belt systems that use both light and sound. This is an important incentive as three points could mean the difference between four and five stars.
Consistent with the specifications outlined by the Swedish National Road Administration, Euro-NCAP has recommended that seat belt reminder systems include:
• A sensor in the belt assembly for all occupants;

BENEFITS OF SEATBELT REMINDER SYSTEMS 8
• A presence sensor in the front passenger and rear occupant seats where only passengers larger/taller/heavier than a 5th percentile female would be detected;
• An auditory and visual reminder system, where the visual signal should be active the entire time that seat belts on an occupied seat are not used;
• An auditory signal which should be at least 65 dB and be “…loud and clear under normal driving conditions”, where normal driving conditions have been defined as 50 km/hour in top gear on a good asphalt road and with the ventilation fan running at 75 percent;
• An auditory signal which is active for at least 90 seconds, where the total signal period can be divided into shorter periods however the minimum duration for each signal period should be five seconds and there must be no quiet periods of more than 25 seconds;
• A reminder in which the signal and its message should be clear to the driver and effectively communicate the belt use status (for seats other than the front seats, the audio and visual signals can be substituted by an information system indicating to the driver the belt use status for these seats);
• A system that would only become activated if an occupant was not wearing a seat belt whilst the vehicle was in “use” (see below), and
• A signal that would become increasingly aggressive the longer that the seat belt remained unfastened.
As mentioned previously, one of the criticisms of the starter interlock introduced in the U.S. was that the system was unable to differentiate between low speed manoeuvres such as parking or reversing and actual driving. Therefore, Euro-NCAP has stated that the seat belt reminder system should only become activated if occupants are not wearing their seat belts while the vehicle is being “used” such as driving over a minimum speed, time or distance criteria. For example, if the vehicle is reversing or driving slowly forwards at a speed lower than 10 km/h that it should not be regarded as “using” the vehicle, but as parking. Euro-NCAP has also specified that the system should monitor the seat belt input signals continuously when the car is in “use”. For example, one of the criticisms of the BeltminderTM was that buckling and then unbuckling the seat belt could circumvent the system.
As indicated in Section 2.3, the acceptability of seat belt reminder systems remains a critical issue for both consumers and manufacturers. Of the systems reviewed here, there appears to be widespread support among consumers for their implementation, and hence they are seen, at least on the basis of early evidence, to be effective in increasing seat belt wearing rates. The Euro-NCAP proposal offers incentives to manufacturers to implement such devices. It would seem appropriate, therefore, for Australia to take the lead by mandating a seat belt reminder as a standard feature in modern passenger cars.
2.5 INDUSTRY REACTION. The European Automobile Manufacturers Association (ACEA) has expressed support for the Euro-NCAP seat belt reminder proposal. They recommended that it should commence from Phase 10 (mid-year, 2002) and have made a few suggestions for improving the protocol and clarifying some ambiguous wording. They noted, “…the industry supports the development of an objective test method with appropriate measurement procedures as it will allow efficient developments”.
In order to provide a comprehensive estimate of the likely benefits and costs of seat belt reminder systems in passenger cars for the Australian market, MUARC contacted most major

BENEFITS OF SEATBELT REMINDER SYSTEMS 9
manufacturers, local and overseas, requesting any information regarding current and future reminder systems, their cost per vehicle, and their likely benefits.
While the response rate was generally low, those who did respond indicated that they would be receptive to the prospect of a more aggressive seat belt reminder system. While receptive to the implementation of seat belt reminder systems, one international manufacturer stated that they would be reluctant to support a system that did not align to international standards, such as that proposed by Euro-NCAP.
One European manufacturer responded that the next generation of seat belt reminders in their vehicles will have a more advanced function, that is, it will intensify in multiple steps for those who steadfastly refuse to buckle up. They also noted that if the vehicle is fitted with an “intelligent” airbag system, there are switches in the belt buckles and passenger detection units that could also be used for a reminder system at no cost. In other words, mandating a reminder system may have minimal cost consequences for their vehicles.

BENEFITS OF SEATBELT REMINDER SYSTEMS 10
BENEFITS OF SEATBELT REMINDER SYSTEMS 11
CHAPTER 3 ANNUAL BENEFIT OF SEAT BELT REMINDERS The concept of "HARM" was first developed in the U.S. and applied to the National Automotive Sampling System (NASS) database by the National Highway Traffic Safety Administration (NHTSA) as a means of determining countermeasure benefits for road safety programs (Malliaris, Hitchcock & Hedlund 1982; Malliaris, Hitchcock & Hansen 1985; Malliaris & Digges 1987). The Monash University Accident Research Centre (MUARC) further modified and extended the use of ‘HARM’ by recalibrating the cost estimates to Australian standards and applying these estimates to evaluate occupant protection countermeasures (MUARC, 1992). Thus, the development and use of HARM in the previous study (MUARC, 1992) and other Australian studies represents a significant international advancement in the ability to assess injury mitigation effects of vehicle countermeasures.
3.1 HARM & INJURY MITIGATION HARM is a metric for quantifying injury costs from road trauma. It is a function of the number and type of injuries sustained, expressed in terms of community costs. The HARM method adopted here embraced the original approach outlined in MUARC (1992). This approach is suited for use in computing likely benefits of countermeasures where there are no global estimates of the likely improvements but where there are sufficient data available to derive the annual HARM by type of injury and crash. The method allows a picture of the expected overall benefit to be pieced together from a series of individual data sets by severity of injury, type of crash, people injured, and their restraint use. A computer spreadsheet was developed for making the detailed HARM calculations by body region, similar to that used previously in MUARC (1992).
3.1.1 National Statistics & HARM Estimates This report examines the crash history and associated HARM for passenger vehicles and light commercial vehicles. Similarly, New Motor Vehicle Registrations used in calculations of this report relate only to passenger and light commercial vehicles. The vehicle type definitions (i.e., passenger vehicles and light commercial vehicles) follow those specified by the Australian Bureau of Statistics in the New Motor Vehicle Registration report series (ABS, 1976-2002). More specifically, passenger vehicles are vehicles constructed primarily for the carriage of less than 10 passengers (including the driver) and include cars, station wagons, 4WD passenger vehicles, and forward control passenger vehicles (ABS, 2002). Light commercial vehicles are vehicles constructed primarily for the carriage of goods and do not exceed 3.5 tonnes GVM and include utilities, panel vans, cab-chassis and forward control vehicles (ABS, 2002). To determine the HARM associated with passenger and light commercial vehicles a comprehensive Australia-wide database of injuries was constructed for this study by merging several data sources of fatalities, seriously injured occupants and those needing medical treatment. These data were available from statistics published by the Australian Transport Safety Bureau on fatal and non-fatal injuries across Australia for 1996 (ATSB, 2002). The cost of injury was derived from figures published by the Bureau of Transport and Regional Economics (BTRE, 2001). These costs comprise not only medical and treatment data but also allowance for loss of earnings, impairment and loss of quality of life; that is, they represent
BENEFITS OF SEATBELT REMINDER SYSTEMS 12
societal cost of injury. These estimates were also derived from 1996 cost data from a variety of Australian sources.
The proportion of crash victims by crash type was derived from crash statistics in Victoria and Queensland using crashes in the period 1997–1998 inclusive. Using the number of persons injured at each severity level and the proportion of persons involved in each impact type for the three severity levels, it is possible to estimate the number of persons injured for each crash severity / impact type combination and hence the overall societal cost.
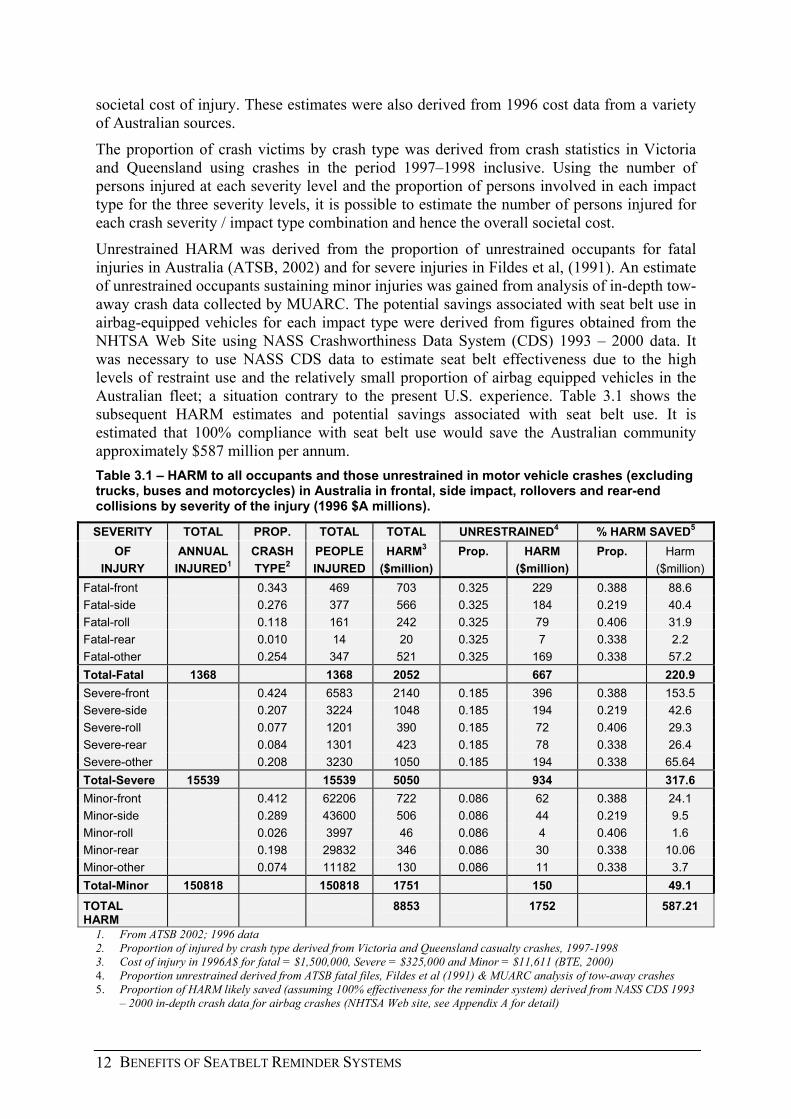
Unrestrained HARM was derived from the proportion of unrestrained occupants for fatal injuries in Australia (ATSB, 2002) and for severe injuries in Fildes et al, (1991). An estimate of unrestrained occupants sustaining minor injuries was gained from analysis of in-depth tow-away crash data collected by MUARC. The potential savings associated with seat belt use in airbag-equipped vehicles for each impact type were derived from figures obtained from the NHTSA Web Site using NASS Crashworthiness Data System (CDS) 1993 – 2000 data. It was necessary to use NASS CDS data to estimate seat belt effectiveness due to the high levels of restraint use and the relatively small proportion of airbag equipped vehicles in the Australian fleet; a situation contrary to the present U.S. experience. Table 3.1 shows the subsequent HARM estimates and potential savings associated with seat belt use. It is estimated that 100% compliance with seat belt use would save the Australian community approximately $587 million per annum. Table 3.1 – HARM to all occupants and those unrestrained in motor vehicle crashes (excluding trucks, buses and motorcycles) in Australia in frontal, side impact, rollovers and rear-end collisions by severity of the injury (1996 $A millions).
SEVERITY TOTAL PROP. TOTAL TOTAL UNRESTRAINED4 % HARM SAVED5 OF ANNUAL CRASH PEOPLE HARM3 Prop. HARM Prop. Harm
INJURY INJURED1 TYPE2 INJURED ($million) ($million) ($million) Fatal-front 0.343 469 703 0.325 229 0.388 88.6 Fatal-side 0.276 377 566 0.325 184 0.219 40.4 Fatal-roll 0.118 161 242 0.325 79 0.406 31.9 Fatal-rear 0.010 14 20 0.325 7 0.338 2.2 Fatal-other 0.254 347 521 0.325 169 0.338 57.2 Total-Fatal 1368 1368 2052 667 220.9 Severe-front 0.424 6583 2140 0.185 396 0.388 153.5 Severe-side 0.207 3224 1048 0.185 194 0.219 42.6 Severe-roll 0.077 1201 390 0.185 72 0.406 29.3 Severe-rear 0.084 1301 423 0.185 78 0.338 26.4 Severe-other 0.208 3230 1050 0.185 194 0.338 65.64 Total-Severe 15539 15539 5050 934 317.6 Minor-front 0.412 62206 722 0.086 62 0.388 24.1 Minor-side 0.289 43600 506 0.086 44 0.219 9.5 Minor-roll 0.026 3997 46 0.086 4 0.406 1.6 Minor-rear 0.198 29832 346 0.086 30 0.338 10.06 Minor-other 0.074 11182 130 0.086 11 0.338 3.7 Total-Minor 150818 150818 1751 150 49.1 TOTAL HARM
8853 1752 587.21
1. From ATSB 2002; 1996 data 2. Proportion of injured by crash type derived from Victoria and Queensland casualty crashes, 1997-1998 3. Cost of injury in 1996A$ for fatal = $1,500,000, Severe = $325,000 and Minor = $11,611 (BTE, 2000) 4. Proportion unrestrained derived from ATSB fatal files, Fildes et al (1991) & MUARC analysis of tow-away crashes 5. Proportion of HARM likely saved (assuming 100% effectiveness for the reminder system) derived from NASS CDS 1993
– 2000 in-depth crash data for airbag crashes (NHTSA Web site, see Appendix A for detail)

BENEFITS OF SEATBELT REMINDER SYSTEMS 13
3.1.2 Relevance of Figures
In compiling these national statistics, a number of assumptions needed to be made and these are detailed above. It would have been preferable if injury patterns by crash type and the proportion of unrestrained occupants were recorded nationally. Unfortunately, these data were unavailable and the assumptions listed above provided the best estimates of these figures available at this time.
It is important in determining the proportion of HARM likely to be saved by increasing seat belt wearing to use data based on airbag crashes as airbags provide a restraint benefit in themselves (most modern cars sold in Australia are fitted with at least a driver airbag). Data available in Australia was not comprehensive enough to derive these proportions from airbag deployed crash data and so it was necessary to refer to other overseas figures. While it is recognised that U.S. airbags differ from those available in Australia given their primary restraint nature, NASS is a comprehensive in-depth database where seat belt wearing can be confidently determined. Thus, comparing the difference in HARM between cases with and without a seat belt being worn provided the proportions likely to be saved by increasing seat belt wearing to 100%.
3.2 INJURY REDUCTIONS In computing the seat belt warning system benefit in the earlier report, a number of assumptions were made using whatever available real world and test data were available at the time to gauge injury mitigation expected from these units. In addition, an international panel of research, comprised of vehicle manufacture and government specialists was formed to assist with estimating the expected injury reduction outcome (MUARC, 1992). The assumptions forming the basis for calculating the HARM benefits this time around are outlined in detail below.
3.2.1 Seat Belt Reminders As noted earlier in the literature review, there are a number of options available for a seat belt reminder system, varying from a simple consistent flashing light and tone right up to an engine interlock device for persistent non-users. The automobile industry is supportive of a simple system with a focus on reminding those who forget to buckle up, rather than a full interlock system. Euro-NCAP, too, have accepted this philosophy in awarding bonus points to those who include such simple systems in their vehicles.
While there is some conjecture over the level of “aggressivity” required to achieve sizeable improvements in seat belt wearing in Australia with such a high wearing rate already, the findings of Harrison et al (2001) suggests that the biggest problem is forgetting, not intentionally deciding not to buckle up. Hence, for the purpose of this analysis, only three types of systems have been embraced for the BCR calculations, comprising:
• SIMPLE 1 – a simple flashing light and tone of 65dB along the lines of that specified by Euro-NCAP. As noted in the section on equipment costs, this would require a buckle switch (and wiring harness) to detect non-compliance and an additional sound generator to produce the supporting tone for the driver with an additional simple presence detector switch on all other seating positions. It is assumed that this device would run continuously once initiated until the buckle is installed or the ignition is switched off.
• SIMPLE 2 – as well as the above, this device includes a speed monitor that intensifies the flashing rate and tone as the vehicle’s speed increases. This would require an additional monitoring device of the vehicle’s speed to initiate the speed intensifier.

BENEFITS OF SEATBELT REMINDER SYSTEMS 14
• COMPLEX – this device has all the same characteristics as the SIMPLE 2 device, but also includes a more sophisticated belt wearing sensor system (includes a reel-out sensor on the inertia-reel) and an “external second phase intervention” (e.g.; the hazard lights flash after either a set period of non-compliance and/or a threshold speed level is reached).
These three options range in their degree of intervention from just a reminder to something a little more aggressive for stubborn motorists. They were seen to be reasonable in terms of cost and likely acceptability by the industry and the public. It is accepted that they are not exhaustive – it would be possible to outline many other alternative strategies – but they do represent a variety of levels of intervention sufficient to generate different levels of compliance among users.
3.2.2 Effectiveness of these Units The only reliable study of likely effectiveness of a seat belt reminder system in increased seat belt wearing was that undertaken by the Insurance Institute of Highway Safety (Williams 2002) on increased compliance with the Ford – BeltMinderTM system. He reported a 17% reduction in belt non-wearing with this system, based on observational recordings of wearing behaviour in the U.S. Other studies purport to show effectiveness figures for seat belt systems but in many cases are best estimates, based on surveys, focus groups, etc., which may or may not translate into practice with on-road experience.
On the basis of Williams (2002), the following effectiveness rates were assumed for Australia for the three reminder system options outlined above. It should be noted that the figures listed in Table 3.2 below are more conservative than the Ford experience, given that Australia has such a high seat belt wearing rate in the front seat already and the expected increase in seat belt wearing figures are modest indeed.
Table 3.2 – Increases in seat belt wearing rates expected for the three device options.
Reminder Option Reductions in Unbelted Increased Wearing Rates1
SIMPLE 1 10% 95.5%
SIMPLE 2 20% 96%
COMPLEX (30) 30% 96.5%
COMPLEX (40) 40% 97%
1. Assumes a baseline-wearing rate of 95 percent prior to implementation.
Two figures of effectiveness were assumed for the COMPLEX reminder system. In the previous study (MUARC 1992), a 40% effectiveness rate was assumed for the complex system. While this device will be difficult to ignore, nevertheless, its effectiveness will be dependent ultimately upon the rate of those who will comply. It is unlikely that the majority of non-wearers in Australia forget to put on their belts, and a “hard-core” of non-wearers probably does exist that will go to any length not to wear their seat belt. There is little evidence, however, of their proportion among the unrestrained population and so the benefits of the complex unit will be calculated for both 30% and 40% effectiveness rates.
3.2.3 Implementation Strategy
Previous evidence suggested three different implementation strategies would be possible for introducing seat belt reminder systems, namely driver-only, front seat occupants only or all

BENEFITS OF SEATBELT REMINDER SYSTEMS 15
seating positions. This could constitute a phased program of implementation for mandating a seat belt reminder system in a typical two-row passenger car based on high to low exposure. For instance, there is always a driver in a vehicle (100% exposure), a front seat passenger in around 20–25% and a rear seat passenger in 10–12% of frontal crashes (Fildes et al, 1991). Such a program would yield different BCRs and have differential cost implications for the manufacturers.
Euro-NCAP have acknowledged the possibility of such a staged implementation program for seat belt reminder systems by allocating a three-tiered system of allocating seat belt reminder bonus points; 1 point for the driver position; another point for the front passenger, and a third point for all seating positions in the rear. It could be argued that a more differential system could be employed to take account of the HARM benefits across these three seating positions.
3.3 ANNUAL HARM SAVED BY SEATING POSITION
The annual HARM saved from the mandatory introduction of seat belt reminders in all new passenger cars sold in Australia can now be calculated for the three implementation strategies outlined above. The total HARM that could be saved by the use of a seat belt reminder system for all non-users was estimated to be $587 million in Table 3.1 above. The breakdown of HARM saved by seating position assuming 100% effectiveness of the reminder system is shown in the third column of Table 3.4 below. The proportion of HARM sustained by seating position was determined from Australian in-depth data collected at the Monash University Accident Research Centre over recent years.
The amount of HARM saved each year, however, will depend upon the effectiveness of the seat belt reminder device. The three design options outlined in Table 3.2 assumed different levels of effectiveness from 10% to 40% depending on the level of “aggressiveness” of the device. Annual HARM saved for each device assuming these levels of effectiveness are also shown in Table 3.4 below.
Table 3.3 – Likely HARM saved by seating position in Australia.
Seating Position Percent HARM Annual HARM Saved Effectiveness
(100% effectiveness) 10% 20% 30% 40%
Driver only 67.6% $397million $39.7m $79.4m $119.1m $158.8m
Front seat passenger 19.6% $115million $11.5m $23.0m $34.5m $46.0m
Rear occupants 12.8% $75million $7.5m $15.0m $22.5m $30.1m
Total HARM $587million $58.7m $117.4m $176.2m $234.9m
3.3.1 Summary In summary, the estimated annual HARM saved for the three design options of seat belt reminders ranges from $40 million to $235 million, depending on the level of effectiveness of the device in improving seat belt wearing, and the range of positions covered.

BENEFITS OF SEATBELT REMINDER SYSTEMS 16

BENEFITS OF SEATBELT REMINDER SYSTEMS 17
CHAPTER 4 UNIT HARM AND COSTS 4.1 CALCULATING INDIVIDUAL VEHICLE SAVINGS
The annual HARM saved by the requirement for manufacturers to fit seat belt reminders assumes that all vehicles on the road instantaneously meet this standard. In fact, of course, it would take many years for this situation to arise, as approximately 20% of cars involved in crashes are more than 15 years old and there are a few vehicles aged 25 years or more still operating in this country. In establishing benefit-cost relationships, it is necessary to convert annual HARM saved (a community benefit) into a saving spread across the life of an individual vehicle to compare this with the cost of having to meet this new requirement. This is achieved by estimating the average risk of a vehicle being involved in a crash for each year of its life and multiplying that risk by the HARM saved per crash. The average HARM savings can then be summed across the life of the vehicle. There are alternative methods for making these estimates, each with its particular strengths and weaknesses.
4.1.1 Immediate Past History
In these calculations it was assumed that the immediate past history of crash risk, crashworthiness, crash patterns and salvage rates would continue and therefore be the best predictor of future crash risk and salvage rates. This eliminates the need for tenuous subjective predictions and has credibility in that the past is often the best predictor of the future in dealing with human behaviour. It does assume of course that the crashworthiness performance of the vehicle fleet will not alter dramatically; an assumption that has some credibility based on recent evidence (Newstead, Cameron, Watson, & Delaney, 2003) if attention is confined to the last 15 years.
The method, fully detailed in Appendix B, assumes that the risk of a new car being involved in a casualty crash during, say, the third year of its life, is the same as the risk of a car which was first registered three years ago having a crash this year. To calculate this yearly risk, the number of crashes for three-year-old cars with an occupant casualty is divided by the total number of new cars sold three years ago. The risk of a casualty crash across the lifetime of a car then is the sum of each year's crash experience divided by the number of new cars sold. The process of focussing on each crash year and the number of vehicle sales each year takes account of vehicles that exit from the vehicle fleet through wreckage, wear and tear, etc., as well as the lower distances travelled by older cars and the different characteristics of those who drive older cars.
The next step is to assume that the proportion of total HARM saved for all cars of a certain age group is equal to the proportion of total relevant casualty crashes involving that age group. The formula used helps explain this: H3 F3 F3 –– = –– or H3 = –– x H H F F
where H3 = HARM reduction for all cars in their third year H = total annual HARM reduction for all cars F3 = number of cars involved in casualty crashes in their third year F = total number of cars involved in casualty crashes in one year

BENEFITS OF SEATBELT REMINDER SYSTEMS 18
The average HARM reduction for any one car in its third year is calculated by dividing H3 by the number of new cars registered three years ago. The total benefit for a single car from the seat belt reminder is then obtained by adding up the HARM reductions for each year of its life and discounting these benefits back to the first year. This is explained in more detail in Appendix B.
4.1.2 Discounting Procedure & Rate
When predicting the likely benefits of a new countermeasure, it is normal to discount future benefits back to the present so that they can be compared with present day costs of the measure. The discounting procedure used in these calculations first takes the annual HARM saved for the seat belt reminder and attributes this (discounted) to one car over its expected lifetime. The selection of an appropriate discount rate is really a matter of opinion (there is no magic number). A smaller discount rate gives greater weight to future benefits and is thus less conservative.
In the past, the Commonwealth Government used 7% as an appropriate rate, while some state governments, however, have used a range of different values (the Victorian Government, for instance, has used 4%). In its recent evaluation of the national Black Spots program, the Bureau of Transport and Regional Economics (BTRE, 2001) argued that a 5% discount rate was most meaningful in that context, although their analysis included other discount rates as well. The Commonwealth Department of Finance (1991) recommended that where possible, sensitivity analysis be undertaken involving a range of different discount rates.
It is acknowledged that the choice of the discount rate has a marked effect on the calculation; not only does it influence the BCR, but also the cost of death or serious injury. In this report, seat belt reminder options were calculated at 4%, 5% and 7% to gauge their likely unit HARM benefits. It should be noted, though, that the Bureau of Transport and Regional Economics (BTRE, 2001) used a 4% discount rate when determining the cost of injury for each injury severity level used here.
4.1.3 Period over which the Benefits are calculated
Another issue involves deciding what constitutes the life period of a vehicle over which the benefits are to be claimed. Tables B1 to B3 in Appendix B show that more than 97% of casualty crashes involve vehicles 25 years old or less, which seems to be a reasonable period over which to calculate the benefits. On the other hand, it has been argued that it is more reasonable to use a shorter period of say 15 years (which accounts for around 75% of casualty crashes) particularly as repairs and replacement costs for the safety features have been ignored in determining their benefits. Accordingly, benefits of seat belt reminder devices have been calculated over both a 15 and 25-year life period. Based on the results in Appendix B, the multipliers used for assessing the unit HARM benefits of the seat belt reminder device are listed in Table 4.1.
It is important to note that the crash data used to establish the proportion of vehicles involved in crashes by vehicle age for the year 2000 was reported casualty crash data for Victoria, NSW, and Queensland (Newstead, et al., 2003). While the ideal would be to examine all crashes in Australia by year of vehicle manufacture, crash data from other States and Territories was not readily available. The assumption, therefore, is that crash involvement by vehicle age and fleet age distribution in Victoria, NSW and Queensland is indicative for Australia as a whole. Within the multiplier calculation, New Motor Vehicle Registrations was

BENEFITS OF SEATBELT REMINDER SYSTEMS 19
used for all of Australia. The reader is referred to Appendix B for greater detail on calculating the multiplier used in calculating Unit HARM.
Table 4.1 – Multipliers used for calculating Unit HARM. 15 year Device Life 25 year Device Life
4% discount rate 0.5769 0.6829
5% discount rate 0.5396 0.6283
7% discount rate 0.4755 0.5380
4.1.4 Unit HARM Values Unit HARM refers to the benefit of these devices across the life of a single vehicle. Table 4.2 shows the unit HARM values derived by applying the multipliers shown above to the Annual HARM values in Table 3.4 for the various design options and expected effectiveness rates and implementation strategies.
Table 4.2 –Unit HARM benefits computed for the three device options (A$).
Device Strategy 15 year fleet life 25 year fleet life
4% 5% 7% 4% 5% 7%
Driver only $38.89 $36.37 $32.05 $46.03 $42.35 $36.27
Front seat passengers $50.16 $46.92 $41.35 $59.38 $54.63 $46.78
SIMPLE-1
All occupants $57.53 $53.81 $47.42 $68.10 $62.65 $53.65
Driver only $77.78 $72.75 $64.11 $92.07 $84.71 $72.53
Front seat passengers $100.33 $93.84 $82.69 $118.76 $109.27 $93.56
SIMPLE-2
All occupants $115.05 $107.61 $94.83 $136.19 $125.30 $107.30
Driver only $116.66 $109.12 $96.16 $138.10 $127.06 $108.80
Front seat passengers $150.49 $140.76 $124.04 $178.14 $163.90 $140.34
COMPLEX
All occupants $172.58 $161.42 $142.25 $204.29 $187.96 $160.94
Driver only $155.55 $145.50 $128.21 $184.13 $169.41 $145.06
Front seat passengers $200.65 $187.68 $165.39 $237.54 $218.53 $187.12
COMPLEX-40%
All occupants $230.11 $215.23 $189.66 $272.39 $250.61 $214.59
4.2 SEAT BELT REMINDER COSTS
The three design options for the seat belt reminder were outlined earlier in Section 3.2.1. In arriving at the estimated total costs for the various seat belt reminder designs, unit costs were sought from a number of sources both in Australia and overseas. The authors are grateful to the Autoliv organisation in Sweden and Australia for providing information on how to achieve these performance criteria and the likely costs of parts necessary.
Table 4.3 shows the individual item and total costs arrived at from the information provided. As these cost estimates were compiled from individual component values, they are likely to be over-estimates once the devices become production line equipment. Nevertheless, without more extensive production costs, they provide sufficient estimated Benefit-Cost-Ratios, albeit conservative estimates.

BENEFITS OF SEATBELT REMINDER SYSTEMS 20
Table 4.3 – Cost build-ups for the three seat belt reminder systems. Seatbelt
Reminder option
Seating Position
Buckle switch + wiring
harness ($10)
Presence detector1
($5)
Sensor on
Retractor ($10)
Wiring to speedom
eter ($20)
Wiring to Hazards
($5)
Best Estimate
Retail Price
Economic Cost
Estimate2
SIMPLE1 Driver only $10 - - - - $10 $9.09 Front seat
occupants $20 $5 - - - $25 $22.73
All occupants $50 $20 - - - $70 $63.64
SIMPLE2 Driver only $10 - $10 $20 - $40 $36.36 Front seat
occupants $20 $5 $20 $20 - $65 $59.09
All occupants $50 $20 $50 $20 - $140 $127.27
COMPLEX Driver only $10 - $10 $20 $5 $45 $40.91 Front seat
occupants $20 $5 $20 $20 $10 $75 $68.18
All occupants $50 $20 $50 $20 $25 $165 $150
1. It is not necessary to install a presence detector for the driver, as there will be a driver if the car is moving. 2. Economic cost equals the best estimate retail price minus GST.
4.3 BENEFIT-COST-RATIOS
The Benefit-Cost Ratios (BCRs) for the range of the three seat belt reminder options are shown in Tables 4.4 to 4.9 below. The highest BCRs were obtained for the 4% discount rate and a 25-year fleet life calculation in Table 4.4, while the lowest BCRs were for the 7% discount rate with a 15-year fleet life calculation (Table 4.9). The highest Benefit-Cost-Ratio was 5.1:1 for a driver-only seat belt reminder system of simple design (with a modest 10% effectiveness rate). Across the various driver only options, the BCRs ranged from 5.1:1 to 1.8:1 depending on the design option, the estimated effectiveness rate, and the discount rate applied.
For both driver and front passenger, the level of HARM reduction increased by around 29%, although the BCRs were less than for the driver-only option due to the added cost involved. They ranged from 3.5:1 to 1.4:1 across the various design options, effectiveness figures and discount rates. Interestingly, though, the best option for front occupants is for a more complex unit with 40% effectiveness, in contrast to the driver-only findings.
For all occupants, the BCRs were only marginal or not cost-beneficial (1.8:1 at best to 0.7:1 at worst) given the greater increase in cost across the five seating positions for only a marginal increase in HARM reduction. Again the sophisticated complex system (40% effectiveness) was superior here over the more simple designs.
The total HARM savings to the community were consistently greater for the complex design units with their greater expected effectiveness rates and for the most part, higher BCRs. It would be worth monitoring if any manufacturer was prepared to introduce such a unit, as this concept was considered likely to yield the highest level of compliance for the Australian market and is obviously more attractive in terms of maximum trauma reduction.

BENEFITS OF SEATBELT REMINDER SYSTEMS 21
Table 4.4 – Unit HARM benefits and costs for the three seat belt reminder systems used in this analysis based on a 25-year fleet life and a 4% discount rate.
Seating Position SIMPLE 1 SIMPLE 2 COMPLEX COMPLEX 40%
Driver only
Unit HARM Benefit Economic Cost Benefit-Cost-Ratio Annual HARM Saved
$46.03 $9.09 5.1:1
0.45%
$92.07 $36.36 2.5:1
0.90%
$138.10 $40.91 3.4:1
1.35%
$184.13 $40.91 4.5:1
1.79%
Front seat occupants
Unit HARM Benefit Economic Cost Benefit-Cost-Ratio Annual HARM Saved
$59.38 $22.73 2.6:1
0.58%
$118.76 $59.09 2.0:1
1.16%
$178.14 $68.18 2.6:1
1.74%
$237.52 $68.18 3.5:1
2.31%
All occupants
Unit HARM Benefit Economic Cost Benefit-Cost-Ratio Annual HARM Saved
$68.10 $63.64 1.1:1
0.66%
$136.19 $127.27
1.1:1 1.33%
$204.29 $150 1.4:1
1.99%
$272.39 $150 1.8:1
2.65%
Table 4.5 – Unit HARM benefits and costs for the three seat belt reminder systems used
in this analysis based on a 15-year fleet life and a 4% discount rate.
Seating Position SIMPLE 1 SIMPLE 2 COMPLEX COMPLEX 40%
Driver only
Unit HARM Benefit Economic Cost Benefit-Cost-Ratio Annual HARM Saved
$38.89 $9.09 4.3:1
0.45%
$77.78 $36.36 2.1:1
0.90%
$116.66 $40.91 2.9:1
1.35%
$155.55 $40.91 3.8:1
1.79%
Front seat occupants
Unit HARM Benefit Economic Cost Benefit-Cost-Ratio Annual HARM Saved
$50.16 $22.73 2.2:1
0.58%
$100.33 $59.09 1.7:1
1.16%
$150.49 $68.18 2.2:1
1.74%
$200.65 $68.18 2.9:1
2.31%
All occupants
Unit HARM Benefit Economic Cost Benefit-Cost-Ratio Annual HARM Saved
$57.53 $63.64 0.9:1
0.66%
$115.05 $127.27
0.9:1 1.33%
$172.58 $150.00
1.2:1 1.99%
$230.11 $150.00
1.5:1 2.65%

BENEFITS OF SEATBELT REMINDER SYSTEMS 22
Table 4.6 – Unit HARM benefits and costs for the three seat belt reminder systems used in this analysis based on a 25-year fleet life and a 5% discount rate.
Seating Position SIMPLE 1 SIMPLE 2 COMPLEX COMPLEX 40%
Driver only
Unit HARM Benefit Economic Cost Benefit-Cost-Ratio Annual HARM Saved
$42.35 $9.09 4.7:1
0.45%
$84.71 $36.36 2.3:1
0.90%
$127.06 $40.91 3.1:1
1.35%
$169.41 $40.91 4.1:1
1.79%
Front seat occupants
Unit HARM Benefit Economic Cost Benefit-Cost-Ratio Annual HARM Saved
$54.63 $22.73 2.4:1
0.58%
$109.27 $59.09 1.8:1
1.16%
$163.90 $68.18 2.4:1
1.74%
$218.53 $68.18 3.2:1
2.31%
All occupants
Unit HARM Benefit Economic Cost Benefit-Cost-Ratio Annual HARM Saved
$62.65 $63.64 1.0:1
0.66%
$125.30 $127.27
1.0:1 1.33%
$187.96 $150 1.3:1
1.99%
$250.61 $150 1.7:1
2.65%
Table 4.7 – Unit HARM benefits and costs for the three seat belt reminder systems used
in this analysis based on a 15-year fleet life and a 5% discount rate.
Seating Position SIMPLE 1 SIMPLE 2 COMPLEX COMPLEX 40%
Driver only
Unit HARM Benefit Economic Cost Benefit-Cost-Ratio Annual HARM Saved
$36.37 $9.09 4.0:1
0.45%
$72.75 $36.36 2.0:1 0.9%
$109.12 $40.91 2.7:1
1.35%
$145.50 $40.91 3.6:1
1.79%
Front seat occupants
Unit HARM Benefit Economic Cost Benefit-Cost-Ratio Annual HARM Saved
$46.92 $22.73 2.1:1
0.58%
$93.84 $59.09 1.6:1
1.16%
$140.76 $68.18 2.1:1
1.74%
$187.68 $68.18 2.8:1
2.31%
All occupants
Unit HARM Benefit Economic Cost Benefit-Cost-Ratio Annual HARM Saved
$53.81 $63.64 0.8:1
0.66%
$107.61 $127.27
0.8:1 1.33%
$161.42 $150.00
1.1:1 1.99%
$215.23 $150.00
1.4:1 2.65%

BENEFITS OF SEATBELT REMINDER SYSTEMS 23
Table 4.8 – Unit HARM benefits and costs for the three seat belt reminder systems used in this analysis based on a 25-year fleet life and a 7% discount rate.
Seating Position SIMPLE 1 SIMPLE 2 COMPLEX COMPLEX 40%
Driver only
Unit HARM Benefit Economic Cost Benefit-Cost-Ratio Annual HARM Saved
$36.27 $9.09 4.0:1
0.45%
$72.53 $36.36 2.0:1
0.90%
$108.80 $40.91 2.7:1
1.35%
$145.06 $40.91 3.5:1
1.79%
Front seat occupants
Unit HARM Benefit Economic Cost Benefit-Cost-Ratio Annual HARM Saved
$46.78 $22.73 2.1:1
0.58%
$93.56 $59.09 1.6:1
1.16%
$140.34 $68.18 2.1:1
1.74%
$187.12 $68.18 2.7:1
2.31%
All occupants
Unit HARM Benefit Economic Cost Benefit-Cost-Ratio Annual HARM Saved
$53.65 $63.64 0.8:1
0.66%
$107.30 $127.27
0.8:1 1.33%
$160.94 $150 1.1:1
1.99%
$214.59 $150 1.4:1
2.65%
Table 4.9 – Unit HARM benefits and costs for the three seat belt reminder systems used in this analysis based on a 15-year fleet life and a 7% discount rate.
Seating Position SIMPLE 1 SIMPLE 2 COMPLEX COMPLEX 40%
Driver only
Unit HARM Benefit Economic Cost Benefit-Cost-Ratio Annual HARM Saved
$32.05 $9.09 3.5:1
0.45%
$64.11 $36.36 1.8:1 0.9%
$96.16 $40.91 2.4:1
1.35%
$128.21 $40.91 3.1:1
1.79%
Front seat occupants
Unit HARM Benefit Economic Cost Benefit-Cost-Ratio Annual HARM Saved
$41.35 $22.73 1.8:1
0.58%
$82.69 $59.09 1.4:1
1.16%
$124.04 $68.18 1.8:1
1.74%
$165.39 $68.18 2.4:1
2.31%
All occupants
Unit HARM Benefit Economic Cost Benefit-Cost-Ratio Annual HARM Saved
$47.42 $63.64 0.7:1
0.66%
$94.83 $127.27
0.7:1 1.33%
$142.25 $150.00
0.9:1 1.99%
$189.66 $150.00
1.3:1 2.65%

BENEFITS OF SEATBELT REMINDER SYSTEMS 24

BENEFITS OF SEATBELT REMINDER SYSTEMS 25
CHAPTER 5 GENERAL DISCUSSION This study set out to examine the benefits and costs of a more aggressive seat belt reminder system than that specified in Australian Design Rule (ADR) 69 which is a timed warning light displayed to the driver. It has been argued that such a warning is lost among the various warning lights that display when the ignition is activated and that a more persistent warning would lead to improvements in seat belt wearing in Australia. A more “aggressive” reminder system therefore would seem warranted to help further reduce road trauma in Australia.
5.1 BENEFITS AND COSTS
The Benefit-Cost-Ratios calculated for the various more aggressive design system options and implementation strategies are impressive. Tables 4.4 through to 4.9 from the previous Chapter showed BCRs that ranged from around 5.1:1 to 0.7:1 depending on which seating positions were included, the complexity of the device, the discount rate for future benefits and the expected life of the vehicle fleet.
The best BCR was estimated for a simple device (with 10% effectiveness) for the driver only while the complex unit with 40% effectiveness yielded a similar BCR but with a much higher 1.79% saving in annual HARM. When a front seat passenger was included, the BCR reduced by between 20 and 49 percent from the driver-only figures. This resulted from the added cost of the front passenger unit but with only a marginal 29% added HARM benefit. Similarly, when expanding the seat belt reminder to all seating positions in a normal passenger car, the BCRs further reduced to values close to break even (although, still cost-beneficial for the more complex units).
While the BCR for driver-only is greater than for both front seating positions for all devices, the latter offers an additional 29% reduction in total occupant HARM and still impressive BCRs. Furthermore, Net Present Values (NPV, Unit HARM benefit minus economic cost) are much greater for both-front-seat occupants installations. While the benefits in terms of HARM reduction and NPV are even greater for devices fitted in all seating positions, the BCRs are only marginal, apart from those for the complex device at 40% effectiveness. On this basis, it could be concluded that a device fitted for both front seat occupants is likely to yield high overall benefits in HARM reduction and sound BCRs and would seem to be a preferred option for Australia.
5.1.1 Effectiveness of These Devices
These calculations are very much dependent upon the effectiveness of the seat belt reminder in generating greater compliance. The figures of likely effectiveness were established based on available U.S. evidence (Williams 2002), varying from 10% for a simple continuous flashing light and auditory signal, up to 40% for a more complex unit (MUARC 1992). This latter device monitors seat belt wearing more accurately and has a two-phase operation, where the second phase intervention aims to embarrass the occupant through a visual external display. It is intended to gain greater compliance among those who steadfastly refuse to buckle up. Even so, two values of effectiveness were computed for the complex device, based on a previous estimate in MUARC (1992) as well as a more conservative estimate (40% and 30%).
The effectiveness values were “best estimates” based on the available literature (MUARC 1992: Williams, 2002) and downgraded in light of the high level of seat belt wearing that

BENEFITS OF SEATBELT REMINDER SYSTEMS 26
exists in Australia. Of course, it could be argued that even these modest levels may be difficult to achieve given the high levels of seat belt wearing in this country. However, figures from Europe where seat belt wearing is also quite high claim even greater benefits than those found by Williams in the U.S. (Bylund & Björnstig, 1996; Turbell & Larsson, 1998). On this basis, the figures used here would seem to be very conservative indeed and may well be underestimates of the likely effectiveness of the devices specified. If this is so, then the actual HARM reduction benefits for Australia would be even higher than those stated above.
5.1.2 Future Savings and Life of the Device
The Bureau of Transport and Regional Economics (BTRE, 2001) argued that the discount rate for future savings for a particular project should reflect the opportunity cost of using resources in that project rather than for an alternative means of obtaining equivalent benefits. They noted that the real cost of borrowing funds for the Federal Government during the time period when black-spot treatment expenditure occurred was around 5%. They conducted an evaluation of the effects of different discount rates on future black-spot programs at four varying rates and claimed that 5% generated the most meaningful results for the reasons discussed above. They also noted, however, that during the period of the previous program, the actual 10-year bond rate was between 3 and 4% and even less than the 5% they settled on. While it may be somewhat presumptuous to use government discount rates when discounting for automotive applications, it still represents the best advice based on current bond rates and market economics. Hence, the use of figures computed for a 5% discount rate would still seem to be appropriate here.
The average age of the Australian fleet is increasing. The current age is around 10.5 years and the distribution is slightly skewed towards older vehicles (ABS, 2001b). The crash distribution in Tables B.1 to B.3 (Appendix B) shows that more than 97% of the casualty crashes involved vehicles 25 years or less and approximately 75% of casualty crashes were for vehicles aged 15 years or less. The consequence of using a shorter period over which to calculate the benefits of the device for the BCR computations (see Appendix A) is a more conservative estimate of unit HARM benefit compared to a device life of 25 years. It would seem that the use of a 15-year device life is appropriate for the computations although perhaps somewhat conservative.
5.1.3 Costs of the Devices The costs established for the three design options were based on advice from equipment suppliers and current available prices of equipment. These prices were again “best estimates” of current technology likely to be required to meet the outcomes sought. It is likely though that when setting up to meet these criteria, manufacturers will find efficiencies and production savings to minimise costs even further. As noted earlier from one international vehicle manufacturer, if a vehicle is equipped with “intelligent airbag systems”, there are switches in the belt buckles and passenger detection systems fitted already that could be used for reminder systems at no cost. No allowance was included for these savings; hence the BCRs are again likely to be somewhat conservative.
5.2 STANDARD EQUIPMENT AND VISIBILITY OF THE DEVICE
The project objectives specified a device that would be standard equipment on all new passenger cars and would not be visible to those who normally wear their seat belts. The Benefit-Cost-Ratio calculations assume that the device is fitted to all new passenger cars as

BENEFITS OF SEATBELT REMINDER SYSTEMS 27
standard equipment. If optional, the BCRs would be discounted considerably from what is calculated here. The design options outlined were based on the assumption that a person who normally wears a seat belt would be ignorant of the presence of the reminder device. The SIMPLE options are based on the premise of providing a “reminder” for those who forget to buckle up and so would be effective in generating higher seat belt wearing amongst this group. Some benefit would also be gained from those who do not buckle up on short trips to local destinations and those who only put on their belts outside urban regions.
On the other hand, the COMPLEX device in the early phase would act as a reminder for the forgetful but would also offer some benefit for the hard-core group of non-wearers by embarrassing them into buckling up when they persist in overlooking the reminder. This option was included as Australia has such a high seat belt wearing rate and there is concern that the forgetful users may be only a small proportion of non-users in this country. There is an opinion, especially in Europe, that seat belt reminders should only be simple reminders and not “interlock devices”, given the previous bad experience seen in the U.S. during the seventies. The complex device proposed here stops well short of being an interlock as the car would be quite driveable, even with the hazard lights flashing. However, it would be obvious to other motorists and the authorities that someone in the car is not wearing their seat belt so that appropriate action could be taken to either avoid these motorists or correct this situation through police enforcement.
5.3 EURO-NCAP AND HARMONISATION
Euro-NCAP are planning on providing added bonus points to manufacturers who fit a seat belt reminder to their cars as part of their assessment of a vehicle’s crashworthiness. Their recommended design specification includes a 65dB auditory signal and a visual signal clearly visible to the driver that should be active the entire time that seat belts on an occupied seat are not on during a journey. This equates to what is principally outlined in the simple and simple-2 systems in this study. Rewards will include a one-point bonus for a driver-only device, another point for both driver and front passenger and a third for devices fitted to all seating positions.
One manufacturer argued that any proposal for a seat belt reminder system in Australia should harmonise with that proposed by Euro-NCAP. While there is great merit in Australia harmonising with overseas requirements generally (given our small share of the international market), it is not clear what the European Parliament’s position is on seat belt reminder systems (Euro-NCAP is not the government regulator of vehicle safety in Europe). It could be argued that as seat belt reminders constitute an add-on feature which do not require major re-engineering of a vehicle, this is an opportunity for Australia to lead the way in terms of what will provide greatest benefits to the Australian and international community. It is important to point out that this would not be the first time that Australia has opted for a non-international standard when compliance did not involve manufacturers undertaking major bodywork changes. ADR 69 and ADR 72 are non-harmonised with the U.S. equivalents, as they require the tests to be conducted with belted test dummies. Australia has played a leading role in the fitting and wearing of seat belt restraints internationally. It was the first country to introduce both mandatory seat belt fitting and wearing and the first to specify three-point belts in the rear and centre-rear seating positions. It is reasonable to argue that ADRs as a whole should do everything possible to ensure that seat belts are used. Hence, adopting a more demanding seat belt reminder system in passenger vehicles would make the real world outcome more consistent with the assumptions behind the Australian Design Rule

BENEFITS OF SEATBELT REMINDER SYSTEMS 28
system. We do not see that this would present any major difficulties or problems with international harmonisation efforts.
5.4 CONCLUSION
The findings from this study show that a regulation requiring manufacturers to provide a more “aggressive” seat belt reminder system in Australian passenger cars is appropriate for Australia. The BCRs calculated for either a simple or a complex device would be cost-beneficial. The preferred strategy would be for the device to be fitted for both front seat occupants and would yield reductions in total occupant HARM each year of up to 2.65%. It is not clear if a simple device (consistent flashing light and warning tone) would suffice given the high level of seat belt wearing that exists already in Australia and hence a more aggressive unit that embarrasses non-wearers may be required.
The current regulation for a five-second reminder light is clearly not adequate in reminding motorists to buckle up and there are moves afoot in Europe and the U.S. to address this. Vehicle manufacturers are generally supportive of these attempts, although they would like to see some international harmonisation of requirements. It could be argued, though, that given that these devices are a simple add-on feature, harmonisation is not really a significant issue, and that Australia is well placed to lead the world in providing a device that will reduce trauma on our roads.

BENEFITS OF SEATBELT REMINDER SYSTEMS 29
REFERENCES ABS (1976). Motor vehicle registrations, Australia, December Quarter 1975, Cat.No.9303.0.
Australian Bureau of Statistics.
ABS (1979). Motor vehicle registrations, Australia, December Quarter 1978, Cat.No.9303.0. Australian Bureau of Statistics.
ABS (1980). Motor vehicle registrations, Australia, December Quarter 1979, Cat.No.9303.0. Australian Bureau of Statistics.
ABS (1981). Motor vehicle registrations, Australia, December Quarter 1980, Cat.No.9303.0. Australian Bureau of Statistics.
ABS (1982). Motor vehicle registrations, Australia, December Quarter 1981, Cat.No.9303.0. Australian Bureau of Statistics.
ABS (1983). Motor vehicle registrations, Australia, December Quarter 1982, Cat.No.9303.0. Australian Bureau of Statistics.
ABS (1984). Motor vehicle registrations, Australia, December Quarter 1983, Cat.No.9303.0. Australian Bureau of Statistics.
ABS (1985). Motor vehicle registrations, Australia, December Quarter 1984, Cat.No.9303.0. Australian Bureau of Statistics.
ABS (1986). Motor vehicle registrations, Australia, December Quarter 1985, Cat.No.9303.0. Australian Bureau of Statistics.
ABS (1987). Motor vehicle registrations, Australia, December Quarter 1986, Cat.No.9303.0. Australian Bureau of Statistics.
ABS (1988). Motor vehicle registrations, Australia, December Quarter 1987, Cat.No.9303.0. Australian Bureau of Statistics.
ABS (1989). Motor vehicle registrations, Australia, December Quarter 1988, Cat.No.9303.0. Australian Bureau of Statistics.
ABS (1990). Motor vehicle registrations, Australia, December Quarter 1989, Cat.No.9303.0. Australian Bureau of Statistics.
ABS (1991). Motor vehicle registrations, Australia, December Quarter 1990, Cat.No.9303.0. Australian Bureau of Statistics.
ABS (1992). Motor vehicle registrations, Australia, December Quarter 1991, Cat.No.9303.0. Australian Bureau of Statistics.
ABS (1993). Motor vehicle registrations, Australia, December Quarter 1992, Cat.No.9303.0 Australian Bureau of Statistics.
ABS (1994). Motor vehicle registrations, Australia, December Quarter 1993, Cat.No.9303.0. Australian Bureau of Statistics.
ABS (1995). Motor vehicle registrations, Australia, December Quarter 1994, Cat.No.9303.0. Australian Bureau of Statistics.
ABS (1996). Motor vehicle registrations, Australia, December 1995 (Prelim), Cat.No.9301.0. Australian Bureau of Statistics.

BENEFITS OF SEATBELT REMINDER SYSTEMS 30
ABS (1997). Motor vehicle registrations, Australia, December 1996 (Prelim), Cat.No.9301.0. Australian Bureau of Statistics.
ABS (1998). Motor vehicle registrations, Australia, December 1997, Cat.No.9303.0.40.003. Australian Bureau of Statistics.
ABS (1999). Motor vehicle registrations, Australia, December 1998, Cat.No.9303.0.40.003. Australian Bureau of Statistics.
ABS (2000). Motor vehicle registrations, Australia, December 1999, Cat.No.9303.0.40.003. Australian Bureau of Statistics.
ABS (2001a). Motor vehicle registrations, Australia, December 2000, Cat.No.9303.0.40.003. Australian Bureau of Statistics.
ABS (2001b). Motor Vehicle Census, Australia, Cat No. 9309.0, Australian Bureau of Statistics
ABS (2002). New Motor Vehicle Registrations, Australia, Peliminary, Glossary, Cat No. 9301.0. http://www.abs.gov.au. Accessed May 2003. Australian Bureau of Statistics.
Anderson, J.A., McLellan, B.A., Pagliarello, G., & Nelson, W.R. (1990). The relative influence of alcohol and seat belt usage on severity of injury from motor vehicle crashes. Journal of Trauma, 30:415-417.
ARUP Transportation Planning (1995). The 1994 Exposure Survey, Final Report. Prepared for VicRoads by ARUP Transportation Planning.
ATSB (2002). Road crash statistics, 1996. http://www.atsb.gov.au/roads/stats/timefatl.cfm Accessed May, 2002.
BTE (2000). Road crash costs in Australia. Canberra: Bureau of Transport Economics.
BTRE (2001). The black-spot program 1996-2002: An evaluation of the first three years, Report 104, Bureau of Transport and Regional Economics, Canberra.
Bylund, P-O. & Björnstig, U. (1996). Low use of safety belts among seriously injured car occupants. Journal of Traffic Medicine, 24, 27-31.
Bylund, P-O. & Björnstig, U. (2001). Use of seat belts in cars with different seat belt reminder systems. A study of injured car drivers. AAAM 45th Annual Conference, September 24-26, 2001.
Dahlstedt, S. Non-users’ motives for not wearing the seat belt. (1999). AAAM 43rd Annual Conference, 20-22 September 1999.
Dahlstedt, S. (2001). Perception of some seat belt reminder systems. The Swedish National Road Administration.
Department of Finance (1991). Handbook of Cost-Benefit Analysis, Australian Government Publishing Service, Canberra.
ETSC (1996). Seat belts and child restraints: Increasing use and optimising performance. European Transport Safety Council, Brussels.
ETSC (In Press). Cost effective EU transport safety measures. European Transport Safety Council, Brussels.
Evans, L. (1996). Seat belt effectiveness: The influence of crash severity and selective recruitment. Accident Analysis Prevention, 28(4), 423-433.

BENEFITS OF SEATBELT REMINDER SYSTEMS 31
Fay, P.A, Sferco, R., & Scott, T. (Unpublished). Smart Reminders – Increased Belt Wearing without Aggravation.
Fildes, B.N., Lane, J.C., Lenard, J., & Vulcan, A.P. (1991). Passenger Cars and Occupant Injury. Monash University Accident Research Centre.
Harrison, W., Senserrick, T., & Tingvall, C. (2000). Development and trial of a method to investigate the acceptability of seat belt reminder systems. Monash University Accident Research Centre.
Malliaris, A.C. & Digges, K. (1987). Crash protection offered by safety belts. 11th International Technical Conference on Research Safety Vehicles, 31, National Highway Traffic Safety Administration, Washington, D.C., USA.
Malliaris, A.C., Hitchcock, R. & Hansen, M. (1985). Harm causation and ranking in car crashes. SAE Transactions 94, 1.496-1.518, SAE paper 850090.
Malliaris, A.C., Hitchcock, R. & Hedlund, J. (1982). A search for priorities in crash protection. SAE International Congress & Exposition, SAE paper 8020242. Society of Automotive Engineers Inc., Warrendale, PA, USA.
McLean, A.J., Aust, H.S., Brewer, N.D., & Sandow, B.L. (1979). Adelaide in-depth accident study – 1975-1979: Part 6; car accidents. NHMRC, Road Accident Research Unit, The University of Adelaide, Adelaide, Australia.
Milne, P.W. (1979). Fitting and wearing of seat belts in Australia: The history of a successful countermeasure. Office of Road Safety, Department of Transport.
Monash University Accident Research Centre (1992). Feasibility of occupant protection countermeasures (CR100) by A.P. Vulcan, B.N. Fildes, M. Cameron, R. Parish, D. Taylor & K. Digges.
Newstead, S.V., Cameron, M.H., Watson, L.M. & Delaney, A.K. (2003). Vehicle Crashworthiness and Aggressivity Ratings and Crashworthiness by Year of Vehicle Manufacture: Victoria and NSW Crashes During 1987-2000, Queensland and Western Australia Crashes During 1991-2000. Report Number 196, Monash University Accident Research Centre.
OECD (1997). The availability of seat belt wearing data in OECD member countries, 1995, IRTAD Special Report. OECD and Department of Transport, Great Britain. http://www.oecd.org/pdf/M000014000/M00014746.pdf.
Regan, M.A., Oxley, J.A., Godley, S.T., & Tingvall, C. (2001). Intelligent Transport Systems: Safety and Human Factors Issues (Report number 01/01). RACV Ltd Melbourne.
Turbell, T., Andersson, T., Kullgren, A., Larsson, P., Lundell, B., Lövsund, P., Nilsson, C., & Tingvall, C. (1996). Optimizing seat belt usage by interlock systems. Fifteenth International Technical Conference on the Enhanced Safety of Vehicles, Melbourne, 13-16 May, 1996.
Turbell, T. & Larsson, P. (1998). A new generation of seat belt reminder systems. Unpublished article.
Ungers, R. The introduction of compulsory seat belt wearing laws in Australia and their effect. Paper presented to the Traffic Safety Conference, Ottawa, 23-24 May, 1974.
VicRoads (1998). Safety first: Seat belts and child restraints. http://www.vicroads.vic.gov.au/road_safe/safe_first/restfs/rstrnt.htm

BENEFITS OF SEATBELT REMINDER SYSTEMS 32
Williams, A. (2002). Status Report, Vol. 37 No. 2. Insurance Institute for Highway Safety.
Whelan, M., Diamantopoulou, K., Senserrick, T., & Cameron, M. (2003). Establishing a benchmark of safety on Melbourne roads, Report 198. Monash University Accident Research Centre.

BENEFITS OF SEATBELT REMINDER SYSTEMS 33
APPENDIX A: NASS CRASHWORTHINESS DATA SYSTEM1993 –2000: ESTIMATION OF EFFECT OF SEAT-BELT EFFECTIVENESS IN INJURY MITIGATION
Table A.1 – Mean HARM (A$000) for belted and unbelted occupants by crash type.
IMPACT Seat Belt N Minimum A$000
Maximum A$000
Mean A$000
Std. DeviationA$000
UNBELTED 849 $0 $382.33 14.35 25.48 FRONTAL BELTED 3038 $0 $555.00 8.05 15.25
UNBELTED 109 $0 $153.15 23.71 32.14 SIDE IMPACT BELTED 409 $0 $375.67 17.15 36.17
UNBELTED 16 $3.00 $106.00 26.19 34.58 REAR BELTED 75 $2.75 $188.00 8.85 25.13
UNBELTED 59 $0 $208.50 21.32 42.60 ROLLOVER BELTED 134 $0 $104.42 12.65 18.92
Table A.2 – Mean delta-V (km/h) for belted and unbelted occupants by crash type.
IMPACT Seat belt N Mean (km/h)
Std. Deviation
Std. Error Mean
p-value
UNBELTED 849 33.03 16.10 .55 FRONTAL BELTED 3038 28.05 13.04 .23
t(3885)=9.3,p<.05
UNBELTED 109 30.24 13.51 1.29 SIDE IMPACT BELTED 409 26.73 12.99 .64
t(516)=2.48,p<.05
UNBELTED 16 35.56 18.08 4.52 REAR BELTED 75 28.00 13.09 1.51
t(89)=1,95,p>.05
UNBELTED 59 32.20 14.39 1.87 ROLLOVER BELTED 134 29.85 13.85 1.19
t(191)=1.07,pp>.05
Due to the statistically significant difference in the mean delta-v of the belted and unbelted occupants (drivers and front seat passenger) for both frontal and side impact crashes, it was necessary to match the samples on delta-v distribution. This was done by using the percentage distribution of delta-V (5km/h categories). Twice the number of belted occupants were used, and were selected using the RANDOM SELECT CASES function in SPSS. The mean delta-V and mean HARM for frontal crashes and side impact crashes are presented below. These figures relate to cases where the delta-V was known, an air-bag deployed and involved driver and front seat passengers.
FRONTAL CRASHES – NASS CRASHWORTHINESS DATA SYSTEM 1993 – 2000
Table A.3 – Mean HARM for belted and unbelted occupants in frontal crashes.
N Minimum A$000
Maximum A$000
Mean HARM A$000
Std. DeviationA$000
Unbelted 849 .00 $382.33 $14.35 $25.48
Belted 1652 .00 $177.57 $8.78 $12.32

BENEFITS OF SEATBELT REMINDER SYSTEMS 34
Table A.4 – Mean delta-V for belted and unbelted occupants in frontal crashes.
N Minimum (km/h)
Maximum (km/h)
Mean (km/h)
Std. Deviation
Unbelted 849 10.00 112.00 33.03 16.10
Belted 1652 9.00 100.00 31.66 14.32
The difference in mean delta-V for belted and unbelted occupants was not statistically significant. The difference in HARM was seen to be 39%. Hence, 39% is the saving in injury due to wearing a seatbelt for a frontal crash, where an airbag has deployed.
SIDE IMPACT The delta-V of side impact cases was capped at 72 km/h due to differences in the upper end of the belted and unbelted delta-V distributions.
Table A.5 – Mean HARM for belted and unbelted occupants in side impact crashes.
IMPACT N N Minimum A$000
Maximum A$000
Mean A$000
Unbelted 109 .00 153.15 23.71 32.14
Belted 214 .00 375.67 18.49 40.62
Table A.6 Mean delta-V for belted and unbelted occupants in side impact crashes.
IMPACT N Mean (km/h)
Std. Deviation (km/h)
Unbelted 109 30.24 13.51 Belted 214 29.36 12.95
The difference in mean delta-V for belted and unbelted occupants was not statistically significant. The difference in HARM was seen to be 21%. Hence, 21% is the saving in injury due to wearing a seatbelt for a side impact crash, where an airbag has deployed.
ROLLOVER The mean HARM and mean delta-V for rollover crashes is presented in Tables A.1 and A.2 above. As there was no statistically significant difference in the mean delta-V, it was not necessary to match the samples. The difference in HARM was 41%.
REAR & OTHER For these crash types, the weighted mean of savings was used.

Table A.7 BCR Calculation for a 7% discount rate and a fleet life of 15 years.
Unrestrained Harm Effectiveness HARM
(H)
Average number of
vehicles (V)
Cost GST ex.
(C) Multiplier BCR Unit HARM
Benefit
% Annual HARM saved
SIMPLE
DRIVER ONLY $396,952,404.00 0.1 $39,695,240.40 588872.4 $9.09 0.4755 3.5 $32.05 0.45
FRONT SEATS $512,045,112.86 0.1 $51,204,511.29 588872.4 $22.73 0.4755 1.8 $41.35 0.58
ALL OCCUPANTS $587,207,698.23 0.1 $58,720,769.82 588872.4 $63.64 0.4755 0.7 $47.42 0.66
SIMPLE 2
DRIVER ONLY $396,952,404.00 0.2 $79,390,480.80 588872.4 $36.36 0.4755 1.8 $64.11 0.90
FRONT SEATS $512,045,112.86 0.2 $102,409,022.57 588872.4 $59.09 0.4755 1.4 $82.69 1.16
ALL OCCUPANTS $587,207,698.23 0.2 $117,441,539.65 588872.4 $127.27 0.4755 0.7 $94.83 1.33
COMPLEX
DRIVER ONLY $396,952,404.00 0.3 $119,085,721.20 588872.4 $40.91 0.4755 2.4 $96.16 1.35
FRONT SEATS $512,045,112.86 0.3 $153,613,533.86 588872.4 $68.18 0.4755 1.8 $124.04 1.74
ALL OCCUPANTS $587,207,698.23 0.3 $176,162,309.47 588872.4 $150.00 0.4755 0.9 $142.25 1.99
COMPLEX 40%
DRIVER ONLY $396,952,404.00 0.4 $158,780,961.60 588872.4 $40.91 0.4755 3.1 $128.21 1.79
FRONT SEATS $512,045,112.86 0.4 $204,818,045.14 588872.4 $68.18 0.4755 2.4 $165.39 2.31
ALL OCCUPANTS $587,207,698.23 0.4 $234,883,079.29 588872.4 $150.00 0.4755 1.3 $189.66 2.65
BEN
EFITS OF S
EATB
ELT REM
IND
ER S
YSTEM
S
35

Table A.8 BCR Calculation for a 7% discount rate and a fleet life of 25 years.
Unrestrained Harm Effectiveness HARM
(H)
Average number of
vehicles (V)
Cost GST ex.
(C) Multiplier BCR Unit HARM
Benefit
% Annual HARM saved
SIMPLE
DRIVER ONLY $396,952,404.00 0.1 $39,695,240.40 588872.4 $9.09 0.538 4.0 $36.27 0.45
FRONT SEATS $512,045,112.86 0.1 $51,204,511.29 588872.4 $22.73 0.538 2.1 $46.78 0.58
ALL OCCUPANTS $587,207,698.23 0.1 $58,720,769.82 588872.4 $63.64 0.538 0.8 $53.65 0.66
SIMPLE 2
DRIVER ONLY $396,952,404.00 0.2 $79,390,480.80 588872.4 $36.36 0.538 2.0 $72.53 0.90
FRONT SEATS $512,045,112.86 0.2 $102,409,022.57 588872.4 $59.09 0.538 1.6 $93.56 1.16
ALL OCCUPANTS $587,207,698.23 0.2 $117,441,539.65 588872.4 $127.27 0.538 0.8 $107.30 1.33
COMPLEX
DRIVER ONLY $396,952,404.00 0.3 $119,085,721.20 588872.4 $40.91 0.538 2.7 $108.80 1.35
FRONT SEATS $512,045,112.86 0.3 $153,613,533.86 588872.4 $68.18 0.538 2.1 $140.34 1.74
ALL OCCUPANTS $587,207,698.23 0.3 $176,162,309.47 588872.4 $150.00 0.538 1.1 $160.94 1.99
COMPLEX 40%
DRIVER ONLY $396,952,404.00 0.4 $158,780,961.60 588872.4 $40.91 0.538 3.5 $145.06 1.79
FRONT SEATS $512,045,112.86 0.4 $204,818,045.14 588872.4 $68.18 0.538 2.7 $187.12 2.31
ALL OCCUPANTS $587,207,698.23 0.4 $234,883,079.29 588872.4 $150.00 0.538 1.4 $214.59 2.65
36 B
ENEFITS O
F SEA
TBELT R
EMIN
DER
SY
STEMS

Table A.9 BCR Calculation for a 5% discount rate and a fleet life of 15 years.
Unrestrained Harm Effectiveness HARM
(H)
Average number of
vehicles (V)
Cost GST ex.
(C) Multiplier BCR Unit HARM
Benefit
% Annual HARM saved
SIMPLE
DRIVER ONLY $396,952,404.00 0.1 $39,695,240.40 588872.4 $9.09 0.5396 4.0 $36.37 0.45
FRONT SEATS $512,045,112.86 0.1 $51,204,511.29 588872.4 $22.73 0.5396 2.1 $46.92 0.58
ALL OCCUPANTS $587,207,698.23 0.1 $58,720,769.82 588872.4 $63.64 0.5396 0.8 $53.81 0.66
SIMPLE 2
DRIVER ONLY $396,952,404.00 0.2 $79,390,480.80 588872.4 $36.36 0.5396 2.0 $72.75 0.90
FRONT SEATS $512,045,112.86 0.2 $102,409,022.57 588872.4 $59.09 0.5396 1.6 $93.84 1.16
ALL OCCUPANTS $587,207,698.23 0.2 $117,441,539.65 588872.4 $127.27 0.5396 0.8 $107.61 1.33
COMPLEX
DRIVER ONLY $396,952,404.00 0.3 $119,085,721.20 588872.4 $40.91 0.5396 2.7 $109.12 1.35
FRONT SEATS $512,045,112.86 0.3 $153,613,533.86 588872.4 $68.18 0.5396 2.1 $140.76 1.74
ALL OCCUPANTS $587,207,698.23 0.3 $176,162,309.47 588872.4 $150.00 0.5396 1.1 $161.42 1.99
COMPLEX 40%
DRIVER ONLY $396,952,404.00 0.4 $158,780,961.60 588872.4 $40.91 0.5396 3.6 $145.50 1.79
FRONT SEATS $512,045,112.86 0.4 $204,818,045.14 588872.4 $68.18 0.5396 2.8 $187.68 2.31
ALL OCCUPANTS $587,207,698.23 0.4 $234,883,079.29 588872.4 $150.00 0.5396 1.4 $215.23 2.65
BEN
EFITS OF S
EATB
ELT REM
IND
ER S
YSTEM
S
37
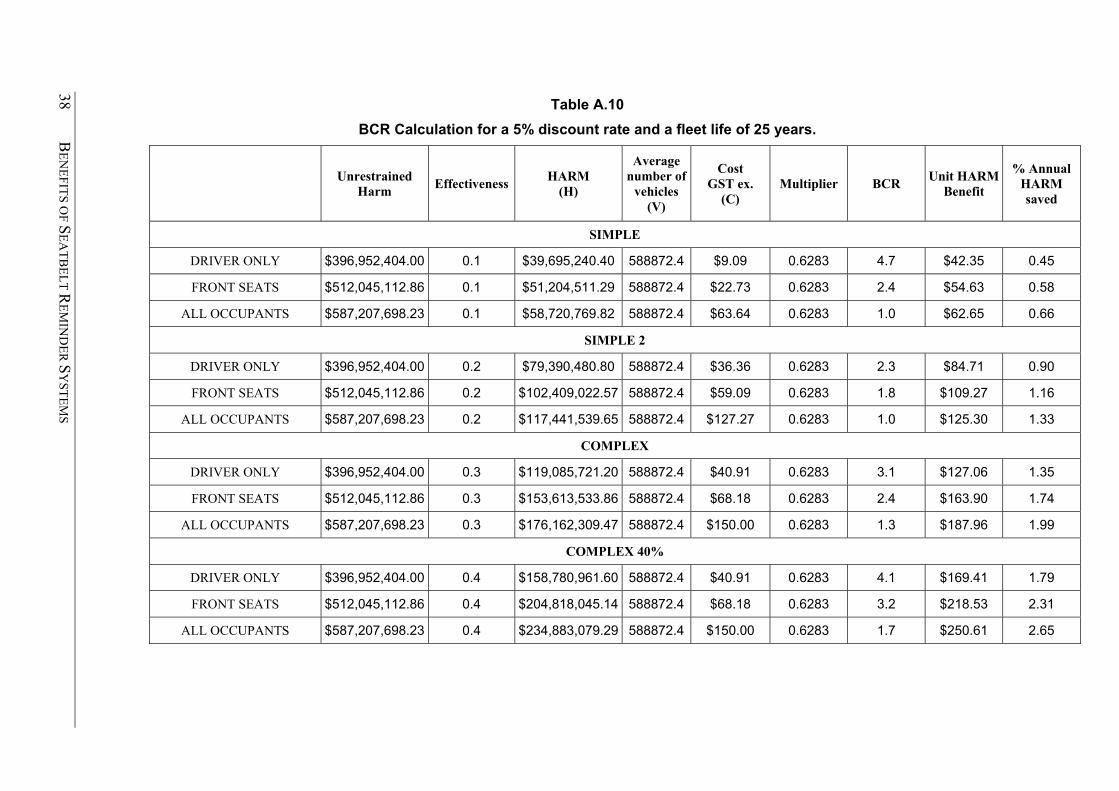
Table A.10 BCR Calculation for a 5% discount rate and a fleet life of 25 years.
Unrestrained Harm Effectiveness HARM
(H)
Average number of
vehicles (V)
Cost GST ex.
(C) Multiplier BCR Unit HARM
Benefit
% Annual HARM saved
SIMPLE
DRIVER ONLY $396,952,404.00 0.1 $39,695,240.40 588872.4 $9.09 0.6283 4.7 $42.35 0.45
FRONT SEATS $512,045,112.86 0.1 $51,204,511.29 588872.4 $22.73 0.6283 2.4 $54.63 0.58
ALL OCCUPANTS $587,207,698.23 0.1 $58,720,769.82 588872.4 $63.64 0.6283 1.0 $62.65 0.66
SIMPLE 2
DRIVER ONLY $396,952,404.00 0.2 $79,390,480.80 588872.4 $36.36 0.6283 2.3 $84.71 0.90
FRONT SEATS $512,045,112.86 0.2 $102,409,022.57 588872.4 $59.09 0.6283 1.8 $109.27 1.16
ALL OCCUPANTS $587,207,698.23 0.2 $117,441,539.65 588872.4 $127.27 0.6283 1.0 $125.30 1.33
COMPLEX
DRIVER ONLY $396,952,404.00 0.3 $119,085,721.20 588872.4 $40.91 0.6283 3.1 $127.06 1.35
FRONT SEATS $512,045,112.86 0.3 $153,613,533.86 588872.4 $68.18 0.6283 2.4 $163.90 1.74
ALL OCCUPANTS $587,207,698.23 0.3 $176,162,309.47 588872.4 $150.00 0.6283 1.3 $187.96 1.99
COMPLEX 40%
DRIVER ONLY $396,952,404.00 0.4 $158,780,961.60 588872.4 $40.91 0.6283 4.1 $169.41 1.79
FRONT SEATS $512,045,112.86 0.4 $204,818,045.14 588872.4 $68.18 0.6283 3.2 $218.53 2.31
ALL OCCUPANTS $587,207,698.23 0.4 $234,883,079.29 588872.4 $150.00 0.6283 1.7 $250.61 2.65
38 B
ENEFITS O
F SEA
TBELT R
EMIN
DER
SY
STEMS

Table A.11 BCR Calculation for a 4% discount rate and a fleet life of 15 years.
Unrestrained Harm Effectiveness HARM
(H)
Average number of
vehicles (V)
Cost GST ex.
(C) Multiplier BCR Unit HARM
Benefit
% Annual HARM saved
SIMPLE
DRIVER ONLY $396,952,404.00 0.1 $39,695,240.40 588872.4 $9.09 0.5769 4.3 $38.89 0.45
FRONT SEATS $512,045,112.86 0.1 $51,204,511.29 588872.4 $22.73 0.5769 2.2 $50.16 0.58
ALL OCCUPANTS $587,207,698.23 0.1 $58,720,769.82 588872.4 $63.64 0.5769 0.9 $57.53 0.66
SIMPLE 2
DRIVER ONLY $396,952,404.00 0.2 $79,390,480.80 588872.4 $36.36 0.5769 2.1 $77.78 0.90
FRONT SEATS $512,045,112.86 0.2 $102,409,022.57 588872.4 $59.09 0.5769 1.7 $100.33 1.16
ALL OCCUPANTS $587,207,698.23 0.2 $117,441,539.65 588872.4 $127.27 0.5769 0.9 $115.05 1.33
COMPLEX
DRIVER ONLY $396,952,404.00 0.3 $119,085,721.20 588872.4 $40.91 0.5769 2.9 $116.66 1.35
FRONT SEATS $512,045,112.86 0.3 $153,613,533.86 588872.4 $68.18 0.5769 2.2 $150.49 1.74
ALL OCCUPANTS $587,207,698.23 0.3 $176,162,309.47 588872.4 $150.00 0.5769 1.2 $172.58 1.99
COMPLEX 40%
DRIVER ONLY $396,952,404.00 0.4 $158,780,961.60 588872.4 $40.91 0.5769 3.8 $155.55 1.79
FRONT SEATS $512,045,112.86 0.4 $204,818,045.14 588872.4 $68.18 0.5769 2.9 $200.65 2.31
ALL OCCUPANTS $587,207,698.23 0.4 $234,883,079.29 588872.4 $150.00 0.5769 1.5 $230.11 2.65
BEN
EFITS OF S
EATB
ELT REM
IND
ER S
YSTEM
S
39

Table A.12 BCR Calculation for a 4% discount rate and a fleet life of 25 years.
Unrestrained Harm Effectiveness HARM
(H)
Average number of
vehicles (V)
Cost GST ex.
(C) Multiplier BCR Unit HARM
Benefit
% Annual HARM saved
SIMPLE
DRIVER ONLY $396,952,404.00 0.1 $39,695,240.40 588872.4 $9.09 0.6829 5.1 $46.03 0.45
FRONT SEATS $512,045,112.86 0.1 $51,204,511.29 588872.4 $22.73 0.6829 2.6 $59.38 0.58
ALL OCCUPANTS $587,207,698.23 0.1 $58,720,769.82 588872.4 $63.64 0.6829 1.1 $68.10 0.66
SIMPLE 2
DRIVER ONLY $396,952,404.00 0.2 $79,390,480.80 588872.4 $36.36 0.6829 2.5 $92.07 0.90
FRONT SEATS $512,045,112.86 0.2 $102,409,022.57 588872.4 $59.09 0.6829 2.0 $118.76 1.16
ALL OCCUPANTS $587,207,698.23 0.2 $117,441,539.65 588872.4 $127.27 0.6829 1.1 $136.19 1.33
COMPLEX
DRIVER ONLY $396,952,404.00 0.3 $119,085,721.20 588872.4 $40.91 0.6829 3.4 $138.10 1.35
FRONT SEATS $512,045,112.86 0.3 $153,613,533.86 588872.4 $68.18 0.6829 2.6 $178.14 1.74
ALL OCCUPANTS $587,207,698.23 0.3 $176,162,309.47 588872.4 $150.00 0.6829 1.4 $204.29 1.99
COMPLEX 40%
DRIVER ONLY $396,952,404.00 0.4 $158,780,961.60 588872.4 $40.91 0.6829 4.5 $184.13 1.79
FRONT SEATS $512,045,112.86 0.4 $204,818,045.14 588872.4 $68.18 0.6829 3.5 $237.52 2.31
ALL OCCUPANTS $587,207,698.23 0.4 $234,883,079.29 588872.4 $150.00 0.6829 1.8 $272.39 2.65
40 B
ENEFITS O
F SEA
TBELT R
EMIN
DER
SY
STEMS

BENEFITS OF SEATBELT REMINDER SYSTEMS 41
APPENDIX B: CALCULATION OF UNIT BENEFITS
When considering the benefits of new safety features, it is useful to compute the unit benefits per passenger car so that Benefit-Cost-Ratios (BCRs) can be determined. The most commonly used method of calculating unit benefits in Australia involves the Discount Present Value method where the likely benefits per car are estimated for the life of the vehicle but discounted back to present day values. The method set out below was adopted for use in previous projects (eg: CR100, Monash University Accident Research Centre, 1992; CR154, Fildes, Digges, Carr, Dyte & Vulcan 1995) and has been used again in this project. It was adopted in consultation with Professor Parish, Monash University Department of Economics, and the Bureau of Transport and Communications Economics (now Bureau of Transport and Regional Economics).
DISCOUNT PRESENT VALUE METHOD The method assumes that the risk of a new car being involved in a casualty crash during any one year (say the third year of its life) is the same as the risk of a car which was first registered three years ago having a crash this year. To calculate this yearly risk, the frequency of crashes for three-year-old cars is divided by the total number of cars sold three years ago. The risk of a crash across the lifetime of a car then is the sum of each year’s crash experience, divided by the number of new cars sold. The process of focussing on each crash year and the number of car sales in the year when the car was new takes account of vehicles that exit from the vehicle fleet through wreckage, wear and tear, etc. as well as the lower distances travelled by older cars and the different characteristics of those who drive older cars.
The next step is to assume that the proportion of total HARM saved for all cars of a certain age group is equal to the proportion of total relevant casualty crashes involving that age group. The formula used helps explain this:
H3 F3 F3 –– = –– or H3 = –– x H Eq. (1) H F F where H3 = HARM reduction for all cars in their third year H = total annual HARM reduction for all cars F3 = number of cars involved in crashes with an occupant casualty in their third year F = total number of cars involved in crashes with an occupant casualty in one year
The average HARM reduction for any one car in its third year is calculated by dividing H3 by the number of new cars registered three years ago. The total benefit for a single car from the new safety feature is then obtained by adding up the HARM reductions for each year of its life and discounting these benefits back to the first year (no discount is applied to the first year [year 0] because both the costs and benefits accrue progressively during that year).

BENEFITS OF SEATBELT REMINDER SYSTEMS 42
The total benefit per car over its life is then:
H0 H1 H2 Hn
B = –– + –––––– + –––––––– + . . . . . . . ––––––––– Eq. (2) V0 V1[1+d] V2[1+d]2 Vn[1+d]n
Where Hn = reduction in HARM by the measure for vehicle n year old
Vn = number of new vehicles registered n years ago
d = discount rate n = the age of the vehicle; note: a vehicle is considered 0 years old during the calendar year in which it was registered
Then, if the economic cost of the measure is $C per device, the Benefit-Cost Ratio is:
H0 H1 H2 Hn
BCR = 1 /C * [ –– + –––––––– + –––––––– + . . .. . . . ––––––––– ] Eq. (3) V0 V1[1+d] V2 [1+d]2 Vn[1+d]n
With Equation 3 being simplified to:
f0 f1 f2 fn
BCR = H /C x V * [ –– + –––––––– + –––––––– + . . . . . . ––––––– ] Eq. (4) v0 v1[1+d] v2 [1+d]2 vn[1+d]n
Where:
fn = Fn / F; number of cars involved in crashes with an occupant casualty in their nth year expressed as a proportion the total number of cars involved in crashes with an occupant casualty in one year
vn = Vn / V; correction factor for cars registered n years ago
V = Average number of new vehicles registered per annum over the past 15 years
d = Discount rate applied
C = Economic cost, excluding GST
For all BCR calculations in this report, Equation 4 was used. Table B.1 shows the number of cars with occupant casualties by vehicle age in Victoria, NSW and Queensland. These numbers are also expressed in column 3 as the percentage of the total number of cars with occupant casualties (40,397) as well as the cumulative percentage (column 4). As stated in Section 4.1.3, that the crash data used to establish the proportion of vehicles involved in crashes by vehicle age for the year 2000 was reported casualty crash data for Victoria, NSW, and Queensland (Newstead, Cameron, Watson, & Delaney, 2003). While the ideal would be to examine all crashes in Australia by year of vehicle manufacture, crash data from other States and Territories was not readily available. The assumption, therefore, is that crash

BENEFITS OF SEATBELT REMINDER SYSTEMS 43
involvement by vehicle age and fleet age distribution in Victoria, NSW and Queensland is indicative for Australia as a whole. It is critical to note that the use of the crash data was limited to establishing the proportional crash involvement of vehicles by year of manufacture rather than the actual numbers of vehicle involved. The number of new cars registered in each year from 1975 to 2000 is also shown in column 5. The final column shows the cumulative sum of the terms [ (F0 / FV0) + (F1
/ FV1 1+d) + . . . . Fn / FVn 1+dn) ] from equation (4) above, using a 4% discount rate. This is the multiplier for converting total annual HARM saved H (expressed in millions of dollars) to unit HARM savings over the life of the vehicle (expressed in dollars). Tables B.2 and B.3 show similar tables for 5% and 7% discount rates. These figures were used for calculating the multipliers used for both the 15 and 25-year vehicle life in the body of the Table, namely:
15 year Device Life 25 year Device Life
4% discount rate 0.5769 0.6829
5% discount rate 0.5396 0.6283
7% discount rate 0.4755 0.5380
It should be noted that the choice of the discount rate has a marked effect on the calculation. Not only does it influence the BCR, but also the cost of injury [BTRE, 2001 used a 4% discount rate in determining the cost of injury for each injury severity level].
In recent times, the BTRE (2002) argued that a 5% discount rate was “most meaningful” for undertaking benefit-cost analyses, although they still recommend calculations at a range of rates should be undertaken as a sensitivity analysis.

BENEFITS OF SEATBELT REMINDER SYSTEMS 44
Table B.1 Numbers & Percentages of Cars with Occupant Casualties
(Victoria, NSW & QLD 1975 to 2000) with a 4% discount rate. DF = 1.04 Cars with killed or injured occupants
Car Age Total number
vehicles involved (Fn)
Proportion of total (fn)
Cumulative Proportion
Number of new cars registered
in Australia
Multiplier (cumulative
sum of terms)
26 & above 990 0.0245068 1.00 25 263 0.0065104 0.98 551011 0.6829 24 314 0.0077729 0.97 556300 0.6803 23 360 0.0089116 0.96 517449 0.6771 22 489 0.0121049 0.95 532473 0.6730 21 667 0.0165111 0.94 532710 0.6673 20 804 0.0199025 0.92 565653 0.6593 19 1082 0.0267842 0.90 555753 0.6499 18 1330 0.0329232 0.88 580654 0.6364 17 1297 0.0321063 0.84 524515 0.6199 16 1827 0.0452261 0.81 579925 0.6014 15 2176 0.0538654 0.77 625061 0.5769 14 1636 0.0404981 0.71 478197 0.5487 13 1510 0.037379 0.67 414467 0.5199 12 1790 0.0443102 0.64 477461 0.4880 11 2008 0.0497067 0.59 544296 0.4539 10 2038 0.0504493 0.54 567202 0.4190 9 1591 0.0393841 0.49 482099 0.3836 8 1635 0.0404733 0.45 526303 0.3498 7 1637 0.0405228 0.41 530947 0.3167 6 1990 0.0492611 0.37 588550 0.2825 5 2142 0.0530237 0.32 613261 0.2436 4 2194 0.054311 0.27 630869 0.2017 3 2412 0.0597074 0.21 698916 0.1584 2 2572 0.0636681 0.15 778997 0.1137 1 2556 0.063272 0.09 740998 0.0692 0 1087 0.0269079 0.03 760523 0.0208
Total 40397 1 14954590 Average New Registrations p.a. (last 15 years) 588872.4

BENEFITS OF SEATBELT REMINDER SYSTEMS 45
Table B.2 Numbers & Percentages of Cars with Occupant Casualties
(Victoria, NSW & QLD 1975 to 2000) with a 5% discount rate. DF = 1.05 Cars with killed or injured occupants
Car Age Total number
vehicles involved (Fn)
Proportion of total (fn)
Cumulative Proportion
Number of new cars registered
in Australia
Multiplier (cumulative
sum of terms)
26 & above 990 0.0245068 1.00 25 263 0.0065104 0.98 551011 0.6283 24 314 0.0077729 0.97 556300 0.6263 23 360 0.0089116 0.96 517449 0.6237 22 489 0.0121049 0.95 532473 0.6204 21 667 0.0165111 0.94 532710 0.6158 20 804 0.0199025 0.92 565653 0.6093 19 1082 0.0267842 0.90 555753 0.6015 18 1330 0.0329232 0.88 580654 0.5902 17 1297 0.0321063 0.84 524515 0.5764 16 1827 0.0452261 0.81 579925 0.5606 15 2176 0.0538654 0.77 625061 0.5396 14 1636 0.0404981 0.71 478197 0.5152 13 1510 0.037379 0.67 414467 0.4900 12 1790 0.0443102 0.64 477461 0.4618 11 2008 0.0497067 0.59 544296 0.4314 10 2038 0.0504493 0.54 567202 0.4000 9 1591 0.0393841 0.49 482099 0.3678 8 1635 0.0404733 0.45 526303 0.3368 7 1637 0.0405228 0.41 530947 0.3062 6 1990 0.0492611 0.37 588550 0.2742 5 2142 0.0530237 0.32 613261 0.2374 4 2194 0.054311 0.27 630869 0.1975 3 2412 0.0597074 0.21 698916 0.1558 2 2572 0.0636681 0.15 778997 0.1124 1 2556 0.063272 0.09 740998 0.0687 0 1087 0.0269079 0.03 760523 0.0208
Total 40397 1 14954590 Average New Registrations p.a. (last 15 years) 588872.4

BENEFITS OF SEATBELT REMINDER SYSTEMS 46
Table B.3 Numbers & Percentages of Cars with Occupant Casualties
(Victoria, NSW & QLD 1975 to 2000) with a 7% discount rate. DF = 1.07 Cars with killed or injured occupants
Car Age Total number
vehicles involved (Fn)
Proportion of total (fn)
Cumulative Proportion
Number of new cars registered
in Australia
Multiplier (cumulative
sum of terms)
26 & above 990 0.0245068 1.00 25 263 0.0065104 0.98 551011 0.5380 24 314 0.0077729 0.97 556300 0.5367 23 360 0.0089116 0.96 517449 0.5351 22 489 0.0121049 0.95 532473 0.5330 21 667 0.0165111 0.94 532710 0.5299 20 804 0.0199025 0.92 565653 0.5255 19 1082 0.0267842 0.90 555753 0.5202 18 1330 0.0329232 0.88 580654 0.5123 17 1297 0.0321063 0.84 524515 0.5024 16 1827 0.0452261 0.81 579925 0.4910 15 2176 0.0538654 0.77 625061 0.4755 14 1636 0.0404981 0.71 478197 0.4571 13 1510 0.037379 0.67 414467 0.4377 12 1790 0.0443102 0.64 477461 0.4157 11 2008 0.0497067 0.59 544296 0.3914 10 2038 0.0504493 0.54 567202 0.3659 9 1591 0.0393841 0.49 482099 0.3393 8 1635 0.0404733 0.45 526303 0.3131 7 1637 0.0405228 0.41 530947 0.2867 6 1990 0.0492611 0.37 588550 0.2588 5 2142 0.0530237 0.32 613261 0.2259 4 2194 0.054311 0.27 630869 0.1896 3 2412 0.0597074 0.21 698916 0.1509 2 2572 0.0636681 0.15 778997 0.1099 1 2556 0.063272 0.09 740998 0.0678 0 1087 0.0269079 0.03 760523 0.0208
Total 40397 1 14954590 Average New Registrations p.a. (last 15 years) 588872.4