benefits, barriers, progress, and recommendations
TRANSCRIPT

Analytics in Higher EducationBenefits, Barriers, Progress, and Recommendations
EDUCAUSE CENTER FOR APPLIED RESEARCH

Contents
Executive Summary 3Key Findings and Recommendations 4Introduction 5Defining Analytics 6Findings 8Higher Education’s Progress to Date: Analytics Maturity 20Conclusions 25Recommendations 26Methodology 27Acknowledgments 29
Author
Jacqueline Bichsel, EDUCAUSE Center for Applied Research
Citation for this work:
Bichsel, Jacqueline. Analytics in Higher Education: Benefits, Barriers, Progress, and Recommendations (Research Report). Louisville, CO: EDUCAUSE Center for Applied Research, August 2012, available from http://www.educause.edu/ecar.
Analytics in Higher Education:Benefits, Barriers, Progress,and Recommendations
EDUCAUSE CENTER FOR APPLIED RESEARCH

EDUCAUSE CENTER FOR APPLIED RESEARCH
Analytics in Higher Education
3
Executive Summary
Many colleges and universities have demonstrated that analytics can help significantly advance an institution in such strategic areas as resource allocation, student success, and finance. Higher education leaders hear about these transformations occurring at other institutions and wonder how their institutions can initiate or build upon their own analytics programs. Some question whether they have the resources, infrastruc-ture, processes, or data for analytics. Some wonder whether their institutions are on par with others in their analytics endeavors. It is within that context that this study set out to assess the current state of analytics in higher education, outline the challenges and barriers to analytics, and provide a basis for benchmarking progress in analytics.
Higher education institutions, for the most part, are collecting more data than ever before. However, this study provides evidence that most of these data are used to satisfy credentialing or reporting requirements rather than to address strategic ques-tions, and much of the data collected are not used at all. Analytics is used mostly in the areas of enrollment management, student progress, and institutional finance and budgeting. The potential benefits of analytics in addressing other areas—such as cost to complete a degree, resource optimization, and multiple administrative functions—have not been realized.
One of the major barriers to analytics in higher education is cost. Many institutions view analytics as an expensive endeavor rather than as an investment. Much of the concern around affordability centers on the perceived need for expensive tools or data collection methods. What is needed most, however, is investment in analytics profes-sionals who can contribute to the entire process, from defining the key questions to developing data models to designing and delivering alerts, dashboards, recommenda-tions, and reports.

EDUCAUSE CENTER FOR APPLIED RESEARCH
Analytics in Higher Education
4
Key Findings and Recommendations
• Analytics is widely viewed as important, but data use at most institutions is still limited to reporting.
• Analytics efforts should start by defining strategic questions and developing a plan to address those questions with data.
• Analytics programs require neither perfect data nor the perfect data culture—they can and should be initiated when an institution is ready to make the investment and the commitment.
• Analytics programs are most successful when various constituents—institutional research (IR), information technology (IT), functional leaders, and executives—work in partnership.
• Where analytics is concerned, investment is the area in which higher education institutions are making the least progress. Institutions that view analytics as an investment rather than an expense are making greater progress with analytics initiatives.
• Institutions should focus their investments on expertise, process, and policies before acquiring new tools or collecting additional data.
• Institutions that have made more progress in Investment, Culture/Process, Data/Reporting/Tools, Expertise, and Governance/Infrastructure are more likely to use data to make predictions or projections or to trigger action in a variety of areas.

EDUCAUSE CENTER FOR APPLIED RESEARCH
Analytics in Higher Education
5
Introduction
Analytics has become a hot topic in higher education as more institutions show how analytics can be used to maximize strategic outcomes. There are many note-worthy examples of successful analytics use across a diverse range of institutions. Western Governors University uses assessment-based coaching reports to develop customized study plans for students.1 Paul Smith’s College used analytics to improve its early-alert program, providing more efficient and more effective interventions that resulted in increased success, persistence, and graduation rates.2 The University of Washington Tacoma and Persistence Plus partnered to improve persistence and grades in online math courses through notifications on user-identified personal devices.3 At-risk students in virtual learning environments at The Open University have been identified using existing data, thereby improving retention of these students.4 Campus-wide performance dashboards have improved resource utiliza-tion at Philadelphia University.5
These pockets of successful analytics use belie an important reality: Many IT and IR professionals believe that their institutions are behind in their endeavors to employ analytics. One purpose of this ECAR 2012 study on analytics was to gauge the current state of analytics in higher education—to provide a barometer by which higher educa-tion professionals and leaders can assess their own current state. Another purpose was to outline the barriers and challenges to analytics use and provide suggestions for overcoming them. The study employed a survey that was administered to a sample of EDUCAUSE member institutions as well as members of the Association for Institutional Research (AIR).6 In addition, seven focus groups consisting of both IT and IR professionals were convened to address the topics of defining analytics, identi-fying challenges, and proposing solutions.
EDUCAUSE CENTER FOR APPLIED RESEARCH
Analytics in Higher Education
6
Defining Analytics
“When you hear the word ‘analytics,’ what comes to mind?” That question was posed to four of the focus groups for the ECAR 2012 study on analytics, and the answers were varied and informative. Themes that emerged related to students, data, analysis, strategic decisions, and the politics and culture behind analytics.
STUDENT SUCCESS • RETENTION • BIG DATAMARKETING • LANDING PAGES • WEBSITE VISITS COMPLEX • CLASSROOM USE • INTERACTIVEHOT TOPIC • BUZZWORD • COURSE DISTRIBUTION TIME TO DEGREE • TIME REPORTING • METRICS POLITICS • PREDICTION • ALL-ENCOMPASSING DECISION MAKING • STRATEGY • DATA MINING ANALYSIS • STATISTICS • NUMBER COUNTING GOOGLE • AUTOMATIC DATA • BOUNCE RATE EVERYTHING • ANOTHER PLACE WE’RE BEHIND
Some of the IR and IT professionals focused on the challenges to analytics. Others emphasized the benefits and successes of analytics. A better understanding of the balance between the benefits and the challenges is a highlight of this report.
Three of the focus groups were asked to respond to the EDUCAUSE working defini-tion of analytics:
Analytics is the use of data, statistical analysis, and explanatory and predictive models to gain insights and act on complex issues.
Most focus group members agreed with this definition, and they liked the emphasis on prediction (a few would have preferred even more emphasis). The most commonly suggested additions were the concepts that analytics is “strategic” and is involved in “decision making.” Some suggested that the types of data and reports involved with analytics should be mentioned, and a few suggested that “data visualization” should be part of the definition.
Almost everyone agreed that analytics is a process that is more than just metrics. They described that process as (a) starting with a strategic question, (b) finding or collecting the appropriate data to answer that question, (c) analyzing the data with an eye toward prediction and insight, (d) representing or presenting findings in ways that are both understandable and actionable, and (e) feeding back into the process of addressing strategic questions and creating new ones. Many viewed the

EDUCAUSE CENTER FOR APPLIED RESEARCH
Analytics in Higher Education
7
use of transactional, automatically obtained, repeatable data as an integral part of analytics and as the element that separates analytics from more traditional forms of analysis and reporting.
Most focus group participants viewed analytics as something new—a catalyst for transforming higher education. At the same time, a minority of focus group participants classified “analytics” as a buzzword, and some saw little value in making an investment in something that has thus far not distinguished itself as essential for their institutions’ progress. Still others viewed analytics as a replacement term for institutional research and reporting processes in which they have been engaging for decades; they didn’t see the need to reclassify their processes.
For the supportive majority, two changes separate old and new approaches to data analysis:
• The data used now are becoming much more extensive and automatic, and the processes used to extract and analyze data are becoming repeatable.
• A broader range of departments and programs are applying data and analysis to decision making and planning in more domains than ever before.
STRATEGIC QUESTION DATA ANALYSIS AND PREDICTION INSIGHT AND ACTION
ANALYTICS
We at EDUCAUSE have chosen to use the word “analytics” as it is defined above in the interest of developing a common language as part of a conversation with the higher education community. As the definition suggests, analytics itself is not the end goal. Rather, analytics is a tool used in addressing strategic problems or questions.

8EDUCAUSE CENTER FOR APPLIED RESEARCH
Analytics in Higher Education
Findings
Results discussed in this section were obtained from quantitative analyses of the analytics survey items and qualitative analyses of the focus group responses and open-ended survey items.
The Importance of Analytics
In more than two-thirds of responding institutions (69%), analytics was viewed as a major priority for at least some departments, units, or programs; 28% reported that analytics is a major priority for the entire institution (see Figure 1). Only 6% reported that analytics is not a priority or an interest. Priority placed on analytics did not vary significantly with Carnegie class or with control (public or private). Institutional size correlated—albeit minimally—with priority (r = .12, p < .05); larger institutions placed a somewhat greater priority on analytics than did smaller institutions.7
28%
41%
26%
2%4%
Major institutionalpriority
Major priority forsome departmentsbut not entire institution
An interest of theinstitution but nota priority
Little awareness andtherefore not apriority or interest
Intentionally not apriority or interest
Figure 1. Priority of Analytics

9EDUCAUSE CENTER FOR APPLIED RESEARCH
Analytics in Higher Education
Overwhelmingly, survey respondents said that analytics has increased in impor-tance over the past two years and will increase in importance over the next two years (see Figure 2).
The focus groups reinforced these survey findings. The vast majority of focus group participants were excited about the prospect of analytics for addressing strategic priorities in higher education and were interested in learning how analytics might transform some aspects of their institution.
Figure 2. Growing Importance of Analytics
Moreimportant
Just asimportant
Lessimportant
COMPARED TO TWO YEARS AGO, ANALYTICS IS...
...FOR HIGHER EDUCATION’S SUCCESS
84%
15%0.6%
More important Just as important
TWO YEARS FROM NOW, ANALYTICS WILL BE...
...FOR HIGHER EDUCATION’S SUCCESS
86%
14%
10EDUCAUSE CENTER FOR APPLIED RESEARCH
Analytics in Higher Education
Targets and Benefits of Analytics
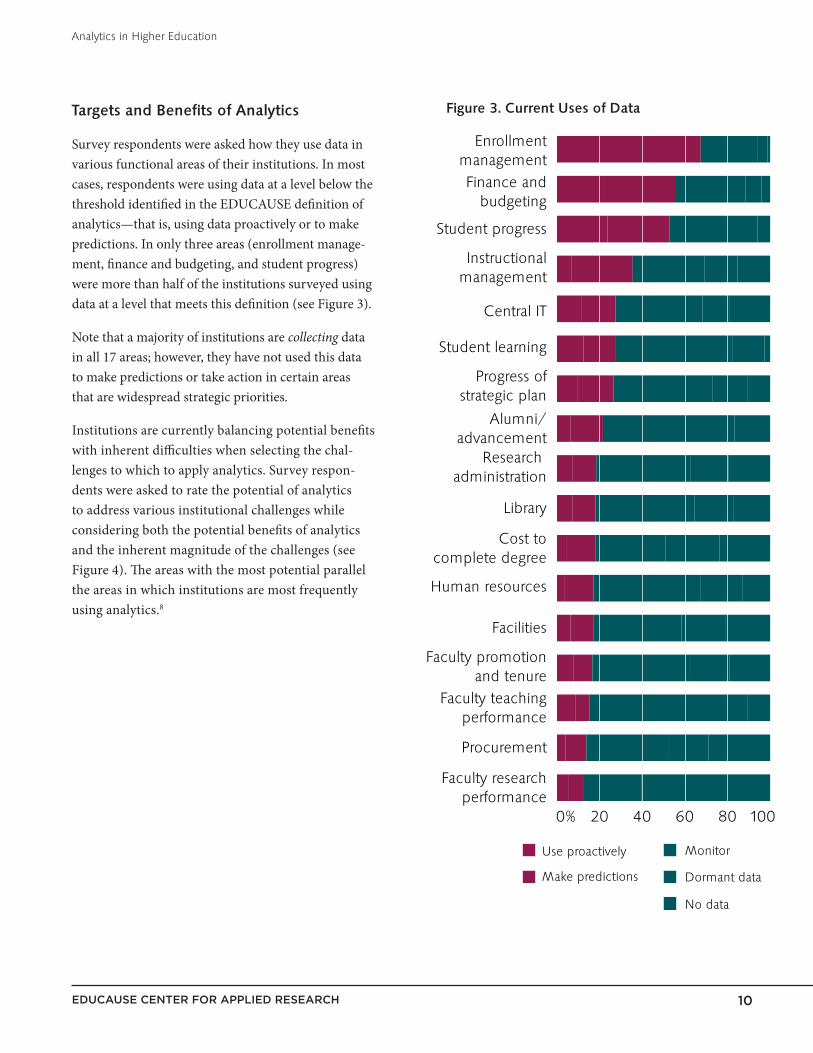
Survey respondents were asked how they use data in various functional areas of their institutions. In most cases, respondents were using data at a level below the threshold identified in the EDUCAUSE definition of analytics—that is, using data proactively or to make predictions. In only three areas (enrollment manage-ment, finance and budgeting, and student progress) were more than half of the institutions surveyed using data at a level that meets this definition (see Figure 3).
Note that a majority of institutions are collecting data in all 17 areas; however, they have not used this data to make predictions or take action in certain areas that are widespread strategic priorities.
Institutions are currently balancing potential benefits with inherent difficulties when selecting the chal-lenges to which to apply analytics. Survey respon-dents were asked to rate the potential of analytics to address various institutional challenges while considering both the potential benefits of analytics and the inherent magnitude of the challenges (see Figure 4). The areas with the most potential parallel the areas in which institutions are most frequently using analytics.8
CURRENT USES OF DATAEnrollment
managementFinance and
budgeting
Student progress
Instructionalmanagement
Central IT
Student learning
Progress ofstrategic plan
Alumni/advancement
Research administration
Library
Cost tocomplete degree
Human resources
Facilities
Faculty promotionand tenure
Procurement
Faculty teachingperformance
Faculty researchperformance
Use proactively
Make predictions
Monitor
Dormant data
No data
0% 20 40 60 80 100
Figure 3. Current Uses of Data

11EDUCAUSE CENTER FOR APPLIED RESEARCH
Analytics in Higher Education
Figure 4. Perceived Benefits of Analytics for Higher Education
Reducing administrativecosts
Improving facultyperformance
Containing/loweringcosts of education
Improving administrativeservices
Demonstrating higher education’seffectiveness/efficiency
Creating data transparency/sharing/federation
Helping students learn moreeffectively/graduate
Recruiting students
Optimizing use of resources
Understanding studentdemographics and behaviors
0% 20 40 60 80 100
Percentage of respondents reporting a large or major benefit of analytics
PERCEIVED BENEFITS OF ANALYTICS
Respondents thought that areas involving students have the greatest potential to benefit from analytics; these are also currently popular analytics focus areas. On the lower end of the scale, faculty performance was among the least popular current targets and least likely to be viewed as benefitting from analytics. Although reducing administrative costs and containing or lowering the costs of education were not perceived by most as deriving a major benefit from analytics, the area of finance and budgeting is one of the more popular targets for analytics.
From these data, we can glean that the likely early benefits of analytics will be in the areas of student performance, student recruitment and retention, and resource optimization (but not extending to cost reduction). These may be areas in which institutions can find initial success stories in analytics. Some survey respondents and focus group members provided other target areas in which analytics is being used. These included standardized

EDUCAUSE CENTER FOR APPLIED RESEARCH
Analytics in Higher Education
12
student assessment, student satisfaction and engagement, retention, accreditation preparation, quality enhancement, athletics management, marketing, improvement of curriculum quality, comparison with peer institutions, and alumni donations.
What these results suggest is that analytics can be used in many areas and that institu-tions need to map their strategic initiatives to the data at hand to identify which key areas to target.
One example of a distinctive use of analytics is at the University of Wollongong, whose Library Cube uses library usage data to predict student grades. Along with providing information that could increase student success, this creative use of analytics has the additional benefit of demonstrating the added value that a library provides to the institution.9 A unique instructional application of analytics outside higher education involves instructors directly in the analytics process. The Oregon DATA Project trains K–12 teachers to apply analytics in targeting instruction to the needs of individual students, resulting in widespread adoption of data-driven decision making at the classroom level.10
Improving specific academic and administrative outcomes is not the only benefit of analytics. Many study participants provided examples of how analytics programs can improve processes such as communications and decision making while increasing morale. Respondents said that analytics programs can foster commu-nication between executive leadership, IR, and IT. Other respondents suggested that this increased communication extends to functional-area leaders and reduces departmental “siloing.” Others mentioned how a systematic use of analytics increases the likelihood that faculty, staff, and particularly administrators will base their decisions on data rather than on intuition or conventional wisdom. It was also suggested that analytics helps the academic community focus on questions that are strategically important. The fostering of a philosophy of continuous improvement was another suggested benefit.
Making the results of analytics public was also seen as a means for improving morale and satisfaction among faculty, staff, and students. A few respondents said analytics would reduce political conflict regarding strategic decision making when deci-sions began to be based on data. Finally, respondents foresaw that, once established, analytics processes would become more efficient and data would expand and improve, leading to long-term improvements in accountability.
Institutions should not wait for a cultural shift to be fully in place before beginning an analytics program. Respondents highlighted the interplay between institutional culture and analytics, suggesting that initiating an analytics program before a philos-ophy of data-driven decision making is ensconced may help establish that culture.
“ Analytics brings together people from different parts of the organiza-tion who need to be talking to make the organization healthy...IT, institu-tional researchers, enrollment management, faculty, and advising communities…. We’re getting this data to take action.”
—IT professional
13EDUCAUSE CENTER FOR APPLIED RESEARCH
Analytics in Higher Education
Concerns, Barriers, and Challenges
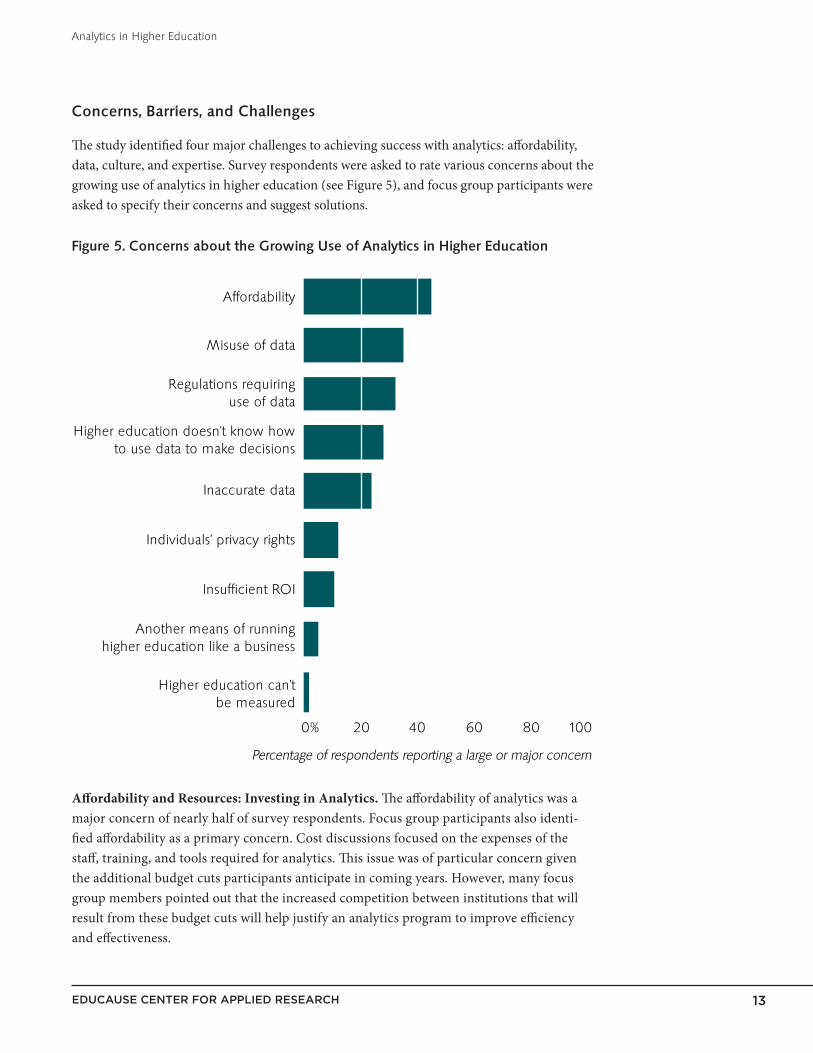
The study identified four major challenges to achieving success with analytics: affordability, data, culture, and expertise. Survey respondents were asked to rate various concerns about the growing use of analytics in higher education (see Figure 5), and focus group participants were asked to specify their concerns and suggest solutions.
Figure 5. Concerns about the Growing Use of Analytics in Higher Education
0% 20 40 60 80 100
Higher education can’tbe measured
Insufficient ROI
Individuals’ privacy rights
Inaccurate data
Higher education doesn’t know howto use data to make decisions
Regulations requiringuse of data
Misuse of data
Affordability
Percentage of respondents reporting a large or major concern
CONCERNS ABOUT THE GROWING USEOF ANALYTICS IN HIGHER EDUCATION
Another means of runninghigher education like a business
Affordability and Resources: Investing in Analytics. The affordability of analytics was a major concern of nearly half of survey respondents. Focus group participants also identi-fied affordability as a primary concern. Cost discussions focused on the expenses of the staff, training, and tools required for analytics. This issue was of particular concern given the additional budget cuts participants anticipate in coming years. However, many focus group members pointed out that the increased competition between institutions that will result from these budget cuts will help justify an analytics program to improve efficiency and effectiveness.
EDUCAUSE CENTER FOR APPLIED RESEARCH
Analytics in Higher Education
14
Another concern was an inability to direct existing resources to analytics. IR partici-pants stated that analysts (business or IR professionals who would likely lead analytics initiatives) are too busy with reporting to think about analytics, and they noted that anticipated increases in accountability could make this situation worse. Much of an analyst’s time is spent on delivery and presentation of results, given that formatting, metrics, and expectations are not standardized. Overcommitment on the part of both IR and IT professionals often leads to reports that merely satisfy accountability requirements rather than address an institution’s strategic initiatives. In general, IR, IT, and other professional staff (e.g., advisors) are too overburdened to initiate or extend analytics programs.
Several focus group members remarked that when senior leadership agrees that analytics is a priority and part of the strategic plan, then cost becomes less of an issue. They suggested that demonstrating how the use of analytics can help reduce costs or streamline processes can influence senior leaders’ understanding of the importance of analytics. However, survey respondents rated the reduction of administrative and educational costs relatively low on the scale of perceived benefits after factoring in the inherent magnitude of those challenges. Still, recognizing that cost reduction could be an “in” to gaining support for analytics might be key to transforming the culture at some institutions, particularly those with limited resources. One example is Saint Michael’s College in Vermont, whose executive leadership used a model provided by NACUBO11 to reshape its financial processes, creating actionable prediction models that resulted in transformational change.12
A few focus group members suggested that using the cost of tools as a reason for postponing an analytics program is counterintuitive when one considers that analytics can cut costs in the long run. Moreover, getting an analytics program off the ground does not have to originate with the purchase of an expensive tool. For example, the development of Austin Peay’s Degree Compass, a course-recommen-dation system, began with the use of an Excel spreadsheet.13 Focus group members who had been involved with successful analytics programs emphasized the need to invest in people—the number and training of analysts—before investing in tools. Likewise, spending money to collect additional data isn’t always necessary when launching an analytics program. Purdue University’s Signals uses grade informa-tion, demographics, and existing student data on effort and engagement to provide students with early performance notifications that have resulted in higher grades and an increased tendency to seek out help.14
“ Anybody who’s ever worked in a public institution can tell you that the budget gets cut, but the reporting requirements always increase.”
—IR professional

EDUCAUSE CENTER FOR APPLIED RESEARCH
Analytics in Higher Education
15
The way to make the case for analytics investment is to demonstrate how analytics can help maximize strategic outcomes:
If you are trying to sell your institution [on analytics], making sure that [incoming students are] going to be successful…is so important…. The easiest thing to explain is [that] it is very expensive to bring a student to campus who’s not going to succeed, and so you have to be doing things all the way along the line to make sure they’re going to succeed or recognize early enough before you’ve made a big investment that they’re not going to succeed. —IR professional
Data: Quality, Ownership, Access, and Standardization. Between one-quarter and one-third of survey participants reported misuse of data or inaccurate data as a large or major concern about analytics (Figure 5). Focus group members rein-forced the survey findings by frequently mentioning that certain aspects of data can act as a barrier to analytics: data quality, data ownership, data access, and data standardization. Several focus group members were concerned about the quality of their institutions’ data. Many said this problem should be addressed before an analytics program could be established. However, others remarked that institutions cannot afford to wait for perfect data, that data will never be perfect anyway, and that analysts should resist the notion that they must have perfect data before acting. Signals provides a useful example: Although the data from Purdue’s LMS wasn’t a perfect measure of student engagement, it was good enough to effectively identify students who needed additional help.15
The types of data used in analytics and reporting are changing. Although some institutions are now using transactional, system-generated, or automatic data (such as clicks and site visits), most higher education data warehouses remain populated with “frozen” data only (see Figure 6). Which point in time is the right time to collect and report information (for admission head counts, for example) is a topic of ongoing discussion. Many participants predicted that “real time” nonstatic data reporting is in the near future for higher education. Even if data reporting is not yet real time, data are proliferating across time and across institutional areas. Almost two-thirds of insti-tutions (62%) are using data warehouses and business intelligence systems as a way of integrating, organizing, and summarizing these large data sets.16
“ We could be looking at a changing higher education over the next 20 years as data become much more available.”
—IT professional

16EDUCAUSE CENTER FOR APPLIED RESEARCH
Analytics in Higher Education
Figure 6. Extent to Which Various Types of Data Are Used in Analytics ActivitiesEXTENT TO WHICH THE FOLLOWINGARE USED IN ANALYTICS ACTIVITIES
System-generatedbehavioral data
Survey data
Transactional data
Frozen data
0% 20 40 60 80 100
Most of the time
Often
Sometimes
Seldom
Never/almost never
Another data issue frequently mentioned was that of ownership. In essence, data need to be “de-siloed.” Participants noted that many departments were reluctant or unwilling to share data necessary for analytics. Most agreed that it is necessary for senior leader-ship to institute policies that encourage the sharing, standardization, and federation of data, balancing needs for security with needs for access. Some also suggested that an executive-sanctioned analytics program itself can help overcome data silos by explicitly encouraging communication.
Several participants said that data need to be centrally accessible in some way and mentioned “shadow” databases as impediments to institution-wide data consistency and accessibility. In order for this to work, however, there would have to be common defi-nitions in place so that data could be used by different departments that at times have varying definitions and uses of data. One institution that has successfully centralized data access is Portland State University. Its DataMASTER system has created a single data repository that is accessible and transparent, transcending data silos and fostering a culture of data-driven decision making.17 It is not always possible to create a single data repository for the entire institution. What appear to be most important are data access and transparency; the need for a common language around data was a consistent theme among focus group members in discussing ways to make decentralized data more acces-sible and usable.
EDUCAUSE CENTER FOR APPLIED RESEARCH
Analytics in Higher Education
17
Culture: Leadership and Visible Wins. All focus groups spent a considerable amount of time discussing how an institution’s culture can be a barrier to a successful analytics program. Many institutions have administrators, faculty, and staff who fear or mistrust institutional data, measurement, analysis, reporting, and change. One-third of survey respondents were concerned that higher education doesn’t know how to use data to make decisions (Figure 5).
Several focus group participants expressed concern (on behalf of both themselves and others at their institution) that higher education is becoming more of a business and that analytics is a harbinger of that change. Much discussion focused on the need to convince others that data are not a threat and that using data could provide a better basis for decision making. Interestingly, only a small percentage were concerned that using analytics was another means of “running higher education like a business” or that “what we do in higher education can’t be measured.”
The overwhelming consensus of all focus groups was that cultural change needs to start at the top.18 Participants advocated that executive leadership be on board with analytics. Frequent comments regarding executive leadership were that the most effective leaders (a) start with a strategic question before consulting or collecting data, not the other way around; (b) do not let preconceived ideas influence questions, analysis, or decision making; and (c) rely more on the data and less on intuition, experience, or anecdotes.
Many comments addressed the need to effect cultural shifts. Not surprisingly, the most frequent suggestion was to use analytics “wins” to gain trust and acceptance. Some participants recommended focusing on a big win, while others advised orches-trating a series of small wins over time. Most agreed on the need for flexibility; when leadership changes are made, trust needs to be rebuilt, and so a program of repeatable wins is important to have in place.
I find it helps to have an advocate on the president’s advisory council, someone—a champion—who will say, ‘Okay, the official data comes from this office,’ and to keep hammering that home. —IR professional
Expertise and Knowledge: Low Supply, Underestimated Need. The hiring and training of additional staff—particularly analysts—was viewed as a major chal-lenge. It was clear that many participants were overwhelmed at the idea of beginning an analytics program given their current workloads. Many agreed that executive leaders did not have a good understanding of the time and expertise required. It was suggested that both executive leaders and analysts need to work collaboratively to define strategic questions and develop a timeline for addressing them. In addition, a good analytics program produces streamlining and efficiency that can result in decreased workloads.
“ The hardest part is always asking the right question, because if you don’t ask the right question, almost any answer will do.”
—IR professional
18EDUCAUSE CENTER FOR APPLIED RESEARCH
Analytics in Higher Education
A common refrain in the focus groups was that analytics is more about the people than the data or the tools:
Data are not going to give you a decision. It is your experience and wisdom—that’s what leads you to make decisions. Data are supposed to be a rational approach that provides you a solid foundation for your thinking so that when somebody questions you, you say that there is a rationale behind my data, but still the decision comes from you. The human brain has to make the decision, not an analytical tool. You should have a number of years of experience, background, and wisdom before you make the decision, but you need to have the data to help you. It’s just a tool, not an end itself. —IR professional
Expertise for analytics was viewed as encompassing not just an analysis component but logic and communication components as well:
It’s a new kind of talent to bring someone in to actually listen to the questions and figure out how to come up with a meaningful answer and then be able to repeat that process the next time. —IT professional
Partnership between IR and IT. In addition to increased communication between analysts and executive leadership, many focus group participants suggested that a successful analytics program can only be attained with better communication between IR and IT. Indicative of the difficulty that IT and IR staff often have commu-nicating their needs to one another, many participants—particularly those from larger institutions—did not know their colleagues in the other department.
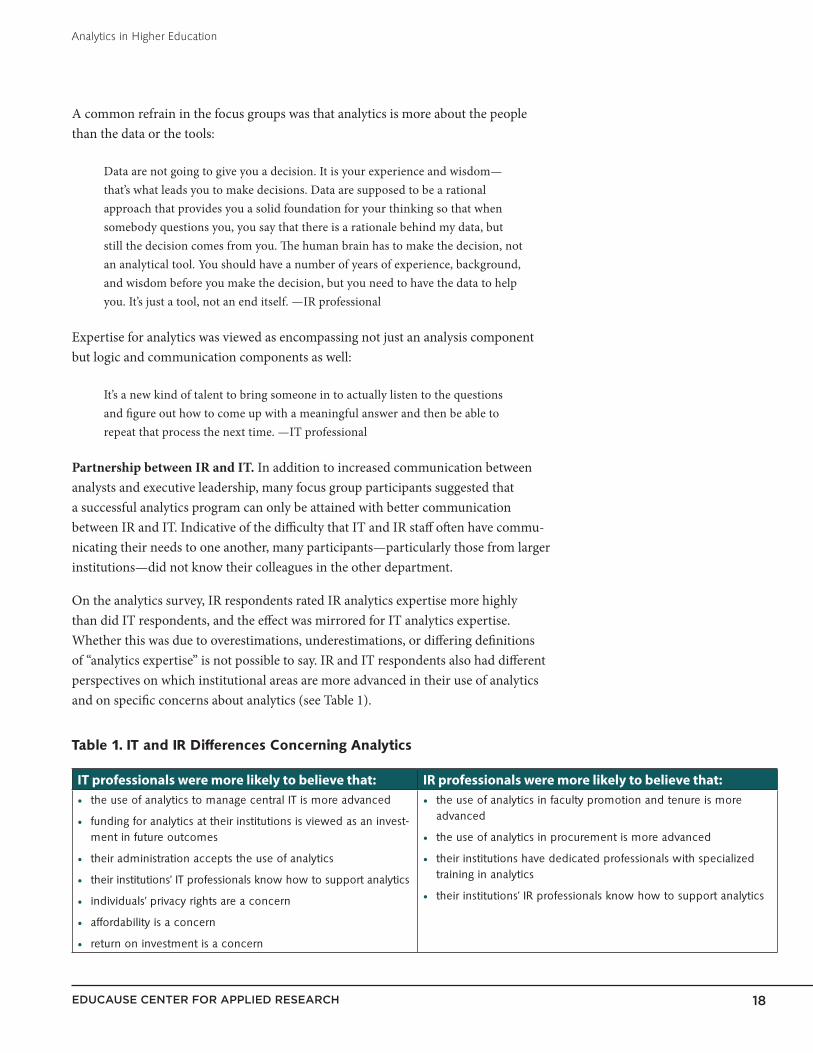
On the analytics survey, IR respondents rated IR analytics expertise more highly than did IT respondents, and the effect was mirrored for IT analytics expertise. Whether this was due to overestimations, underestimations, or differing definitions of “analytics expertise” is not possible to say. IR and IT respondents also had different perspectives on which institutional areas are more advanced in their use of analytics and on specific concerns about analytics (see Table 1).
Table 1. IT and IR Differences Concerning Analytics
IT professionals were more likely to believe that: IR professionals were more likely to believe that:• the use of analytics to manage central IT is more advanced
• funding for analytics at their institutions is viewed as an invest-ment in future outcomes
• their administration accepts the use of analytics
• their institutions’ IT professionals know how to support analytics
• individuals’ privacy rights are a concern
• affordability is a concern
• return on investment is a concern
• the use of analytics in faculty promotion and tenure is more advanced
• the use of analytics in procurement is more advanced
• their institutions have dedicated professionals with specialized training in analytics
• their institutions’ IR professionals know how to support analytics

EDUCAUSE CENTER FOR APPLIED RESEARCH
Analytics in Higher Education
19
In addition, IT professionals attribute more importance to analytics for higher education’s success than do IR professionals, both in terms of the growth in impor-tance over the past two years and of the anticipated growth over the next two years (see Figure 7).
Figure 7. Importance of Analytics, as Viewed by IR and IT*
IR IT
IR IT
COMPARED TO TWO YEARS AGO ANALYTICS IS...
TWO YEARS FROM NOW ANALYTICS WILL BECOME...
More important Just as important Less important
81%
18%
87%
13%2%
80%
20%
90%
11%
*Note: Not all percentages add to 100 due to rounding
Many of the comments in this report arose spontaneously from conversations between IR and IT participants in the focus groups. In addition, most participants said they learned a lot from these discussions that they could take back to their institutions. One example of a successful IT/IR partnership can be found at the University of Maryland, Baltimore County (UMBC), in which interdepartmental cooperation played an essential role in building a data warehouse that greatly improved accessibility and analysis.19
The majority of participants agreed that analytics ownership should reside somewhere other than IT—that IT should support but not own analytics. However, participants also voiced a need to train more IT personnel to help support analytics. A frequent complaint was that—in smaller institutions especially—there were only one or two people who knew the data warehouse well enough to be able to mine data for analysis.
“ Today I am feeling great because I’m hearing things that tell me I’m not the lone fish in the entire pond with all these issues.”
— IR professional to an
IT professional
EDUCAUSE CENTER FOR APPLIED RESEARCH
Analytics in Higher Education
20
Higher Education’s Progress to Date: Analytics Maturity
Although analytics has arisen from established areas and activities—from insti-tutional research to business intelligence—it has far from realized its potential. In order for higher education to continue to make progress, it will help to under-stand where analytics programs at colleges and universities stand today, which of the required components are most advanced or mature, and which components remain nascent. Using the data from this study supplemented by expert opinion, EDUCAUSE has drafted a maturity index for higher education to use to track prog-ress with analytics programs.
Davenport et al. outlined five areas that underlie maturity in business analytics:20
• The right data• The right amount of enterprise/integration/communication• The right leadership• The right targets for analytics• The right analysts
Although the Davenport maturity model helped inform the EDUCAUSE model, an analytics maturity model might look different for a student- or knowledge-centered organization. The EDUCAUSE maturity model was developed wholly from our survey and focus group findings.
When focus group participants were asked how they would assess an institution on analytics maturity, their responses encompassed the following themes:
• Accessibility of data• Centralization/integration of data• Quality of data• Data capacity• Number and expertise of analytics professionals• Communication between IR and IT• Data-based decision making as a part of the overall culture• Analytics as part of the strategic plan• Documented “wins” using analytics• Budgeting for analytics• The availability of appropriate tools/software• The existence of policies regarding data security and privileges
The survey questions assessing institutional progress in analytics supported the maturity themes raised by the focus group members.21 Figure 8 displays these items and the percentage of respondents who agreed or disagreed that these were in place at their institutions.

21EDUCAUSE CENTER FOR APPLIED RESEARCH
Analytics in Higher Education
Figure 8. What Is in Place for Analytics
Analysts
Funding
Faculty acceptance
Process to use data in decisions
Business professionals
Dedicated analytics professionals
Investment orientation
Good reports
Standardized data
Data-driven culture
Clean data
IT professionals
Right tools
Data access policies
Right data
IR professionals
Information security readiness
Data capacity
Accepting administration
Identification of key outcomes
Senior leader interest
-60 -40 -20 0% 20 40 60 80-80-100 100
NOT IN PLACE IN PLACE
An analysis of these themes provides a general picture of higher education’s maturity in analytics. More than 80% of respondents reported that they have data-oriented leadership and that they have identified potential targets for analytics. More than half reported having the right data and storage capacity, the right data policies, IR profes-sionals who know how to support analytics, and an administration that accepts analytics. The lowest ratings appeared on investment questions: Fewer than 20% reported having adequate funding or adequate numbers of analysts.
A factor analysis was performed to ascertain the dimensions that underlie analytics maturity. This analysis yielded five factors: Culture/Process, Data/Reporting/Tools, Investment, Expertise, and Governance/Infrastructure. Most of these factors can be generally mapped onto Davenport’s five dimensions of business analytics. However, one standout factor is different: Investment.
22EDUCAUSE CENTER FOR APPLIED RESEARCH
Analytics in Higher Education
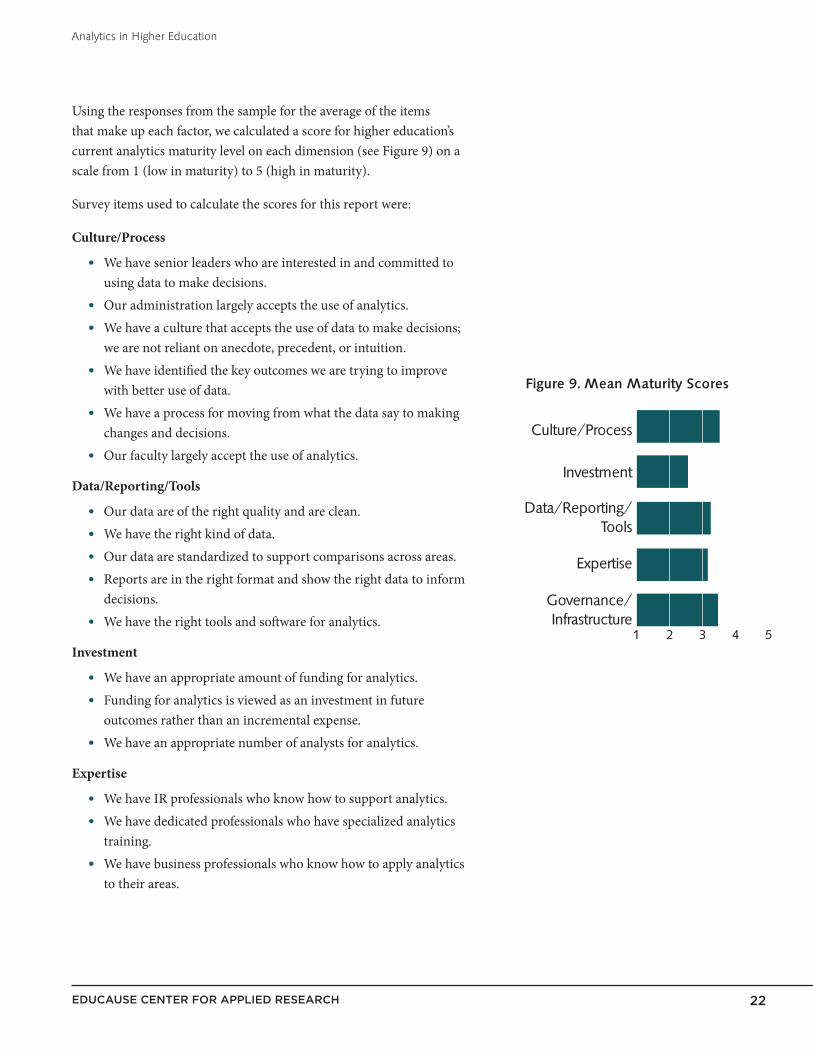
Using the responses from the sample for the average of the items that make up each factor, we calculated a score for higher education’s current analytics maturity level on each dimension (see Figure 9) on a scale from 1 (low in maturity) to 5 (high in maturity).
Survey items used to calculate the scores for this report were:
Culture/Process
• We have senior leaders who are interested in and committed to using data to make decisions.
• Our administration largely accepts the use of analytics.• We have a culture that accepts the use of data to make decisions;
we are not reliant on anecdote, precedent, or intuition.• We have identified the key outcomes we are trying to improve
with better use of data.• We have a process for moving from what the data say to making
changes and decisions.• Our faculty largely accept the use of analytics.
Data/Reporting/Tools
• Our data are of the right quality and are clean.• We have the right kind of data.• Our data are standardized to support comparisons across areas.• Reports are in the right format and show the right data to inform
decisions.• We have the right tools and software for analytics.
Investment
• We have an appropriate amount of funding for analytics.• Funding for analytics is viewed as an investment in future
outcomes rather than an incremental expense.• We have an appropriate number of analysts for analytics.
Expertise
• We have IR professionals who know how to support analytics.• We have dedicated professionals who have specialized analytics
training.• We have business professionals who know how to apply analytics
to their areas.
MEAN MATURITY SCORES
1 2 3 4 5
Governance/Infrastructure
Expertise
Data/Reporting/Tools
Investment
Culture/Process
Figure 9. Mean Maturity Scores

EDUCAUSE CENTER FOR APPLIED RESEARCH
Analytics in Higher Education
23
Governance/Infrastructure
• Our information security policies and practices are sufficiently robust to safeguard the use of data for analytics.
• We have sufficient capacity to store, manage, and analyze increasingly large volumes of data.
• We have policies that specify rights and privileges regarding access to institutional and individual data.
• We have IT professionals who know how to support analytics.
Analytics maturity in higher education is still developing: Average maturity was below 4.0 on all dimensions. Institutions in general were most advanced in Culture/Process and Governance/Infrastructure. Institutions scored significantly lower in Data/Reporting/Tools and Expertise; however, the lowest score by far was for Investment. This result indicates that for higher education to develop its analytics capacity, institu-tions will need to:
• view funding for analytics as an investment in future outcomes;• increase the amount of funding for analytics; and• invest in hiring an appropriate number of analysts to institute and develop an
analytics program.
Lending predictive validity to our maturity factors, all five maturity scores related positively to the use of analytics in nearly every area targeted for possible analytics use (Figure 3), with the exception of the library. This means that for each maturity factor, institutions with higher scores were more likely to use data to make predictions or projections or to trigger proactive responses in a variety of areas.
Two of the maturity scores differed significantly depending on whether respondents were IR or IT professionals. IR respondents classified their institutions as being higher in Expertise than did IT respondents. IT respondents, on the other hand, rated Governance/Infrastructure as more advanced than did IR respondents.
The priority institutions place on analytics was positively correlated with all five matu-rity dimensions. In other words, higher priority is associated with greater maturity in Culture/Process, Governance/Infrastructure, Data/Reporting/Tools, Expertise, and Investment. This illustrates the point that analytics doesn’t just happen. Even moving from no awareness to initial interest will advance progress.
Larger institutions have an advantage in three areas: Culture/Process, Investment, and Governance/Infrastructure. Not surprisingly, they were more likely to invest in funding for analytics, in hiring enough analysts, and in training for analytics. They were also more likely to employ IT professionals who knew how to support analytics, to work within a data-driven culture, and to have data access policies. However, when institutional priority was taken into consideration, the effect of institutional size on
EDUCAUSE CENTER FOR APPLIED RESEARCH
Analytics in Higher Education
24
analytics maturity in Culture/Process dissipated. In other words, smaller institutions can match the maturity of larger institutions on issues of culture and process when they place a priority on analytics.
The survey responses, the results from the factor analysis, and additional input from expert advisors to the study were used to augment the survey items to formulate the ECAR Analytics Maturity Index for Higher Education.22 The data reported here are the subset of that index for which we had data. The index allows institutional respon-dents to gauge their progress in analytics, identify gaps that may be hindering prog-ress in analytics, and identify strengths they might capitalize on to initiate or expand their analytics programs.

EDUCAUSE CENTER FOR APPLIED RESEARCH
Analytics in Higher Education
25
Conclusions
Analytics is an interest or a major priority for most colleges and universities, and most survey respondents believe that the importance of analytics for the success of higher education is growing. However, widespread analytics use is limited mainly to the areas of enrollment management, student progress, and resource optimization. This limited scope of analytics is likely due to barriers of affordability, data, culture, expertise, and communication. That said, these barriers can be overcome at institutions with limited resources that nevertheless assign a high priority to analytics.
Davenport et al. stated that although most companies collect and store enormous amounts of data, they don’t use it effectively.23 Something very similar could be said for higher education. Although considerable amounts of data are being collected and stored, the data are not being used effectively to make predictions or trigger proac-tive responses. Many respondents identified target areas in which their institutions are participating or attempting to participate in analytics; however, it appears that the majority of institutions are in the data-collection or data-monitoring stage in most areas and have not yet matured to the point where they are using data for prediction or decision-making. The fact that data collection is occurring in these areas is a good start. Identifying the barriers to using data proactively to make decisions is key to making progress in analytics.
Analytics initiatives can help unify the institution by focusing on key strategic initia-tives and centralizing data. In addition, integrating data from multiple sources makes it more consistent and increases accessibility, visibility, and usefulness.
IR and IT professionals have a great deal of knowledge about the potential targets for analytics, the benefits of analytics, and the barriers that exist in their institutions for either initiating or extending analytics programs. Provided with the right resources, training, and a data-driven culture that includes executive support, they can over-come these barriers.
Small institutions are not behind in their data-collection efforts; however, barriers of culture, investment, infrastructure, and policy are especially pronounced for the small institution. Public and private institutions are making similar progress, as are institu-tions from various Carnegie classes.
To the extent that colleges and universities see value in analytics, investments—both in people and in analytics programs—will be needed. New tools are not necessary to initiate analytics, but adequate funding for analysts and training is necessary to maxi-mize strategic outcomes in targeted areas. In addition, analytics can help cut costs—in an age when all of higher education is being asked to do more with less—by helping streamline processes.

EDUCAUSE CENTER FOR APPLIED RESEARCH
Analytics in Higher Education
26
Recommendations
• Map out strategy and planning. Identify the strategic questions the institution needs to answer and develop analytics capabilities around those questions. Let the questions, rather than the data at hand, drive efforts.24 Have a procedure in place for asking appropriate strategic questions to which analytics can then be applied. The procedure should include individuals who are responsible for translating the strategic question into an analyzable form, the process for obtaining the data to respond to the question, the process and individuals responsible for analyzing the data, and the process for reporting and communicating results.
• Look for an early win. As with other areas of change, plan the use of limited resources to institute a major data “win” or a series of small wins designed to gain experience and make the case that data-based decisions have enhanced value. Consider the areas of enrollment management, cost reduction, or resource opti-mization as possible targets for initial analytics projects for the purpose of estab-lishing the value of analytics.
• Invest in people over tools. Recognize that analytics is at least as much about people as it is about data or tools. Investment needs to begin at the level of hiring and/or training an appropriate number of analysts to begin addressing strategic questions.
• Don’t wait for perfection. Do not wait until the culture or the data are perfect before initiating an analytics program. The experience of developing analytics initiatives will result in progress on both fronts.
• Partnerships and communication are key. Form a partnership between IT and IR and between analysts and executive leadership that begins with better communica-tion. Involve representatives from each affected department in analytics initiatives.
• Plan for infrastructure that supports analytics use across the institution. Develop a comprehensive plan to provide an infrastructure and processes that keep data integrated, secure, and widely accessible. Although this represents an ideal situation, any progress in this area can help expand analytics initiatives.25
• Plan the support function. Develop a plan for how IT will support the analytics program. This plan should include training, resources, and tools.26
• Benchmark to provide context. Use the maturity index developed from the EDUCAUSE 2012 study of analytics to gauge your institution’s current standing in analytics, set goals for future analytics success, and measure your institution’s progress.27

27EDUCAUSE CENTER FOR APPLIED RESEARCH
Analytics in Higher Education
Methodology
Survey. The 2012 Analytics Survey was administered to a sample of EDUCAUSE members (N = 231; 22% response rate) and a sample of members from the Association for Institutional Research (N = 125; 25% response rate). A total of 17 cases were dropped from the EDUCAUSE member sample because they were either incomplete or duplicates of AIR respondent institu-tions. This left a total of 339 respondents. Table A summarizes respondents by control and Carnegie Classification. Table B shows institution size by Carnegie Classification.
Table A. Summary of Respondents, by Carnegie Classification and Control
Carnegie Classification
Control
TotalPublic PrivateAA 59 5 64
BA 13 44 57
MA 39 48 87
DR 27 13 40
Other 32 29 61
Total 170 139 309
Table B. Summary of Respondents, by Carnegie Classification and Institution Size
Carnegie Classification
Institution Size
TotalFewer than
2,0002,000– 3,999
4,000– 7,999
8,000–14,999
15,000 and More Unknown
AA 15 16 22 11 3 0 67
BA 30 25 2 0 0 0 57
MA 18 26 24 16 4 0 88
DR 0 1 5 13 21 0 40
Other 29 7 3 7 17 20 83
Total 92 75 56 47 45 20 335
The survey contained both quantitative and qualitative items. Data collection occurred in April and May of 2012. Both the AIR and the EDUCAUSE member surveys were administered online.
Focus Groups. In addition to the survey, data was collected from seven focus groups across the country. Participants for each focus group consisted mostly of IR and IT profes-sionals. IT participants were selected by identifying individuals from the EDUCAUSE member roster who worked at institutions within the geographic area of the location selected for the focus group. IR participants were selected by checking the associated
28EDUCAUSE CENTER FOR APPLIED RESEARCH
Analytics in Higher Education
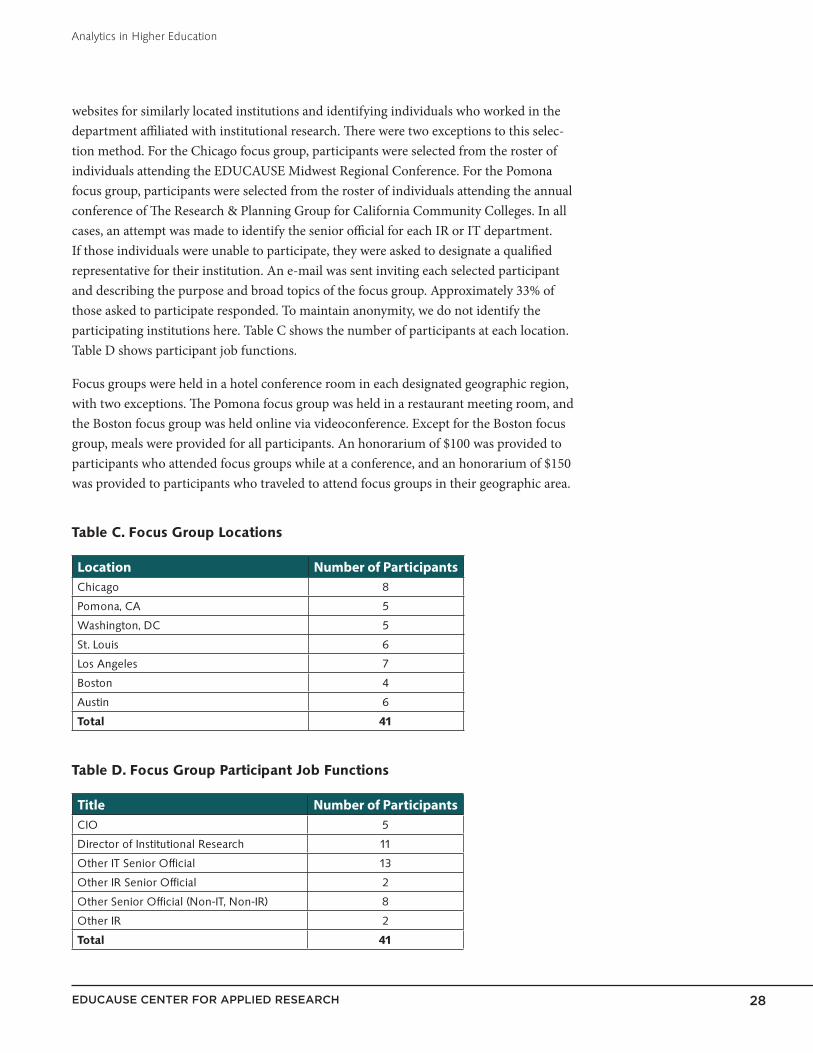
websites for similarly located institutions and identifying individuals who worked in the department affiliated with institutional research. There were two exceptions to this selec-tion method. For the Chicago focus group, participants were selected from the roster of individuals attending the EDUCAUSE Midwest Regional Conference. For the Pomona focus group, participants were selected from the roster of individuals attending the annual conference of The Research & Planning Group for California Community Colleges. In all cases, an attempt was made to identify the senior official for each IR or IT department. If those individuals were unable to participate, they were asked to designate a qualified representative for their institution. An e-mail was sent inviting each selected participant and describing the purpose and broad topics of the focus group. Approximately 33% of those asked to participate responded. To maintain anonymity, we do not identify the participating institutions here. Table C shows the number of participants at each location. Table D shows participant job functions.
Focus groups were held in a hotel conference room in each designated geographic region, with two exceptions. The Pomona focus group was held in a restaurant meeting room, and the Boston focus group was held online via videoconference. Except for the Boston focus group, meals were provided for all participants. An honorarium of $100 was provided to participants who attended focus groups while at a conference, and an honorarium of $150 was provided to participants who traveled to attend focus groups in their geographic area.
Table C. Focus Group Locations
Location Number of ParticipantsChicago 8
Pomona, CA 5
Washington, DC 5
St. Louis 6
Los Angeles 7
Boston 4
Austin 6
Total 41
Table D. Focus Group Participant Job Functions
Title Number of ParticipantsCIO 5
Director of Institutional Research 11
Other IT Senior Official 13
Other IR Senior Official 2
Other Senior Official (Non-IT, Non-IR) 8
Other IR 2
Total 41
29EDUCAUSE CENTER FOR APPLIED RESEARCH
Analytics in Higher Education
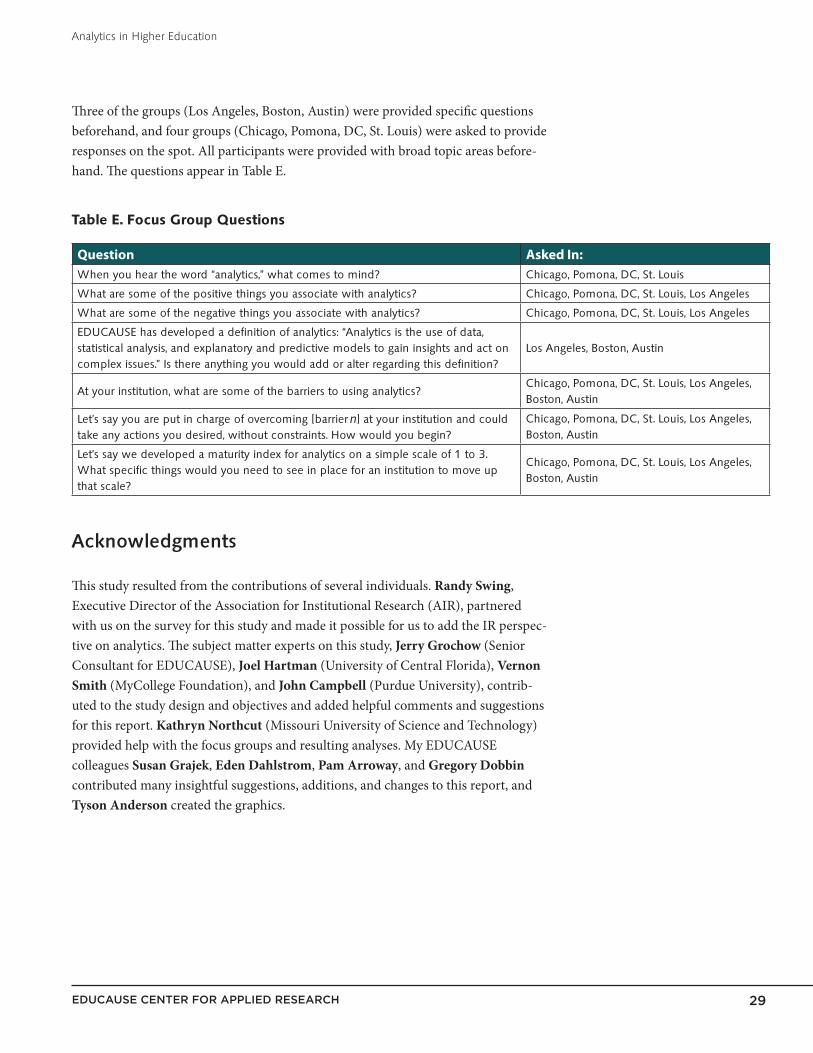
Three of the groups (Los Angeles, Boston, Austin) were provided specific questions beforehand, and four groups (Chicago, Pomona, DC, St. Louis) were asked to provide responses on the spot. All participants were provided with broad topic areas before-hand. The questions appear in Table E.
Table E. Focus Group Questions
Question Asked In:When you hear the word “analytics,” what comes to mind? Chicago, Pomona, DC, St. Louis
What are some of the positive things you associate with analytics? Chicago, Pomona, DC, St. Louis, Los Angeles
What are some of the negative things you associate with analytics? Chicago, Pomona, DC, St. Louis, Los Angeles
EDUCAUSE has developed a definition of analytics: “Analytics is the use of data, statistical analysis, and explanatory and predictive models to gain insights and act on complex issues.” Is there anything you would add or alter regarding this definition?
Los Angeles, Boston, Austin
At your institution, what are some of the barriers to using analytics?Chicago, Pomona, DC, St. Louis, Los Angeles, Boston, Austin
Let’s say you are put in charge of overcoming [barrier n ] at your institution and could take any actions you desired, without constraints. How would you begin?
Chicago, Pomona, DC, St. Louis, Los Angeles, Boston, Austin
Let’s say we developed a maturity index for analytics on a simple scale of 1 to 3. What specific things would you need to see in place for an institution to move up that scale?
Chicago, Pomona, DC, St. Louis, Los Angeles, Boston, Austin
Acknowledgments
This study resulted from the contributions of several individuals. Randy Swing, Executive Director of the Association for Institutional Research (AIR), partnered with us on the survey for this study and made it possible for us to add the IR perspec-tive on analytics. The subject matter experts on this study, Jerry Grochow (Senior Consultant for EDUCAUSE), Joel Hartman (University of Central Florida), Vernon Smith (MyCollege Foundation), and John Campbell (Purdue University), contrib-uted to the study design and objectives and added helpful comments and suggestions for this report. Kathryn Northcut (Missouri University of Science and Technology) provided help with the focus groups and resulting analyses. My EDUCAUSE colleagues Susan Grajek, Eden Dahlstrom, Pam Arroway, and Gregory Dobbin contributed many insightful suggestions, additions, and changes to this report, and Tyson Anderson created the graphics.

EDUCAUSE CENTER FOR APPLIED RESEARCH
Analytics in Higher Education
30
Notes
1. Jason Levin and Sally M. Johnstone, “Coaching Reports Support Customized Study Plans,” EDUCAUSE Review Online (July/August 2012), http://www.educause.edu/ero/article /coaching-reports-support-customized-study-plans.
2. Loralyn Taylor and Virginia McAleese, “Beyond Retention: Using Targeted Analytics to Improve Student Success,” EDUCAUSE Review Online (July/August 2012), http://www .educause.edu/ero/article/beyond-retention-using-targeted-analytics-improve-student-success.
3. Jill Frankfort, Kenneth Salim, Colleen Carmean, and Tracey Haynie, “Analytics, Nudges, and Learner Persistence,” EDUCAUSE Review Online (July/August 2012), http://www.educause .edu/ero/article/analytics-nudges-and-learner-persistence.
4. Annika Wolff and Zdenek Zdrahal, “Improving Retention by Identifying and Supporting ‘At-Risk’ Students,” EDUCAUSE Review Online (July/August 2012), http://www.educause.edu /ero/article/improving-retention-identifying-and-supporting-risk-students.
5. Jeffrey C. Cepull, Rashmi Radhakrishnan, and D. R. Widder, “Building a Performance Analytics Environment,” EDUCAUSE Review Online (July/August 2012), http://www .educause.edu/ero/article/building-performance-analytics-environment.
6. See the Methodology section for sample size and other details.
7. Carnegie class, control, and institution size were related to only a very few variables in the study and were not related in any systematic way. Therefore, these variables were not the focus of most of the results in this report.
8. For this question, survey respondents were asked to weigh benefits considering both the potential for analytics to address these challenges and the inherent magnitude of the chal-lenges. “Analytics Survey 2012” (Survey; Louisville, CO: EDUCAUSE Center for Applied Research, 2012).
9. Brian Cox and Margie Jantti, “Discovering the Impact of Library Use and Student Performance,” EDUCAUSE Review Online (July/August 2012), http://www.educause.edu/ero/article/discovering-impact-library-use-and-student-performance.
10. Mickey Garrison and Megan Monson, “The Oregon DATA Project: Building a Culture of Data Literacy,” EDUCAUSE Review Online (July/August 2012), http://www.educause.edu/ero/article/oregon-data-project-building-culture-data-literacy.
11. James E. Morley Jr., “Working More Effectively by Building Organizational Capacity,” Business Officer (December 2005), http://www.nacubo.org/Business_Officer_Magazine/Magazine_Archives/December_2005/Working_More_Effectively_by_Building_Organizational_Capacity.html.
12. William Anderson and Mary Jane Russell, “Evolutionary Analytics: BI on a Shoestring,” EDUCAUSE Review Online (July/August 2012), http://www.educause.edu/ero/article /evolutionary-analytics-bi-shoestring; Mary Jane Russell, “Put Data in the Driver’s Seat,” Business Officer (February 2011), http://www.nacubo.org/Business_Officer_Magazine /Magazine_Archives/February_2011/Put_Data_in_the_Drivers_Seat.html.

EDUCAUSE CENTER FOR APPLIED RESEARCH
Analytics in Higher Education
31
13. Tristan Denley, “Austin Peay State University: Degree Compass,” in Game Changers: Education and Information Technologies, ed. Diana G. Oblinger (Washington, DC: EDUCAUSE), 263–267.
14. Matthew D. Pistilli, Kimberly Arnold, and Matt Bethune, “Signals: Using Academic Analytics to Promote Student Success,” EDUCAUSE Review Online (July/August 2012), http://www .educause.edu/ero/article/signals-using-academic-analytics-promote-student-success.
15. Ibid.
16. Susan Grajek, Leah Lang, and David Trevvett, “The 2011 Enterprise Application Market in Higher Education,” (Research Report; Louisville, CO: EDUCAUSE Center for Applied Research, 2012).
17. Sharon E. Blanton, “DataMASTER: Success and Failure on a Journey to Business Intelligence,” EDUCAUSE Review Online (July/August 2012), http://www.educause.edu/ero/article /datamaster-success-and-failure-journey-business-intelligence.
18. For more information on cultural transformation, see Freeman A. Hrabowski III, John J. Suess, and John Fritz, “Assessment and Analytics in Institutional Transformation,” EDUCAUSE Review (September/October 2011): 15–28, http://www.educause.edu/ero/article /assessment-and-analytics-institutional-transformation.
19. Ibid.
20. Thomas H. Davenport, Jeanne G. Harris, and Robert Morison, Analytics at Work: Smarter Decisions, Better Results (Boston: Harvard Business Press, 2010), 19.
21. Question B8, “Analytics Survey 2012” (Louisville, CO: EDUCAUSE Center for Applied Research, 2012).
22. “ECAR Analytics Maturity Index for Higher Education” (Louisville, CO: EDUCAUSE Center for Applied Research, forthcoming).
23. Davenport, Harris, and Morison, Analytics at Work, 9.
24. For more information on strategic questions that can be addressed with analytics, see Susan Grajek, “Research and Data Services for Higher Education Information Technology: Past Present, and Future,” EDUCAUSE Review 46, no. 6 (November/December 2011): 46–60, http://www.educause.edu/ero/article/research-and-data-services-higher-education -information-technology-past-present-and-future.
25. For more information on developing a data-driven plan, see University Business Executive Roundtable, “Developing a Data-Driven University: Strategies and Best Practices for Increasing Reporting and Analytical Capacity to Improve Institutional Effectiveness,” Report, 2010 (Washington, D.C.: The Advisory Board Company).
26. Randall J. Stiles, Kristine T. Jones, and Vishvas Paradkar, “Analytics Rising: IT’s Role in Informing Higher Education Decisions” (Research Bulletin 7, 2011) (Louisville, CO: EDUCAUSE Center for Applied Research), available from http://www.educause.edu/ecar.
27. “ECAR Analytics Maturity Index.”