benefit cost analysis highway 97 red rock 4-laning and ... business... · benefit cost analysis ....
TRANSCRIPT

Apex Engineering Limited
Benefit Cost Analysis
Highway 97 Red Rock 4-Laning
And Commercial Vehicle Inspection
Station
Prepared for: Ministry of Transportation Northern Region Prince George, BC Prepared by:
Peter Lyall P.Eng. Apex Engineering
Vancouver, BC Project No. MoT-75 27 February, 2007

Summary The existing Prince George South Commercial Vehicle Inspection Station is located on Highway 97 at the south approach to Prince George, in an industrial area at the south end of the Simon Fraser Bridge. Encroaching development, public pressure and increasing congestion around the scale have made it impractical for the scale to remain at its present location. With the implementation of the 4-lane Cariboo Connector from Cache Creek to Prince George, there is the opportunity to build a new median scale in a new section of divided 4-lane highway about 20 km south of Prince George near Red Rock Road. The new scale location will reduce average commercial vehicle delay by several minutes per vehicle and may also be equipped with Weigh-in-motion (WIM) and Automatic Vehicle Identification (AVI) technology allowing safe legal trucks to bypass the weigh scale at highway speeds. The project is consistent with federal objectives to improve efficiency of the National commercial vehicle network through the use of electronic clearance and roadside inspection and with the Provincial objectives to 4-lane the Cariboo Connector from Cache Creek to Prince George. The project reduces congestion for through traffic at the approach to Prince George and the Simon Fraser Bridge as well as delays to commercial vehicles entering the scale. Safety benefits stem from reduced intersection accidents at the signalised intersection access to the scale, the 5 km of improved 4-lane highway in the vicinity of the new scale and from improved commercial vehicle compliance. Pavement benefits stem from improved targeting of overweight vehicles. At a 10% discount rate, the present value of benefits is $11.6 million without WIM/AVI and $14.3 with WIM/AVI. The difference is the savings to trucks of 2 to 3 minutes and 0.5 to 1.0 litres of fuel per truck with the new scale. Costs for the inspection station, acceleration/deceleration lanes and 5 km. of 4-laning total $24.8 million. A notional $500,000 recoverable is used to reflect the value of the old site once it is abandoned. The project returns a B/C ratio of 0.68 without WIM/AVI and .75 with WIM/AVI at a 10% discount rate and 1.17 and 1.26 at the Provincially recommended 6% discount rate. The rationale for the project includes the broader economic development and equity goals for Northern BC, implementation of the National CVIS network and enhancing north/south trade routes, in this case between the lower 48 states and Alaska via Canada.
Apex Engineering Limited page i

Contents
1 Background..............................................................................................3
2 General Assumptions...............................................................................5 2.1 Options ...................................................................................................... 5 2.2 Costs and Benefits .................................................................................... 6 2.3 Base Case Assumptions ........................................................................... 6 2.4 WIM/AVI .................................................................................................... 7 2.5 Traffic......................................................................................................... 8
3 Safety Performance .................................................................................9 3.1 Railway Avenue/Highway 97 Intersection ................................................. 9 3.2 Highway 97 at the New Scale Site .......................................................... 10 3.3 Safety Benefits of WIM/AVI ..................................................................... 11
4 Truck Fuel Saving Benefits ....................................................................13
5 Truck Time Saving Benefits ...................................................................17
6 Pavement Life Benefits ..........................................................................19
7 Financial Account...................................................................................22 7.1 Highway and Site Construction ............................................................... 22 7.2 Transponders .......................................................................................... 22 7.3 Auditing.................................................................................................... 24
8 Advancement of Federal and Provincial Transportation Strategies .......26
9 Benefit Cost Analysis .............................................................................27 9.1 Results..................................................................................................... 27 9.2 Sensitivity Analysis .................................................................................. 29
Apex Engineering Limited page ii

Benefit Cost - Highway 97 Red Rock 4-Laning and CVIS
Benefit Cost Analysis Highway 97 – Red Rock 4-Laning and Commercial Vehicle
Inspection Station
1 Background The existing Prince George South Weigh Scale is a bi-directional facility located within the City Limits at the intersection of Highway 97 and Railway Avenue (seg 1150, lki 111.75) at the south end of the Simon Fraser Bridge. The proposal is to relocate the weigh scale up to 25 km further south on Highway 97 and add weigh in motion (WIM) and automatic vehicle Identification (AVI). There are several reasons:
Exhibit 1-1 General Location • The existing scale is
congested and during busy periods it must close to prevent traffic from backing up onto Highway 97.
• Public consultation has
underlined the public pressure to relocate the scale from its current location.
• Commercial traffic is able
to bypass the existing scales using city streets and bridges.
• Access into and through
the existing scale is poor and left turns exiting the scale conflict with NB trucks entering the scale.
• The new location would be
suitable for WIM/AVI which allows safe, legal trucks to bypass the scale and is eligible for Federal/Provincial cost sharing
Apex Engineering Limited page 3

Benefit Cost - Highway 97 Red Rock 4-Laning and CVIS
• The existing station will have to close for operational reasons. A new inspection station is required to ensure continued commercial vehicle safety compliance.
• The new scale would be constructed concurrent with 4-laning the adjacent
section of Highway 97 consistent with the Caribou Connector vision of a 4-lane highway linking Cache Creek to Prince George.
• There is increasing land use competition from the adjacent CN rail yard.
Exhibit 1-2 Prince George South Weigh Scale
Prince George
Highway 97
Scale
The user impacts of the relocation are expected to include reduced delay commercial vehicles, improved safety at the Railway Avenue intersection, improved commercial vehicle compliance, reduced commercial vehicle operating costs and improved safety on the new 4-lane section.
Apex Engineering Limited page 4
Benefit Cost - Highway 97 Red Rock 4-Laning and CVIS
2 General Assumptions
2.1 Options
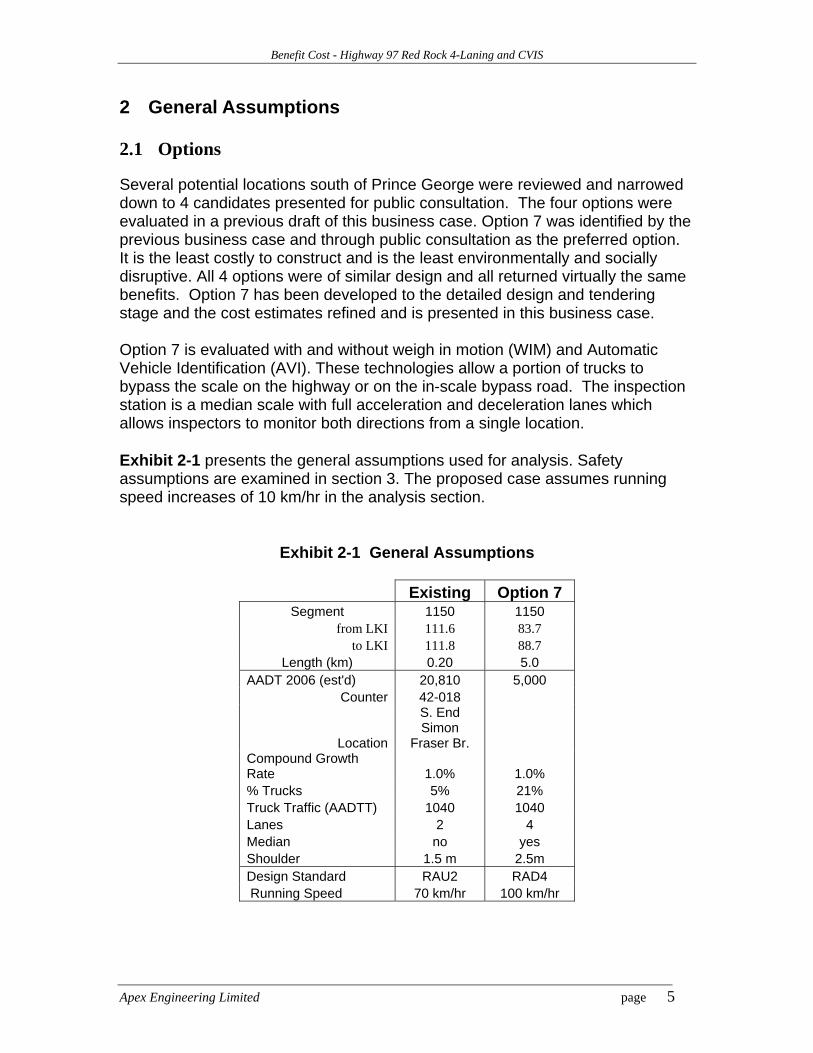
Several potential locations south of Prince George were reviewed and narrowed down to 4 candidates presented for public consultation. The four options were evaluated in a previous draft of this business case. Option 7 was identified by the previous business case and through public consultation as the preferred option. It is the least costly to construct and is the least environmentally and socially disruptive. All 4 options were of similar design and all returned virtually the same benefits. Option 7 has been developed to the detailed design and tendering stage and the cost estimates refined and is presented in this business case. Option 7 is evaluated with and without weigh in motion (WIM) and Automatic Vehicle Identification (AVI). These technologies allow a portion of trucks to bypass the scale on the highway or on the in-scale bypass road. The inspection station is a median scale with full acceleration and deceleration lanes which allows inspectors to monitor both directions from a single location. Exhibit 2-1 presents the general assumptions used for analysis. Safety assumptions are examined in section 3. The proposed case assumes running speed increases of 10 km/hr in the analysis section.
Exhibit 2-1 General Assumptions
Existing Option 7 Segment 1150 1150
from LKI 111.6 83.7 to LKI 111.8 88.7
Length (km) 0.20 5.0 AADT 2006 (est'd) 20,810 5,000
Counter 42-018
Location
S. End Simon
Fraser Br. Compound Growth Rate 1.0% 1.0% % Trucks 5% 21% Truck Traffic (AADTT) 1040 1040 Lanes 2 4 Median no yes Shoulder 1.5 m 2.5m Design Standard RAU2 RAD4 Running Speed 70 km/hr 100 km/hr
Apex Engineering Limited page 5

Benefit Cost - Highway 97 Red Rock 4-Laning and CVIS
2.2 Costs and Benefits
The benefits evaluated include: • Reduction in accidents at the Railway Avenue/Highway 97 intersection
where the existing scale traffic enters the scale at a signalized intersection • Reduction in accidents on the new 5 km 4-lane divided section associated
with the scale site development • Time and vehicle operating cost savings to motor carriers using the new
inspection station • Time savings to local industrial traffic accessing Railway Avenue • Improved motor carrier compliance • Reduced pavement damage
The costs evaluated include:
• Property, engineering and construction associated with site and 4-lane road network
• On-board units (OBU’s) or transponders, which the motor carriers must purchase in order to make use of the proposed WIM/AVI facility.
• Potential recoverables from the disposition of the existing site. • Operating and maintenance costs associated with the WIM/AVI and
transponder operations • Incremental pavement maintenance and resurfacing costs associated with
a new 4-lane highway section Permit and Fine revenue are not included in the analysis since, in the social context, these are considered transfers, not costs or benefits. Typically the fine and permit revenue is equal to or exceeds the scale operating costs.
2.3 Base Case Assumptions
In the event that the proposed CVIS and 5 km of highway upgrade do not proceed, some alternate “do-minimum” solution must still be pursued. This CVIS is at a key location in the Provincial Highway System, capturing traffic from both Highway 97 and Highway 16. Eliminating the station altogether is not an option. The existing site is now within the urban Price George area and would have to be extensively reconfigured and additional industrial property purchased to make it compatible with a proposed 4-laning project at this location. For planning purposes, this is considered to be the “do-minimum” option and would add an estimated $6 million ($2006) to the cost of the proposed 4 laning on the south approach to Prince George. This cost is subtracted from the cost of the proposed relocation options to get the net cost of the project for benefit cost analysis. The do minimum option would make the scale operational at its current location but would have no significant benefit above the current facility and is the primary reason for the proposed relocation.
Apex Engineering Limited page 6

Benefit Cost - Highway 97 Red Rock 4-Laning and CVIS
2.4 WIM/AVI
Benefits of WIM/AVI (time, fuel, compliance, pavements etc.) depend on how many motor carriers have compatible transponders or other on-board units (OBU’s) capable of communicating with the Automatic Vehicle Identification (AVI) system. The participation rate assumptions are presented in Exhibit 2-2. The analysis assumes that the Prince George South Scale will be part of a broader network of inspection stations with Automatic Vehicle Identification (AVI) capability but the analysis considers only benefits and costs directly attributable to this station. Network level costs or benefits are not included in this analysis.
Exhibit 2-2 WIM/AVI Participation Rate
Participation Rate Year Trucks with
TRANSPONDER Current Year 2006 0% Startup Year 2008 50%
Intermediate Year 2016 60% Horizon Year 2031 60%
Equivalent Annual Growth (%/yr)
from to growth 2006 2008 0% 2008 2016 1.3% 2016 2031 0.0%
Apex Engineering Limited page 7

Benefit Cost - Highway 97 Red Rock 4-Laning and CVIS
2.5 Traffic
Traffic volumes in Exhibit 2-3 are from counter 42-018 south of the Simon Fraser Bridge and next to the existing inspection station and permanent count station P41-1 located 37 km south of the bridge and south of the bridge and 12 km south of the Option 7 location.
Exhibit 2-3 Historical and Projected AADT
0
5,000
10,000
15,000
20,000
25,000
30,000
1980 1985 1990 1995 2000 2005 2010 2015 2020 2025 2030 2035
AA
DT
42-018 AADT Forecast P41-1
Apex Engineering Limited page 8

Benefit Cost - Highway 97 Red Rock 4-Laning and CVIS
3 Safety Performance
3.1 Railway Avenue/Highway 97 Intersection
The accident analysis uses data for 7 years from 1996 to 2002. The estimated existing accident rate at the Highway 97/Railway Avenue intersection where the trucks enter the existing scale is 0.28 a/mev which is above the Provincial average 0.17 a/mev for intersections of this service class. Removing traffic from the intersection will eliminate about 1.4 intersection accidents per year.
Exhibit 3-1 Accident Rate at Railway Ave/Highway 97 Intersection
Observed Accidents Railway Ave/Hwy 97 1996 to 2002 Segment 1150
Start LKI 111.60 Finish LKI 111.80
Length (km) 0.20 Service Class RAU2 AADT Average 19,905 Years 7 Exposure (mev) 51 Fat Inj PDO All
Intersection Accidents 0 8 6 14 Observed Rate (a/mev) 0.000 0.16 0.12 0.28
Severity 0.0% 57.1% 42.9% 100.0% 1996 to 2002 Predicted Base Case Accidents Fat Inj PDO All
Intersection Accidents Number 0.26 7.0 6.7 14.0
Predicted Rate (a/mev) 0.005 0.14 0.13 0.28 Severity 1.8% 50.1% 48.1% 100.0%
1996 to 2002
Proposed Case Accidents Fat Inj PDO All
Intersection Accidents Number 0.1 2.2 2.1 4.3
Predicted Rate (a/mev) 0.002 0.04 0.04 0.08 Severity 1.8% 50.1% 48.1% 100.0%
Apex Engineering Limited page 9

Benefit Cost - Highway 97 Red Rock 4-Laning and CVIS
3.2 Highway 97 at the New Scale Site
Safety benefits occur at the new sites where the existing 2 lane highway is reconstructed to a 4 lane divided cross section in the vicinity of the scale. The estimated existing accident rate on Highway 97 in the vicinity of the new inspection station is 0.32 a/mvk which is the same as the Provincial average for rural 2-lane sections with little or no access. Accident severity will be reduced but accident rate will decline only slightly if at all at the new location.
Exhibit 3-2 Accident Rates at Proposed Scale Location
Observed Accidents Hwy 97 1996 to 2002 Segment 1150
Start LKI 88.00 Finish LKI 100.91
Length (km) 12.91 Service Class RAU2 AADT Average 4,783 Years 7 Exposure (mvk) 157.8 Fat Inj PDO All
Accidents 4 24 23 51 Observed Rate (a/mev) 0.025 0.15 0.15 0.32
Observed Severity 7.8% 47.1% 45.1% 100.0% Provincial Avg. Severity 2.8% 49.5% 47.7% 100.0%
1996 to 2002
Proposed Case Accidents Fat Inj PDO All RAD4
Number 0.7 23.1 23.6 47.3 Predicted Rate (a/mev) 0.004 0.15 0.15 0.30
Severity 1.8% 50.1% 48.1% 100.0%
Apex Engineering Limited page 10

Benefit Cost - Highway 97 Red Rock 4-Laning and CVIS
3.3 Safety Benefits of WIM/AVI
Safety benefits associated with the proposed WIM/AVI technology stem from two sources: • Inspectors at an ECRI station have more time to focus on non-compliant
operators or trucks • There is likely to be a reduction in the number of non-compliant vehicles
allowed to bypass a station during peak periods when queues were forming at the old station.
The potential safety benefits of preventing queues at inspection stations from backing up onto mainline traffic lanes are specifically excluded from the analysis. Queues should not be allowed to back up onto the mainline in the first place. Queuing vehicles onto a mainline will cause more accidents than are saved by inspecting them. This is generally recognized and inspectors at congested stations routinely close the station temporarily during peak periods until the queue clears. Most of the research relating safety benefits to WIM/AVI implementation suggests there is little evidence of a direct safety benefit. There may be several reasons for this: • The goal of WIM/AVI in many cases may not be increased safety. The goal
may be to maintain the present level of safety without increasing staff to accommodate future traffic growth. While this may be true, this analysis takes the position that there are small savings in both safety and future staffing requirements.
• There is generally not a long history of this technology that can be traced in a before/after accident rate analysis to identify safety impacts.
• The benefit may be small enough that it is hidden by other background changes in the truck accident environment.
• The number of truck accidents with vehicle defects or other causal factors under the direct influence of commercial vehicle inspection programs is a limited sample size compared to the accident population at large.
The effect is unknown but there is likely a safety benefit to improved enforcement and compliance and so for analysis purposes a 0.5% reduction in truck accidents is assumed within the zone of influence of an inspection station for participating trucks. In this case the zone of influence is assumed to be 263 k which is the half the length of primary highway between this scale and adjacent scales at Quesnel, Vanderhoof, Prince George North and Tete Jaune Cache.
Apex Engineering Limited page 11

Benefit Cost - Highway 97 Red Rock 4-Laning and CVIS
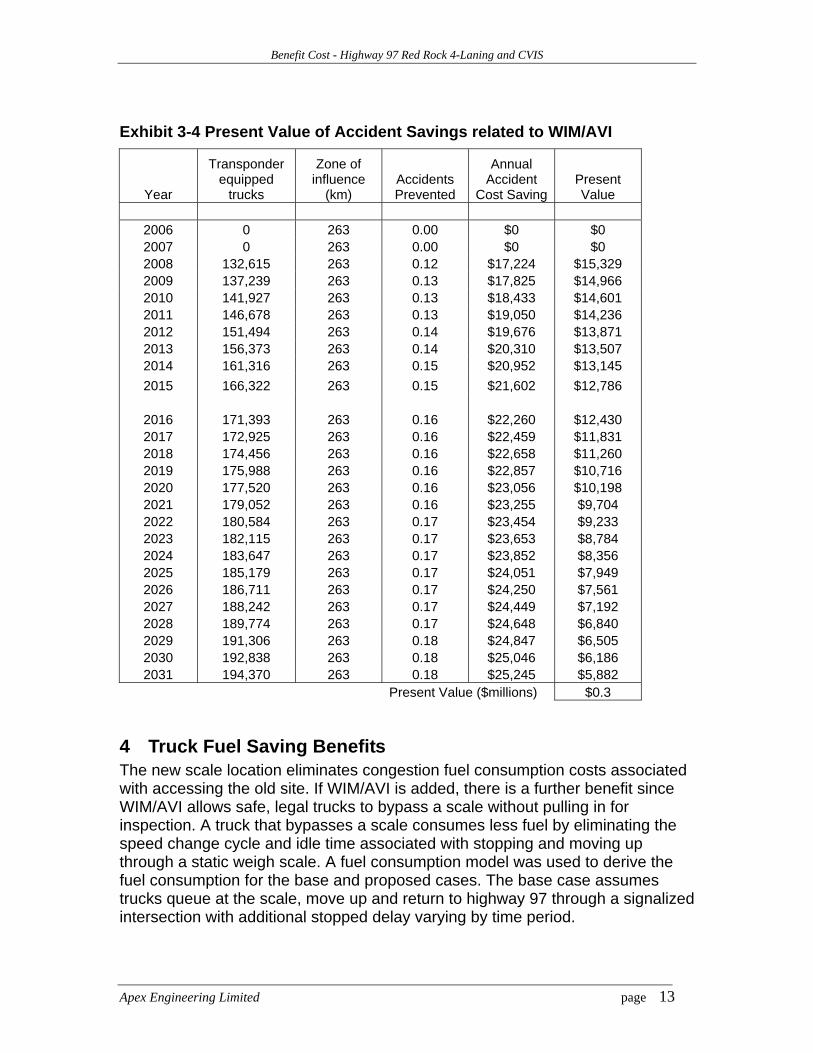
The participation rate (carriers with transponders) is used as a proxy measure for the extent of the safety impact. Participating trucks are generally those with the best safety records. The real target for safety is actually the carriers who are not participating, but the greater the participation rate the greater the number of trucks that are known to be safe and also the more time inspectors can devote to carriers most likely to have safety violations. The assignment of benefits, general assumptions and present value calculations are presented in Exhibit 3-3 and Exhibit 3-4.
Exhibit 3-3 Safety Assumptions Associated with WIM/AVI
Weigh Scale Zone of safety influence (km) 263
Typical truck accident rate (a/mvk) 0.7 Assumed reduction due to better
enforcement 0.50%
Perspective Notes Average Truck
Accident CostSocial Severity Unit Cost Distribution (Comprehensive cost) Fatal $5,693,954 2.5%
Injury $99,999 35.5% PDO $7,342 62%
100.0% $182,401
Apex Engineering Limited page 12
Benefit Cost - Highway 97 Red Rock 4-Laning and CVIS
Exhibit 3-4 Present Value of Accident Savings related to WIM/AVI
Year
Transponder equipped
trucks
Zone of influence
(km) Accidents Prevented
Annual Accident
Cost SavingPresent Value
2006 0 263 0.00 $0 $0 2007 0 263 0.00 $0 $0 2008 132,615 263 0.12 $17,224 $15,329 2009 137,239 263 0.13 $17,825 $14,966 2010 141,927 263 0.13 $18,433 $14,601 2011 146,678 263 0.13 $19,050 $14,236 2012 151,494 263 0.14 $19,676 $13,871 2013 156,373 263 0.14 $20,310 $13,507 2014 161,316 263 0.15 $20,952 $13,145 2015 166,322 263 0.15 $21,602 $12,786
2016 171,393 263 0.16 $22,260 $12,430 2017 172,925 263 0.16 $22,459 $11,831 2018 174,456 263 0.16 $22,658 $11,260 2019 175,988 263 0.16 $22,857 $10,716 2020 177,520 263 0.16 $23,056 $10,198 2021 179,052 263 0.16 $23,255 $9,704 2022 180,584 263 0.17 $23,454 $9,233 2023 182,115 263 0.17 $23,653 $8,784 2024 183,647 263 0.17 $23,852 $8,356 2025 185,179 263 0.17 $24,051 $7,949 2026 186,711 263 0.17 $24,250 $7,561 2027 188,242 263 0.17 $24,449 $7,192 2028 189,774 263 0.17 $24,648 $6,840 2029 191,306 263 0.18 $24,847 $6,505 2030 192,838 263 0.18 $25,046 $6,186 2031 194,370 263 0.18 $25,245 $5,882
Present Value ($millions) $0.3
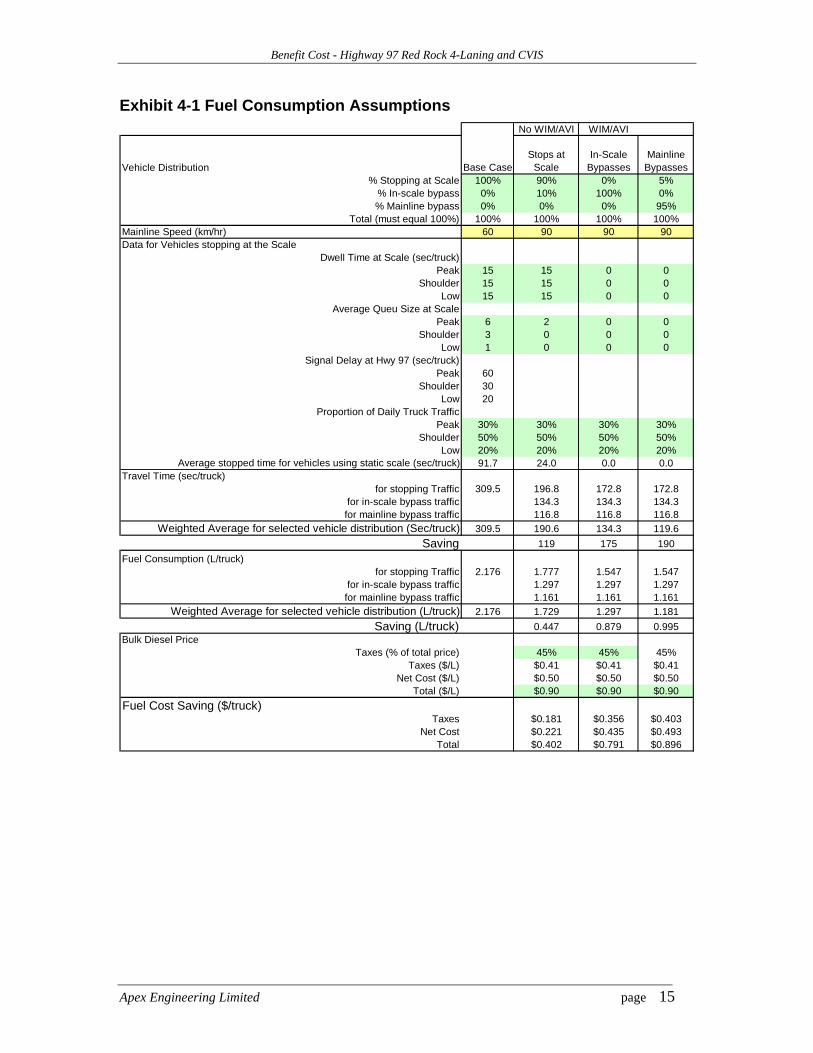
4 Truck Fuel Saving Benefits The new scale location eliminates congestion fuel consumption costs associated with accessing the old site. If WIM/AVI is added, there is a further benefit since WIM/AVI allows safe, legal trucks to bypass a scale without pulling in for inspection. A truck that bypasses a scale consumes less fuel by eliminating the speed change cycle and idle time associated with stopping and moving up through a static weigh scale. A fuel consumption model was used to derive the fuel consumption for the base and proposed cases. The base case assumes trucks queue at the scale, move up and return to highway 97 through a signalized intersection with additional stopped delay varying by time period.
Apex Engineering Limited page 13

Benefit Cost - Highway 97 Red Rock 4-Laning and CVIS
The proposed cases eliminate the signal delay costs. If WIM/AVI is added, there are further savings to in-scale bypass and mainline bypass traffic. The fuel consumption simulation assumes a 5-axle tractor/semi-trailer combination loaded to 27,000 kg GVW traveling 3.0 km. The 3.0-km distance is the same in base and proposed case and is used to allow trucks to fully slow down and accelerate back up to the same speed as mainline bypass trucks would be traveling. Mainline bypasses are assumed to travel at 90 km/hr, in-scale bypasses are assumed to slow to 50 km/hr and scale traffic is assumed to stop and move up several times depending on whether it is peak or off-peak period. The general assumptions are presented in Exhibit 4-1 and the Present Value Calculations are in Exhibit 4-2. An OBU is an On-Board Unit or transponder equipped truck. For analysis purposes it is assumed that all bypasses are mainline bypasses. There are no in-scale bypasses. The fuel saving to a mainline bypass truck is about 1.0 litre/bypass. The present value of fuel savings in excludes taxes as these are considered a transfer, not a cost.
Apex Engineering Limited page 14
Benefit Cost - Highway 97 Red Rock 4-Laning and CVIS
Apex Engineering Limited page 15
Exhibit 4-1 Fuel Consumption Assumptions No WIM/AVI WIM/AVI
Vehicle Distribution Base CaseStops at
ScaleIn-Scale
BypassesMainline
Bypasses% Stopping at Scale 100% 90% 0% 5%
% In-scale bypass 0% 10% 100% 0%% Mainline bypass 0% 0% 0% 95%
Total (must equal 100%) 100% 100% 100% 100%Mainline Speed (km/hr) 60 90 90 90Data for Vehicles stopping at the Scale
Dwell Time at Scale (sec/truck)Peak 15 15 0 0
Shoulder 15 15 0 0Low 15 15 0 0
Average Queu Size at ScalePeak 6 2 0 0
Shoulder 3 0 0 0Low 1 0 0 0
Signal Delay at Hwy 97 (sec/truck)Peak 60
Shoulder 30Low 20
Proportion of Daily Truck TrafficPeak 30% 30% 30% 30%
Shoulder 50% 50% 50% 50%Low 20% 20% 20% 20%
Average stopped time for vehicles using static scale (sec/truck) 91.7 24.0 0.0 0.0Travel Time (sec/truck)
for stopping Traffic 309.5 196.8 172.8 172.8 for in-scale bypass traffic 134.3 134.3 134.3 for mainline bypass traffic 116.8 116.8 116.8
Weighted Average for selected vehicle distribution (Sec/truck) 309.5 190.6 134.3 119.6Saving 119 175 190
Fuel Consumption (L/truck)for stopping Traffic 2.176 1.777 1.547 1.547
for in-scale bypass traffic 1.297 1.297 1.297 for mainline bypass traffic 1.161 1.161 1.161
Weighted Average for selected vehicle distribution (L/truck) 2.176 1.729 1.297 1.181Saving (L/truck) 0.447 0.879 0.995
Bulk Diesel PriceTaxes (% of total price) 45% 45% 45%
Taxes ($/L) $0.41 $0.41 $0.41Net Cost ($/L) $0.50 $0.50 $0.50
Total ($/L) $0.90 $0.90 $0.90Fuel Cost Saving ($/truck)
Taxes $0.181 $0.356 $0.403Net Cost $0.221 $0.435 $0.493
Total $0.402 $0.791 $0.896

Life Cycle CostsWIM/AVI Option Without WIM/AVI OptionStatic Scale In-Scale Bypasses Mainline Bypasses Mainline + In-Scale
Year Trucks/yr
Value of Fuel
SavingsIn-Scale
Bypasses/Yr
Value of Fuel
SavingsMainline
Bypasses/YrValue of Fuel
Savings
Value of Fuel
SavingsPresent Value Trucks/yr
Value of Fuel
SavingsPresent Value
2006 0 $0 0 $0 0 $0 $0 $0 0 $0 $02007 0 $0 0 $0 0 $0 $0 $0 0 $0 $02008 132,615 $53,302 53,046 $41,976 79,569 $71,263 $166,541 $137,637 265,231 $106,603 $88,1022009 127,197 $51,124 53,557 $42,380 87,030 $77,945 $171,449 $128,812 267,784 $107,629 $80,8632010 121,652 $48,895 54,067 $42,784 94,618 $84,741 $176,420 $120,497 270,337 $108,655 $74,2132011 115,978 $46,615 54,578 $43,188 102,334 $91,651 $181,454 $112,669 272,890 $109,681 $68,1032012 110,177 $44,283 55,089 $43,592 110,177 $98,676 $186,551 $105,303 275,443 $110,707 $62,4912013 104,248 $41,900 55,599 $43,996 118,148 $105,815 $191,711 $98,378 277,996 $111,734 $57,3372014 98,192 $39,466 56,110 $44,400 126,247 $113,068 $196,935 $91,871 280,549 $112,760 $52,6032015 92,008 $36,980 56,620 $44,804 134,473 $120,436 $202,221 $85,761 283,102 $113,786 $48,2562016 85,696 $34,444 57,131 $45,209 142,827 $127,918 $207,570 $80,027 285,655 $114,812 $44,2652017 84,541 $33,979 55,720 $44,092 147,947 $132,503 $210,574 $73,805 288,208 $115,838 $40,6012018 83,351 $33,501 54,275 $42,949 153,134 $137,148 $213,598 $68,059 290,761 $116,864 $37,2362019 82,128 $33,009 52,796 $41,779 158,389 $141,855 $216,643 $62,754 293,314 $117,890 $34,1492020 80,870 $32,504 51,284 $40,581 163,713 $146,623 $219,708 $57,856 295,867 $118,916 $31,3142021 79,579 $31,985 49,737 $39,357 169,104 $151,452 $222,794 $53,335 298,420 $119,942 $28,7132022 78,253 $31,452 48,156 $38,106 174,564 $156,342 $225,900 $49,162 300,973 $120,969 $26,3262023 76,893 $30,905 46,541 $36,828 180,092 $161,292 $229,026 $45,312 303,526 $121,995 $24,1362024 75,499 $30,345 44,892 $35,523 185,688 $166,304 $232,172 $41,758 306,079 $123,021 $22,1262025 74,072 $29,771 43,208 $34,191 191,352 $171,377 $235,339 $38,480 308,631 $124,047 $20,2832026 72,610 $29,184 41,491 $32,833 197,083 $176,510 $238,527 $35,455 311,184 $125,073 $18,5912027 71,114 $28,582 39,740 $31,447 202,884 $181,705 $241,734 $32,666 313,737 $126,099 $17,0402028 69,584 $27,968 37,955 $30,034 208,752 $186,960 $244,962 $30,093 316,290 $127,125 $15,6172029 68,020 $27,339 36,136 $28,595 214,688 $192,277 $248,210 $27,720 318,843 $128,151 $14,3122030 66,422 $26,697 34,282 $27,128 220,692 $197,654 $251,479 $25,532 321,396 $129,177 $13,1152031 64,790 $26,041 32,395 $25,635 226,765 $203,093 $254,768 $23,514 323,949 $130,203 $12,017
Total PV of Fuel Savings ($millions) $1.63 $0.93
Benefit Cost - Highway 97 Red Rock 4-Laning and CVIS
Apex Engineering Limited page 16
Exhibit 4-2 Present Value of Fuel Saving Benefits

Benefit Cost - Highway 97 Red Rock 4-Laning and CVIS
Apex Engineering Limited page 17
5 Truck Time Saving Benefits Time savings to Carriers constitute the single largest benefit of a WIM/AVI system. The value of truck time includes the driver's wages plus wage burden and the fixed costs of truck ownership. The inventory cost of cargo is small in relation to these components and is omitted from this analysis. The cost items and time savings per truck are presented in Exhibit 5-1. Without WIM/AVI time savings are in the order of $2.35 per truck. With WIM/AVI savings are about $3.50 for each bypass. The time savings were calculated using the same vehicle simulation model used for fuel savings. The assumptions and present value calculations are presented in Exhibit 5-2.
Exhibit 5-1 Time Savings Assumptions ($/hr) ($/hr) Driver Payroll Cost ($/hr) $34.93 Truck Fixed Costs Yr 2006
Tractor Depreciation $14.06 Tractor Licenses $1.70
Trailer Depreciation $4.19 Trailer Licenses $0.02
Administration $16.18 Subtotal Truck $36.16
Total Time Cost for Truck & Driver ($/hr) $71.09 Base Proposed Cases
Without WIM/AVI With WIM/AVI
Static Scale
Static Scale
In-Scale Bypass
Mainline Bypass
Time (Sec/truck) 309.5 190.6 134.3 119.6 Average Time Saving (sec/truck) 118.9 175.1 189.9 Value of time saving ($/truck) $2.35 $3.46 $3.75

Benefit Cost - Highway 97 Red Rock 4-Laning and CVIS
Apex Engineering Limited page 18
Exhibit 5-2 Present Value of Time Savings With WIM/AVI Equipped Scale Without WIM/AVI Equipped Scale
Static Scale In-Scale Bypasses Mainline Bypasses All Trucks
Year
In-Scale Bypasses/
Yr
Value of Time
SavingsIn-Scale
Bypasses/YrValue of Time
SavingsMainline
Bypasses/Yr
Value of Time
Savings
Value of Time
SavingsPresent Value Year
Scale Traffic/yr
Value of Time
SavingsPresent Value
2,006 0 $0 0 $0 0 $0 $0 $0 2,006 260,125 $0 $02,007 0 $0 0 $0 0 $0 $0 $0 2,007 262,678 $0 $02,008 132,615 $311,375 53,046 $183,445 75,591 $283,443 $778,263 $643,192 2,008 265,231 $622,751 $514,6702,009 127,197 $298,654 53,557 $185,210 82,678 $310,019 $793,883 $596,456 2,009 267,784 $628,745 $472,3852,010 121,652 $285,633 54,067 $186,976 89,887 $337,049 $809,658 $553,007 2,010 270,337 $634,739 $433,5352,011 115,978 $272,312 54,578 $188,742 97,217 $364,534 $825,588 $512,625 2,011 272,890 $640,733 $397,8452,012 110,177 $258,691 55,089 $190,508 104,668 $392,474 $841,673 $475,103 2,012 275,443 $646,728 $365,061
2,013 104,248 $244,771 55,599 $192,273 112,241 $420,869 $857,913 $440,245 2,013 277,996 $652,722 $334,950
2,014 98,192 $230,551 56,110 $194,039 119,935 $449,719 $874,308 $407,871 2,014 280,549 $658,716 $307,2962,015 92,008 $216,031 56,620 $195,805 127,750 $479,023 $890,858 $377,811 2,015 283,102 $664,710 $281,9022,016 85,696 $201,211 57,131 $197,571 135,686 $508,782 $907,563 $349,905 2,016 285,655 $670,705 $258,5862,017 84,541 $198,498 55,720 $192,692 140,549 $527,017 $918,208 $321,826 2,017 288,208 $676,699 $237,1792,018 83,351 $195,705 54,275 $187,695 145,477 $545,496 $928,896 $295,975 2,018 290,761 $682,693 $217,5272,019 82,128 $192,833 52,796 $182,581 150,470 $564,217 $939,630 $272,177 2,019 293,314 $688,688 $199,4882,020 80,870 $189,880 51,284 $177,349 155,527 $583,180 $950,409 $250,272 2,020 295,867 $694,682 $182,9312,021 79,579 $186,847 49,737 $171,999 160,649 $602,386 $961,232 $230,111 2,021 298,420 $700,676 $167,7362,022 78,253 $183,734 48,156 $166,532 165,836 $621,835 $972,101 $211,557 2,022 300,973 $706,670 $153,7922,023 76,893 $180,542 46,541 $160,947 171,087 $641,526 $983,014 $194,484 2,023 303,526 $712,665 $140,9972,024 75,499 $177,269 44,892 $155,244 176,403 $661,459 $993,972 $178,775 2,024 306,079 $718,659 $129,2572,025 74,072 $173,917 43,208 $149,424 181,784 $681,635 ######## $164,321 2,025 308,631 $724,653 $118,4872,026 72,610 $170,484 41,491 $143,485 187,229 $702,053 ######## $151,025 2,026 311,184 $730,647 $108,6062,027 71,114 $166,972 39,740 $137,429 192,739 $722,715 ######## $138,795 2,027 313,737 $736,642 $99,5432,028 69,584 $163,380 37,955 $131,256 198,314 $743,618 ######## $127,545 2,028 316,290 $742,636 $91,2302,029 68,020 $159,708 36,136 $124,964 203,953 $764,764 ######## $117,199 2,029 318,843 $748,630 $83,6062,030 66,422 $155,956 34,282 $118,555 209,658 $786,153 ######## $107,684 2,030 321,396 $754,624 $76,6142,031 64,790 $152,124 32,395 $112,028 215,426 $807,784 ######## $98,935 2,031 323,949 $760,619 $70,202
Total PV of Time Savings ($millions) $7.22 Total PV of Time Savings ($millions) $5.44

Benefit Cost - Highway 97 Red Rock 4-Laning and CVIS
6 Pavement Life Benefits Pavements are generally designed for a fixed number of "Load Equivalency Factors" (LEF's). This is a term used in pavement design to denote the design number of standard axle loadings. If a truck is overloaded, the number of LEF's generated by this truck increases exponentially (to the power of 2.5). With repeated traffic, this has the effect of shortening pavement life and imposing a "Build Sooner" cost for pavement overlays. The pavement benefits assigned to a WIM/AVI system are assessed as a proportion of the potential savings based on the participation rate. The potential savings are assessed by first defining a base and proposed case. With lower enforcement conditions where scales are open intermittently or there are un-enforced scale bypass routes available, it is assumed that 5% of trucks are overloaded by 15% of their registered gross vehicle weight. In a higher enforcement condition, it is assumed that WIM/AVI allows inspection staff to better target habitual offenders and bring the proportion of overloaded trucks down to 1.5% with a 10% overload within the zone of influence of the inspection station. In a slightly lower enforcement environment without WIM/AVI at the new station, pavement benefits are assumed to be 40% lower for analysis purposes. General assumptions and potential cost savings are presented in Exhibit 6-1 and Present Value calculations in Exhibit 6-2 The detailed Load Equivalency Factor calculations depend on the truck axle configuration and load distribution. These calculations have been modeled separately for this report but are not presented here.
Apex Engineering Limited page 19

Benefit Cost - Highway 97 Red Rock 4-Laning and CVIS
Exhibit 6-1 Pavement Cost Savings Assumptions
Base Case Proposed Case
Overloaded Trucks 5.0% 1.5% Magnitude of Overload 15% 10%
Load Equivalency Factor (LEF) 1.96 1.75 Pavement Life (yrs) 15.0 16.8 Typical Overlay Cost ($/2-ln-km) $60,000 $60,000 Equivalent Annual Cost ($/2-ln-km/yr) $4,000 $3,572
Costs Saving due to reduced Overloading ($/2-ln-km/yr) $428
Zone of Influence/scale (km/scale) 263 Potential pavement cost saving /yr
With WIM/AVI $112,333 Without WIM/AVI $67,400
Apex Engineering Limited page 20

Benefit Cost - Highway 97 Red Rock 4-Laning and CVIS
Exhibit 6-2 Present Value of Pavement Cost Savings
Year Participation
Rate
Annual pavement cost saving/scale Total Cost Present Value
2006 0% $0 $0 $0
2007 0% $0 $0 $0
2008 50% $56,167 $56,167 $46,419
2009 53% $58,975 $58,975 $44,309
2010 55% $61,783 $61,783 $42,199
2011 58% $64,591 $64,591 $40,106
2012 60% $67,400 $67,400 $38,045
2013 63% $70,208 $70,208 $36,028
2014 65% $73,016 $73,016 $34,063
2015 68% $75,825 $75,825 $32,157
2016 70% $78,633 $78,633 $30,316
2017 71% $79,382 $79,382 $27,823
2018 71% $80,131 $80,131 $25,532
2019 72% $80,880 $80,880 $23,428
2020 73% $81,629 $81,629 $21,495
2021 73% $82,378 $82,378 $19,721
2022 74% $83,126 $83,126 $18,091
2023 75% $83,875 $83,875 $16,594
2024 75% $84,624 $84,624 $15,220
2025 76% $85,373 $85,373 $13,959
2026 77% $86,122 $86,122 $12,801
2027 77% $86,871 $86,871 $11,739
2028 78% $87,620 $87,620 $10,764
2029 79% $88,369 $88,369 $9,869
2030 79% $89,118 $89,118 $9,048
2031 80% $89,866 $89,866 $8,294
Total PV ($millions)
With WIM/AVI $0.59
Without WIM/AVI $0.35
Apex Engineering Limited page 21

Benefit Cost - Highway 97 Red Rock 4-Laning and CVIS
Apex Engineering Limited page 22
7 Financial Account
7.1 Highway and Site Construction
Exhibit 7-1 presents the capital cost assumptions (Dec 2006 estimate) used for analysis. There is and additional line item for recoverables. This is a notional amount included to account for disposition of the existing scale site. The revenue would not accrue to this project but is a recoverable from the general revenue perspective and reflects the value of the resource.
Exhibit 7-1 Project Costs
Option 7 Engineering & Mgmt Reserve $1,150,000
+ Land $2,000,000 + Construction $21,660,000 - Recoverables $300,000
= Total $24,510,000
7.2 Transponders
In order for a compliant vehicle to bypass a scale it must be carrying a transponder which identifies the vehicle to the inspection station and receives a bypass signal back form the station. The cost assumptions for transponders are presented In Exhibit 7-2 below. The failure rate is used to determine the cost of replacements over the analysis period.
Exhibit 7-2 Transponder Assumptions Transponder at cost ($/unit) $45 Registration and Handling ($/unit) $10
Cost $55 Transponder failure rate/yr 4% The present value of transponder costs is calculated in Exhibit 7-3 and assumes a rapid take-up during the initial 5 years of the benefit period and slowing during the latter years, reaching a plateau where 50% of trucks entering the scales are equipped with a transponder. The unit cost of transponders is assumed to decline 2% each year to reflect improved technology and production.

Benefit Cost - Highway 97 Red Rock 4-Laning and CVIS
Apex Engineering Limited page 23
Exhibit 7-3 Transponder Life Cycle Cost Assumptions Number of Transponders Capital Cost Replacements Cost
Year Trucks/yr
through scale(s)
Trans-ponder Usage
Trans-ponders
New Transponders
each year Unit Cost
Total Cost for New
transponders
Present Value for new units
Replacements for failed
transponders Total Cost for replacements
Present Value of
replacements 2006 260,125 0% 0 0 $55.00 $0 $0 0 $0 $0 2007 262,678 0% 0 0 $53.90 $0 $0 0 $0 $0 2008 265,231 50% 2,210 2,210 $52.82 $116,750 $96,488 88 $4,670 $3,860 2009 267,784 53% 2,343 133 $51.77 $6,877 $5,167 94 $4,852 $3,645 2010 270,337 55% 2,478 135 $50.73 $6,848 $4,677 99 $5,029 $3,435 2011 272,890 58% 2,615 137 $49.72 $6,816 $4,232 105 $5,201 $3,229 2012 275,443 60% 2,754 139 $48.72 $6,784 $3,829 110 $5,368 $3,030 2013 277,996 63% 2,896 141 $47.75 $6,750 $3,464 116 $5,531 $2,838 2014 280,549 65% 3,039 143 $46.79 $6,714 $3,132 122 $5,689 $2,654 2015 283,102 68% 3,185 146 $45.86 $6,677 $2,832 127 $5,842 $2,478 2016 285,655 70% 3,333 148 $44.94 $6,639 $2,560 133 $5,991 $2,310 2017 288,208 71% 3,394 62 $44.04 $2,722 $954 136 $5,980 $2,096 2018 290,761 71% 3,457 62 $43.16 $2,692 $858 138 $5,968 $1,902 2019 293,314 72% 3,520 63 $42.30 $2,662 $771 141 $5,955 $1,725 2020 295,867 73% 3,583 64 $41.45 $2,632 $693 143 $5,941 $1,564 2021 298,420 73% 3,647 64 $40.62 $2,603 $623 146 $5,926 $1,419 2022 300,973 74% 3,712 65 $39.81 $2,573 $560 148 $5,911 $1,286 2023 303,526 75% 3,777 65 $39.01 $2,544 $503 151 $5,894 $1,166 2024 306,079 75% 3,843 66 $38.23 $2,515 $452 154 $5,877 $1,057 2025 308,631 76% 3,909 66 $37.47 $2,486 $406 156 $5,859 $958 2026 311,184 77% 3,976 67 $36.72 $2,457 $365 159 $5,840 $868 2027 313,737 77% 4,044 67 $35.98 $2,428 $328 162 $5,820 $787 2028 316,290 78% 4,112 68 $35.26 $2,400 $295 164 $5,800 $713 2029 318,843 79% 4,180 69 $34.56 $2,371 $265 167 $5,779 $645 2030 321,396 79% 4,250 69 $33.87 $2,343 $238 170 $5,757 $584 2031 323,949 80% 4,319 70 $33.19 $2,315 $214 173 $5,734 $529
Total PV (millions($millions) $0.13 Total PV ($millions) $0.04

Benefit Cost - Highway 97 Prince George South Weigh Scale
Apex Engineering Limited page 24
7.3 Auditing
The auditing role includes quality control checks on the system and confirming safety ratings and credentials for each fleet enrolled in the program at registration and on an annual basis thereafter. The general assumptions are presented in Exhibit 7-4 and the present value calculations in Exhibit 7-5
Exhibit 7-4 Auditing Cost Assumptions National
Average Fleet Size
% of Fleets1
Hrs/fleet Audit
1 62.2% 0.3 4 5.6% 0.5 7 15.5% 0.7 15 10.0% 1.2 35 4.7% 2.3 75 1.1% 4.6 100 0.9% 6.1 6.8 Weighted
Average 0.66
6.8 Average Fleet Size
100% Annual Fleet Sampling rate 0.66 Average fleet Audit time (hrs/audit)
$20.00 Audit Wage ($/hr) 125% Overhead and wage burden $45 Charge rate ($/hr) $30 Cost/fleet audit
1 R.A. Barton, "Profile of Private Trucking" presented to the Private Motor Truck Council of Canada, 1997 Annual General Meeting and Conference, Sept 9, 1997 Toronto Airport Hilton.

Benefit Cost - Highway 97 Prince George South Weigh Scale
Exhibit 7-5 Present Value of Auditing Costs
Year TRANSPONDERS
Fleet Audit
s Audit Cost Present Value
2006 0 0 0 $0 2007 0 0 0 $0 2008 2,210 323 9,563 $7,903 2009 2,343 343 10,138 $7,617 2010 2,478 362 10,722 $7,323 2011 2,615 382 11,315 $7,026 2012 2,754 403 11,917 $6,727 2013 2,896 423 12,529 $6,429 2014 3,039 444 13,150 $6,134 2015 3,185 466 13,780 $5,844 2016 3,333 487 14,419 $5,559 2017 3,394 496 14,686 $5,148 2018 3,457 506 14,956 $4,766 2019 3,520 515 15,229 $4,411 2020 3,583 524 15,503 $4,083 2021 3,647 533 15,781 $3,778 2022 3,712 543 16,060 $3,495 2023 3,777 552 16,342 $3,233 2024 3,843 562 16,627 $2,991 2025 3,909 572 16,914 $2,766 2026 3,976 582 17,204 $2,557 2027 4,044 591 17,496 $2,364 2028 4,112 601 17,790 $2,185 2029 4,180 611 18,087 $2,020 2030 4,250 621 18,386 $1,867 2031 4,319 632 18,688 $1,725
($millions) Total Present Value $0.11
Apex Engineering Limited page 25

Benefit Cost - Highway 97 Prince George South Weigh Scale
8 Advancement of Federal and Provincial Transportation Strategies
Linkages to Federal initiatives include:
Federal Strategy Highway 97 – Red Rock CVIS and 4-Laning
• Strategic Highway Infrastructure Program
• Canada Strategic Infrastructure Fund
Supports resource development in Northern BC, is a major north south trade route on the National Highway System, adheres to TAC guidelines, improves highway safety
• Border Infrastructure Fund This is part of the Highway 97 North/South Trade Route from the US to Alaska
• Asia Pacific Gateway and Corridor Initiative
• No direct impact
• Greenhouse Gas Reduction (tonnes/yr)
• Carbon Dioxide, 318 • Nitrogen Oxide, 10 • Hydrocarbons, 14 • Annual Saving (tonnes/yr), 342
• Transport Canada, in partnership with the provinces and territories, is considering the establishment of a national Commercial Vehicle Operations (CVO) network.
• This project with AVI/WIM Supports the Federal objectives to improve efficiency in the National CV Network. This can be considered part of a National Network, not an individual station.
In the Provincial context, this project is consistent with the vision for the 4-lane Cariboo Connector from Cache Creek to Prince George. It also addresses one of the highest volume locations on the corridor. Linkages to Provincial Plans include:
Provincial Strategy Highway 97 – Red Rock CVIS and 4-Laning
• Cariboo Connector • Lies within the Cariboo Connector and supports this vision
• Mountain Pine Beetle Strategy -Includes $90 million for rehabilitation of highways impacted by increased logging traffic carrying beetle-killed timber
• Highway 97 between Prince George and Cache Creek is heavily impacted by Pine Beetle forest products traffic. Many of the major mills are located in and around Prince George
• Safety and Mobility • Supports both objectives
Apex Engineering Limited page 26

Benefit Cost - Highway 97 Prince George South Weigh Scale
9 Benefit Cost Analysis
9.1 Results
The benefit cost analysis is summarized in Exhibit 9-1 for Option 7 which was the preferred option identified from public consultation and from a lowest cost perspective. The other options previously analysed had similar benefits but higher costs and social and environmental impacts and are not repeated here. Benefits stem primarily from reduced congestion around the existing scale site. The single largest benefit is time savings to commercial vehicles with a present value of $5.4 million without WIM/AVI and $7.0 million with WIM/AVI using the Federal 10% discount rate. In the case of the Prince George South Scale, a transponder equipped truck bypassing the scale saves about $3.75 per bypass since they no longer have to queue at the scales or the lights on Railway Avenue to enter or exit the scales. Time savings also accrue to automobiles accrue from a reduction in signal delay at Railway Avenue after the truck turning movements area removed from the intersection. On Highway 97 in the vicinity of the new scale, there are minor time savings associated with the higher operating speeds for automobiles on the 4-lane cross section. Accident Cost Savings with a present value of $2.4 million stem form a reduction in accidents at the Railway Avenue intersection where the minor street volume will decline as the scale is moved. There is also a safety benefit from a reduction in accident severity in the vicinity of the new scale by upgrading 5 km from a 2 lane to a 4-lane divided cross section. Vehicle operating cost savings are dominated by fuel savings to participating transponder equipped trucks which bypass the scale. Fuel savings are close to 1 litre per bypass truck achieved by avoiding the excess fuel consumption associated with the scale queue, signal delay and acceleration back up to ambient speed. Other fuel savings are also achieved by the reduced signal delay at the Railway Avenue intersection. Overall benefits exceeding $11 million are very good and the project is consistent with federal goals of improving efficiency of the commercial vehicle network and north/south trade routes and Provincial goals of 4-laning the Cariboo Connector between Cache Creek and Prince George.
Apex Engineering Limited page 27

Benefit Cost - Highway 97 Prince George South Weigh Scale
Exhibit 9-1 Benefit Cost Analysis Prince George South Weigh Scale
OptionMedian Scale and 5
km of 4-Lane Add Wim/AVICOSTS
Capital Costs:Property $2.0 $2.0
Engineering $1.2 $1.2Construction $21.7 $21.7
WIM/AVI $0.0 $1.5Transponders $0.0 $0.1
Subtract Recoverables $0.5 $0.5Subtract "Do-Minimum" Cost $6.0 $6.0
Total Capital Costs $18.3 $19.9Operating and Maintenance (Present Value):
WIM/AVI $0.0 $0.2Auditing $0.0 $0.1
Replacement Transponders $0.0 $0.0Incremental Hwy Mtce. $0.1 $0.1
Incremental Resurfacing Cost $0.0 -$0.04Total O&M $0.1 $0.4
Equivalent Annual Amount $0.01 $0.04Salvage (Present Value) $1.8 $1.8Present Value of Costs $16.6 $18.5
BENEFITSTravel Time
Inspection Stn. Delay Reduction $5.5 $7.2Reduced Intersection Delay $1.6 $1.6
Divided 4-lane $1.1 $1.1Subtotal $8.1 $9.9
Vehicle Operating CostsTruck Fuel at Inspection Stn. $0.5 $0.9Reduced Intersection Delay $0.1 $0.1Auto Fuel on Divided 4-lane -$0.4 -$0.4
Subtotal $0.3 $0.6Safety
Improved Compliance $0.2 $0.3Intersection Accidents $0.4 $0.4
Divided 4-lane $1.8 $1.8Subtotal $2.4 $2.5
OtherPavement Life $0.4 $0.6
Inspection Station Staffing $0.1 $0.2Subtotal $0.5 $0.8
Present Value of Benefits $11.3 $13.9Benefit/Cost Ratio 0.68 0.75Net Present Value -$5.3 -$4.6
Apex Engineering Limited page 28

Benefit Cost - Highway 97 Prince George South Weigh Scale
9.2 Sensitivity Analysis
This is intended to reflect the impact of alternate assumptions on the results of the analysis. In this case the NPV is positive at the Provincially recommended 6% discount rate in Exhibit 9-2
Exhibit 9-2 Sensitivity Analysis
10% Discount
Rate
6% Discount
Rate
8% Discount
Rate
+25% Construc-tion Cost
+10% Construc-tion Cost
Traffic Growth 1.5%
Traffic Growt
h 0.5%
Net Present Value (millions $) No
WIM/AVI -5.3 2.4 -2.1 -9.9 -7.1 -5.0 -5.6 With
WIM/AVI -4.6 4.2 -1.0 -9.6 -6.6 -4.3 -5.0 B/C Ratio
No WIM/AVI 0.68 1.17 .86 .53 .61 .70 .67
With WIM/AVI 0.75 1.26 .95 .59 .68 .77 .73
Other risks are minimal. The project has community support. The cost estimates are based on a 100% design submission and the project is expected to be complete by August 2008.
Apex Engineering Limited page 29