beneficial utilization of used foundry … cbu reports/rep-167.pdf · used foundry sands as...
TRANSCRIPT
BENEFICIAL UTILIZATION OF USED FOUNDRY SANDS AS
CONSTRUCTION MATERIALS
By
Tarun R. Naik
Director, Center for By-Products Utilization
Dhaval M. Parikh and Mathew P. Tharaniyil
Research Assistants, Center for By-Products Utilization
Department of Civil Engineering & Mechanics
College of Engineering and Applied Science
University of Wisconsin - Milwaukee
P.O. Box 784, Milwaukee, WI 53201
Telephone: (414) 229 - 6696
Fax: (414) 229 - 6958
-2-
Beneficial Utilization of
Used Foundry Sands as Construction Materials
Tarun R. Naik1
, Dhaval M. Parikh2
, and Mathew P. Tharaniyil2
Abstract
This research was conducted with a view to evaluate the performance of concrete masonry
blocks containing discarded foundry sand as a replacement of fine aggregate. A control mortar mix
for block was proportioned to achieve a 28-day compressive strength of 1500 psi (on the basis of
gross area). Other mixes were also proportioned to replace 35% of regular concrete sand with used
foundry sand by weight on one on one basis. The performance of blocks were evaluated with
respect to compressive strength, water absorption and bulk density, as per ASTM standards. Blocks
made using different foundry sands showed variation in their properties. Technical feasibility of
utilizing discarded foundry sand up to 35% replacement level in manufacturing masonry blocks has
been established with this research.
Introduction
During the 1970's and 1980's, federal and state environmental agencies began to pay
increasing attention to industrial pollution, safety and waste management control. As a result, the
foundry industry had to re-evaluate standard practices with regard to the disposal of their used sands.
One of the main concerns for the foundry industry has been the need to reduce the disposal cost and
minimize the maintenance cost of landfill sites. This was mainly because of the passage of the Public
Law 94-580, the Federal Resource Conservation and Recovery Act of 1976, which is a nationwide
program that regulates and manages by-product disposal (1). The Hazardous and Solid Waste
Amendments of 1984 made the Resource Conservation and Recovery Act (RCAA) even more
stringent. Shrinking landfill space throughout the United States has caused landfill operators to
refuse used foundry sand on the basis of high volume and "special waste" status. Also the disposal
sites accepting used foundry sand charge relatively high tipping.
The typical amounts of total by-product material from foundries range between 500 to 5000
pounds per ton of produced metal casting (2). The foundry by-products disposal is one of the major
concerns to the eastern and midwestern states, as they have the maximum number of foundries.
According to Wisconsin Department of Natural Resources, Solid Waste Section, over 580,000 tons
of foundry by-products were landfilled in 1987, in Wisconsin.
1
Director, Center for By-Products Utilization, Department of Civil Engineering and Mechanics,
UWM, P.O. Box 784, Milwaukee, WI 53201.
2
Research Assistants, Center for By-Products Utilization, Department of Civil Engineering and
Mechanics, UWM, P.O. Box 784, Milwaukee, WI 53201.
-3-
Scope
The objective of this research was to study the feasibility of beneficial utilization of used
foundry sand, in the manufacturing of concrete masonry blocks; as a partial replacement of regular
sand.
An extensive literature search was undertaken and detailed tests were conducted per ASTM
C33, on by-product samples to determine their physical properties and to evaluate their possible uses.
Five mixes were proportioned to replace 35% of regular concrete sand with both used and
clean/new foundry sand to manufacture small size concrete masonry blocks in the laboratory. These
blocks were then tested for compressive strength, bulk density, and water absorption.
Overview of Foundry Sands
Sand is used in this foundry industry mainly for making molds for the casting. This sand is
generally recycled. After a repeated use, they lose their characteristics and thereby becoming
unsuitable for further use in manufacturing process. This sand is usually discarded and dumped in
the landfill as a waste. The following section briefly discusses the different types of used foundry
sands.
Molding Sand
Molding sand is typically compacted around a pattern similar to the casting that is to be
produced. After the pattern is removed the molten metal is poured into the cavity to produce a
casting. Different types of molding sands are used in the foundry industry; the most common being
green sand (3).
Commonly used green sand is composed of sand, clay, sand additives and water. This sand
usually comprises about 50 to 95 percent of the total material in a molding. Clay acts as a binder for
green sand. Clay forms approximately 4 to 10% of green sand mixture. Carbonaceous materials
make up 2 to 10 percent of the green sand mixture. The selection of a carbonaceous material
depends on the specific property or properties described in the molding sand; like surface finish,
easier cleaning, etc. The final additive of green sand is water.
Other types of molding sands include dry sand molding, loam-molding and hard sand
molding. Hard sand molding process involves use of silica sand with a chemical binder system to
form bonds between the individual sand grains thereby producing a hard sand mold.
-4-
Core Sand
Core sands are used to produce internal cavities which are not practical to produce by normal
molding process. Core sands are composed essentially of silica sand mixed with small amount of
binder.
The binders, used for core sand, can be either organic type or nonorganic type. Organic
binders include oil, synthetic, cereal proteins, pitch and wood flour binders. Most of the organic
binders used are synthetic binders. Bonding properties are increased by the use of catalysts. Core
sand mixture, which uses a liquid catalyst for curing is commonly referred as nobake sand.
All types of core sand binders will diminish either partially or completely when exposed to
heating during molten metal pouring. The by-product that result from the core sand is called core
butts. Core butts can be crushed and recycled back into the molding sand process, or may be taken
directly to the landfill for disposal along with broken or off-specification cores and core room
sweepings.
Cleaning Room Sand
After the castings are made, they are cleaned to remove sands and metal protrusions. The
cleaning room sand includes grinding material and steel shots which are used to smoothen the surface
of the casting. Grinding materials consist of silica, silicon carbide alumina and small amounts of
binder.
Furnace or Cupola Dust
Furnace or cupolas emit a large amount of exhausts carrying suspended dust particles.
These are collected by the air pollution control devices and are called cupola dust.
Laboratory Investigation
Materials
Cement
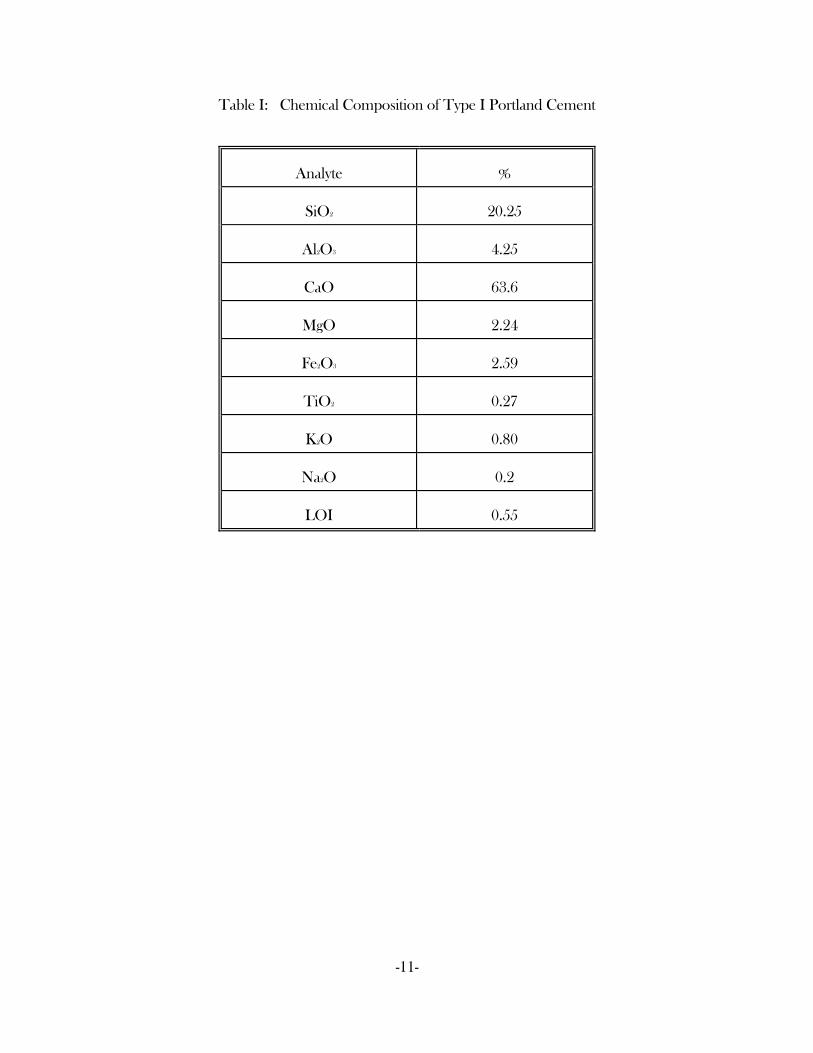
Type I cement obtained from LaFarge Corporation was used in this testing program. The
chemical composition of the cement was studied using x-ray fluorescence. The results are shown in
Table I.
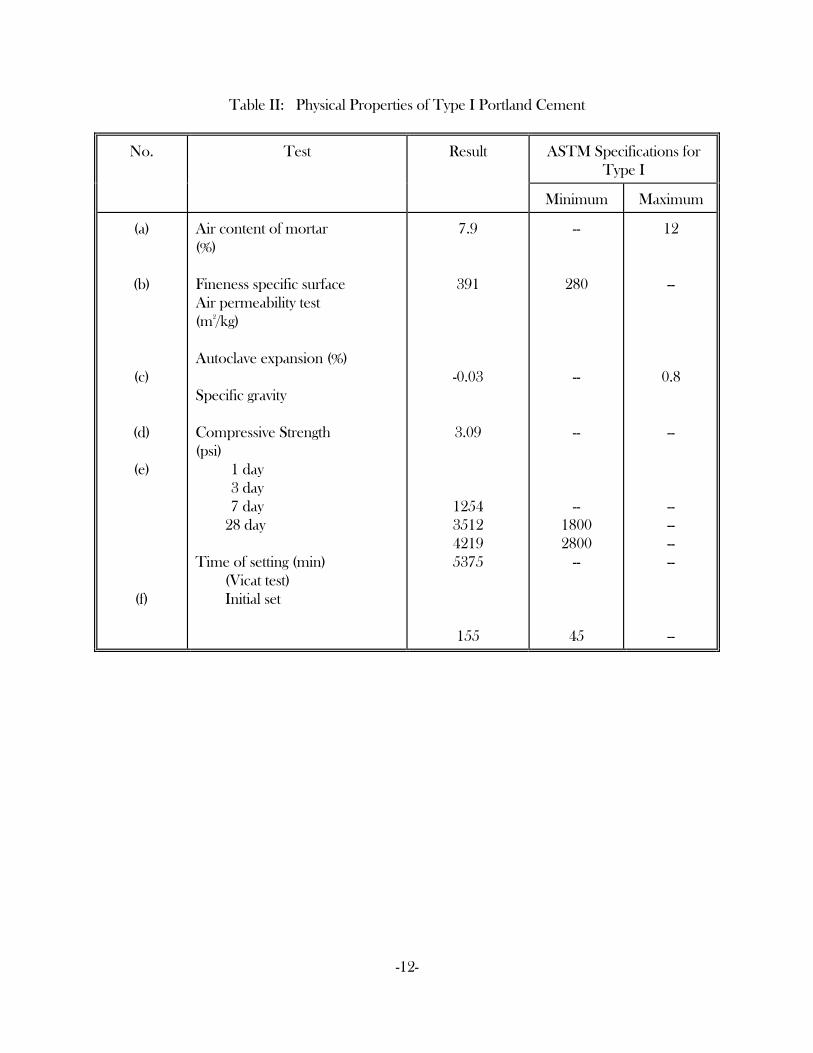
The physical properties of Type I LaFarge Cement were also determined in the laboratory in
accordance with ASTM C150. The temperature and relative humidity in the laboratory were
maintained at 68 C ± 3 F and 42 ± 5% respectively. The following tests were conducted:
-5-
(a) Air Content (ASTM C185)
(b) Fineness by Blain Air Permeability (ASTM C204)
(c) Soundness (ASTM C151)
(d) Specific Gravity (ASTM C188)
(e)Compressive Strength of Hydraulic Cement Mortar (ASTM C109)
(f)Initial and Final Setting Time, Vicat's Apparatus (ASTM C191)
The results of these tests are shown in Table II.
Aggregates
The coarse and fine aggregates used in this research program were obtained from a local
ready mix company. The coarse aggregate was a mixture of crushed and rounded gravel with
maximum size of 3/8". The fine aggregate was natural sand with a 1/4" maximum size. All the
ASTM C33, Standard specification for concrete aggregate, were conducted to determine the physical
properties of the aggregates.
(a) Moisture Content (ASTM C566)
(b) Unit Weight and Volume of Voids (ASTM C29)
(c)Specific Gravity and Absorption (ASTM C127 for C. A) and (ASTM C128 for F.A.)
(d) Sieve Analysis and Fineness Modulus (ASTM C136)
(e) Material Finer than #200 (75 μm) Sieve (ASTM C117)
(f) Clay Lumps and Friable particles (ASTM C142)
(g) Organic Impurity for Fine Aggregates (ASTM C40)
(h)Effect of Organic Impurities on Strength of Mortar (ASTM C87)
(i) Soundness of Aggregates by Sodium Sulfate (ASTM C88)
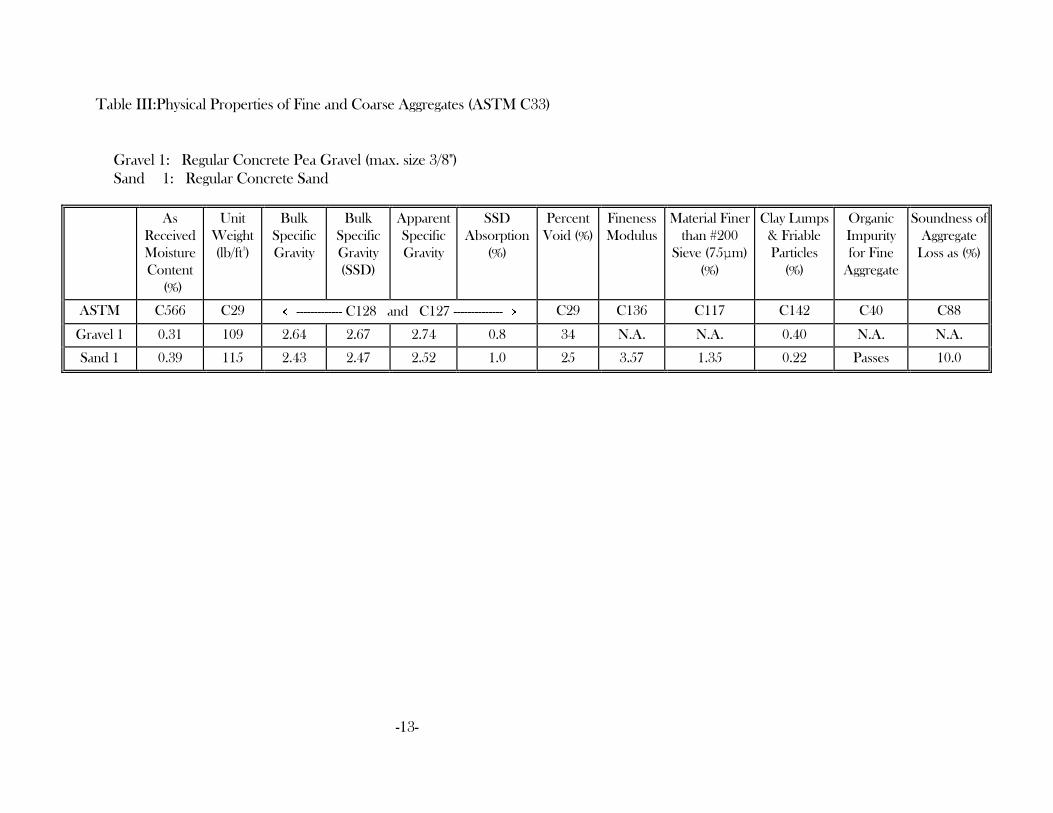
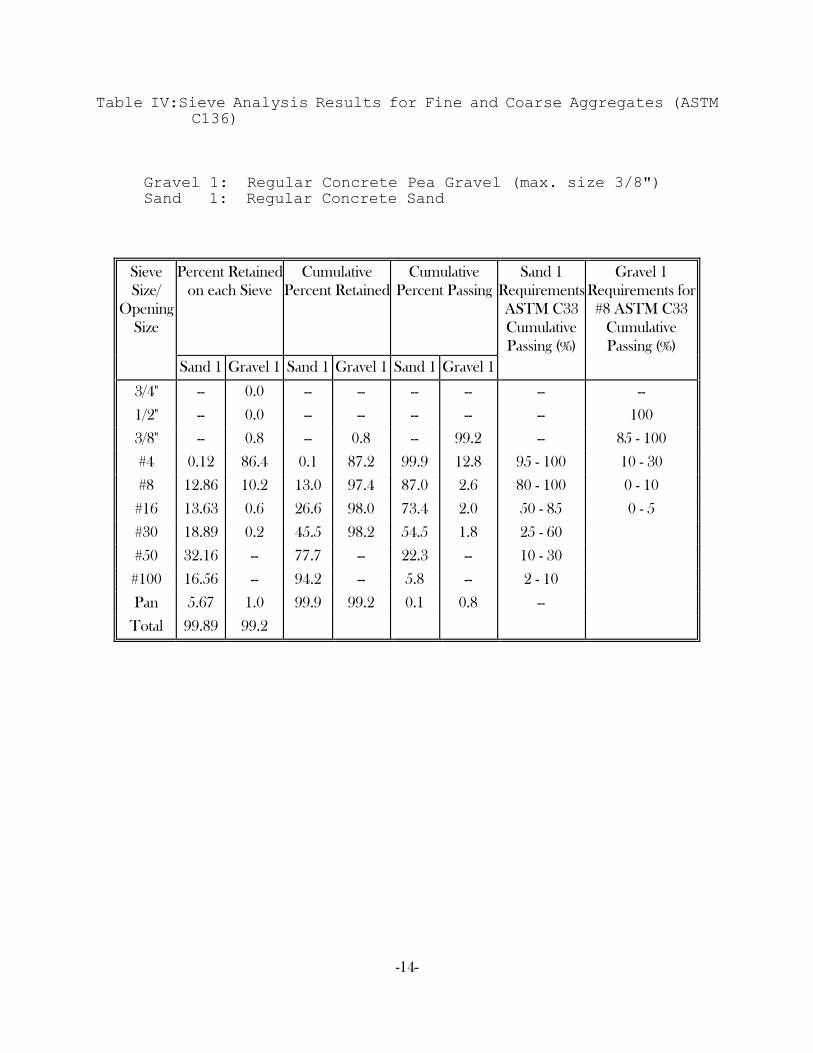
The test data on physical properties of the aggregates are presented in Table III. Table IV
shows the sieve analysis results of the aggregates. Figure 1 shows sieve analysis envelope for regular
concrete sand.
Foundry Sand
Greer et al. (3) reported in 1989 that only limited data is available on the physical
characteristics of foundry by-products. Extensive tests were carried out to evaluate the physical
properties of used foundry sands, at Center for By-Products Utilization, University of
Wisconsin-Milwaukee.
Clean foundry sand from one source and used foundry sand from three different sources
were selected and tested for their physical properties.
-6-
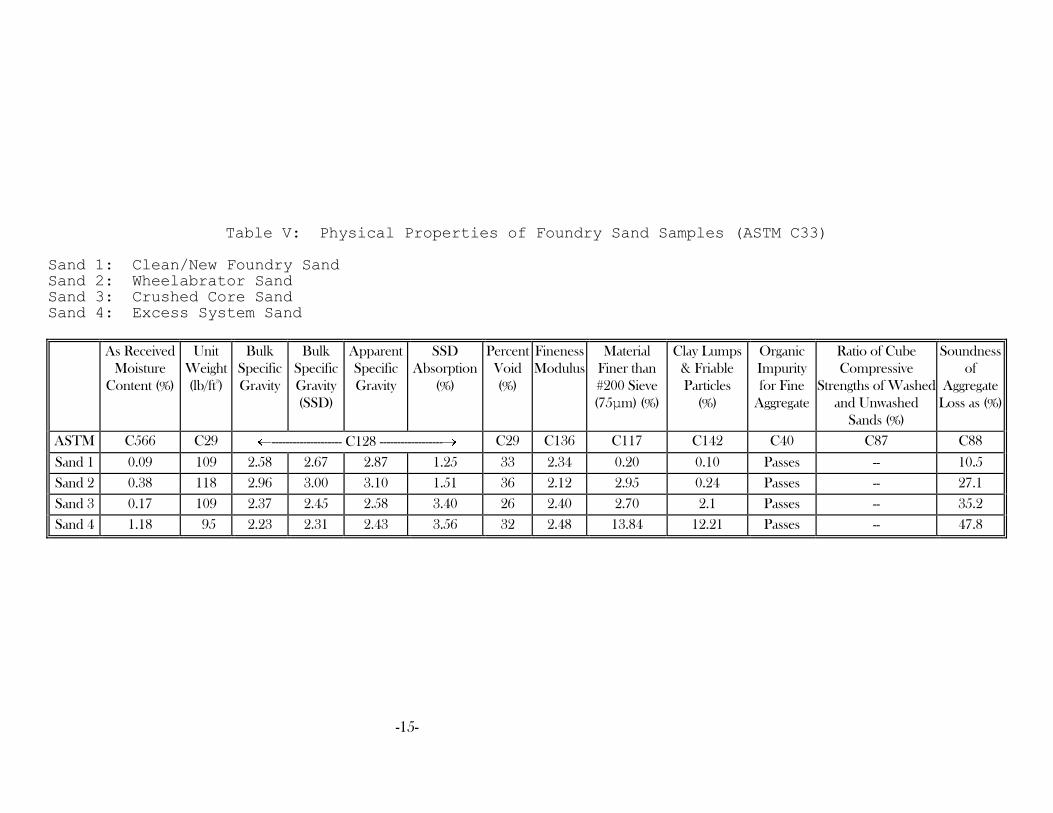
The test results are shown in Tables V and VI. The results show that there is a wide range of
variability in physical properties of foundry wastes from one source to another. These variations are
dependent on the type of equipment used in the foundry, the size and shape of casting made, the
amount of core material per casting, type of additives and the number of times the sand was used.
The type and amount of binder used in the molding sand also influences the physical properties to a
great extent.
Test results for materials finer than 75 μm (No. 200) sieve in mineral aggregates by washing
(ASTM C117) show that sand 4 has large amount of material finer than No. 200 sieve. This high
volume is due to the large amount of binder present in sand; which were washed out during wet
sieving. Unit weight of this sand, is lower than that of other foundry sand samples.
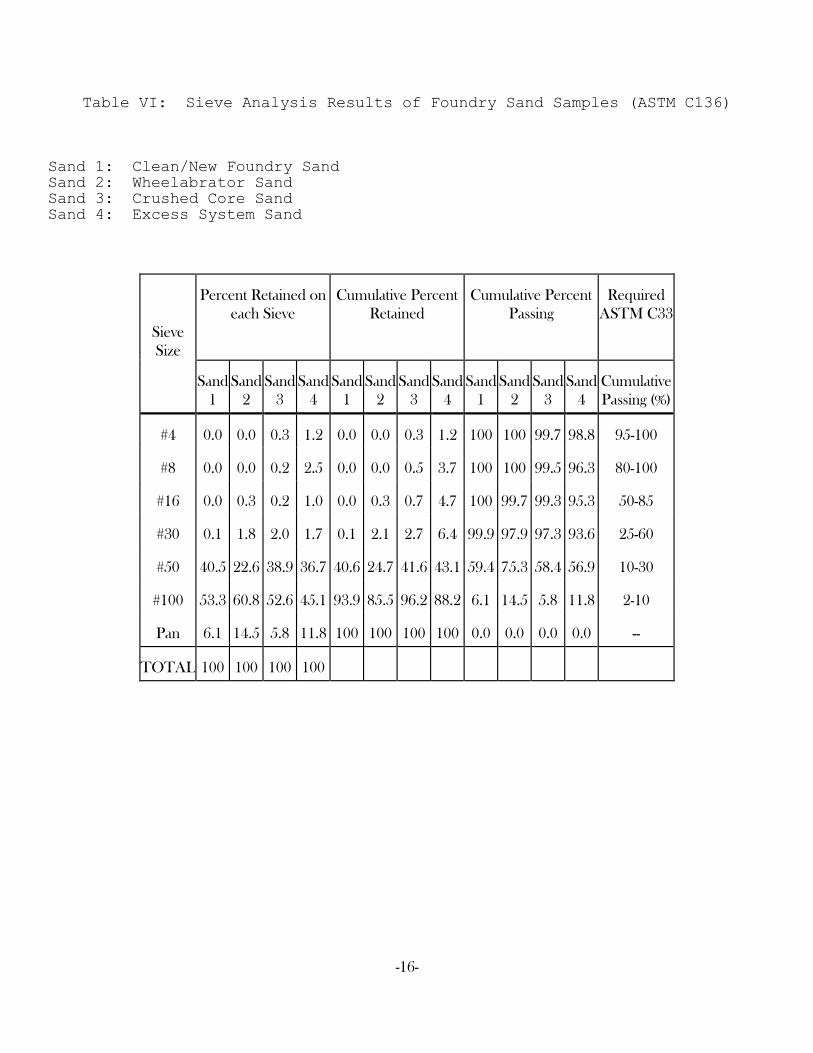
The sieve analysis results (ASTM C136) are shown in Table VI and the sieve analysis grading
curves are plotted in Figures 2 - 5, along with ASTM Standard grading requirements for sand for
concrete making materials. These figures exhibit that the foundry sands are not between ASTM
limits. All the foundry sand samples are gap graded. About 90% of sand is retained on #50 and
#100 sieves.
The saturated surface dry absorption values for sand 3 and sand 4 are relatively high. This is
because of the presence of higher amount of binder in them, which absorbs more water. All the
sands in this test pass the ASTM C40 test for organic impurities.
Some of the ASTM C33 tests were modified in order to apply to foundry sands.
As per ASTM C142, in order to determine the percentage of clay lumps and friable particles,
sample selected should be retained on 1.18μm (No. 16) sieve and final wet sieving is to be done on
850μm (No. 20) sieve. As the particle size of foundry sand is much smaller than regular sand the
above specifications do not apply to it (less than 2% of the sample is retained on No. 16 sieve).
Hence, 150μm (No. 100) sieve was selected as it represented a general sieve size on which 90% of the
particles were retained, and wet sieving was carried out on 110 μm (No. 140) sieve.
Per ASTM C88 (test method for soundness of aggregate) (5), the test sample shall be such
that it contains 100 g. of all materials retained on No. 4 (4.75mm), No. 8 (2.36 mm), No. 16 (1.18
mm), No. 30 (600 μm) and No. 50 (300 μm) sieves, and respectively passing through sieves 3/8" (0.5
mm), No. 4 (4.75 mm), No. 8 (2.36 mm), No. 16 (1.18 mm) and No. 30 (600 μm). As shown
foundry sands are gap graded. Hence, this test was modified. The sample used was 100 g. passing
through No. 30 (600 μm) sieve and retained on No. 50 (300 μm) sieve. It was concluded that
discarded foundry sands do not pass the test. The binders get washed away due to aggressive
environment of saturated sodium sulfate solution. ASTM limits this loss to 12%. However, clean
foundry sand passes the test. This indicates that the sand by itself is sound, but due the loss of
binders and fines present an apparent failure.
-7-
Masonry Blocks
Mixture Proportioning
Total of five trial mixes were prepared to manufacture small size masonry blocks in
laboratory. One control mix was made while other four mixes contained 35% replacement of
regular sand with used as well as clean/new foundry sand. One out of the four mixes was prepared
using clean/new foundry sand and other three mixes were prepared using wheelabrator sand, crushed
core sand and excess system sand. All the mixes were proportioned to obtain strength of 1500 psi at
28-days. No additives or admixtures were added to the mix. The total water content in each mix
was 5.3% of the total volume of the mix. The coarse aggregate used in masonry block mixes had the
maximum size of 3/8", smaller than the regular coarse aggregate used in concrete. Details of the
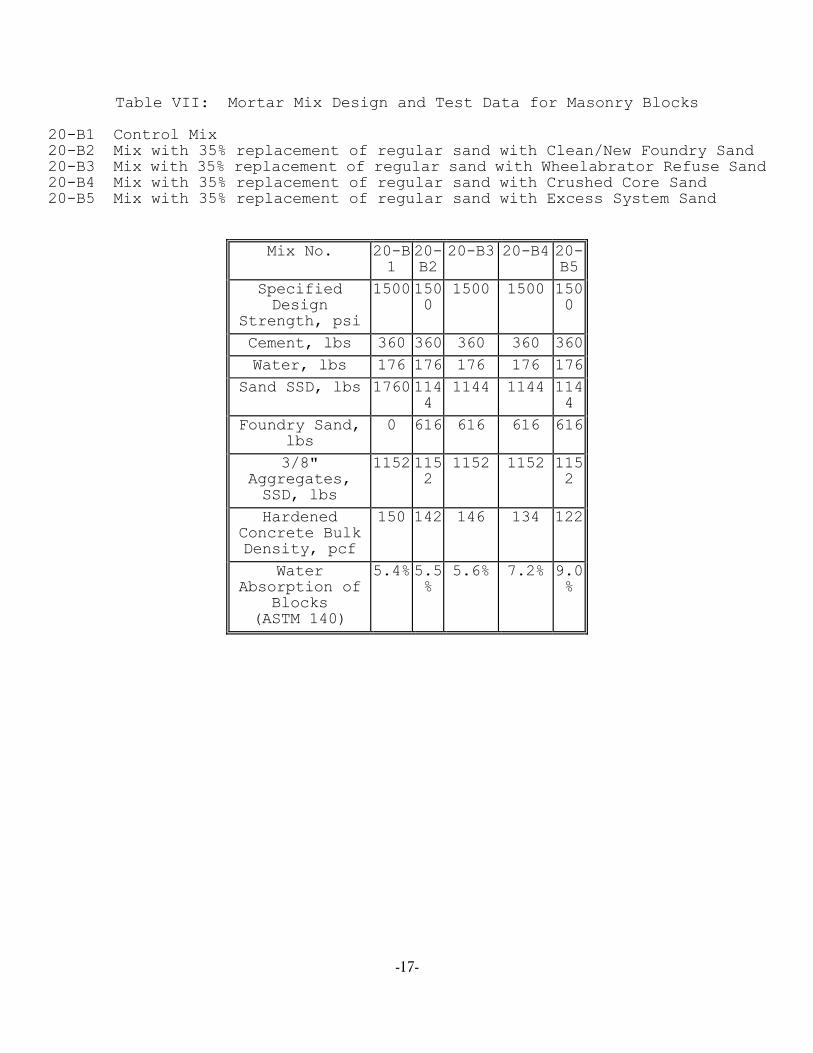
mixture proportioning is given in Table VII.
Manufacturing and Testing of Masonry Blocks
All of the mixes were prepared at Center for By-Products Utilization laboratories. The
specimen size was scaled down from the regular size masonry blocks. The mold measured 4" x 2.5"
x 1.81" with two rectangular 1.25" x 1.25" open cells. The gross area of the blocks is 10 in.2
and the
net area is 6.25 in.2
and (62.5% of gross area). The details of the block is shown in Figure 6.
The aggregates and cement were mixed in dry state and then water was added to the mix.
The mix was then compacted in block mold in three layers. The compaction was done using a
pneumatic vibrating hammer. Soon after the compaction, the block was removed from the mold.
The blocks were kept at room temperature and humidity for about 4 hours and then stored in the
moist curing room maintained at 100% relative humidity till the time of test. Twelve small size
blocks were prepared for each mix to determine compressive strength, bulk density and absorption.
All the tests were carried out in accordance with ASTM C140. Three specimens were tested at three
ages, 3-day, 7-day, and 28-day, for compressive strength.
Results and Discussions
Compressive Strength
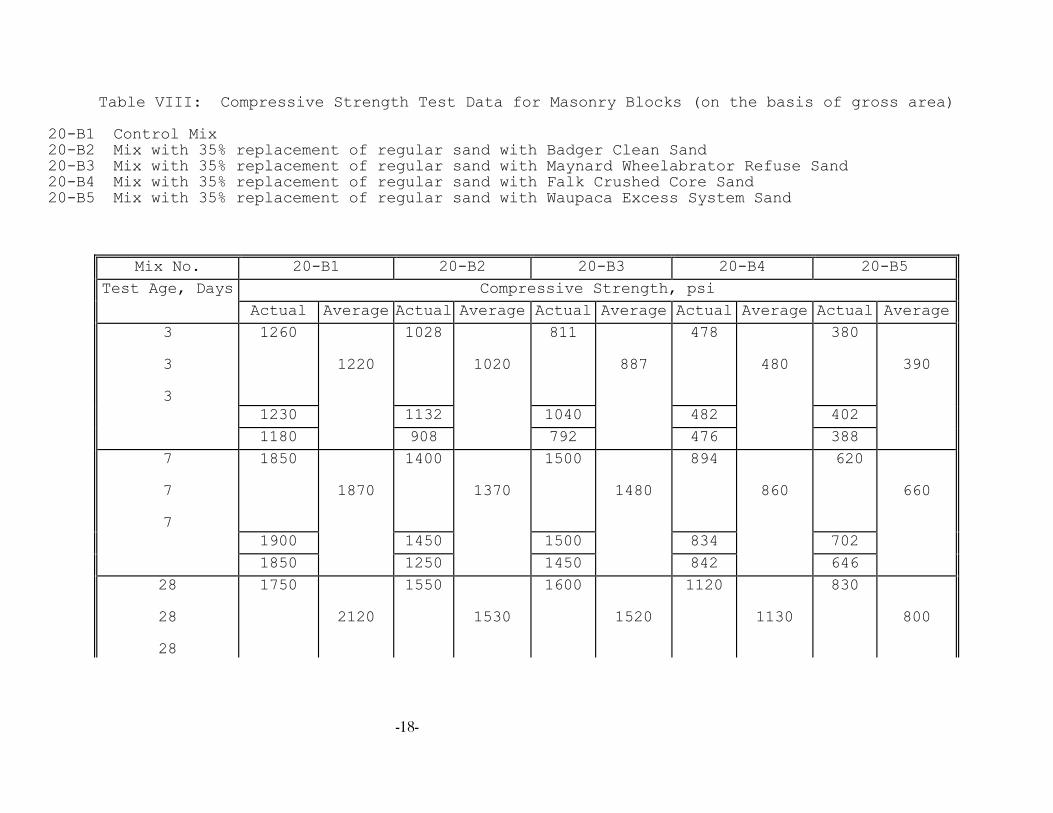
The compressive strength data is shown in Table VIII. Results showed compressive strength
increases with age. A plot of compressive strength vs. age is shown in Figure 7. All the mixes with
used and clean/new foundry sand showed lower values of compressive strength than that of the
control mix at all ages.
The mix 20-B2, mix with 35% replacement of regular sand with clean/new foundry sand
showed the compressive strength lower by 16% at 3-day, 25% at 7-day, and 27% at 28-day age than
the respective strength of control mix.
-8-
The mix 20-B3, mix with 35% replacement of regular sand with wheelabrator foundry sand
showed lower values of strengths at all ages with respect to control mix and the mix with clean/new
foundry sand. The compressive strength of mix 20-B3 lower by 27% at 3-day to 28% at 28-day with
respect to respective values of control mix. However, the compressive strength values of mix 20-B3
is 13% lower at 3-day, 8% higher at 7-day and less than 1% lower at 28-day with respect to the values
of mix 20-B2.
The mixes 20-B4 and 20-B5, having 35% replacement of regular sand with crushed core sand
and excess system sand, showed poor results in comparison with control mix and mix with clean/new
foundry sand. The 28-day compressive strength results of the mixes 20-B4 and 20-B5 are 26% and
47% lower than that for the mix 20-B2. The possible explanation to this type of behavior would be
the high absorption capacity of the used foundry sands. As seen from Table V the percent
absorption of excess system sand and core sand are 3.56% and 3.40%, respectively. In order to learn
the behavior of each sand in mortar the water content in each mix was kept same. These high
absorption capacity of sand would leave the mix comparatively dry and eventually hinder the strength
gain of masonry blocks. The other possible reason for lower strength phenomenon would be the
presence of high amount of binders. The micro binder particle stick to the sand particle and prevent
it from strengthening the bond with cement paste. The high percent of binders were located during
the tests ASTM C117 (Material finer than #200 sieve) and ASTM C142 (Clay lumps and friable
particles). Results of these tests are reported in Table V.
Though, the mixes 20-B2 and 20-B3 showed the lower values of compressive strength than
the control mix, at all ages, they reached the specified design strength at 28-day. In fact, 20-B2, mix
with clean/new foundry sand, showed the compressive strength value higher by 2% than specified
design strength. Similarly, 20-B3, mix with wheelabrator foundry sand showed 1.5% higher value of
compressive strength than specified design strength.
Conclusions and Recommendations
1.Although foundry sand itself does not pass all the ASTM C33 requirements, the masonry blocks
made with used foundry sand pass the ASTM requirements for strength, absorption and bulk
density.
2.Compressive strength of the masonry blocks using clean/new foundry sand has reached the
specified design strength at 28-day age.
3.Compressive strength of the mix 20-B3, with used wheelabrator sand also reached the specified
design strength at 28-day.
4.The reduction in the strength of mixes 20-B4 and 20-B5 is attributed to presence of higher amount
of binders and high absorption capacity of the sand.
-9-
5.The feasibility of using 35% replacement level of used foundry sand, in manufacturing masonry
block has been established on the basis of short term testing.
6.It is not advisable to use higher percentage of replacement of regular sand with used foundry sand.
7.Some of the foundry sands with higher percent of binders may need to be processed before the use
in manufacturing masonry blocks.
8.Quality and strength of masonry blocks can be improved with the use of additives and admixtures.
9.Foundries need to regulate the binder content in the foundry sands.
10.Quality of discarded foundry sands should be consistence, in order to develop market feasibility.
11.Sufficient long-term durability data needs to be generated to market the product.
-10-
References:
1.T.R. Naik, "Foundry Industry By-Products Utilization", Center for By-Products Utilization,
UW-Milwaukee, p. 23, Feb. 1987.
2."Solid Waste Disposal and Reuse in U.S.", Edited by Ishwar P. Murarka, Vol. 1 and 2, CRC Press,
Boca Raton, Florida, 1987, Vol. 1, p. 187, Vol. 2, p. 160.
3.B.A. Greer, J.E. Vonderracek, R.K. Ham, and D.E. Oman, "The Nature and Characteristics of
Foundry Waste and its Constructive Use: A Review of the Literature and Current Practice",
a Report for the United Foundrymen of Wisconsin, Aug. 1987.
4.D.C. Edey, and W.P. Winter, "Introduction to Foundry Technology", Mc-Graw Hill Book
Company, New York, P. 253, 1958.
5.American Foundrymen's Society, Inc., "Alternate Utilization of Foundry Waste Sand", a report to
Illinois Department of Commerce and Community Affairs, p. 97, Aug. 1991.
6.Annual Book of ASTM Standards, American Society for Testing and Materials, Volume 04.01,
1990.
7.Annual Book of ASTM Standards, American Society for Testing and Materials, Volume 04.02,
1990.
8.Annual Book of ASTM Standards, American Society for Testing and Materials, Volume 04.05,
1990.
REP-167
-11-
Table I: Chemical Composition of Type I Portland Cement
Analyte %
SiO2 20.25
Al2O3 4.25
CaO 63.6
MgO 2.24
Fe2O3 2.59
TiO2 0.27
K2O 0.80
Na2O 0.2
LOI 0.55
-12-
Table II: Physical Properties of Type I Portland Cement
No. Test Result ASTM Specifications for
Type I
Minimum Maximum
(a)
(b)
(c)
(d)
(e)
(f)
Air content of mortar
(%)
Fineness specific surface
Air permeability test
(m2
/kg)
Autoclave expansion (%)
Specific gravity
Compressive Strength
(psi)
1 day
3 day
7 day
28 day
Time of setting (min)
(Vicat test)
Initial set
7.9
391
-0.03
3.09
1254
3512
4219
5375
155
--
280
--
--
--
1800
2800
--
45
12
--
0.8
--
--
--
--
--
--
-13-
Table III:Physical Properties of Fine and Coarse Aggregates (ASTM C33)
Gravel 1: Regular Concrete Pea Gravel (max. size 3/8")
Sand 1: Regular Concrete Sand
As
Received
Moisture
Content
(%)
Unit
Weight
(lb/ft3
)
Bulk
Specific
Gravity
Bulk
Specific
Gravity
(SSD)
Apparent
Specific
Gravity
SSD
Absorption
(%)
Percent
Void (%)
Fineness
Modulus
Material Finer
than #200
Sieve (75μm)
(%)
Clay Lumps
& Friable
Particles
(%)
Organic
Impurity
for Fine
Aggregate
Soundness of
Aggregate
Loss as (%)
ASTM C566 C29 ------------- C128 and C127 -------------- C29 C136 C117 C142 C40 C88
Gravel 1 0.31 109 2.64 2.67 2.74 0.8 34 N.A. N.A. 0.40 N.A. N.A.
Sand 1 0.39 115 2.43 2.47 2.52 1.0 25 3.57 1.35 0.22 Passes 10.0
-14-
Table IV:Sieve Analysis Results for Fine and Coarse Aggregates (ASTM
C136) Gravel 1: Regular Concrete Pea Gravel (max. size 3/8") Sand 1: Regular Concrete Sand
Sieve
Size/
Opening
Size
Percent Retained
on each Sieve
Cumulative
Percent Retained
Cumulative
Percent Passing
Sand 1
Requirements
ASTM C33
Cumulative
Passing (%)
Gravel 1
Requirements for
#8 ASTM C33
Cumulative
Passing (%)
Sand 1 Gravel 1 Sand 1 Gravel 1 Sand 1 Gravel 1
3/4" -- 0.0 -- -- -- -- -- --
1/2" -- 0.0 -- -- -- -- -- 100
3/8" -- 0.8 -- 0.8 -- 99.2 -- 85 - 100
#4 0.12 86.4 0.1 87.2 99.9 12.8 95 - 100 10 - 30
#8 12.86 10.2 13.0 97.4 87.0 2.6 80 - 100 0 - 10
#16 13.63 0.6 26.6 98.0 73.4 2.0 50 - 85 0 - 5
#30 18.89 0.2 45.5 98.2 54.5 1.8 25 - 60
#50 32.16 -- 77.7 -- 22.3 -- 10 - 30
#100 16.56 -- 94.2 -- 5.8 -- 2 - 10
Pan 5.67 1.0 99.9 99.2 0.1 0.8 --
Total 99.89 99.2
-15-
Table V: Physical Properties of Foundry Sand Samples (ASTM C33) Sand 1: Clean/New Foundry Sand Sand 2: Wheelabrator Sand Sand 3: Crushed Core Sand Sand 4: Excess System Sand
As Received
Moisture
Content (%)
Unit
Weight
(lb/ft3
)
Bulk
Specific
Gravity
Bulk
Specific
Gravity
(SSD)
Apparent
Specific
Gravity
SSD
Absorption
(%)
Percent
Void
(%)
Fineness
Modulus
Material
Finer than
#200 Sieve
(75μm) (%)
Clay Lumps
& Friable
Particles
(%)
Organic
Impurity
for Fine
Aggregate
Ratio of Cube
Compressive
Strengths of Washed
and Unwashed
Sands (%)
Soundness
of
Aggregate
Loss as (%)
ASTM C566 C29 -------------------- C128 ------------------ C29 C136 C117 C142 C40 C87 C88
Sand 1 0.09 109 2.58 2.67 2.87 1.25 33 2.34 0.20 0.10 Passes -- 10.5
Sand 2 0.38 118 2.96 3.00 3.10 1.51 36 2.12 2.95 0.24 Passes -- 27.1
Sand 3 0.17 109 2.37 2.45 2.58 3.40 26 2.40 2.70 2.1 Passes -- 35.2
Sand 4 1.18 95 2.23 2.31 2.43 3.56 32 2.48 13.84 12.21 Passes -- 47.8
-16-
Table VI: Sieve Analysis Results of Foundry Sand Samples (ASTM C136)
Sand 1: Clean/New Foundry Sand Sand 2: Wheelabrator Sand Sand 3: Crushed Core Sand Sand 4: Excess System Sand
Sieve
Size
Percent Retained on
each Sieve
Cumulative Percent
Retained
Cumulative Percent
Passing
Required
ASTM C33
Sand
1
Sand
2
Sand
3
Sand
4
Sand
1
Sand
2
Sand
3
Sand
4
Sand
1
Sand
2
Sand
3
Sand
4
Cumulative
Passing (%)
#4 0.0 0.0 0.3 1.2 0.0 0.0 0.3 1.2 100 100 99.7 98.8 95-100
#8 0.0 0.0 0.2 2.5 0.0 0.0 0.5 3.7 100 100 99.5 96.3 80-100
#16 0.0 0.3 0.2 1.0 0.0 0.3 0.7 4.7 100 99.7 99.3 95.3 50-85
#30 0.1 1.8 2.0 1.7 0.1 2.1 2.7 6.4 99.9 97.9 97.3 93.6 25-60
#50 40.5 22.6 38.9 36.7 40.6 24.7 41.6 43.1 59.4 75.3 58.4 56.9 10-30
#100 53.3 60.8 52.6 45.1 93.9 85.5 96.2 88.2 6.1 14.5 5.8 11.8 2-10
Pan 6.1 14.5 5.8 11.8 100 100 100 100 0.0 0.0 0.0 0.0 --
TOTAL 100 100 100 100
-17-
Table VII: Mortar Mix Design and Test Data for Masonry Blocks
20-B1 Control Mix 20-B2 Mix with 35% replacement of regular sand with Clean/New Foundry Sand 20-B3 Mix with 35% replacement of regular sand with Wheelabrator Refuse Sand 20-B4 Mix with 35% replacement of regular sand with Crushed Core Sand 20-B5 Mix with 35% replacement of regular sand with Excess System Sand
Mix No. 20-B1
20-B2
20-B3 20-B4 20-B5
Specified Design
Strength, psi
1500 1500
1500 1500 1500
Cement, lbs 360 360 360 360 360
Water, lbs 176 176 176 176 176
Sand SSD, lbs 1760 1144
1144 1144 1144
Foundry Sand, lbs
0 616 616 616 616
3/8" Aggregates, SSD, lbs
1152 1152
1152 1152 1152
Hardened Concrete Bulk Density, pcf
150 142 146 134 122
Water Absorption of
Blocks (ASTM 140)
5.4% 5.5%
5.6% 7.2% 9.0%
-18-
Table VIII: Compressive Strength Test Data for Masonry Blocks (on the basis of gross area) 20-B1 Control Mix 20-B2 Mix with 35% replacement of regular sand with Badger Clean Sand 20-B3 Mix with 35% replacement of regular sand with Maynard Wheelabrator Refuse Sand 20-B4 Mix with 35% replacement of regular sand with Falk Crushed Core Sand 20-B5 Mix with 35% replacement of regular sand with Waupaca Excess System Sand
Mix No. 20-B1 20-B2 20-B3 20-B4 20-B5
Test Age, Days Compressive Strength, psi
Actual Average Actual Average Actual Average Actual Average Actual Average
3 3
3
1260
1220
1028
1020
811
887
478
480
380
390
1230 1132 1040 482 402
1180 908 792 476 388
7 7 7
1850
1870
1400
1370
1500
1480
894
860
620
660
1900 1450 1500 834 702
1850 1250 1450 842 646
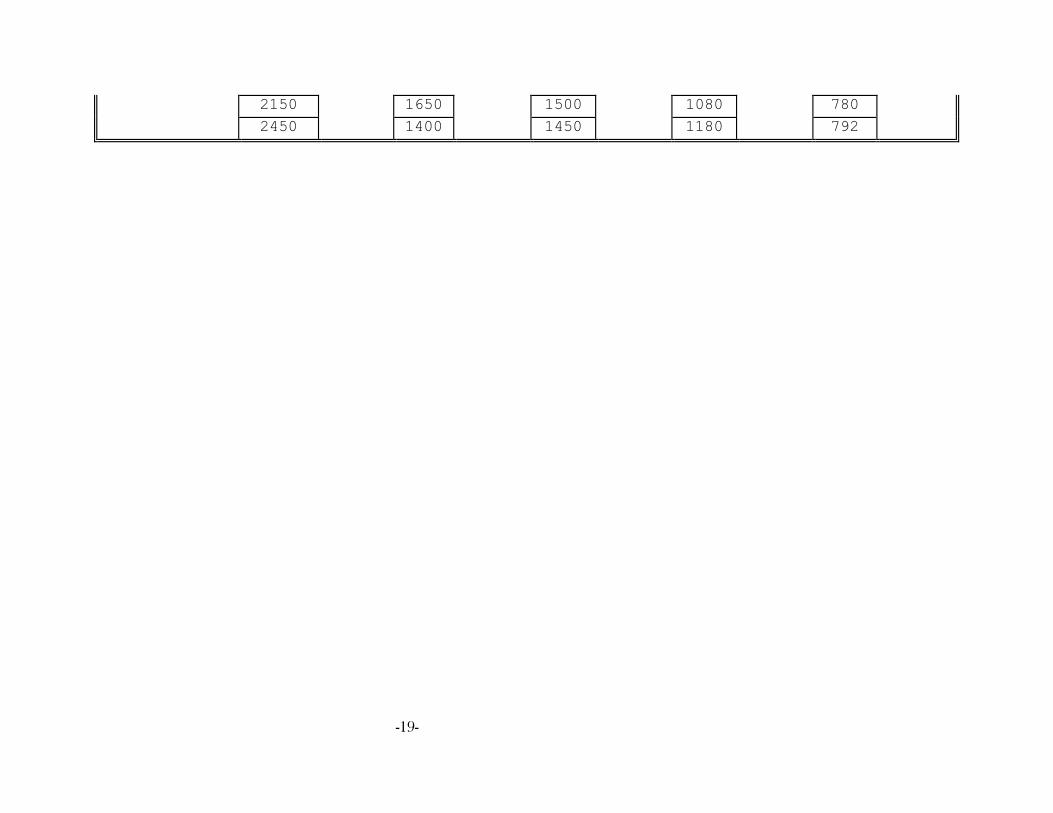
28 28 28
1750
2120
1550
1530
1600
1520
1120
1130
830
800
-19-
2150 1650 1500 1080 780
2450 1400 1450 1180 792

-20-

-21-

-22-

-23-

-24-

-25-

-26-