benchmarking the value of best practices cpi conference september 30, 2002 austin, texas
TRANSCRIPT

Benchmarking the Value Benchmarking the Value of of
Best PracticesBest Practices
CPI ConferenceSeptember 30, 2002
Austin, Texas

Session ParticipantsSession Participants
ModeratorModerator•John Tato - John Tato - U.S. Department of U.S. Department of State State
PanelistsPanelists•Jack Yarbrough – JacobsJack Yarbrough – Jacobs•Steve Thomas - CIISteve Thomas - CII

Goals of this SessionGoals of this Session
• Highlight recent Benchmarking & Highlight recent Benchmarking & Metrics Program improvementsMetrics Program improvements
• Present key findings from the Present key findings from the programprogram
• Illustrate the value of Illustrate the value of benchmarkingbenchmarking
• Address barriers to Address barriers to benchmarkingbenchmarking

Reasons for Reasons for notnot benchmarking: benchmarking: • Lack of time and other resources. Lack of time and other resources.
• Project management reporting Project management reporting process not formally established. process not formally established.
Q: Are you currently benchmarking your Q: Are you currently benchmarking your projects?projects?
NO26%
YES74%

• No in-house systemNo in-house systemReason for Reason for “No” “No” responsesresponses::
Q: Do you have a data collection Q: Do you have a data collection infrastructure that facilitates the infrastructure that facilitates the
collection of data essential to an effective collection of data essential to an effective benchmarking system? benchmarking system?
YES50%
NO50%
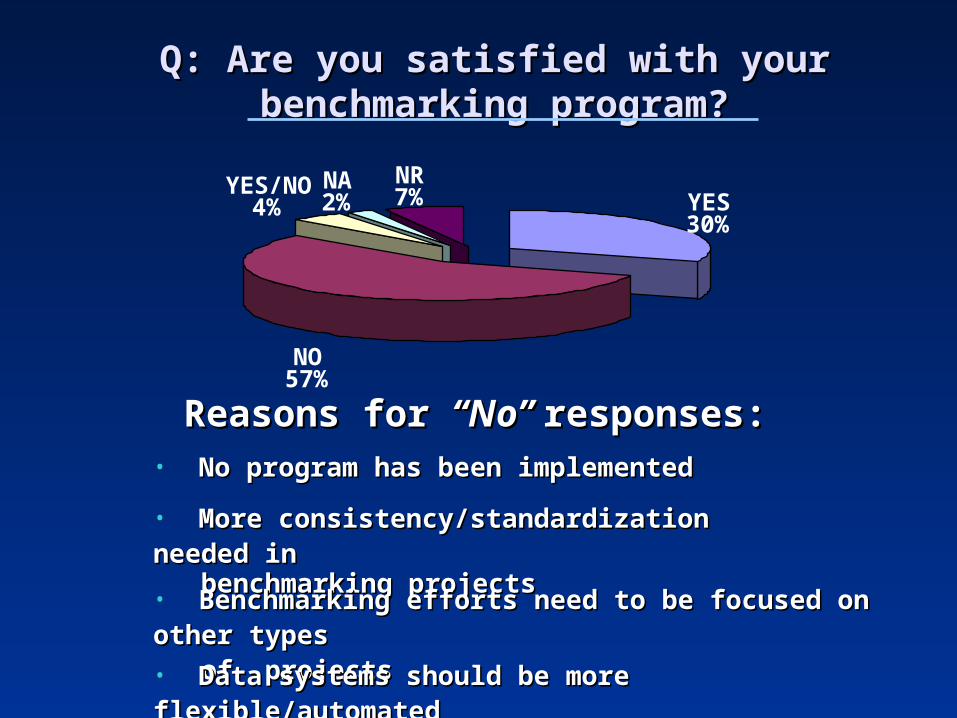
• No program has been implementedNo program has been implemented
• More consistency/standardization needed inMore consistency/standardization needed in benchmarking projectsbenchmarking projects
• Benchmarking efforts need to be focused on other typesBenchmarking efforts need to be focused on other types of projects of projects
• Data systems should be more flexible/automatedData systems should be more flexible/automated
Reasons for Reasons for “No” “No” responses:responses:
Q: Are you satisfied with your Q: Are you satisfied with your benchmarking program?benchmarking program?
YES30%
NO57%
YES/NO4%
NA2%
NR7%

Our CharterOur Charter
• Establish common definitions.Establish common definitions.
• Establish metric norms.Establish metric norms.
• Determine value of best practices.Determine value of best practices.
• Provide members a basis for self-Provide members a basis for self-
analysis. analysis.
• Support CII research and Support CII research and
implementation activities through implementation activities through
feedback.feedback.
Our CustomersOur Customers
• Member Companies Member Companies
• Research and ImplementationResearch and Implementation
• Funded StudiesFunded Studies
• AlliancesAlliances
• Benchmarking Participants Benchmarking Participants
Program (BMPP)Program (BMPP)

Owner ParticipantsOwner ParticipantsAbbott LabsAbbott Labs Eastman ChemicalEastman Chemical Ontario Power Ontario Power
GenerationGeneration
Air Products and Air Products and Chemicals, Chemicals, Eli Lilly and Company Eli Lilly and Company Procter & GambleProcter & Gamble
Anheuser-BuschAnheuser-Busch EnronEnron Rohm and Haas Rohm and Haas
Aramco Services Aramco Services Company Company
Exxon Research & Exxon Research & Engineering Engineering Shell OilShell Oil
ArcoArco FINA Oil and Chemical FINA Oil and Chemical SolutiaSolutia
Bayer CorporationBayer Corporation General Motors General Motors Corporation Corporation TVATVA
Bethlehem Steel Bethlehem Steel GlaxoSmithKline GlaxoSmithKline TexacoTexaco
BP AmocoBP Amoco IntelIntel Army Corps of Army Corps of Engineers Engineers
CelaneseCelaneseaa James River James River U.S. Steel U.S. Steel
Champion Champion International International LTV Steel LTV Steel Union Carbide Union Carbide
CITGO PetroleumCITGO Petroleum Merck Merck U.S. Department of U.S. Department of State State
Dow ChemicalDow Chemical NASA NASA University of Texas University of Texas System System
DuPontDuPont NAVFACNAVFAC

Contractor ParticipantsContractor ParticipantsABB Lummus ABB Lummus
GlobalGlobal Dick CorporationDick Corporation Kellogg Brown & RootKellogg Brown & Root
Atkinson Atkinson Construction Construction
Dillingham Dillingham ConstructionConstruction KvaernerKvaerner
BE&K, Inc.BE&K, Inc. Fluor DanielFluor Daniel M. A. MortensonM. A. Mortenson
Bechtel Group, Inc.Bechtel Group, Inc. Foster Wheeler Foster Wheeler USAUSA Morrison Knudsen Morrison Knudsen
Black and VeatchBlack and Veatch Fru-Con Fru-Con ConstructionConstruction
Parsons Energy & Parsons Energy & ChemicalsChemicals
BMW Constructors BMW Constructors Inc.Inc. GraycorGraycor PT Rekayasa Industri PT Rekayasa Industri
Cherne Cherne Contracting Contracting
H.B. Zachry H.B. Zachry CompanyCompany
Raytheon Engineers & Raytheon Engineers & ConstructorsConstructors
Chiyoda Chiyoda Corporation Corporation HoneywellHoneywell S&B Engineers and S&B Engineers and
ConstructorsConstructors
Cianbro Cianbro Corporation Corporation J.A. JonesJ.A. Jones TPATPA
CoSyn Technology CoSyn Technology JacobsJacobs Turner Construction Turner Construction Company Company
Day and Day and Zimmerman IntlZimmerman Intl James N. Gray James N. Gray Watkins Engineers & Watkins Engineers &
ConstructorsConstructors

Most Active 2000-2002Most Active 2000-2002
OwnersOwners ContractorsContractorsAnheuser-BuschAnheuser-Busch BE&K, Inc.BE&K, Inc.
Aramco Services Company Aramco Services Company Bechtel GroupBechtel Group
Bethlehem SteelBethlehem Steel BMW ConstructorsBMW Constructors
General Motors General Motors Day and Zimmerman IntlDay and Zimmerman Intl
NAVFACNAVFAC Dick CorporationDick Corporation
TVA TVA H.B. Zachry CompanyH.B. Zachry Company
U.S. Department of StateU.S. Department of State KvaernerKvaerner
JacobsJacobs
Parsons Energy & Chemicals Parsons Energy & Chemicals GroupGroup

Benchmarking User Benchmarking User AwardAward
OwnerOwner• Aramco Services Aramco Services
CompanyCompany
ContractorContractor• S&B Engineers and S&B Engineers and
Constructors Ltd.Constructors Ltd. • Watkins Engineers Watkins Engineers
& Constructors& Constructors Inc. Inc.

Questionnaire Questionnaire DevelopmentDevelopmentVersion Version
11
Version 1
Best
Practices
Metrics
Performance
Metrics
• Cost Performance• Schedule Performance• Safety Performance• Change Performance• Rework Performance
• Pre-Project Planning• Constructability• Team Building• Zero Accident Techniques
209 Projects209 Projects $ 11.47 Billion$ 11.47 BillionFirst versionFirst version

Questionnaire Questionnaire DevelopmentDevelopment
Version 2
Best
Practices
Metrics
Performance
Metrics
• Cost Performance• Schedule Performance• Safety Performance• Change Performance• Rework Performance
• Pre-Project Planning• Constructability• Team Building• Zero Accident Techniques• Project Change Mgmt• Design/Info. Tech.
442 Projects442 Projects(Cumulative)(Cumulative)
$ 25.95 Billion$ 25.95 Billion(Cumulative)(Cumulative)
RefinementsRefinementsAddition of Two practicesAddition of Two practices
Version Version 22

Questionnaire Questionnaire DevelopmentDevelopment
Version 3
Best
Practices
Metrics
Performance
Metrics
• Cost Performance• Schedule Performance• Safety Performance• Change Performance• Rework Performance
• Pre-Project Planning• Constructability• Team Building• Zero Accident Techniques• Project Change Mgmt• Design/Info. Tech.
745 Projects745 Projects(Cumulative)(Cumulative)
$ 39.88 Billion$ 39.88 Billion(Cumulative)(Cumulative)
PDRI PDRI For BuildingsFor Buildings
(part of Pre-Project Planning)(part of Pre-Project Planning)
Version Version 33

Questionnaire Questionnaire DevelopmentDevelopment
Version 4
Best
Practices
Metrics
Performance
Metrics
• Cost Performance• Schedule Performance• Safety Performance• Change Performance• Rework Performance
• Pre-Project Planning• Constructability• Team Building• Zero Accident Techniques• Project Change Mgmt• Design/Info. Tech.
906 Projects906 Projects(Cumulative)(Cumulative)
$ 49.68 Billion$ 49.68 Billion(Cumulative)(Cumulative)
Electronic/Web Electronic/Web QuestionnaireQuestionnaire
Version Version 44

Version 5
Best
Practices
Metrics
Performance
Metrics
• Cost Performance• Schedule Performance• Safety Performance• Change Performance• Rework Performance
• Pre-Project Planning• Constructability• Team Building• Zero Accident Techniques• Project Change Mgmt• Design/Info. Tech.• Materials Management• Planning for Startup
988 Projects988 Projects(Cumulative)(Cumulative)
$ 52.15 Billion$ 52.15 Billion(Cumulative)(Cumulative)
Entire PDRI - Entire PDRI - (part of Pre-(part of Pre-Project Planning)Project Planning)
Materials ManagementMaterials ManagementPlanning for StartupPlanning for Startup
Questionnaire Questionnaire DevelopmentDevelopmentVersion Version
55

Version 6
Best
Practices
Metrics
Performance
Metrics
• Cost Performance• Schedule Performance• Safety Performance• Change Performance• Rework Performance• Construction Productivity Metrics• Pre-Project Planning• Constructability• Team Building• Zero Accident Techniques• Project Change Mgmt• Design/Info. Tech.• Materials Management• Planning for Startup• Quality Management
Project EnvironmentProject EnvironmentQuality ManagementQuality Management
Construction Productivity MetricsConstruction Productivity Metrics1037 Projects1037 Projects
(Cumulative)(Cumulative)$ 54.19 Billion$ 54.19 Billion
(Cumulative)(Cumulative)
Questionnaire Questionnaire DevelopmentDevelopmentVersion Version
66

Version 7
Best
Practices
Metrics
Performance
Metrics
• Cost Performance• Schedule Performance• Safety Performance• Change Performance• Rework Performance• Construction
Productivity Metrics• Pre-Project Planning• Constructability• Team Building• Zero Accident Techniques• Project Change Mgmt• Technology Auto. / Integ.• Materials Management• Planning for Startup• Quality Management
1057 Projects1057 Projects(Cumulative)(Cumulative)
$ 56 Billion$ 56 Billion(Cumulative)(Cumulative)
Major Upgrade !!!Major Upgrade !!!100% Review/Rewrite &100% Review/Rewrite &32% Reduction in Basic 32% Reduction in Basic
Questionnaire Questionnaire
Questionnaire Questionnaire DevelopmentDevelopmentVersion Version
77

CustomersCustomers• Member Companies Member Companies • Research & ImplementationResearch & Implementation• Funded StudiesFunded Studies• AlliancesAlliances• BMPPBMPP
QuestionnaireQuestionnaire
MetricsMetrics• Cost & ScheduleCost & Schedule
• SafetySafety• Best PracticesBest Practices
• Environment Environment DataData• ProductivityProductivity
−ConstructionConstruction−EngineeringEngineering
QuestionnaireQuestionnaire
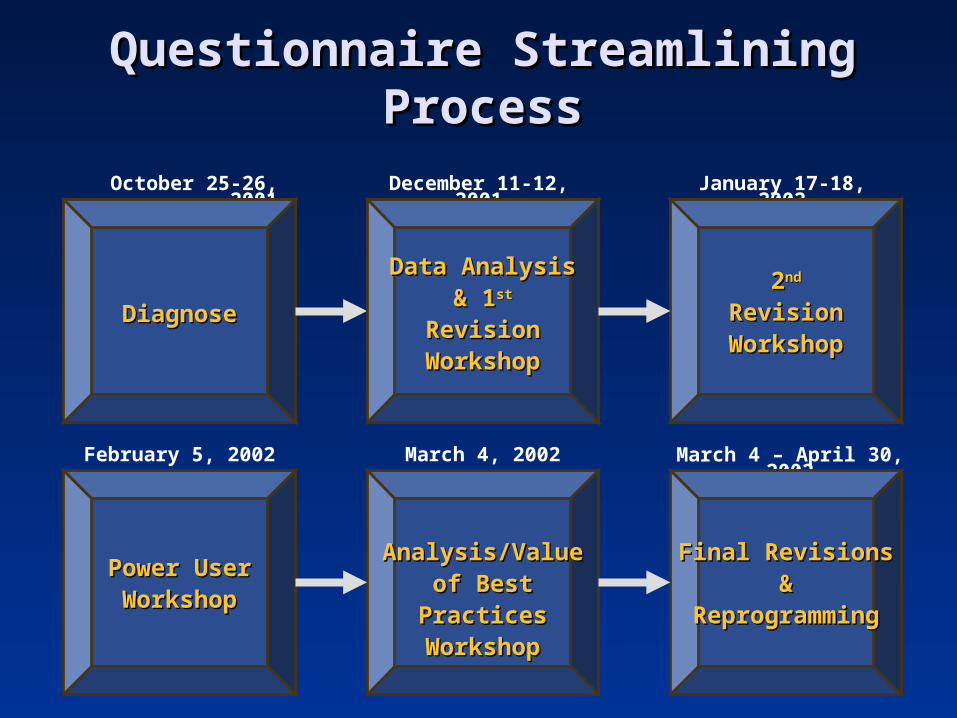
Questionnaire Streamlining Questionnaire Streamlining ProcessProcess
October 25-26, 2001
DiagnoseDiagnose
December 11-12, 2001
Data AnalysisData Analysis& 1& 1stst
RevisionRevisionWorkshopWorkshop
January 17-18, 2002
22ndnd
RevisionRevisionWorkshopWorkshop
February 5, 2002
Power UserPower UserWorkshopWorkshop
March 4, 2002
Analysis/ValueAnalysis/Valueof Bestof Best
PracticesPracticesWorkshopWorkshop
March 4 – April 30, 2002
Final RevisionsFinal Revisions&&
ReprogrammingReprogramming

Questionnaire Streamlining Questionnaire Streamlining ProcessProcess
May 9, 2002
ReleaseRelease ofof
Version 7Version 7

The ResultsThe Results
SectionSection DescriptionDescriptionQuestionQuestion
DeltaDeltaPercent Percent ChangeChange
Front EndFront EndParticipant Data, Cost, Schedule, Participant Data, Cost, Schedule, Safety, Project Environment, Safety, Project Environment, Changes, & ReworkChanges, & Rework
-38-38 -24%-24%
Best PracticeBest Practice Pre-Project PlanningPre-Project Planning 00 0%0%
Best PracticeBest Practice ConstructabilityConstructability -5-5 -39%-39%
Best PracticeBest Practice Team BuildingTeam Building 00 0%0%
Best PracticeBest Practice Zero Accident TechZero Accident Tech +2+2 +12%+12%
Best PracticeBest Practice Project Change ManagementProject Change Management -1-1 -7%-7%
Best PracticeBest Practice Materials ManagementMaterials Management -39-39 -74%-74%
Best PracticeBest Practice Quality ManagementQuality Management -7-7 -36%-36%
Proposed Best Proposed Best PracticePractice Planning for StartupPlanning for Startup -26-26 -65%-65%
Other PracticeOther Practice Design/Information Tech - Tech Design/Information Tech - Tech Auto/IntegAuto/Integ -15-15 -34%-34%
PDRIPDRI Project Definition Rating IndexProject Definition Rating Index 00 0%0%
TotalTotal -32%-32%
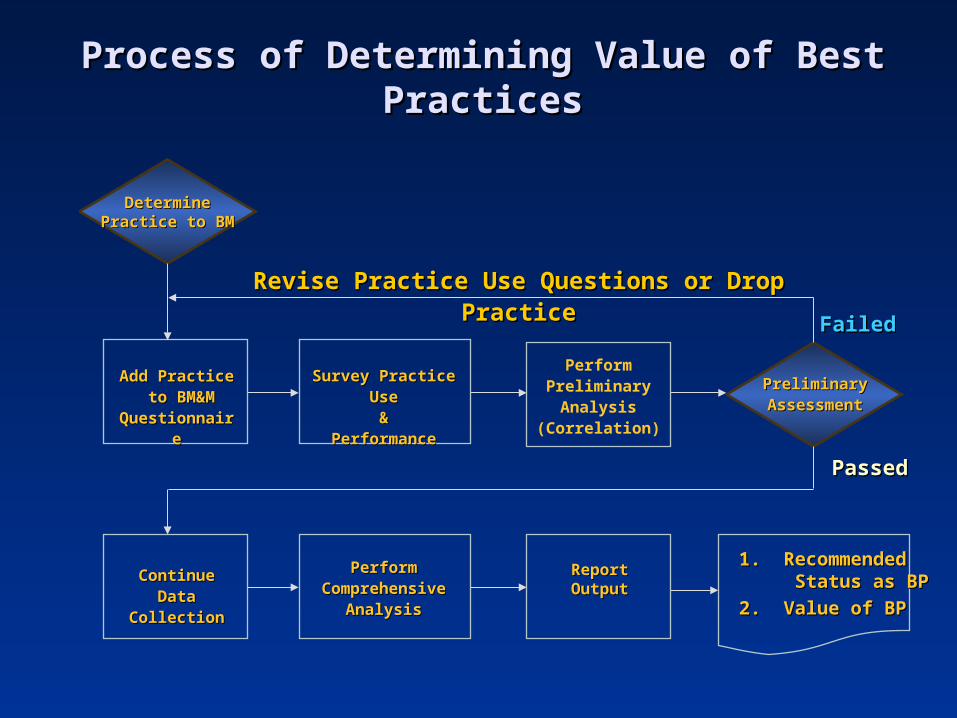
Revise Practice Use Questions or Drop PracticeRevise Practice Use Questions or Drop Practice
Survey Practice UseSurvey Practice Use&&
PerformancePerformance
PerformPreliminary
Analysis(Correlation)
Add PracticeAdd Practice to BM&Mto BM&M
QuestionnaireQuestionnaire
PerformPerformComprehensiveComprehensive
AnalysisAnalysis
ReportReportOutputOutput
ContinueContinueData CollectionData Collection
PreliminaryPreliminaryAssessmentAssessment
FailedFailed
PassedPassed
Process of Determining Value of Best Process of Determining Value of Best PracticesPractices
DetermineDeterminePractice to BMPractice to BM
1. Recommended1. Recommended Status as BPStatus as BP
2. Value of BP2. Value of BP

Preliminary AnalysisPreliminary AnalysisExpected CorrelationExpected Correlation
Project Change Management vs. Project Cost Growth
-0.6
-0.5
-0.4
-0.3
-0.2
-0.1
0.0
0.1
0.2
0.3
0.4
0.5
0.6
0 1 2 3 4 5 6 7 8 9 10
Project Change Management
Pro
ject
Co
st G
row
th
Actual Data
Project Change Management vs. Project Cost Growth
-0.6
-0.5
-0.4
-0.3
-0.2
-0.1
0.0
0.1
0.2
0.3
0.4
0.5
0.6
0 1 2 3 4 5 6 7 8 9 10
Project Change Management
Pro
ject
Co
st G
row
th
Actual Data

Preliminary AnalysisPreliminary AnalysisNo CorrelationNo Correlation
Notional Data
Practice X vs. Project Cost Growth
-0.6
-0.5
-0.4
-0.3
-0.2
-0.1
0.0
0.1
0.2
0.3
0.4
0.5
0.6
0 1 2 3 4 5 6 7 8 9 10
Constructability
Pro
ject
Co
st G
row
th
Practice X
Notional Data
Practice X vs. Project Cost Growth
-0.6
-0.5
-0.4
-0.3
-0.2
-0.1
0.0
0.1
0.2
0.3
0.4
0.5
0.6
0 1 2 3 4 5 6 7 8 9 10
Constructability
Pro
ject
Co
st G
row
th
Notional Data
Practice X vs. Project Cost Growth
-0.6
-0.5
-0.4
-0.3
-0.2
-0.1
0.0
0.1
0.2
0.3
0.4
0.5
0.6
0 1 2 3 4 5 6 7 8 9 10
Constructability
Pro
ject
Co
st G
row
th
Practice X
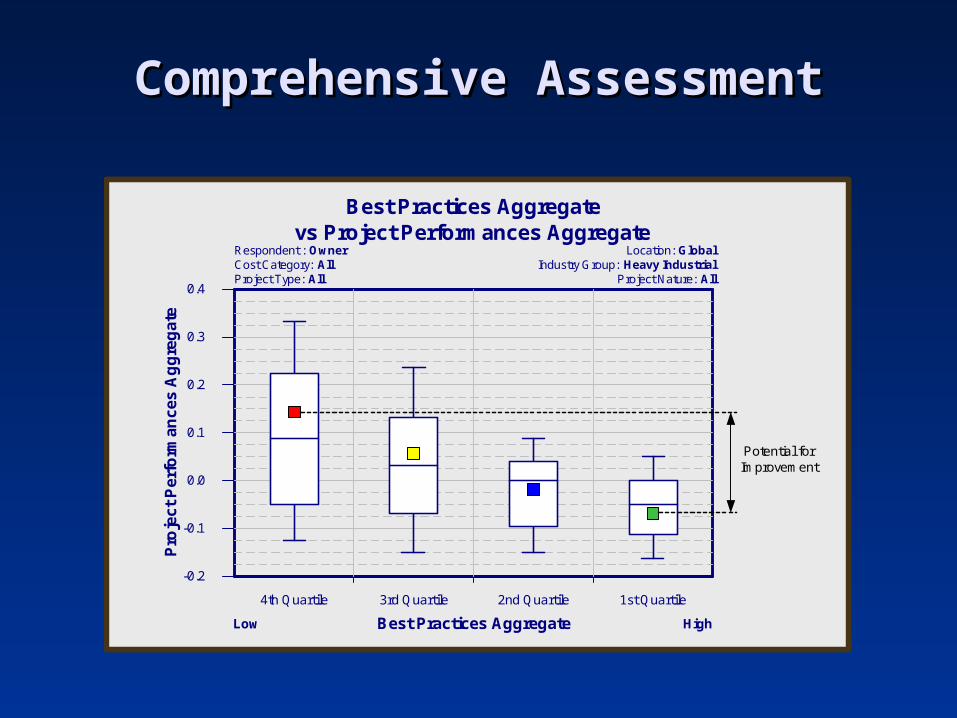
Comprehensive AssessmentComprehensive Assessment
-0.1
0.0
0.1
0.2
0.3
0.4
Location: GlobalIndustry Group: Heavy Industrial
Project Nature: All
Best Practices Aggregate
Pro
jec
t P
erf
orm
an
ce
s A
gg
reg
ate
4th Quartile 2nd Quartile3rd Quartile 1st Quartile
-0.2
Low High
Best Practices Aggregatevs Project Performances Aggregate
Respondent : OwnerCost Category: AllProject Type: All
Potential forImprovement

Cost SavingsCost Savings
By Standardized Practice Index
1st Quartile2nd Quartile3rd Quartile4th Quartile
.10
.08
.06
.04
.02
-.00
-.02
-.04
-.06
-.08
-.10
n=32 n=33 n=30 n=33
Respondent: OwnersCost Category: AllProject Type: All
Database: GlobalIndustry: BuildingsProject Nature: All
Project Cost Growth vs. Standardized Practice Index
Pro
ject
Cos
t Gro
wth
8.5%
By Standardized Practice Index
1st Quartile2nd Quartile3rd Quartile4th Quartile
.10
.08
.06
.04
.02
-.00
-.02
-.04
-.06
-.08
-.10
n=32 n=33 n=30 n=33
Respondent: OwnersCost Category: AllProject Type: All
Database: GlobalIndustry: BuildingsProject Nature: All
Project Cost Growth vs. Standardized Practice Index
By Standardized Practice Index
1st Quartile2nd Quartile3rd Quartile4th Quartile
.10
.08
.06
.04
.02
-.00
-.02
-.04
-.06
-.08
-.10
n=32 n=33 n=30 n=33n=32 n=33 n=30 n=33
Respondent: OwnersCost Category: AllProject Type: All
Database: GlobalIndustry: BuildingsProject Nature: All
Project Cost Growth vs. Standardized Practice Index
Respondent: OwnersCost Category: AllProject Type: All
Database: GlobalIndustry: BuildingsProject Nature: All
Project Cost Growth vs. Standardized Practice Index
Pro
ject
Cos
t Gro
wth
8.5%

Cost SavingsCost Savings
$10.9MM – Cost of average building $10.9MM – Cost of average building projectproject
x 8.5% – Cost growth savingsx 8.5% – Cost growth savings
$926K – Potential savings for $926K – Potential savings for typical typical
projectproject

Schedule ReductionsSchedule Reductions
By Standardized Practice Index
1st Quartile2nd Quartile3rd Quartile4th Quartile
.60
.50
.40
.30
.20
.10
0.00
-.10
-.20
n=28 n=30 n=29 n=22
Respondent: OwnersCost Category: AllProject Type: All
Database: GlobalIndustry: BuildingsProject Nature: All
Project Schedule Growth vs. Standardized Practice Index
Pro
ject
Sch
edu
le G
row
th
31.7%
By Standardized Practice Index
1st Quartile2nd Quartile3rd Quartile4th Quartile
.60
.50
.40
.30
.20
.10
0.00
-.10
-.20
n=28 n=30 n=29 n=22
Respondent: OwnersCost Category: AllProject Type: All
Database: GlobalIndustry: BuildingsProject Nature: All
Project Schedule Growth vs. Standardized Practice Index
By Standardized Practice Index
1st Quartile2nd Quartile3rd Quartile4th Quartile
.60
.50
.40
.30
.20
.10
0.00
-.10
-.20
n=28 n=30 n=29 n=22n=28 n=30 n=29 n=22
Respondent: OwnersCost Category: AllProject Type: All
Database: GlobalIndustry: BuildingsProject Nature: All
Project Schedule Growth vs. Standardized Practice Index
Respondent: OwnersCost Category: AllProject Type: All
Database: GlobalIndustry: BuildingsProject Nature: All
Project Schedule Growth vs. Standardized Practice Index
Pro
ject
Sch
edu
le G
row
th
31.7%

Schedule ReductionsSchedule Reductions
28 Month – Total duration of average 28 Month – Total duration of average buildingbuilding
projectproject
x 31.7% – Schedule growth savingsx 31.7% – Schedule growth savings
8 Month – Potential savings for 8 Month – Potential savings for typical typical
projectproject

Project Budget Factor= Actual Total Project Cost (Initial Predicted Project Cost + Approved Changes)
Cost Performance (Project Budget Factor) vs. Constructability
0.9525
0.9682
0.9941
4.8091
4.5081
3.8769
0.91
0.93
0.95
0.97
0.99
1.01
1.03
1.05
<= 6 yrs 7 -12yrs >12 yrs
Co
st
Per
form
anc
e(P
roje
ct B
ud
get
Fac
tor)
2.5
3.0
3.5
4.0
4.5
5.0
5.5
6.0
Co
ns
tru
ctab
ilit
y
BF
CNT

Safety Performance (RIR)vs. Zero Accident Tech.
7.0572
4.9222
3.4775
8.0988
8.47699.1021
3.0
4.0
5.0
6.0
7.0
8.0
9.0
10.0
<= 6 yrs 7 -12yrs >12 yrs
Saf
ety
Pe
rfo
rma
nce
(RIR
)
3
4
5
6
7
8
9
10
Zer
o A
ccid
ent
Tec
hn
iqu
es
RIR
ZAT

Gap AnalysisGap Analysis
-0.20
-0.15
-0.10
-0.05
0.00
0.05
0.10
Ver 11996
Ver 21997
Ver 31998
Ver 41999
Ver 52000
Ver 62001
Questionnaire Version and Year
Pro
ject
Co
st G
row
th
Time
Project Outcome
Δ Opportunity
CII Average Practice UseCII 1st Quartile Practice Use

The Effects of Best Practice Use by Industry Sector – Project The Effects of Best Practice Use by Industry Sector – Project Cost ImpactCost Impact
Infra.Infra. Bldg.Bldg.
ContractorContractor
H.I.H.I. Infra.Infra.H.I.H.I.Bldg.Bldg. L.I.L.I.
Team BuildingTeam Building
Zero AccidentZero Accident
TechniquesTechniques
Design / Info Design / Info
TechnologyTechnology
Change MgmtChange Mgmt
Constructability Constructability
Pre Project Pre Project PlanningPlanning
BestBest
PracticesPractices
OwnerOwner
L.I.L.I.
Low Low Low Low Low High Med Low
Low Med Low Med Med Med Med Med
Low Low Low Low Low Med Low Low
High High High Low Low High Low Low
Med Med Med High High Med Low High
High High Low High Low Med High Low
Comprehensive AssessmentComprehensive AssessmentImpact on Cost PerformanceImpact on Cost Performance
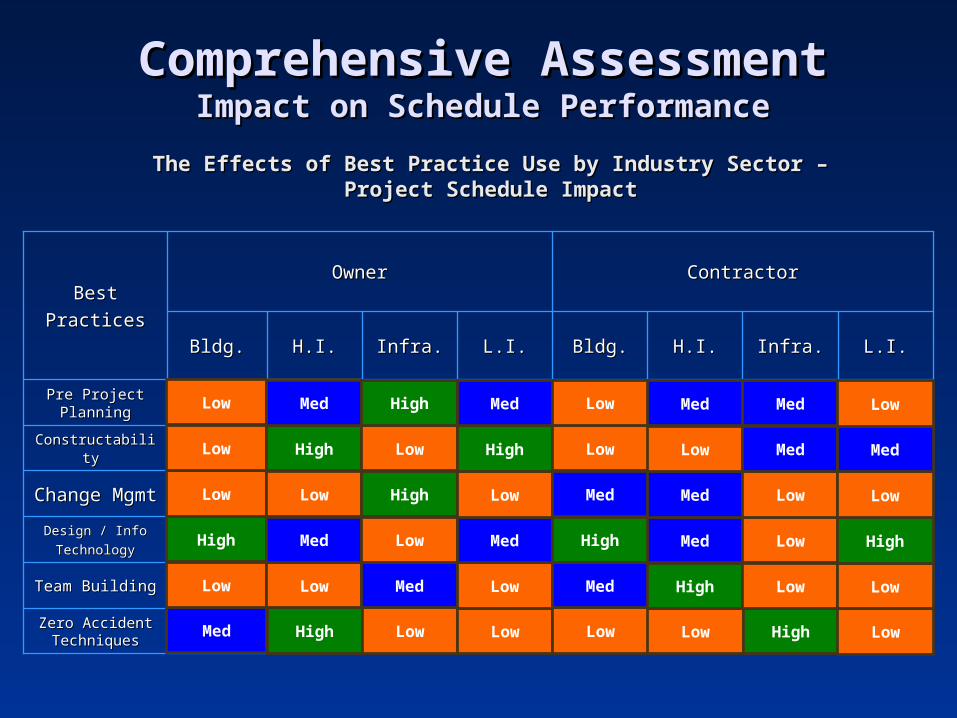
Comprehensive AssessmentComprehensive AssessmentImpact on Schedule PerformanceImpact on Schedule Performance
Infra.Infra. Bldg.Bldg.
ContractorContractor
H.I.H.I. Infra.Infra.H.I.H.I.Bldg.Bldg. L.I.L.I.
Team BuildingTeam Building
Zero Accident Zero Accident TechniquesTechniques
Design / InfoDesign / Info
TechnologyTechnology
Change MgmtChange Mgmt
ConstructabilityConstructability
Pre Project Pre Project PlanningPlanning
BestBest
PracticesPractices
OwnerOwner
L.I.L.I.
Med High Low Low Low Low High Low
Low Low Med Low Med High Low Low
High Med Low Med High Med Low High
Low Low High Low Med Med Low Low
Low High Low High Low Low Med Med
Low Med High Med Low Med Med Low
The Effects of Best Practice Use by Industry Sector – Project The Effects of Best Practice Use by Industry Sector – Project Schedule ImpactSchedule Impact

The ResultsThe ResultsSafety PerformanceSafety Performance
Owners & ContractorsOwners & Contractors
8.809.509.90
10.60
11.8012.20
13.1013.0014.2014.30
8.60
1.591.602.302.663.003.44
4.315.32
6.127.19
1.67
0
2
4
6
8
10
12
14
16
1989 1990 1991 1992 1993 1994 1995 1996 1997 1998 1999
325 413 477 497 527 613 644 770 518 765 995
Year and Work-hours (MM)
Record
ab
le I
ncid
en
ce R
ate
Industry
CII
Note: Industry based on OSHA SIC 15-17
8.30
1.03
2000
936
2001
Est.7.28
1.02
1,115

BenchmarkingBenchmarking
• Is critical to continuous improvement Is critical to continuous improvement
process.process.
• Requires senior management commitment.Requires senior management commitment.
• Requires continual analysis and Requires continual analysis and
assessment.assessment.
• Requires a structured approach.Requires a structured approach.
• Is not resource-intensive.Is not resource-intensive.
• Is available now.Is available now.
• Is important to the “bottom-line.”Is important to the “bottom-line.”

Get InvolvedGet Involved
Measure Your PerformanceMeasure Your Performance• Attend a Benchmarking training session to Attend a Benchmarking training session to
get your password to Project Central – CII get your password to Project Central – CII Benchmarking’s websiteBenchmarking’s website
• Add your project data to Project Central at Add your project data to Project Central at http://cii-benchmarking.orghttp://cii-benchmarking.org
AssessAssess• Evaluate your performanceEvaluate your performance• Determine the gapDetermine the gapImproveImprove• Use the Benchmarking and CII tools to Use the Benchmarking and CII tools to
improveimprove

You Need To Benchmark!