benchmarking small power energy consumption in … 1 of 16 benchmarking small power energy...
TRANSCRIPT

Loughborough UniversityInstitutional Repository
Benchmarking small powerenergy consumption in UKoffice buildings: a review ofdata published in CIBSE
guide F
This item was submitted to Loughborough University's Institutional Repositoryby the/an author.
Citation: MENEZES, A.C. ... et al., 2013. Benchmarking small power energyconsumption in UK office buildings: a review of data published in CIBSE guideF. Building Services Engineering Research and Technology, 34 (1), pp. 73-86.
Additional Information:
• This article was published in the journal, Building Services Engineer-ing Research and Technology [Sage c© The Chartered Institution ofBuilding Services Engineers] and the definitive version is available at:http://dx.doi.org/10.1177/0143624412465092
Metadata Record: https://dspace.lboro.ac.uk/2134/11553
Version: Accepted for publication
Publisher: Sage c© The Chartered Institution of Building Services Engineers
Please cite the published version.

This item was submitted to Loughborough’s Institutional Repository (https://dspace.lboro.ac.uk/) by the author and is made available under the
following Creative Commons Licence conditions.
For the full text of this licence, please go to: http://creativecommons.org/licenses/by-nc-nd/2.5/

Page 1 of 16
Benchmarking Small Power Energy Consumption in UK Office Buildings: A Review of Data Published in CIBSE Guide F
Anna Carolina MENEZES [1, 2], Andrew CRIPPS [1], Dino BOUCHLAGHEM [2], Richard BUSWELL[2]
[1] AECOM, Building Engineering, MidCity Place, 71 High Holborn, London, WC1V 6QS, UK
[2] Loughborough University, Centre for Innovative and Collaborative Construction Engineering, Loughborough, Leicestershire, LE11 3TU, UK
Abstract CIBSE’s Guide F is a widely recognised guidance document on energy efficiency in buildings which includes energy consumption benchmarks for small power equipment in offices. In its recently published 3rd edition, existing power demand benchmarks for office equipment were revised to better represent appliances found in contemporary office buildings. Other key sources of data such as typical operating hours for equipment, however, have been omitted. This paper compares the benchmarks published in both the 2nd and 3rd editions of Guide F against a set of measurements of small power loads in a real UK office building. Load profiles for the monitored equipment are also presented to supplement the information included in the new Guide F. Practical Application With the increasing demand for more realistic predictions of operational energy use in buildings, small power should not be disregarded since it typically accounts for more than 20% of total energy used in offices. Furthermore, small power loads can have a significant impact on the cooling loads of a building. This paper reviews existing benchmarks, focusing on the new update to CIBSE Guide F, comparing available benchmarks against newly gathered monitored data. Detailed load profiles for individual office equipment are also provided, which can be used by designers to inform better predictions of small power consumption in office buildings.
Keywords Small power, appliances, offices, energy performance, performance gap

Page 2 of 16
1.0 Introduction There is significant pressure to continue to improve the energy performance of buildings. A critical part of the design process is to be able to make realistic predictions of the energy performance in-use, however studies have demonstrated that buildings typically consume significantly more energy than anticipated[i,ii,iii]. This so-called ‘performance gap’ can be attributed to numerous factors relating to model based predictions as well as building operation. A key factor in the UK is the exclusion of several sources of energy use from the compliance calculations for Part L of the Building Regulations. These include all small power equipment, as well as external lighting, vertical transportation and ICT servers. In an office building, small power loads will typically represent a large proportion of the total energy consumption, with office equipment alone accounting for more than 20% of the total energy use[iv]. Data from Energy Consumption Guide (ECG) 19 provides typical and good practice values for office equipment and catering electricity loads, depicted in Figure 1, labelled ‘TYP’ and ‘GP’ respectively[v]. Values for four different types of office buildings are given: Type 1, naturally ventilated cellular office; Type 2, naturally ventilated open plan office; Type 3, air-conditioned standard office; and Type 4, air-conditioned prestige office (typically including large catering kitchen and/or regional server rooms).
Figure 1 - Typical and best practice electricity consumption for office equipment and catering equipment in office buildings [v] According to ECG 19, electricity consumption for office equipment ranges from 12 kWh/m2 per year (for good practice Type 1 offices) to 32 kWh/m2 per year (in typical Type 4 offices) [v]. These values respectively represent 36% and 9% of the total electricity consumption in each office type. The annual electricity consumption for catering equipment typically ranges from 2 kWh/m2 per year to 15 kWh/m2 per year, accounting for 6% to 4% of the total electricity consumption, respectively. Combined, office equipment and catering will usually represent between 13% and 44% of the total electricity consumption in an office building. These are significant proportions of the total building electricity load and should be given more attention if realistic predictions are to be achieved.

Page 3 of 16
According to the British Council for Offices (BCO), there is significant difference between actual small power loads observed in occupied buildings and those assumed for design purposes[vi]. The BCO also claims that current benchmarks fail to account for diversity of use, highlighting a need for more detailed benchmarks that reflect current and realistic usage of small power equipment in office buildings. Aiming to address these issues, our paper reviews and assesses the validity of existing benchmarks for small power consumption in office buildings using monitored data acquired as part of a case study. The scope of this review focuses mainly on the widely recognised CIBSE Guide F including its recent update published in May 2012 as well as the widely referenced previous (2nd) edition. 2.0 Existing Benchmarks and CIBSE Guide F One of the most widely recognised guidance documents on energy efficiency in buildings is CIBSE’s Guide F[vii, viii] . Section 12 of the publication deals exclusively with electrical power systems & office equipment, providing a compilation of data regarding power demand and energy consumption for small power equipment. Since the publication of its 2nd edition in 2004, Guide F has provided engineers with a wide range of benchmarks for an array of energy end-uses and building types, compiling information from numerous sources. The scope of this review will cover the key benchmarks published in the 2nd edition of Guide F, which have widely been used by designers over the last 8 years. It will also include a review of updates in the recently published, 3rd edition of Guide F. Data from other sources such as academic papers and reports will also be discussed, providing additional context. Table 1 displays high-level benchmarks for office equipment, originally published in ECG 19[v]. The data relates to the 4 office types from ECG 19 and provides typical (TYP) and good practice (GP) figures for installed capacity (in W/m2), annual running hours and percentage ICT area in relation to the treated floor area. In combination these values are used to calculate typical annual energy consumption data for office equipment (in kWh/m2 per year). Table 1: Benchmarks for office equipment originally published in ECG 19 [v, vii, viii]
Type 1 Type 2 Type 3 Type 4
GP TYP GP TYP GP TYP GP TYP
Installed capacity: floor area with ICT (W/m2) 10 12 12 14 14 16 15 18
Annual running hours (1000 of hours) 2 2.5 2.5 3 2.75 3.25 3.0 3.5
ICT area as % of treated floor area (%) 60 60 65 65 60 60 50 50
Consumption: office equipment (kWh/m2) 12 18 19.5 27.3 23.1 31.2 22.5 31.5
According to the 2nd edition of CIBSE Guide F, allowances of 15 W/m2 for installed loads are adequate for all but the most intensive users[vii]. The same value of 15 W/m2 is also published by the Building Services Research and Information Association (BSRIA) in their ‘Rules of Thumb’ guide as a typical small power load in general offices[ix]. Actual energy consumption data published by the BCO in 2009 suggests that higher installed loads can be found in typical office buildings, with one third of the offices monitored having installed loads higher than 15 W/m2 [vi]. With these findings in mind, the 3rd edition of Guide F suggests that a guide figure for building loads of 25 W/m2 is adequate for most office buildings (with15 W/m2 when diversity

Page 4 of 16
is taken into account). A previous study by Wilkins and McGaffin[x] also highlighted the importance of diversity, reporting on monitored energy consumption for small power in five office buildings in the US. Power densities of 18.8 W/m2 were reported without diversity, decreasing to 8.6 W/m2 once diversity had been accounted for. BSRIA’s Technical Note 8/92 highlights the risks associated with high level benchmarks for power demand reported in W/m2. According to the document such values must be considered carefully as there are a number of factors which can influence power demand such as workstation density and space utilisation. This issue is raised in the updated Guide F with a suggestion that designers, use a loading of approximately 140–150 W/desk when occupancy details are known. Numerous other parameters such as power management settings on ICT devices are also not captured by high level benchmarks, yet can have a significant impact on the instantaneous power demand as well as overall energy consumption. In 2003, the Australian National Appliance and Equipment Energy Efficiency Program (NAEEEP) published a report on the operational energy use issues of office equipment, investigating the impact of different power management settings on the overall energy consumption of desktop and laptop computers as well as monitors[xi]. The results demonstrated that significant variations in energy consumption occur when different power management settings are applied to the same device. When aggressive power management was implemented (powering down the computer to sleep mode after 5 minutes of inactivity) all machines used approximately 75% less energy than they would have consumed if no power management settings were applied. Aiming to address such variations, as well as other parameters influencing energy consumption, CIBSE Guide F (both in its 2nd and 3rd editions) provides an alternative methodology for calculating installed loads based on a ‘bottom-up’ approach. This method was adapted from Energy Consumption Guide 35[xii], providing a more robust prediction of energy consumption as opposed to high level benchmarks and relies on numerous sources of information, including:
• list of expected types of equipment; • typical power consumption figures; • estimated number of devices; • proportion of equipment with ‘sleep mode’ enabled; • usage diversity; and, • typical hours of usage for each equipment type1.
Table 2 provides values for the typical maximum, average and stand-by power demands for individual office equipment, including data published in both the 2nd and 3rd editions of CIBSE Guide F[vii, viii]. Most of the benchmarks included in the 2nd edition were originally published in the Building Research Energy Conservation Support Unit’s (BRECSU) Good Practice Guide
1 Only necessary when calculating energy consumption rather than power demand.
Page 5 of 16
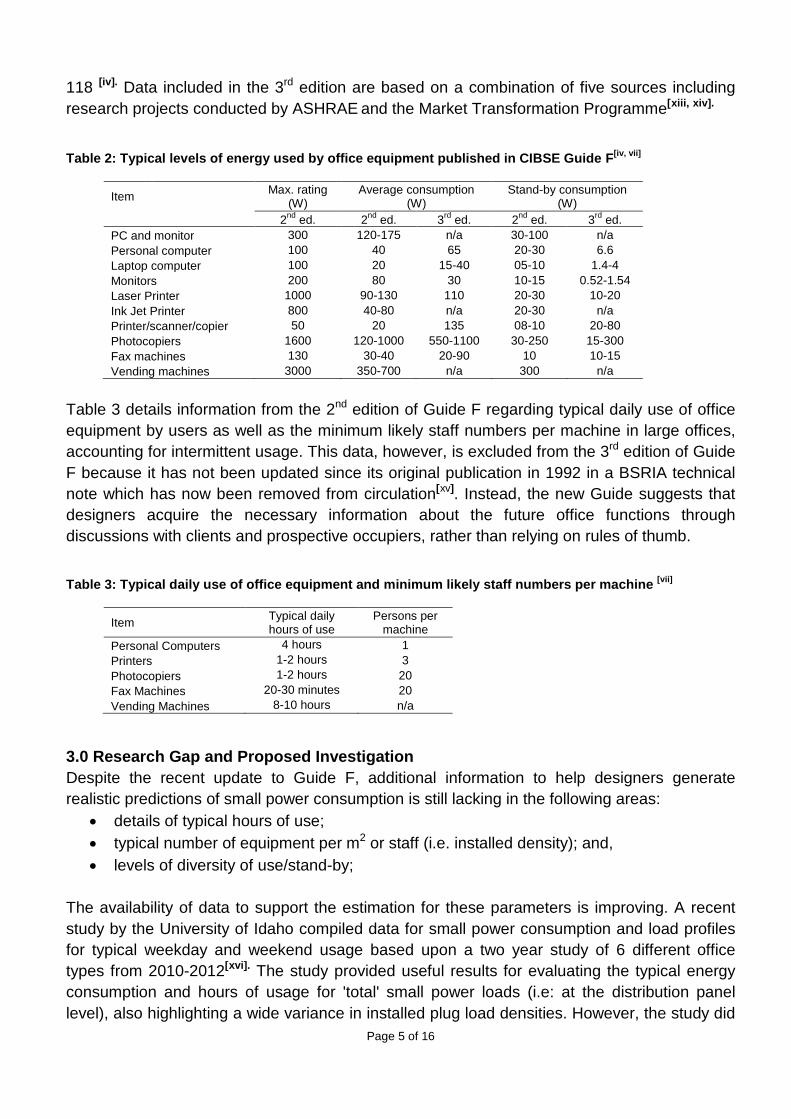
118 [iv]. Data included in the 3rd edition are based on a combination of five sources including research projects conducted by ASHRAE and the Market Transformation Programme[xiii, xiv].
Table 2: Typical levels of energy used by office equipment published in CIBSE Guide F[iv, vii]
Item Max. rating (W)
Average consumption (W)
Stand-by consumption (W)
2nd ed. 2nd ed. 3rd ed. 2nd ed. 3rd ed. PC and monitor 300 120-175 n/a 30-100 n/a Personal computer 100 40 65 20-30 6.6 Laptop computer 100 20 15-40 05-10 1.4-4 Monitors 200 80 30 10-15 0.52-1.54 Laser Printer 1000 90-130 110 20-30 10-20 Ink Jet Printer 800 40-80 n/a 20-30 n/a Printer/scanner/copier 50 20 135 08-10 20-80 Photocopiers 1600 120-1000 550-1100 30-250 15-300 Fax machines 130 30-40 20-90 10 10-15 Vending machines 3000 350-700 n/a 300 n/a
Table 3 details information from the 2nd edition of Guide F regarding typical daily use of office equipment by users as well as the minimum likely staff numbers per machine in large offices, accounting for intermittent usage. This data, however, is excluded from the 3rd edition of Guide F because it has not been updated since its original publication in 1992 in a BSRIA technical note which has now been removed from circulation[xv]. Instead, the new Guide suggests that designers acquire the necessary information about the future office functions through discussions with clients and prospective occupiers, rather than relying on rules of thumb. Table 3: Typical daily use of office equipment and minimum likely staff numbers per machine [vii]
Item Typical daily hours of use
Persons per machine
Personal Computers 4 hours 1 Printers 1-2 hours 3 Photocopiers 1-2 hours 20 Fax Machines 20-30 minutes 20 Vending Machines 8-10 hours n/a
3.0 Research Gap and Proposed Investigation Despite the recent update to Guide F, additional information to help designers generate realistic predictions of small power consumption is still lacking in the following areas:
• details of typical hours of use; • typical number of equipment per m2 or staff (i.e. installed density); and, • levels of diversity of use/stand-by;
The availability of data to support the estimation for these parameters is improving. A recent study by the University of Idaho compiled data for small power consumption and load profiles for typical weekday and weekend usage based upon a two year study of 6 different office types from 2010-2012[xvi]. The study provided useful results for evaluating the typical energy consumption and hours of usage for 'total' small power loads (i.e: at the distribution panel level), also highlighting a wide variance in installed plug load densities. However, the study did

Page 6 of 16
not provide load information on an individual appliance basis and so presented in this paper are some results from a monitoring study that includes small power load profiles for individual appliances. Table 4 details the scope of appliances monitored and the representation in both publications of Guide F.
Table 4: Description of data included in the study as well as both editions of Guide F
Item 2nd ed
3rd ed
Monitoring
Study Comments
Laptop Computers Monitoring included machines with distinctive processing powers Personal Computers
Monitors Monitoring included a variety of screen dimensions
Printer Laser Not available in the case study office building Ink jet Only one desktop inkjet printer was available for monitoring
Printer/scanner/copier Not available in the case study office building
Photocopiers Monitoring included two machines but of similar specifications
Fax machine Not available in the case study office building Vending machines Monitoring included hot and cold drinks units Microwave oven Commonly found in office buildings but not included in
benchmarks – worthwhile investigating Fridge A minimum of two appliances were monitored for each equipment type, with the exception of desktop inkjet printers. Class 1 accuracy Telegesis ‘ZigBee Plogg-ZGB’ plug monitors were used and have a published measurement uncertainty of <0.5%. The power consumption was monitored at 5-minute intervals and aggregated energy consumption was logged every 30 minutes. The findings from the study are compared to the old and new CIBSE guide F benchmarks.
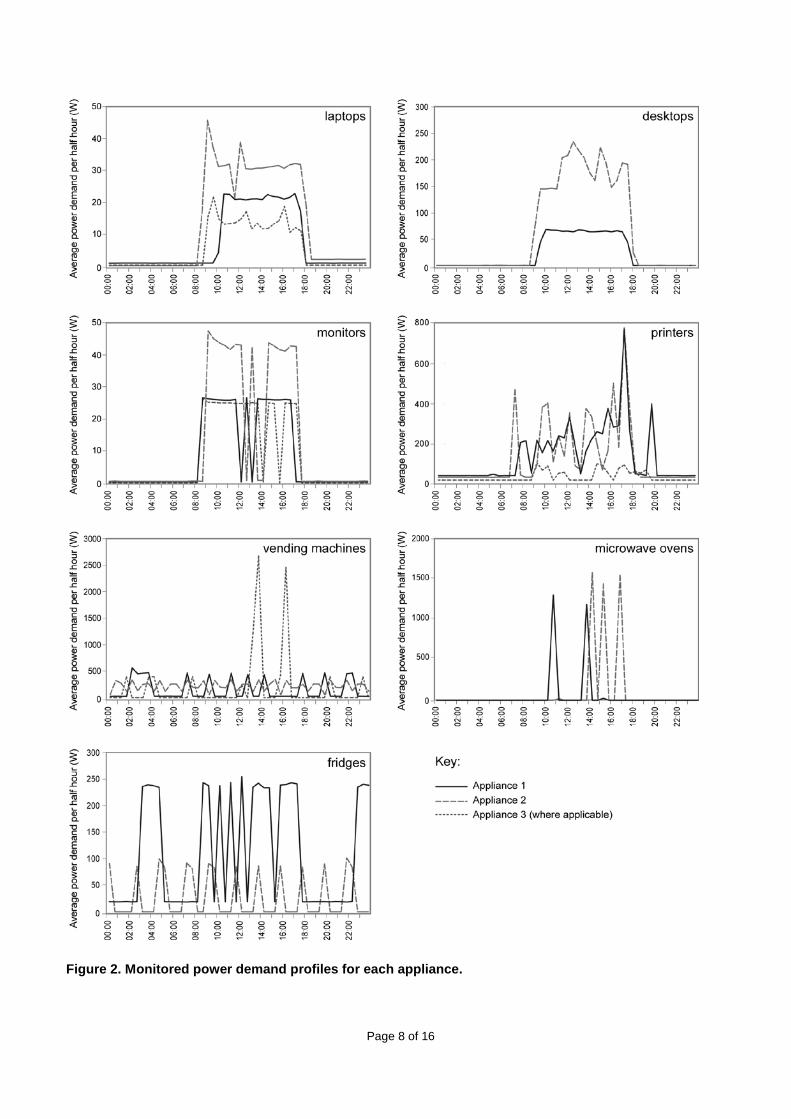
4.0 Results Figure 2 displays the results from the monitoring study compiled into graphs illustrating the typical weekday load profiles for different equipment. Table 5 highlights key power demand values for stand-by mode, maximum demand and average in-use demand. It is worth noting the ‘maximum demand’ values relate to the half hourly averages and peaks within this interval are likely to have been higher. 4.1 Laptop computers Three laptop computers with differing processing powers were monitored as part of this study. Note that values for laptop power demand were obtained while external monitors were being used, i.e. excluding the power demand for the in-built laptop screens. External monitors have been treated separately in the study. The newest laptop (Laptop 3), with an average in-use demand of 17.9W, had the lowest overall power demand, despite its occasional peaks throughout the day. Laptop 1 had an average in-use demand of 20.3W, and a less peaky power consumption throughout the day which was attributed in part to its single processor. Laptop 2 had the highest power demand in-use, averaging 30.9W and reaching a maximum value of 45.8W over 30-minute intervals, more than twice the maximum value recorded for Laptop 1. With regards to stand-by power demand, Laptop 1 consumed the most energy when not in use at 1.1W, compared to Laptops 2 and 3 at 0.3W and 0.5W respectively.

Page 7 of 16
4.2 Desktop computers Desktop 1 was a 3-year old computer with a 2.3 GHz processor, typically used to run programs such as word processors and spreadsheets. Desktop 2 was a higher performance computer with a 3.4 Ghz multi-core processor used to run 3D modelling software and Computational Fluid Dynamic (CFD) programs. It is worth noting that there were only 6 of these desktops in the monitored office amongst more than 200 computers. Desktop 1 consumed significantly less energy than Desktop 2 with an average in-use demand of 64.1W compared to 168.6W. The power demand from Desktop 1 was fairly constant throughout the working day. The power for Desktop 2, however, fluctuated between 140W - 230W, which might be expected as computationally intensive modelling processes tend to be executed and completed over a certain period. When considering stand-by mode, both desktops consumed similar amounts at approximately 1.9W. Table 5: Key power demand values for each monitored appliance
Equipment Appliance 1 Appliance 2 Appliance 3
a Laptops 1.3 GHz Intel Centrino processor
2.3 GHz Intel Core Duo processors
2.6 GHz Intel Core i5 processors
Stand-by mode 1.1 0.3 0.5 Maximum demand 22.9 45.8 27.6 Average in-use 20.3 30.9 17.9
b Desktops 2.3 GHz Intel Core Duo processors
3.4 GHz Intel Xeon processors -
Stand-by mode 1.9 2.0 - Maximum demand 69.1 233.7 - Average in-use 64.1 168.6 - c Monitors 19” LCD flat screen 19” LCD flat screen 21” LCD flat screen Stand-by mode 0.7 0.4 0.8 Maximum demand 26.7 26.3 47.7 Average in-use 23.2 22.4 35.7
d Printers Desktop ink-jet printer Large network printer/photocopier
Large network printer/photocopier
Stand-by mode 15.6 29.9 37.2 Maximum demand 103.0 771.6 765.1 Average in-use 49.1 235.1 223.2 e Vending Machines Snacks (food) Cold drinks Hot drinks Stand-by mode 89.0 88.9 23.4 Maximum demand 623.3 392.6 2663.9 Average in-use 158.8 262.1 337.8 f Microwave Ovens 800W power rating 900W power rating - Stand-by mode 2.1 1.9 - Maximum demand 1299.7 1578.9 - Average in-use 115.8 210.4 - g Fridges Full size fridge (375 L) Small fridge (150 L) - Stand-by mode 18.0 0.0 - Maximum demand 237.8 98.8 - Average in-use 133.6 26.4 -
Page 8 of 16
Figure 2. Monitored power demand profiles for each appliance.

Page 9 of 16
4.3 Computer monitors All three computer monitors investigated in this study were LCD screens. Monitors 1 and 2 had 19-inch screens and Monitor 3 had a 21-inch screen. All three monitors had power management settings activated: Monitors 1 and 3 switched to stand-by mode after 30 minutes of inactivity; and Monitor 2 had a shorter ‘power-down’ time of 15 minutes. As seen in Figure 2, the larger monitor consumed almost twice as much energy as the two smaller ones, with a maximum half-hourly demand of 47.7W compared to 26.3W - 26.7W for the 19-inch screens. In stand-by mode, Monitor 2 had the lowest consumption at 0.4W, Monitors 1 and 3 had 0.7W and 0.9W respectively. Monitor 2’s shorter ‘power-down’ time resulted in more frequent drops in energy consumption (to stand-by level) throughout the day resulting in a marginally lower average consumption than Monitor 1, despite their equal screen dimensions and almost identical peak power demand. The significant point here is that if both screens are permanently powered on because of the workload and are off for the same time (i.e. lunch break and overnight) then the power management strategy will have little impact, yet this could be more significant with intermittent use. 4.4 Printers Three printers were monitored as part of this study: Printer 1 was a desktop ink-jet printer and Printers 2 and 3 were large-scale digital laser printers. The desktop ink-jet printer (Printer 1) had a significantly lower power demand than both large-scale digital printer/scanner/photocopiers, averaging at 49.1W with maximum half-hourly demands of 103W. Printers 2 and 3 had average demands around 230W and maximum recorded demands of approximately 770W. These values reflect the operational characteristics of the desktop and office scale devices in terms of print speed and volume. What is interesting, however, is the relatively high stand-by power demand of Printer 1 at 15.6W when compared to the large machines at 29.9W and 37.2W. 4.5 Vending machines Vending Machine 1 sold snacks (such as crisps and sweets) and Vending Machine 2 sold cold drinks, both being refrigerated. Vending Machine 3 sold hot drinks and so contained a water heating device. Vending Machine 3 consumed significantly more energy than Vending Machines 1 and 2 due to its heating element, with an average demand of 337.8W compared to demands of 158.8W and 262.1W, respectively. When considering monitored maximum demands, Vending Machine 3 operated at up to 2663W, with a maximum half-hourly power demand approximately four times higher than Vending Machine 1 and almost seven times more energy intensive than Vending Machine 2. The load profiles for Vending Machine 3 clearly illustrate peak demands around lunchtime and late afternoon due to increased usage by employees purchasing hot drinks. When considering minimum power demands, the roles were reversed, with Vending Machines 1 and 2 having somewhat higher demands to cope with their cooling functions, demanding at least 57W compared to Vending Machine 1’s minimum demand of only 23.4W. 4.6 Microwave ovens Both monitored microwave ovens had stand-by consumptions of approximately 2W and similar maximum half-hourly demands of 1299.7W to 1578.9W when in use. Microwave 2’s higher

Page 10 of 16
maximum demands can be associated with its higher power rating at 900W compared to Microwave 1’s 800W rating. Such ratings refer to the each oven’s capacity to produce microwave radiation and typical energy demand is usually higher due to waste heat production and other inefficiencies. When considering each microwave oven’s average energy demand, Microwave 2 demonstrated significantly higher values than Microwave 1, with 210.4W compared to 115.8W, respectively. This can be associated both with the increased power rating and with the fact that Microwave 2 seems to have been used more frequently throughout a typical day than Microwave 1. 4.7 Fridges Fridge 1 is a large upright unit with a 375litre capacity and Fridge 2 a small upright unit with a 150litre capacity. Fridge 1 had a consistently higher power demand than Fridge 2, with average and maximum demands of approximately 140W and 240W, compared to 27W and 100W for Fridge 2. When considering the minimum demand, Fridge 2 had a negligible demand, typically 0W, whereas Fridge 1 had a minimum demand of 18W due to the unit having a small freezer. 5.0 Comparison of monitored data against benchmarks Tables 6-8 display the benchmarks for small power equipment published in the 2nd and 3rd editions of CIBSE Guide F as well as monitoring data discussed above. Figure 3 provides a graphical representation of the data illustrating the values as single data points or ranges in line with the available information. It is worth noting that benchmarks for fridges and microwave ovens are not covered in either edition of Guide F so have not been included in the comparison here. Table 6: Benchmarks & monitored maximum energy demand for small power equipment in offices
Item Maximum demand (W) Guide F Monitored
2nd ed. Laptop Computers 100 23-46 Desktop Computers 100 69-234 Computer Monitors 200 26-47 Desktop printers 800 103 Photocopiers 1600 765-772 Vending Machines 3000 513-2664
Table 7: Benchmarks & monitored average energy demand for small power equipment in offices
Item Average demand (W) Guide F
Monitored 2nd ed. 3rd ed. Laptop Computers 20 15-40 18-31 Desktop Computers 40 65 64-169 Computer Monitors 80 30 22-36 Desktop printers 40-80 135 49 Photocopiers 120-1000 550-1100 223-235 Vending Machines 350-700 n/a 183-338
Table 8: Benchmarks and monitored stand-by energy demand for small power equipment in offices
Item Stand-by demand (W) Guide F
Monitored 2nd ed. 3rd ed. Laptop Computers 5-10 1.4-4 0.3-1.1 Desktop Computers 20-30 6.6 1.9-2 Computer Monitors 10-15 0.52-1.54 0.4-0.8 Desktop printers 20-30 20-80 15.6 Photocopiers 30-250 15-300 30-37 Vending Machines 300 n/a 23-89

Page 11 of 16
Figure 3. Comparison of benchmarks & monitored power demand for small power equipment in offices
Benchmark data for maximum demand is longer available in the 3rd edition of Guide F, having been replaced by nameplate ratings and so comparisons for maximum demand have been made against the 2nd edition of Guide F only. Benchmarks for vending machines have also been removed in the 3rd edition of Guide F.

Page 12 of 16
5.1 Laptop computers Maximum monitored demands for laptop computers were observed to be significantly lower than the equivalent benchmarks from the 2nd edition of Guide F, with the highest consuming laptop having a maximum demand of approximately 50% of the benchmark value. The average demand of all monitored laptops, however, had a consumption range that incorporated the old benchmark value and fell within the range of the updated benchmarks published in the 3rd edition of Guide F. Meanwhile, the stand-by loads monitored were significantly lower than the old and new benchmarks, despite the fact that the benchmarks provided in the 3rd edition have been significantly reduced compared to those in the 2nd edition. 5.2 Desktop computers A maximum monitoring demand of 234W was observed as part of this study (for Desktop 2), being significantly higher than the maximum rating benchmark of 100W published in the 2nd edition of Guide F. This could present significant problems if high specification desktop computers such as Desktop 2 were to be specified in an office building, resulting in significantly higher internal heat gains than anticipated if these benchmarks were to be used. Both monitored desktop computers consumed more energy than the benchmark published in the 2nd edition of Guide F on average, with the higher specification desktop consuming over four times the benchmark demand (of 40W). Similar findings were reported by Duska et al. relating to ASHRAE benchmarks for energy consumption of desktop computers [xvii], where a trend towards increasing energy consumption levels from PCs was demonstrated. The work suggested updating benchmarks for peak demand between 110-200W (compared to published benchmarks of 55-75W. The updated benchmark of 65W published in the 3rd edition of Guide F aligns well with the monitored average demand of the basic specification laptop (within 2%). However, average demand for the high specification desktop was observed to be three times higher than the updated benchmark. In this instance, the computer was used for numerically intensive computations using engineering software such as CFD. Although this would be common in engineering practices, it might be less typical in an office of administrators, for example. This highlights the importance of using appropriate benchmarks when specifying ‘atypical’ office equipment and a clear understanding of the intended use of a building space is needed to make reasonable estimations, which is emphasised in the new Guide F. As for the stand-by mode, both monitored computers had demands significantly lower than the benchmark published in the 2nd edition of Guide F, at approximately 10% of the benchmark values. Updated benchmarks published in the 3rd edition have been reduced significantly (from 20-30W to 6.6W) yet these are still observed to be significantly higher than monitored stand-by demand, with the highest recorder stand-by demand being less than 30% of the updated benchmark. 5.3 Computer Monitors The benchmarks for maximum, average and stand-by demands in the 2nd edition of the CIBSE Guide were observed to be significantly higher than the monitored cases. When these benchmarks were originally published in the 1997 BRECSU guide, CRT screens were

Page 13 of 16
the predominant technology for computer screens [iv]. The observed differences are likely to be because of the more recent proliferation of LCD screens, which consume much less energy. This issue has been addressed in the 3rd edition of Guide F and the updated benchmarks for average and stand-by demand provide a much better correlation with monitored loads. Focusing on average demand, measured data fluctuates by approximately 20% above and below the updated benchmark, demonstrating its suitability for a range of different LCD screens with dimensions between 19-21 inches. Updated benchmarks for stand-by power also demonstrate improved applicability, with monitored data falling almost completely within the range provided in the 3rd edition of Guide F. 5.4 Desktop printers Monitoring data for the single desktop printer included in this study demonstrated a significantly lower maximum demand than the benchmark published in the 2nd edition of Guide F (at 103W compared to an 800W benchmark). The monitored average consumption was observed to be significantly lower than the updated benchmark value, despite having previously fallen within the benchmark range in the 2nd edition. Meanwhile, the monitored stand-by consumption figure of 15.6W was observed to be somewhat lower than the benchmark ranges provided in both editions of Guide F (i.e. 20-30W). This highlights that the range of operation of devices can vary, although the revised benchmarks appear to be reasonable. 5.5 Photocopiers The maximum monitored demands for photocopiers (765-772W) were observed to be approximately 50% of the benchmark published in the 2nd edition of Guide F. The average consumption of the monitored units was in the range 120-1000W published in the 2nd edition of Guide F. In the 3rd edition of Guide F, the benchmark range for average demand by photocopiers has been increased to 550-1100W. Monitored values now fall outside this range, being approximately 50% of the lowest margin. However, it is difficult to judge the appropriateness of the updated benchmark without taking into consideration the usage patterns of the photocopiers because electricity demand is heavily dependant on the printing/copying capacities and duties. With regards to stand-by demand, monitored loads fall within the ranges provided in both editions of Guide F, but are the lower end of the published ranges. 5.1.6 Vending Machines Maximum monitored demands for the vending machines demonstrated that the benchmark value of 3000W published in the 2nd edition of Guide F was applicable mainly to units selling hot drinks. The refrigerated vending machines only reached maximum demands of 500-630W. The average consumption demands for the monitored vending machines were below the benchmark range of 350-700W. When idle, the monitored machines had significantly lower consumptions than the benchmark (300W), with the highest consuming machine having a demand of only 89W when in ‘standby’. Vending machine benchmarks have been excluded in the 3rd edition.

Page 14 of 16
5.0 Conclusion This study reviewed existing and recently updated benchmarks for small power consumption in UK office buildings. A case study building was used to obtain monitored consumption data from typical equipment and appliances providing a comparison against the old and revised benchmarks given in the 3rd edition of CIBSE Guide F. Results from this study suggest that the benchmarks published in the 2nd edition of Guide F were broadly unrepresentative of small power equipment currently being used in office buildings. Key findings were:
• typical desktop computers can have higher maximum demands and average energy consumption than the old benchmarks;
• laptop computers were observed to have lower maximum demands than the old benchmarks, although average consumption values were reasonable;
• stand-by power demand for both laptop and desktop computers were observed to be only a fraction of the old benchmarks;
• old benchmarks for computer monitors relate to CRT monitors being unrepresentative of energy consumption by LCD monitors which are widely used in contemporary office buildings;
• benchmarks for printers and photocopiers were fairly representative, excepting that the machine workload is not accounted for in the benchmarks, or in the study;
• refrigerating vending machines were fairly well represented, however machines that supply heating on demand can consume significantly more energy and are heavily workload dependant, something that is not addressed in the guide.
A review of the recently published 3rd edition of CIBSE Guide F demonstrated that the updated benchmarks were generally more representative of the monitored equipment, however there were some notable observations:
• the average demand for high specification desktop computers can be significantly larger than the benchmarks suggest and hence an understanding of this equipment is critical when estimating in-use performance;
• photocopiers required a measure of expected load if reasonable estimates are to be derived from the benchmarks;
• in all cases it would appear that the standby loads are over estimated in the new Guide, excepting that the limitations of this study may bias the results presented.
The revised Guide F is a significant step forward, offering more appropriate guidance on expected appliance consumption. However there is still work to be done to inform designers on how to better predict small power loads in-use, through the development of metrics that give an indication of typical hours of use or appliance workload. A stronger dialogue between designers and clients is also of utmost importance so that equipment specifications and operational characteristics can be accurately established, allowing designers to make better estimates on the small power energy consumption in-use.

Page 15 of 16
6.0 Acknowledgements The authors would like to thank the Engineering and Physical Sciences Research Council (EPSRC), Loughborough University and AECOM for providing the necessary funding and support to undertake this study.
References
i Bordass, B., Cohen, R. & Field, J. Energy Performance of Non-Domestic Buildings – Closing the Credibility Gap: Proceedings of the International Conference on Improving Energy Efficiency in Commercial Buildings, Frankfurt, Germany, 2004.
ii Bordass, B., Cohen, R., Standeven, M. & Leaman, A. Assessing Building Performance in Use 3: Energy Performance of Probe Buildings. Building Research and Information 2011; vol. 29, no. 2: 114-128.
iii Menezes, A. C., Cripps, A., Bouchlaghem, D. & Buswell, R. Predicted vs. actual energy performance of non-domestic buildings: Using post-occupancy evaluation data to reduce the performance gap. Applied Energy Journal 2011 [article in press].
iv BRECSU. Managing energy use - minimising running costs of office equipment and related air-conditioning. Good Practice Guide 118. Watford: Building Research Energy Conservation Support Unit, 1997.
v BRECSU. Energy Consumption Guide 19: Energy use in offices. Watford: Building Research Energy Conservation Support Unit, 2000.
vi BCO. Small Power Use in Offices. London: British Council for Offices, 2009.
vii CIBSE. Guide F: Energy Efficiency in Buildings, 2nd edition. London: The Chartered Institution of Building Services Engineers, 2004.
viii CIBSE. Guide F: Energy Efficiency in Buildings, 3rd edition. London: The Chartered Institution of Building Services Engineers, 2012.
ix BSRIA. Rules of Thumb: Guideline for Building Services, 4th edition. London: Building Services Research and Information Association, 2003.
x Wilkins, C. & McGaffin, N. Measuring computer equipment loads in office building. ASHRAE Journal 36 pp 21-24. Atlanta: American Society of Heating, Refrigeration and Air-Conditioning Engineers, 1994.
xi NAEEEP. A Study of Office Equipment Operational Energy Use Issues. Canberra: National Appliance and Equipment Energy Efficiency Program, Australian Greenhouse Office, 2003.

Page 16 of 16
xii BRECSU. Energy Consumption Guide 35: Energy efficiency in offices – Small power loads. Watford: Building Research Energy Conservation Support Unit, 1993.
xiii Hosni, M & Beck B. Update to Measurements of Office Equipment Heat Gain Data – Final Report. ASHRAE Research Project 1482-RP. Atlanta: American Society of Heating, Refrigeration and Air-Conditioning Engineers, 2011.
xiv DEFRA. Overview of MTP Desktop Computer Testing Activities and Results – Market Transformation Programme. RPICTXX06. London: Department of Environment, Food and Rural Affairs, 2009.
xv Parsloe, C & Hejab, M. Small Power Loads – Technical Note 8/92. London: Building Services Research and Information Association, 2003.
xvi Acker, B., Duarte, C., Van Den Wymelenberg, K. Office Load Profiles: Technical Report 20100312-01. University of Idaho: Integrated Design Lab, 2012.
xvii Duska, M., Lukes, J., Bartak, M., Drkal, F. & Hensen, J. Trend in heat gains from office equipment. Proceedings of the 6th International Conference on Indoor Climate of Buildings. Bratislava, 2007.