benchmarking quality: how medical device and diagnostics companies manage cost effectiveness while...
TRANSCRIPT

BEST PRACTICES,
®
LLC
Best Practices, LLC Strategic Benchmarking Research
Benchmarking Quality: How Medical Device & Diagnostics
Companies Manage Cost Effectiveness
while Ensuring Quality & Safety
BEST PRACTICES,
®
LLC
Table of Contents - 1
Executive Summary………………………………………………………………….
Research Overview
Participating Companies
Key Findings & Insights…………………………………………………………….
Inclusions & Exclusions Impact Quality Spend Levels………….......….…..
Future Quality Spend Drivers: Complexity, High Change Rates &
Increased Regulatory Scrutiny…………………………………………………….
Future Quality Spend Normalizers: Simplification, Standardization,
Divestitures & Automation…………………………………………………………
Fully Integrating Independent Quality Systems & Acquisitions Supports
Standardization & Simplification………………………………………………….
Regulatory Scrutiny & Internal Complexity, Efficiencies & Cost Pressures
Challenge Quality Leaders for Next Two Years…………………………………
Quality Staffing Steadies After Three Years of Influx………………………….
Quality Budget Allocations for Key Activities Favor Product Support &
Compliance Activities……………………………………………………………….
2
Copyright © Best Practices, LLC
5
7
15
27
35
42
52
56
64
BEST PRACTICES,
®
LLC
Table of Contents - 2
Compliance: Quality Plays Leading Role in Compliance Activities with
Help from Company Sites in Low-Wage Labor Markets………………………
Compliance: Up to Half of Released Documents Changed or Updated in
2012……………………………………………………………………………………..
Inspection/Production: Quality Takes the Lead in Majority of
Inspection/Production Activities with Help of Outsourcers in Low-Wage
Labor Markets…………………………………………………………………………
Inspection/Production: Varied Size of Supplier Networks – Still Requires
Detailed Inspection 60%+ of Incoming Batches for Most …………………….
Inspection/Production: Software Validation Activities Span Several
Functions with Many Landing Under Quality's Purview………………………
Inspection/Production: Centralized Labs & Outsourced Vendors Perform
Majority of Sterilization, Toxicology, & Biocompatibility Qualification
Tests…………………………………………………………………………………….
3
Copyright © Best Practices, LLC
69
74
78
83
86
90

BEST PRACTICES,
®
LLC
Table of Contents - 3
Non-Conforming: Quality Governs Non-Conforming Activities with Help
of Company Sites in Low-Wage Labor Markets………………………………...
Non-Conforming: Cycle Times for Processing CAPAs Can Take Up to A
Year or More…………………………………………………………………………..
Non-Conforming: Virtual Reviews & Automation Help Manage Thousands
of Annual Complaints ……………………………………………………………….
Product Support: Pre-Clinical & Clinical Quality Assurance Activities Not
Often Led by Quality…………………………………………………………………
Product Support: Quality Is Involved in Many Aspects of Design Control
& Cross-Charge Related Expenses……………………………………………
Additional Quality Activities: Quality Supports Many Additional Activities
with Use of Company Sites & Outsourced Vendors in Low-Wage Labor
Markets…………………………………………………………………………………
Universe of Learning: Key Demographics of Participating Companies …..
Appendix……………………………………………………………………………....
4
Copyright © Best Practices, LLC
92
97
101
106
111
115
120
128
BEST PRACTICES,
®
LLC
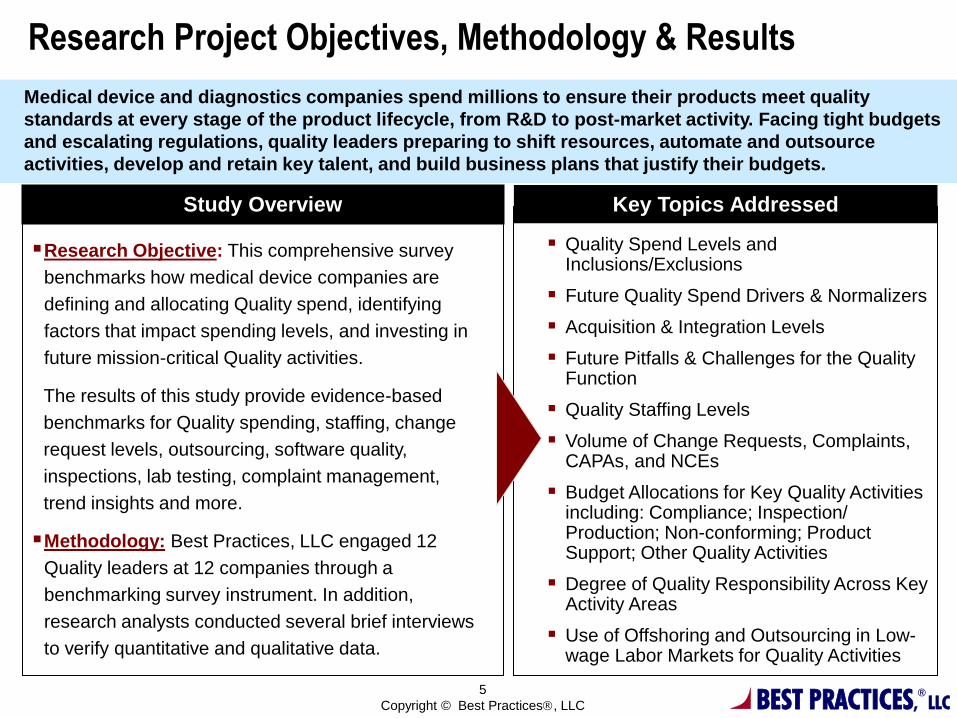
Key Topics Addressed Study Overview
Quality Spend Levels and Inclusions/Exclusions
Future Quality Spend Drivers & Normalizers
Acquisition & Integration Levels
Future Pitfalls & Challenges for the Quality Function
Quality Staffing Levels
Volume of Change Requests, Complaints, CAPAs, and NCEs
Budget Allocations for Key Quality Activities including: Compliance; Inspection/ Production; Non-conforming; Product Support; Other Quality Activities
Degree of Quality Responsibility Across Key Activity Areas
Use of Offshoring and Outsourcing in Low-wage Labor Markets for Quality Activities
Research Objective: This comprehensive survey
benchmarks how medical device companies are
defining and allocating Quality spend, identifying
factors that impact spending levels, and investing in
future mission-critical Quality activities.
The results of this study provide evidence-based
benchmarks for Quality spending, staffing, change
request levels, outsourcing, software quality,
inspections, lab testing, complaint management,
trend insights and more.
Methodology: Best Practices, LLC engaged 12
Quality leaders at 12 companies through a
benchmarking survey instrument. In addition,
research analysts conducted several brief interviews
to verify quantitative and qualitative data.
Research Project Objectives, Methodology & Results
5
Copyright © Best Practices, LLC
Medical device and diagnostics companies spend millions to ensure their products meet quality
standards at every stage of the product lifecycle, from R&D to post-market activity. Facing tight budgets
and escalating regulations, quality leaders preparing to shift resources, automate and outsource
activities, develop and retain key talent, and build business plans that justify their budgets.

BEST PRACTICES,
®
LLC
Benchmark Class:
6
Copyright © Best Practices, LLC
• Corporate Vice President, Quality and Regulatory
• Senior Vice President, Quality and Regulatory
• Vice President, Global Quality Systems
• Vice President, Quality Assurance Operations
• Vice President, Quality and Regulatory
• Vice President, Quality and Regulatory Affairs
• Senior Director, Global Quality Systems
• Senior Director, Global Quality and Regulatory
• Senior Director, Quality
• Director, Quality Systems
• Senior Manager, Quality and Quality Assurance
• Manager, Quality Assurance and
Regulatory Affairs
Job Titles of Respondents:
Universe of Learning: 12 Med Dev Orgs, 6 in Large Co. Segment
Twelve benchmark survey respondents participated in this research, nearly half of whom serve as vice presidents in Quality. Eleven of 12 benchmark companies represented are based in the United States. Two participants represent large business units instead of the entire company. The six circled companies make up the large company segment (LCS), with an average of $3.9 billion in 2012 revenue from medical device operations.
BEST PRACTICES,
®
LLC
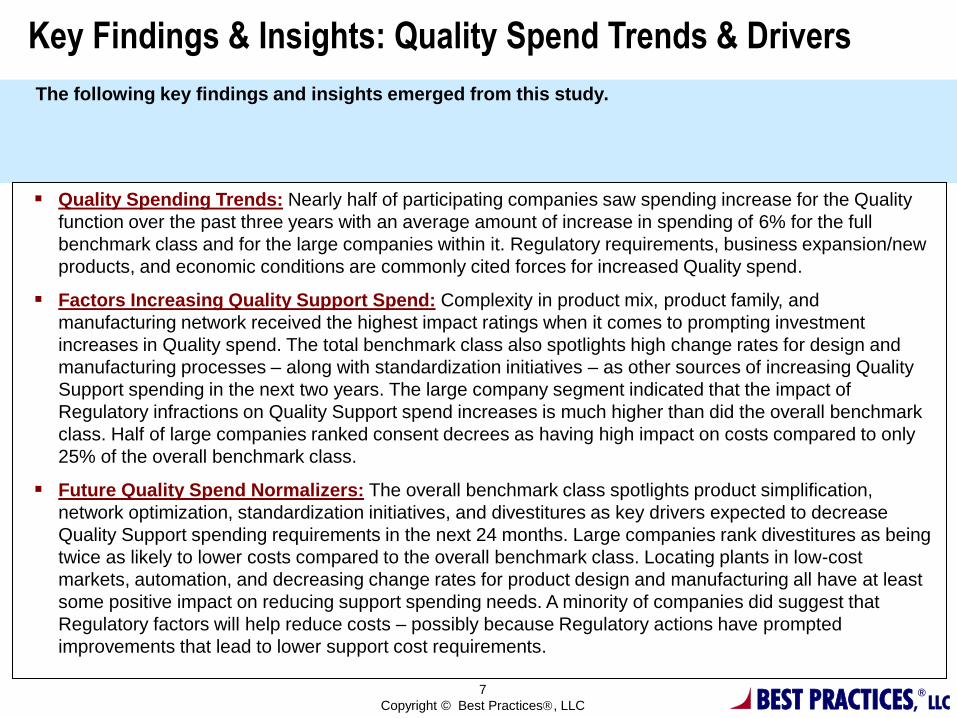
Key Findings & Insights: Quality Spend Trends & Drivers
The following key findings and insights emerged from this study.
Quality Spending Trends: Nearly half of participating companies saw spending increase for the Quality
function over the past three years with an average amount of increase in spending of 6% for the full
benchmark class and for the large companies within it. Regulatory requirements, business expansion/new
products, and economic conditions are commonly cited forces for increased Quality spend.
Factors Increasing Quality Support Spend: Complexity in product mix, product family, and
manufacturing network received the highest impact ratings when it comes to prompting investment
increases in Quality spend. The total benchmark class also spotlights high change rates for design and
manufacturing processes – along with standardization initiatives – as other sources of increasing Quality
Support spending in the next two years. The large company segment indicated that the impact of
Regulatory infractions on Quality Support spend increases is much higher than did the overall benchmark
class. Half of large companies ranked consent decrees as having high impact on costs compared to only
25% of the overall benchmark class.
Future Quality Spend Normalizers: The overall benchmark class spotlights product simplification,
network optimization, standardization initiatives, and divestitures as key drivers expected to decrease
Quality Support spending requirements in the next 24 months. Large companies rank divestitures as being
twice as likely to lower costs compared to the overall benchmark class. Locating plants in low-cost
markets, automation, and decreasing change rates for product design and manufacturing all have at least
some positive impact on reducing support spending needs. A minority of companies did suggest that
Regulatory factors will help reduce costs – possibly because Regulatory actions have prompted
improvements that lead to lower support cost requirements.
7
Copyright © Best Practices, LLC

BEST PRACTICES,
®
LLC
(n=11)
Q12. How has the total spend of your company's medical device Quality function changed over the past three
years (2010-2012)?
8
Copyright © Best Practices, LLC
Spend Change Trend: Cost Changes Over Past 3 Years in
Medical Devices Quality Function
(n=6)
45% 50%
36% 33%
18% 17%
Total BenchmarkClass
Large CompanySegment
Increased Remained the same Decreased
Total %
Change in
Quality spend
in past 3 years
Max 30%
75th Percentile 10%
Mean 6%
Median 0%
25th Percentile 0%
Min -8%
(n=5)
Large Company Segment:
Total %
Change in
Quality spend
in past 3 years
Max 30%
75th Percentile 8%
Mean 6%
Median 0%
25th Percentile 0%
Min -10%
(n=10)
Total Benchmark Class:
45% of Participants Increased Quality Spending in Past 3 Years
Nearly half of participating companies saw spending increase for the Quality function over the past three
years. The average amount of increase in spending for the Quality function was 6% for both the full
benchmark class and the large companies within it.

BEST PRACTICES,
®
LLC
0
2
4
6
8
10
12
0.0% 1.0% 2.0% 3.0% 4.0% 5.0%
Quality Cost / Revenue
Finding Your Zone of Optimal Competitiveness (Core Quality Costs Excluding Various Support Services)
Company A
Company B
Company C
Company D
Company E
Company F
Company G
Company H
Company I
Company J
Company K
Entering Zone of Competitiveness for Quality “Core Costs”
On average, companies spend about 1.8% of revenue on the Quality function. For large companies, the average was lower at 1.7%. However, with Quality spend increasing by an average of 6-10% overall, companies are moving toward an optimal zone of competition where spend lands between 1.5% - 3% of total revenue. Most companies exclude a host of Support Services & Functions in the calculation of Quality core costs.
TB
C A
ve
rag
e =
1.8
%
9
Copyright © Best Practices, LLC
BEST PRACTICES,
®
LLC
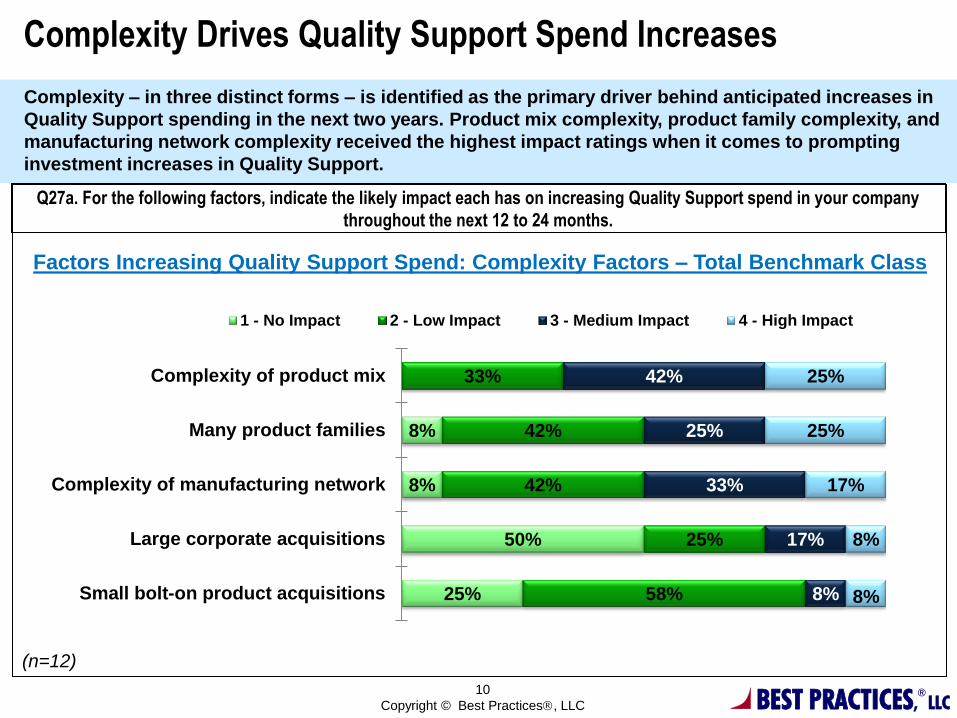
Complexity Drives Quality Support Spend Increases
Complexity – in three distinct forms – is identified as the primary driver behind anticipated increases in
Quality Support spending in the next two years. Product mix complexity, product family complexity, and
manufacturing network complexity received the highest impact ratings when it comes to prompting
investment increases in Quality Support.
(n=12)
Q27a. For the following factors, indicate the likely impact each has on increasing Quality Support spend in your company
throughout the next 12 to 24 months.
10
Copyright © Best Practices, LLC
Factors Increasing Quality Support Spend: Complexity Factors – Total Benchmark Class
8%
8%
50%
25%
33%
42%
42%
25%
58%
42%
25%
33%
17%
8%
25%
25%
17%
8%
8%
Complexity of product mix
Many product families
Complexity of manufacturing network
Large corporate acquisitions
Small bolt-on product acquisitions
1 - No Impact 2 - Low Impact 3 - Medium Impact 4 - High Impact

BEST PRACTICES,
®
LLC
Less Than Half of Quality Systems at Acquired Companies Are Fully Integrated into Existing Standards The total benchmark class has fully integrated only 38% of acquired sites into existing Quality standards.
Conversely, 29% of deals remain stand-alone and 34% pursue only partial integration with parent
company Quality standards. All companies plan for future integration.
Q35. Based on the past 3 years (2010-2012) of acquisitions, estimate the % of acquired facilities where Quality staff and
systems have been fully integrated into your corporate Quality standards.
11
Copyright © Best Practices, LLC
(n=7)
Quality Integration for Acquired Sites – Total Benchmark Class:
Percentage of total
acquisitions fully
Integrated, 38%
Percentage of total
acquisitions remaining
stand-alone (no
integration), 25%
Percentage of total
acquisitions with some integration but not all
sites/ systems,
34%
• All companies plan for future integration.
• Two companies in the total benchmark class indicate that they have already
fully integrated, therefore their data were omitted from the calculations.
Currently
% of total
acquisitions
fully inte-
grated
% of total
acquisitions
remaining
stand-alone
% of total
acquisitions
with some
integration
Max 75% 100% 100%
75th Percentile 65% 50% 40%
Mean 38% 29% 34%
Median 50% 0% 31%
25th Percentile 5% 0% 13%
Min 0% 0% 0%
Average Degree Current
Acquisition Integration:

BEST PRACTICES,
®
LLC
12
Structure
People
Products
Custom-ers
Sales Forces
Facilities
Suppliers
Quality Systems
Technol-ogy
Integration
Center of
Excellence
Integration Centers of Excellence Help Achieve M&A
Productivity Targets Many acquisitions and decentralized culture have permitted many quality systems not to be fully integrated. Fully integrating quality systems across acquired companies and assets offer greater efficiencies. Some companies employ Integration Centers of Excellence to accomplish this.
Benefits Of Integration
Specialists
Specialists can organize quickly
Have experience with past
integrations
Employ “due diligence” mindset to
integration
Drive early synergy actions
Avoid common mistakes
Remain focused on integration for
full cycle
Don’t have line operation
responsibilities that distract
Get to back-end opportunities:
Quality, Technology, et al.
BEST PRACTICES,
®
LLC
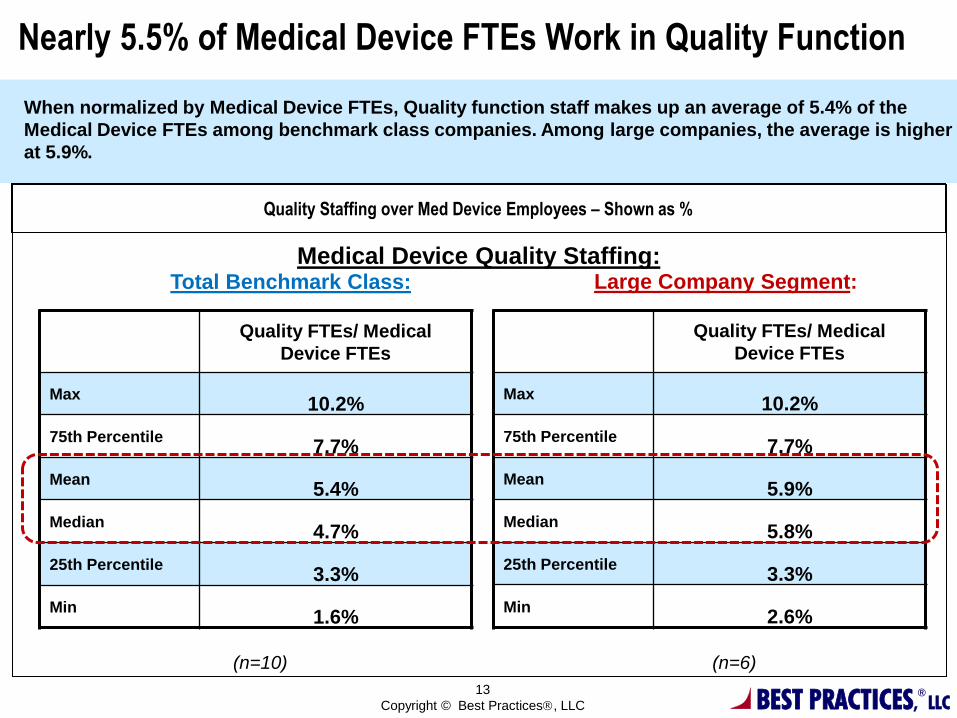
Quality Staffing over Med Device Employees – Shown as %
13
Copyright © Best Practices, LLC
Medical Device Quality Staffing:
Quality FTEs/ Medical
Device FTEs
Max 10.2%
75th Percentile 7.7%
Mean 5.9%
Median 5.8%
25th Percentile 3.3%
Min 2.6%
Quality FTEs/ Medical
Device FTEs
Max 10.2%
75th Percentile 7.7%
Mean 5.4%
Median 4.7%
25th Percentile 3.3%
Min 1.6%
(n=10) (n=6)
Total Benchmark Class: Large Company Segment:
Nearly 5.5% of Medical Device FTEs Work in Quality Function
When normalized by Medical Device FTEs, Quality function staff makes up an average of 5.4% of the
Medical Device FTEs among benchmark class companies. Among large companies, the average is higher
at 5.9%.

BEST PRACTICES,
®
LLC
Majority Changed Less than 50% of Released & Effective Docs
Forty percent of the total benchmark class indicated that their Quality functions changed or updated
between 31-50% of released and effective documents in 2012. One large-company representative
achieved the lowest change/update rate of 11-15% in the benchmark class.
(n=10)
Q37. What percentage of your company's released and effective documents were changed or updated in 2012?
14
Copyright © Best Practices, LLC
Document Change Levels:
Total Benchmark Class: Large Company Segment:
(n=5)
11-15%, 10%
16-20%, 10%
21-30%, 30%
31-50%, 40%
More than 50%, 10%
11-15%, 20%
31-50%, 60%
21-20%,
20%

BEST PRACTICES,
®
LLC
Q26d. Please estimate the percentage of Quality Assurance activities that are done in low-wage markets at company sites vs.
via third-party outsourcers.
15
Copyright © Best Practices, LLC
Managing QA Labor Costs across Global Markets
(n=4-5)
Large Companies Use Low-Wage Markets for Quality Engineering & Design Assurance for Commercial Products
All participants in the large company segment perform at least some Quality Engineering and Design Assurance for Commercial Products support activities at company sites in low-wage markets. Up to 40% also use third-party vendors in these markets for some Quality Engineering activities.
Companies performing activities in low-wage
markets at company sites
Companies using 3rd-party outsourced vendors to
conduct activities in low-wage markets
Quality
Engineering
Pre-Clinical
Quality
Assurance
Clinical
Quality
Assurance
Design
Assurance
for New
Products &
Commercial
Products
Quality
Engineering
Pre-Clinical
Quality
Assurance
Clinical
Quality
Assurance
Design
Assurance
for New
Products &
Commercial
Products
0% 0% 25% 75% 20% 0% 60% 75% 100% 80% 80%
1-15% 0% 75% 25% 60% 0% 40% 0% 0% 20% 20%
16-30% 40% 0% 0% 0% 40% 0% 0% 0% 0% 0%
31-50% 40% 0% 0% 0% 20% 0% 0% 0% 0% 0%
51-100% 20% 0% 0% 20% 40% 0% 25% 0% 0% 0%
Large Company Segment – Product Support Activities:
%
Activities
Performed
BEST PRACTICES,
®
LLC
(n=11)
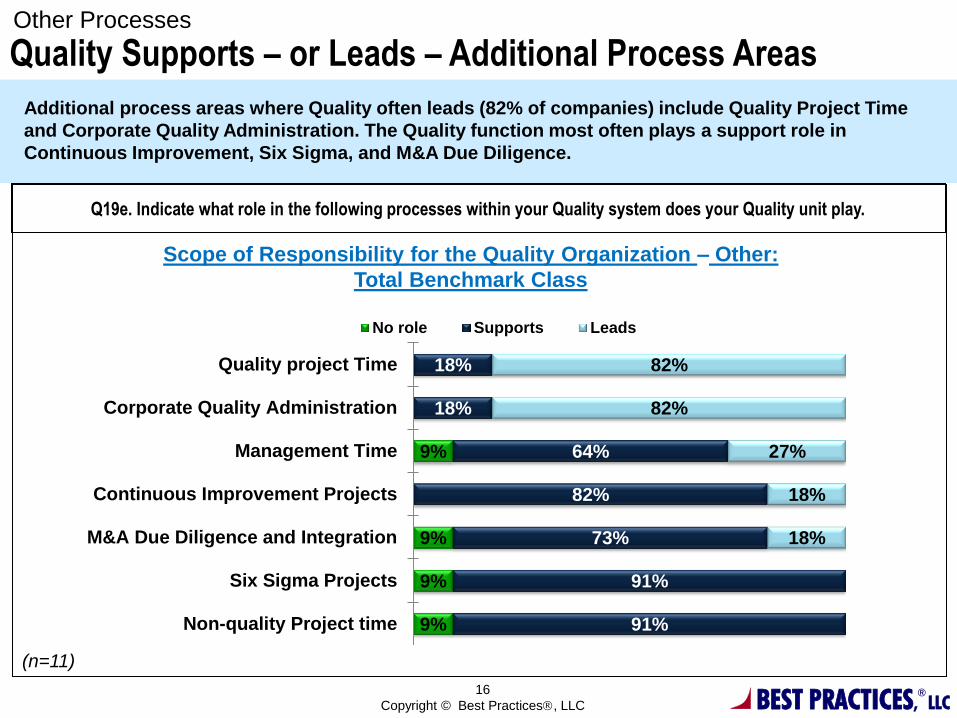
Q19e. Indicate what role in the following processes within your Quality system does your Quality unit play.
16
Copyright © Best Practices, LLC
Scope of Responsibility for the Quality Organization – Other:
Total Benchmark Class
Quality Supports – or Leads – Additional Process Areas
Additional process areas where Quality often leads (82% of companies) include Quality Project Time
and Corporate Quality Administration. The Quality function most often plays a support role in
Continuous Improvement, Six Sigma, and M&A Due Diligence.
Other Processes
9%
9%
9%
9%
18%
18%
64%
82%
73%
91%
91%
82%
82%
27%
18%
18%
Quality project Time
Corporate Quality Administration
Management Time
Continuous Improvement Projects
M&A Due Diligence and Integration
Six Sigma Projects
Non-quality Project time
No role Supports Leads
BEST PRACTICES,
®
LLC
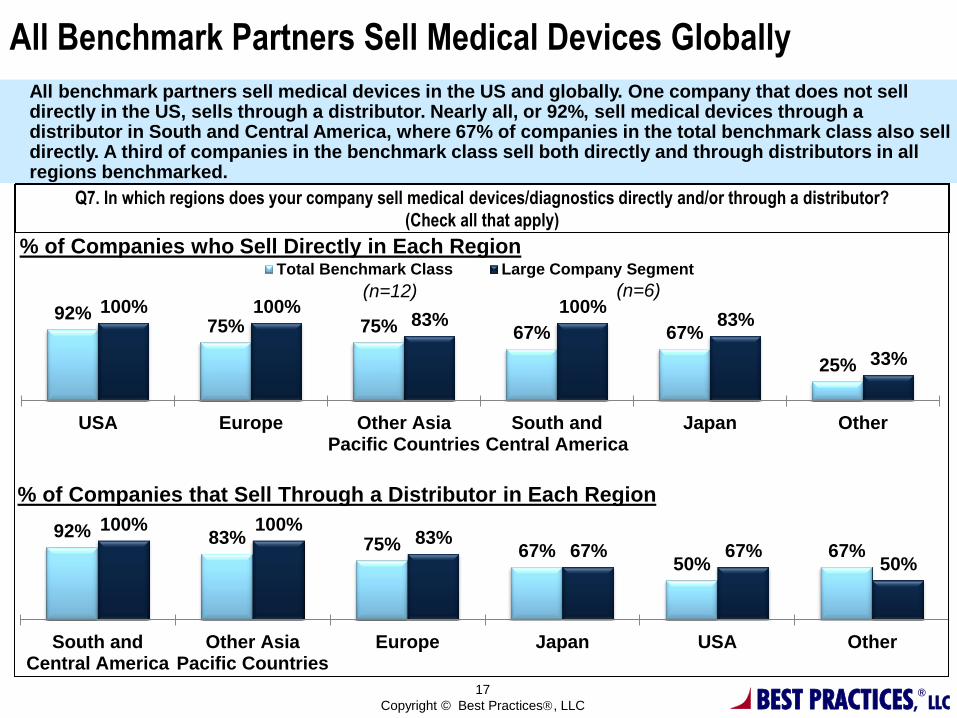
Q7. In which regions does your company sell medical devices/diagnostics directly and/or through a distributor?
(Check all that apply)
17
Copyright © Best Practices, LLC
% of Companies who Sell Directly in Each Region
(n=12) (n=6)
92% 75% 75% 67% 67%
25%
100% 100% 83%
100% 83%
33%
USA Europe Other AsiaPacific Countries
South andCentral America
Japan Other
Total Benchmark Class Large Company Segment
92% 83% 75% 67% 50%
67%
100% 100% 83%
67% 67% 50%
South andCentral America
Other AsiaPacific Countries
Europe Japan USA Other
% of Companies that Sell Through a Distributor in Each Region
All Benchmark Partners Sell Medical Devices Globally
All benchmark partners sell medical devices in the US and globally. One company that does not sell directly in the US, sells through a distributor. Nearly all, or 92%, sell medical devices through a distributor in South and Central America, where 67% of companies in the total benchmark class also sell directly. A third of companies in the benchmark class sell both directly and through distributors in all regions benchmarked.
BEST PRACTICES,
®
LLC
18
Copyright © Best Practices, LLC
Best Practices, LLC is a research and consulting firm that conducts work
based on the simple yet profound principle that organizations can chart a
course to superior economic performance by studying the best business
practices, operating tactics and winning strategies of world-class
companies.
Best Practices, LLC
6350 Quadrangle Drive, Suite 200, Chapel Hill, NC 27517
919-403-0251
www.best-in-class.com
About Best Practices, LLC