benchmarking orthology in eukaryotes 12-01-2004 nijmegen tim hulsen
Post on 19-Dec-2015
216 views
TRANSCRIPT
Benchmarking Orthology in Eukaryotes
12-01-2004 NijmegenTim Hulsen
Summary
• (1) An introduction to orthology• (2) Orthology determination methods• (3) Benchmarking:
– co-expression– conservation of co-expression– SwissProt name
• (4) Conclusions
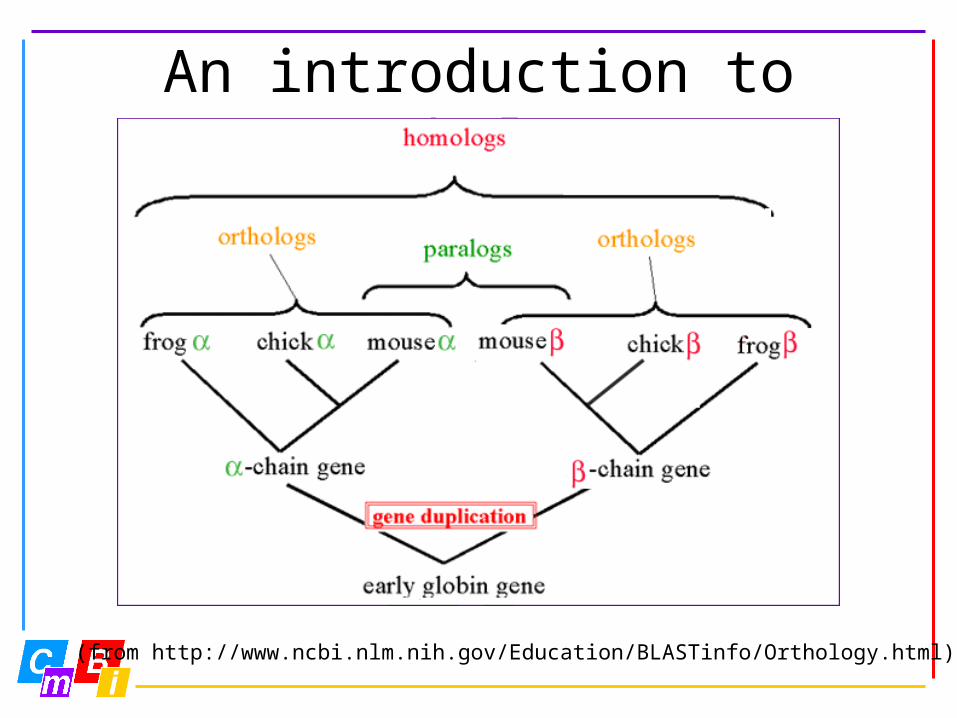
An introduction to orthology
(from http://www.ncbi.nlm.nih.gov/Education/BLASTinfo/Orthology.html)
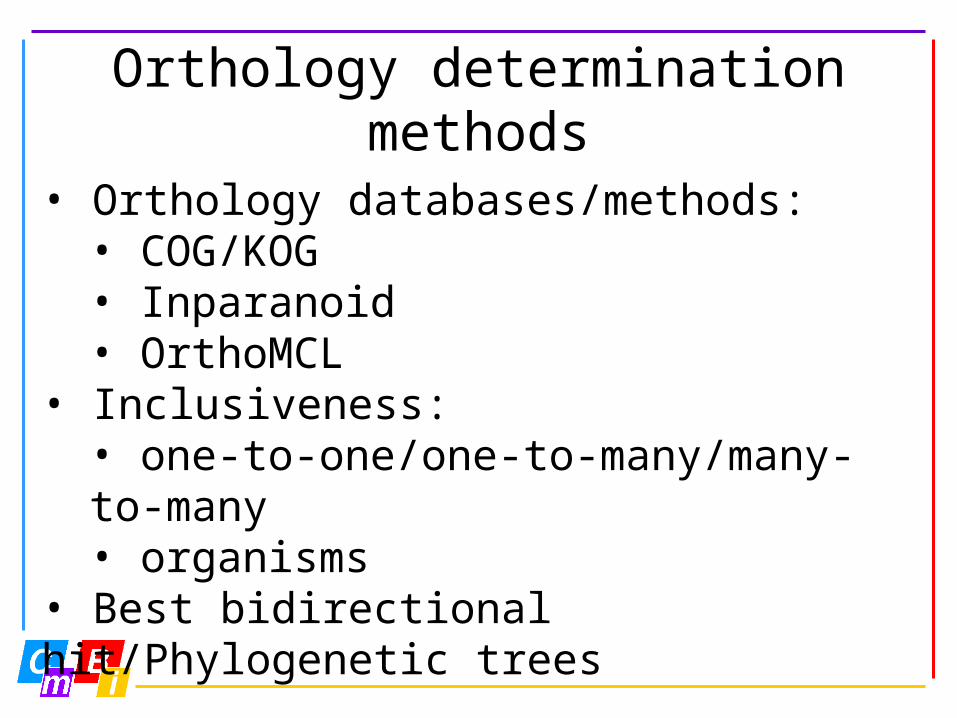
Orthology determination methods
• Orthology databases/methods:• COG/KOG• Inparanoid• OrthoMCL
• Inclusiveness:• one-to-one/one-to-many/many-to-many• organisms
• Best bidirectional hit/Phylogenetic trees
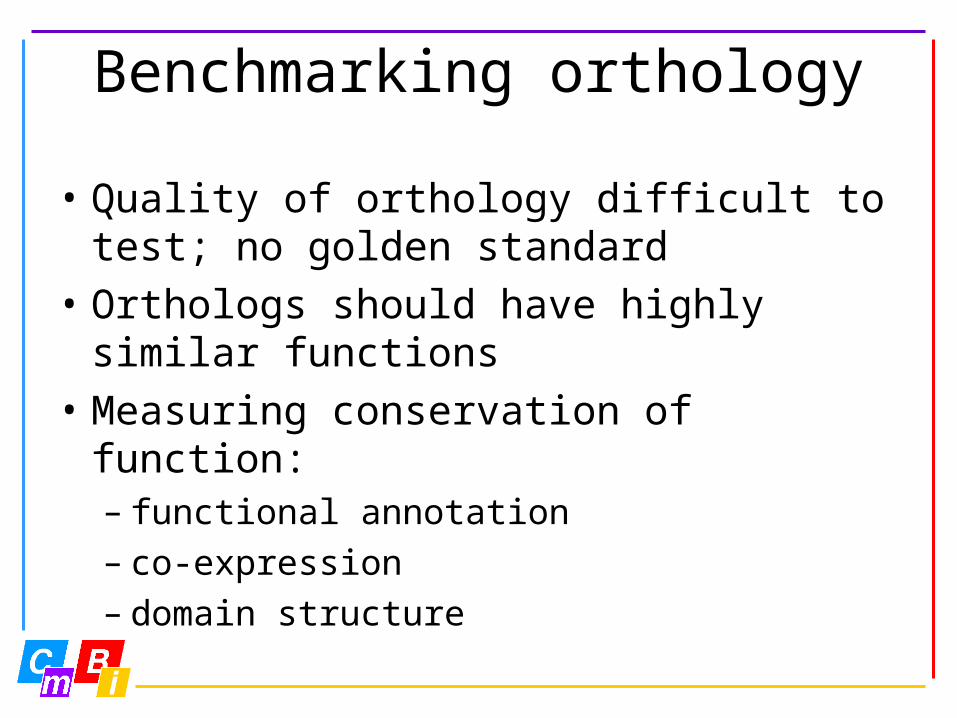
Benchmarking orthology
• Quality of orthology difficult to test; no golden standard
• Orthologs should have highly similar functions
• Measuring conservation of function:– functional annotation– co-expression– domain structure
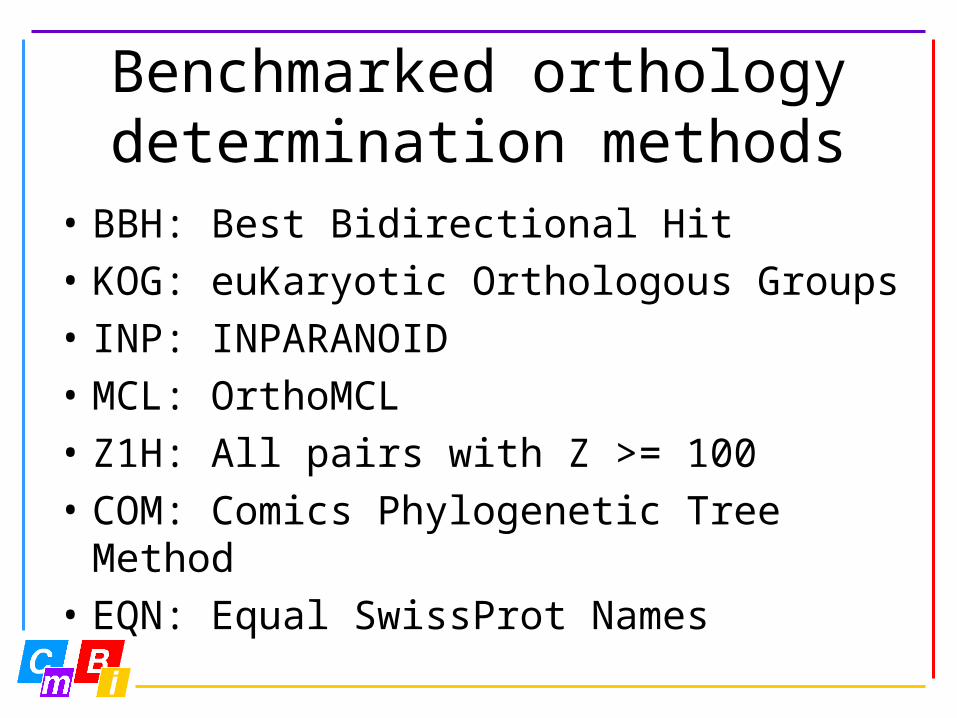
Benchmarked orthology determination methods
• BBH: Best Bidirectional Hit• KOG: euKaryotic Orthologous Groups• INP: INPARANOID• MCL: OrthoMCL• Z1H: All pairs with Z >= 100• COM: Comics Phylogenetic Tree
Method• EQN: Equal SwissProt Names
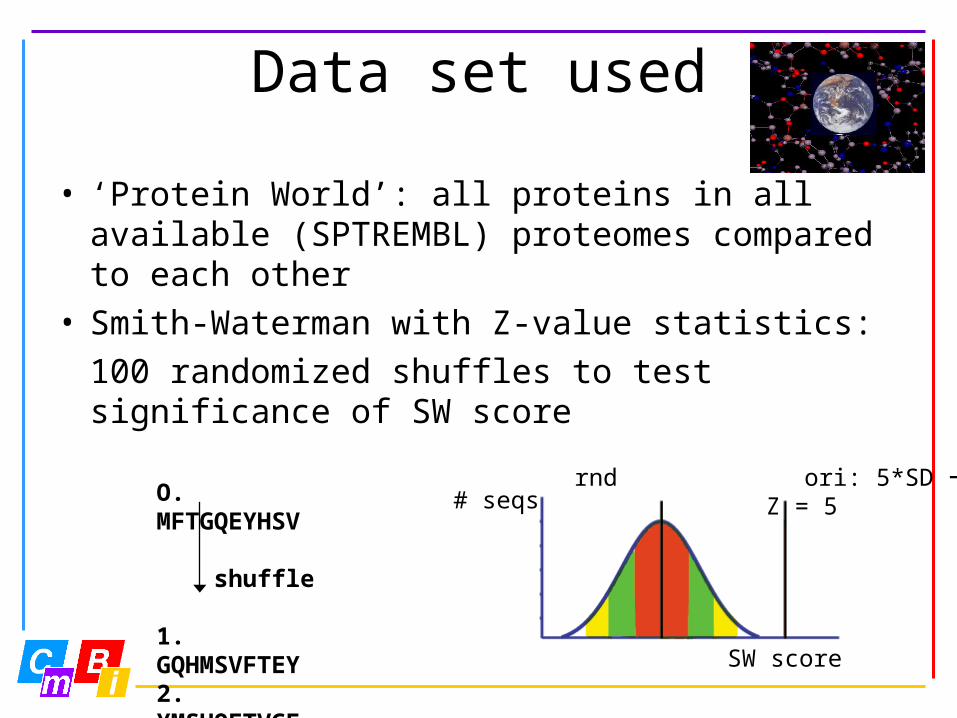
Data set used
• ‘Protein World’: all proteins in all available (SPTREMBL) proteomes compared to each other
• Smith-Waterman with Z-value statistics:100 randomized shuffles to test significance of SW score
O. MFTGQEYHSV
shuffle
1. GQHMSVFTEY2. YMSHQFTVGEetc.
# seqs
SW score
rnd ori: 5*SD Z = 5
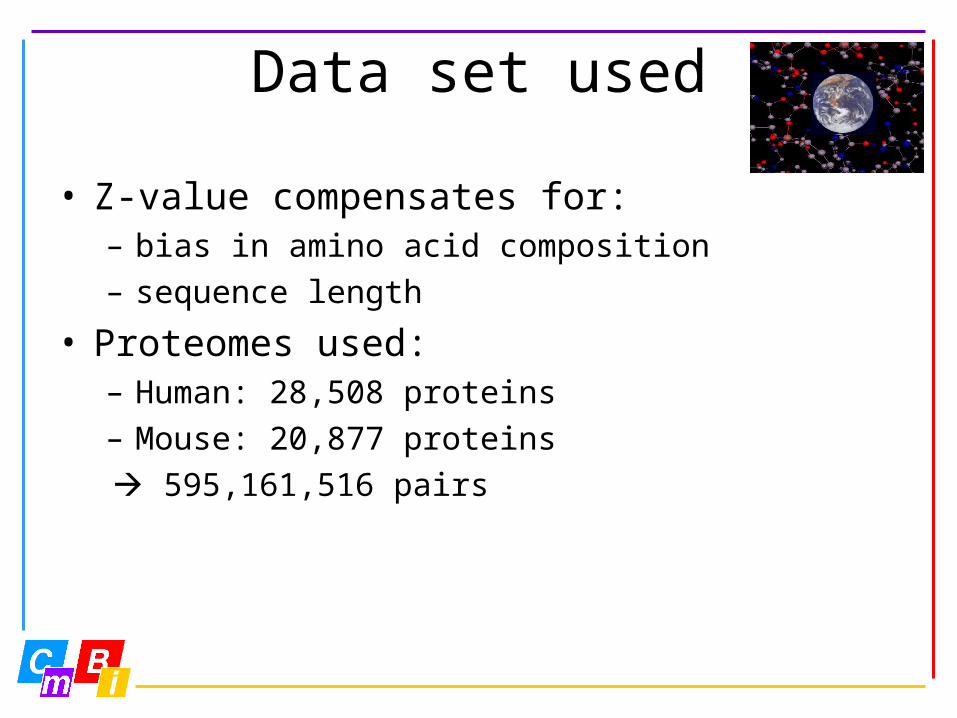
Data set used
• Z-value compensates for:– bias in amino acid composition– sequence length
• Proteomes used:– Human: 28,508 proteins– Mouse: 20,877 proteins
595,161,516 pairs

BBH method
• Easiest method: ‘best bidirectional hit’• Human protein (1) SW best hit in
mouse (2)• Mouse protein (2) SW best hit in
human (3)• If 3 equals 1, the human and mouse
protein are considered to be orthologs• 12,817 human-mouse orthologous
pairs (12,817 human, 12,817 mouse proteins)
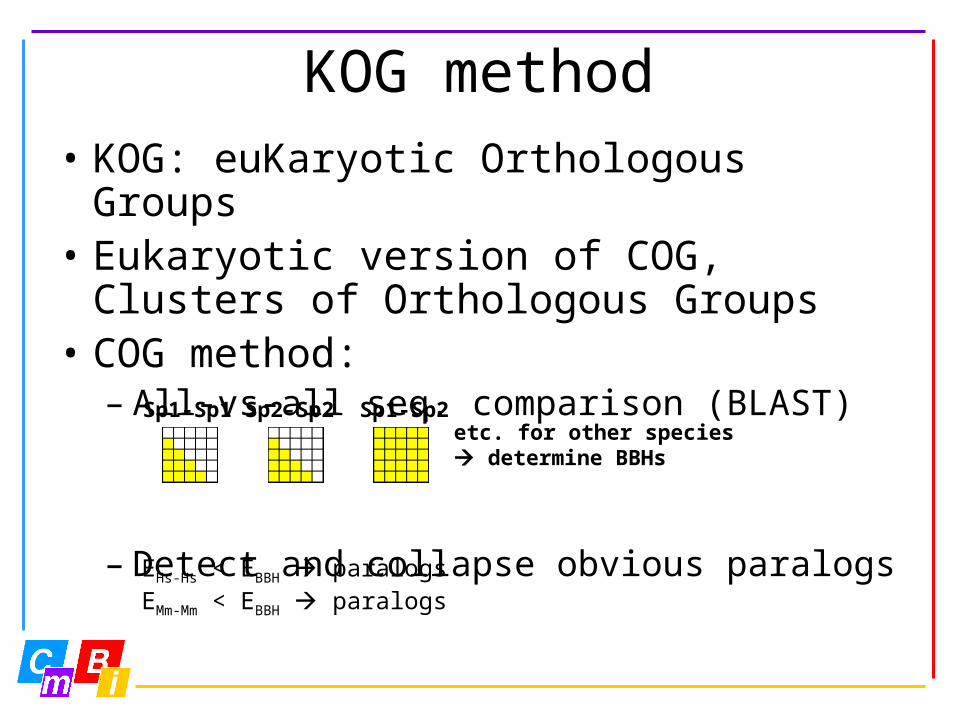
KOG method• KOG: euKaryotic Orthologous Groups• Eukaryotic version of COG, Clusters
of Orthologous Groups• COG method:
– All-vs-all seq. comparison (BLAST)
– Detect and collapse obvious paralogs
Sp1-Sp1 Sp2-Sp2 Sp1-Sp2
EHs-Hs < EBBH paralogsEMm-Mm < EBBH paralogs
etc. for other species determine BBHs
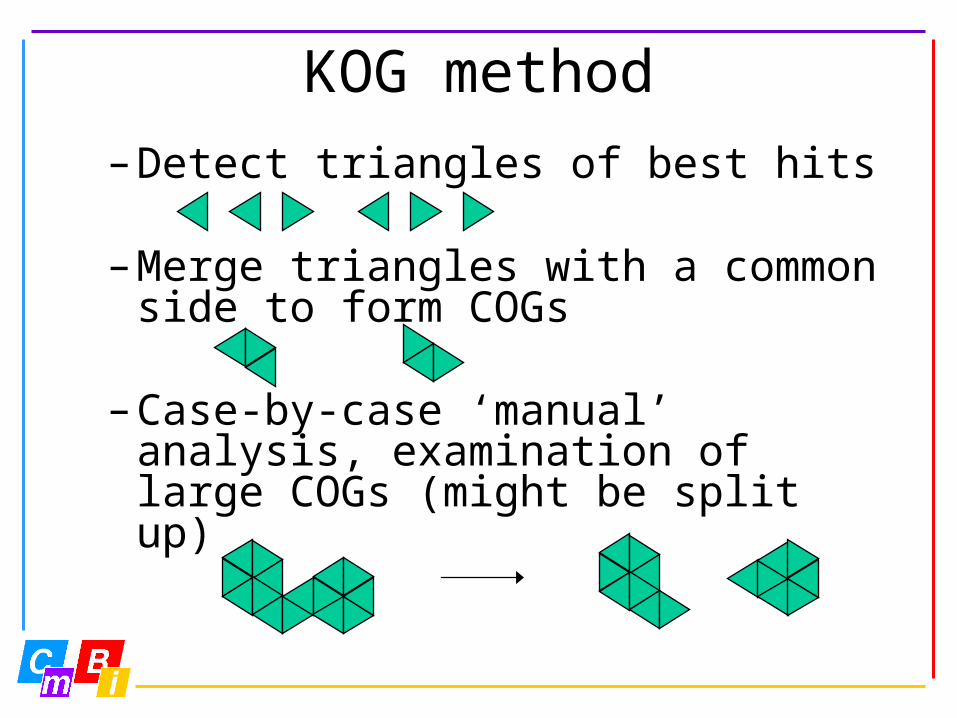
KOG method– Detect triangles of best hits
– Merge triangles with a common side to form COGs
– Case-by-case ‘manual’ analysis, examination of large COGs (might be split up)
KOG method
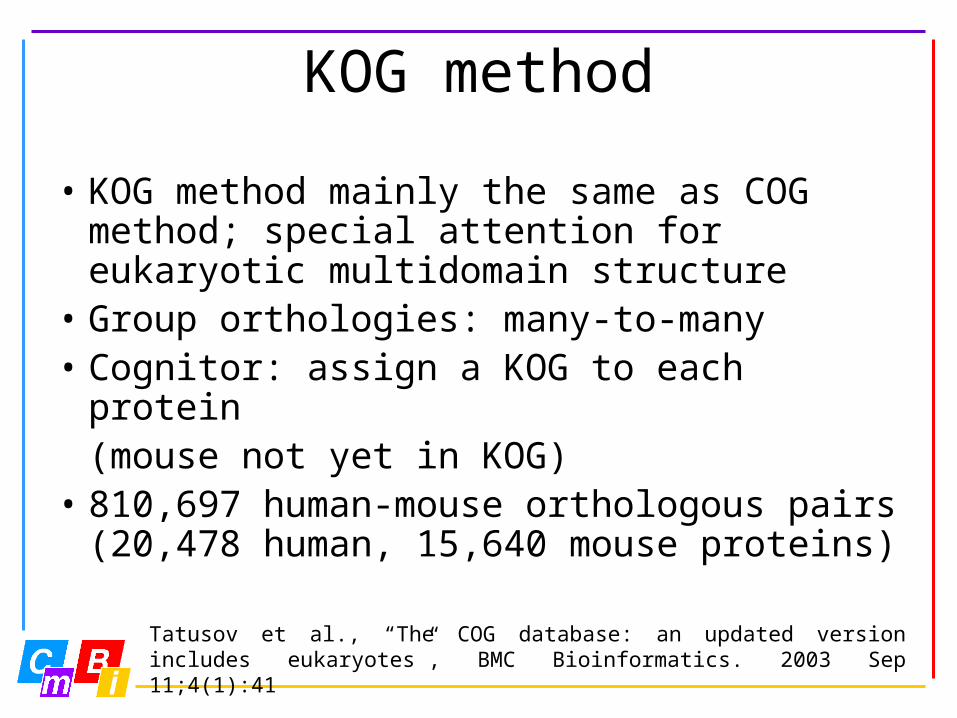
• KOG method mainly the same as COG method; special attention for eukaryotic multidomain structure
• Group orthologies: many-to-many• Cognitor: assign a KOG to each protein
(mouse not yet in KOG)• 810,697 human-mouse orthologous
pairs (20,478 human, 15,640 mouse proteins)
Tatusov et al., “The COG database: an updated version includes eukaryotes”, BMC Bioinformatics. 2003 Sep 11;4(1):41
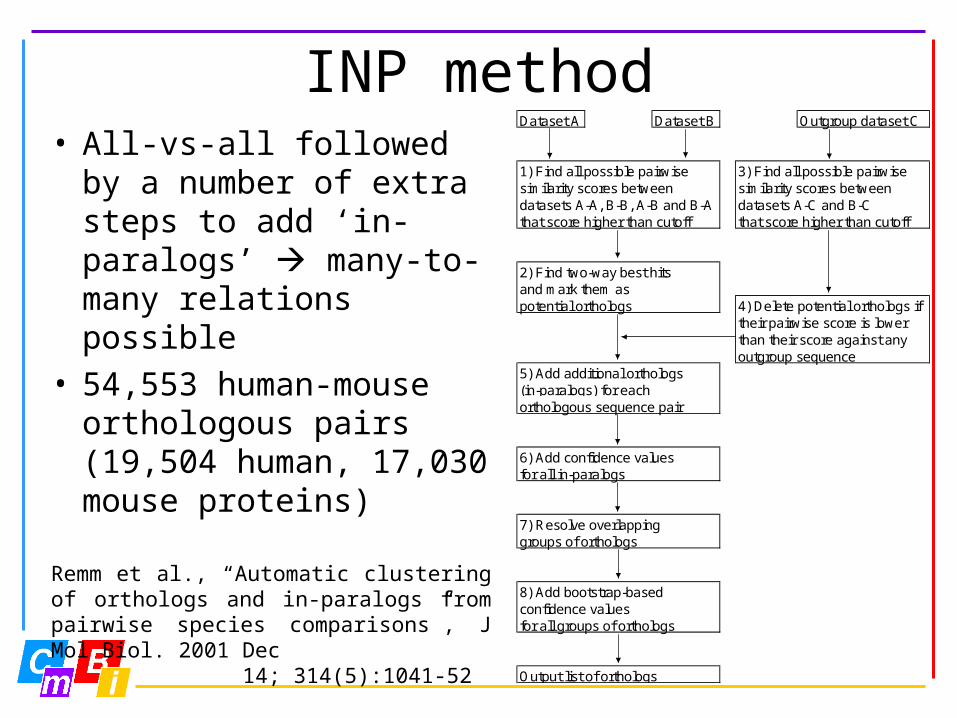
INP method• All-vs-all followed by a
number of extra steps to add ‘in-paralogs’ many-to-many relations possible
• 54,553 human-mouse orthologous pairs (19,504 human, 17,030 mouse proteins)
Remm et al., “Automatic clustering of orthologs and in-paralogs from pairwise species comparisons”, J Mol Biol. 2001 Dec 14; 314(5):1041-52
Dataset A Dataset B Outgroup dataset C
1) Find all possible pairwise 3) Find all possible pairwisesimilarity scores between similarity scores betweendatasets A-A, B-B, A-B and B-A datasets A-C and B-Cthat score higher than cutoff that score higher than cutoff
2) Find two-way best hitsand mark them aspotential orthologs 4) Delete potential orthologs if
their pairwise score is lowerthan their score against anyoutgroup sequence
5) Add additional orthologs(in-paralogs) for eachorthologous sequence pair
6) Add confidence valuesfor all in-paralogs
7) Resolve overlappinggroups of orthologs
8) Add bootstrap-basedconfidence valuesfor all groups of orthologs
Output list of orthologs
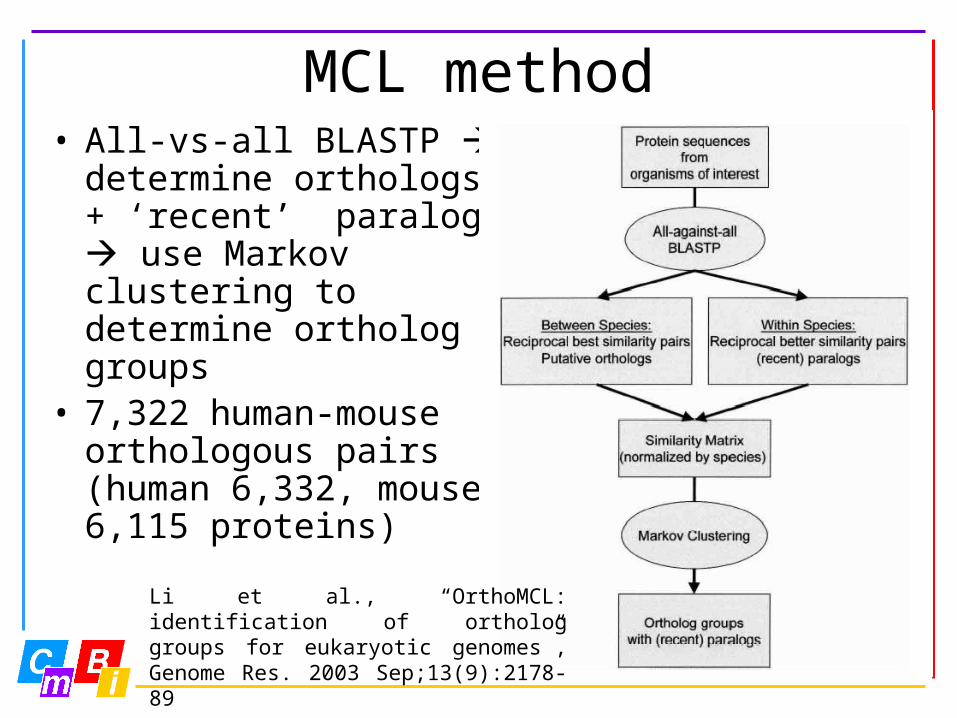
MCL method• All-vs-all BLASTP
determine orthologs + ‘recent’ paralogs use Markov clustering to determine ortholog groups
• 7,322 human-mouse orthologous pairs (human 6,332, mouse 6,115 proteins)
Li et al., “OrthoMCL: identification of ortholog groups for eukaryotic genomes”, Genome Res. 2003 Sep;13(9):2178-89
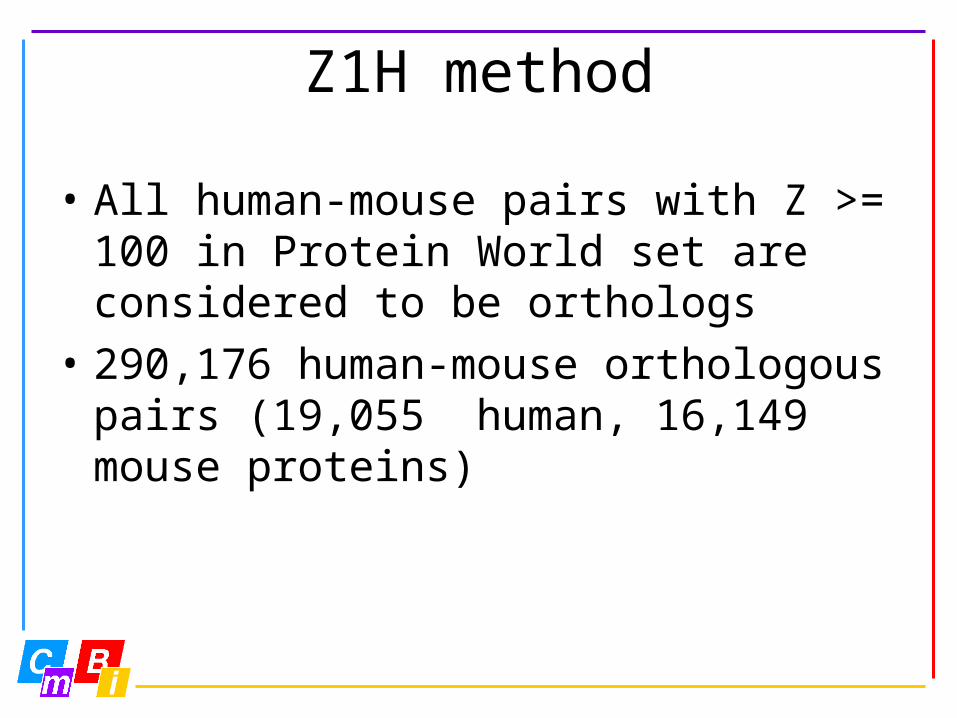
Z1H method
• All human-mouse pairs with Z >= 100 in Protein World set are considered to be orthologs
• 290,176 human-mouse orthologous pairs (19,055 human, 16,149 mouse proteins)
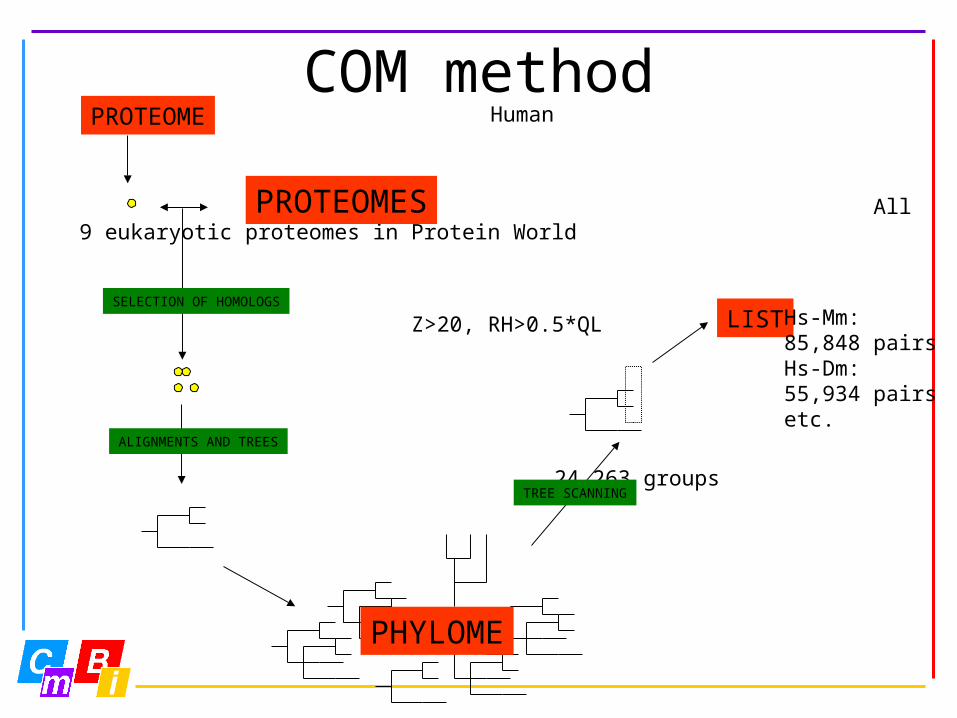
COM method Human
All 9 eukaryotic proteomes in Protein World
Z>20, RH>0.5*QL
24,263 groups
PHYLOME
SELECTION OF HOMOLOGS
ALIGNMENTS AND TREES
PROTEOME
PROTEOMES
TREE SCANNING
LIST Hs-Mm:85,848 pairsHs-Dm:55,934 pairsetc.
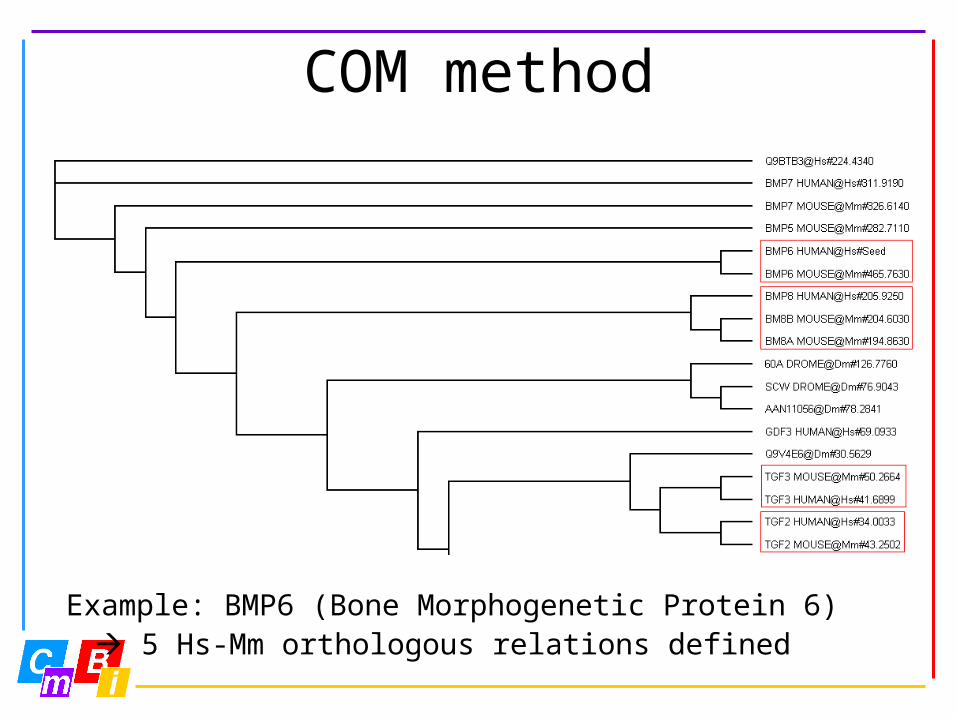
COM method
Example: BMP6 (Bone Morphogenetic Protein 6) 5 Hs-Mm orthologous relations defined
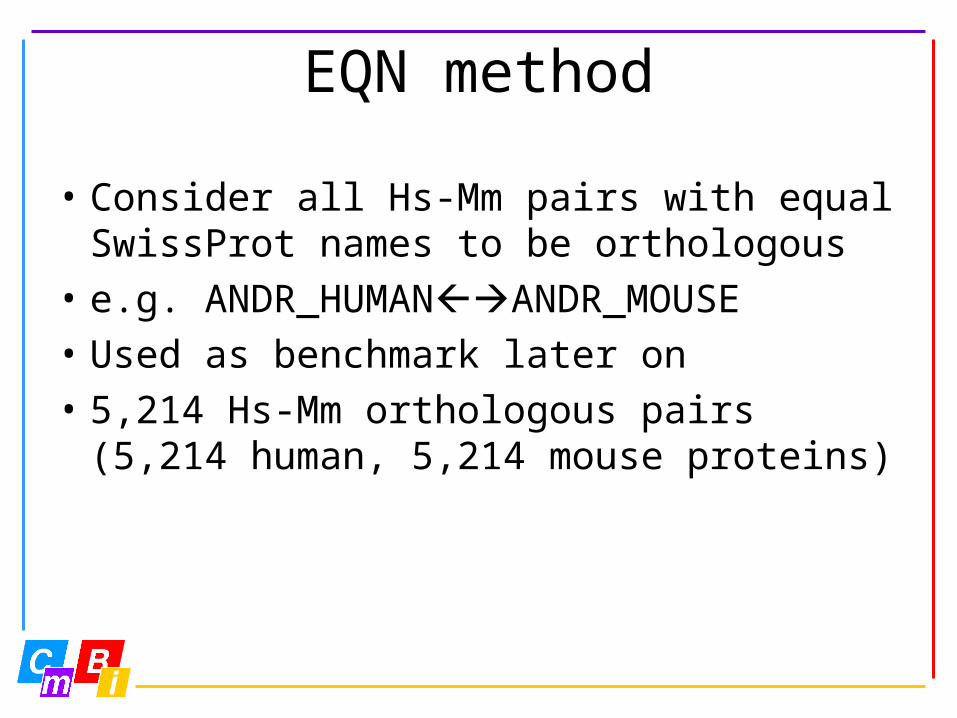
EQN method
• Consider all Hs-Mm pairs with equal SwissProt names to be orthologous
• e.g. ANDR_HUMANANDR_MOUSE• Used as benchmark later on• 5,214 Hs-Mm orthologous pairs
(5,214 human, 5,214 mouse proteins)
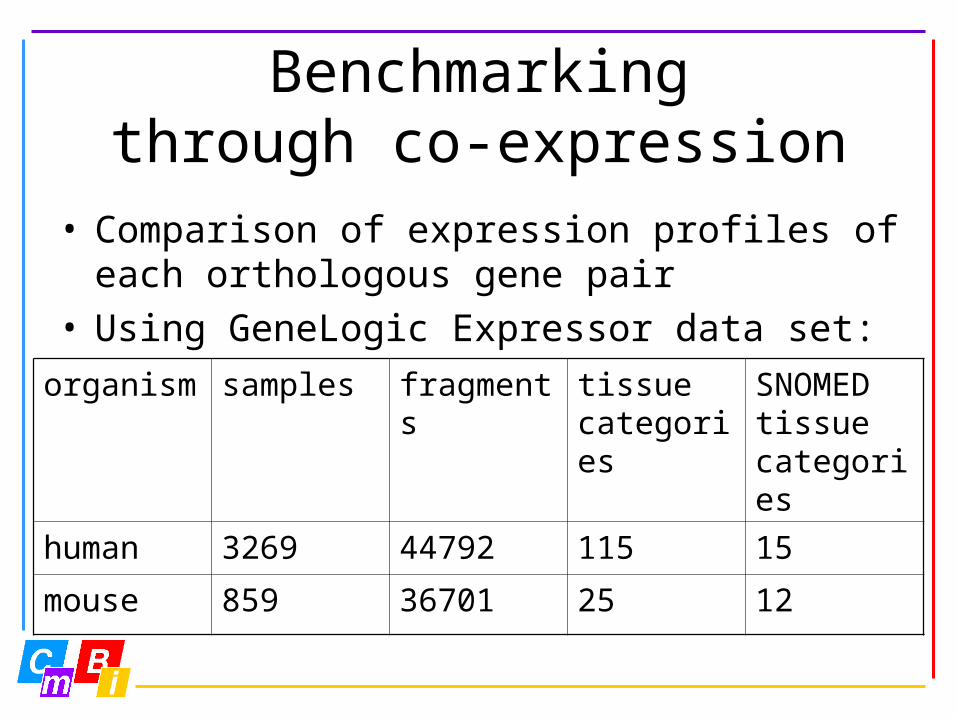
Benchmarkingthrough co-expression
• Comparison of expression profiles of each orthologous gene pair
• Using GeneLogic Expressor data set:
organism samples fragments
tissue categories
SNOMED tissue categories
human 3269 44792 115 15
mouse 859 36701 25 12
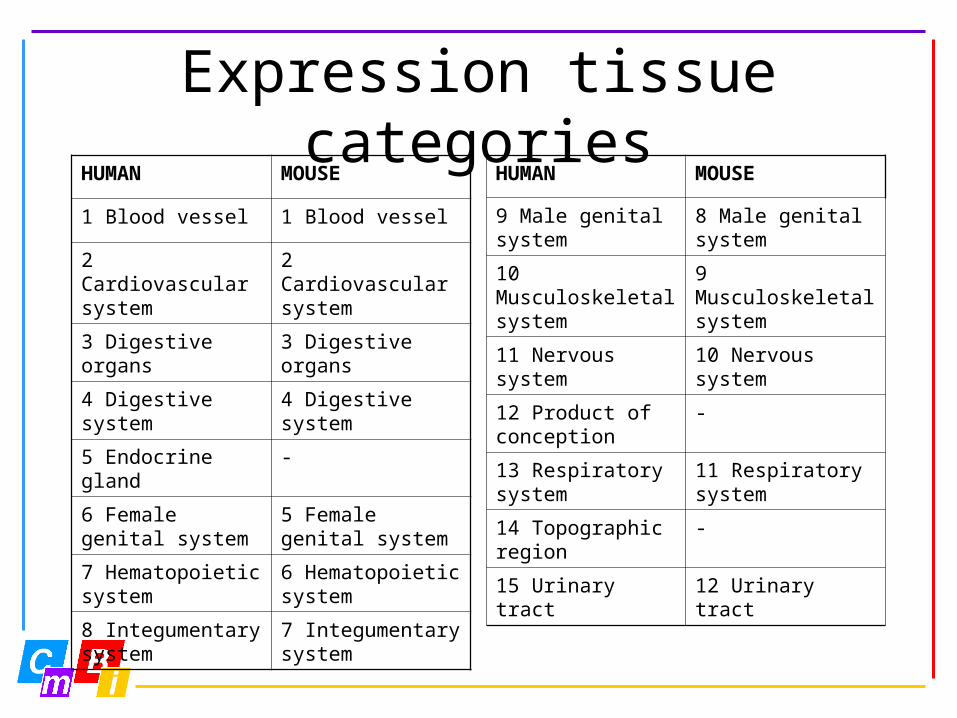
Expression tissue categories
HUMAN MOUSE
1 Blood vessel 1 Blood vessel
2 Cardiovascular system
2 Cardiovascular system
3 Digestive organs
3 Digestive organs
4 Digestive system
4 Digestive system
5 Endocrine gland -
6 Female genital system
5 Female genital system
7 Hematopoietic system
6 Hematopoietic system
8 Integumentary system
7 Integumentary system
HUMAN MOUSE
9 Male genital system
8 Male genital system
10 Musculoskeletal system
9 Musculoskeletal system
11 Nervous system
10 Nervous system
12 Product of conception
-
13 Respiratory system
11 Respiratory system
14 Topographic region
-
15 Urinary tract 12 Urinary tract
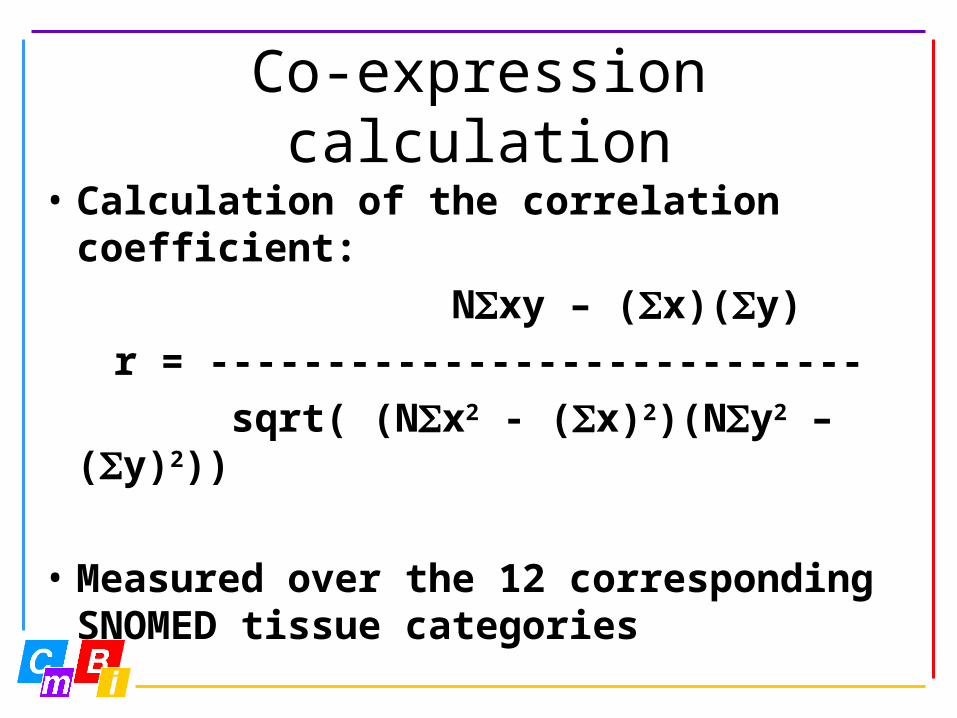
Co-expression calculation
• Calculation of the correlation coefficient: Nxy – (x)(y)
r = ---------------------------- sqrt( (Nx2 - (x)2)(Ny2 – (y)2))
• Measured over the 12 corresponding SNOMED tissue categories
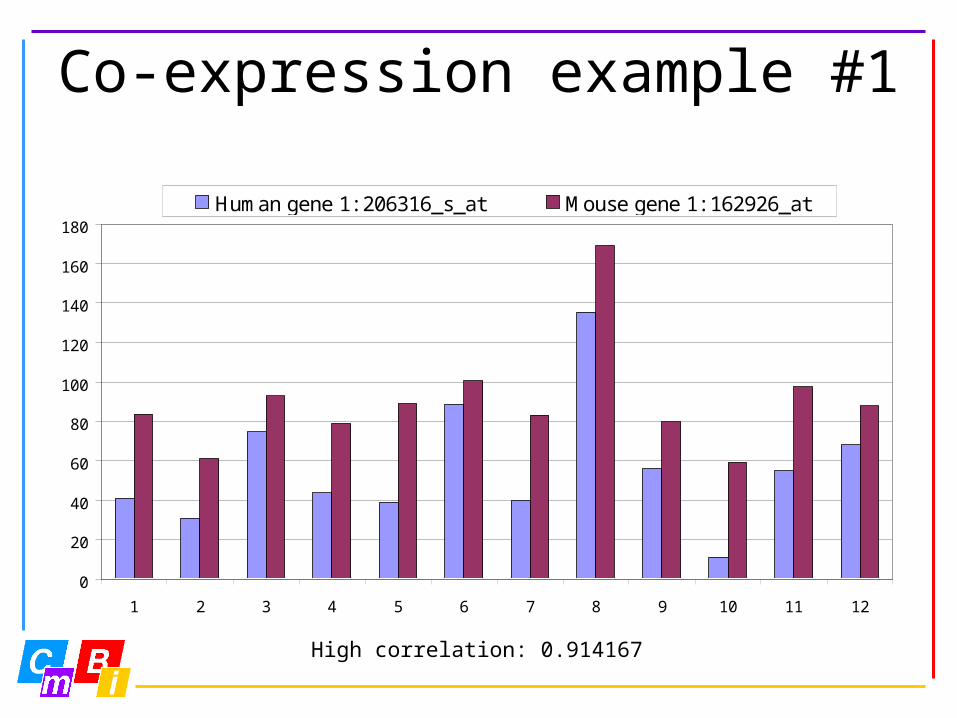
Co-expression example #1
High correlation: 0.914167
0
20
40
60
80
100
120
140
160
180
1 2 3 4 5 6 7 8 9 10 11 12
Human gene 1: 206316_s_at Mouse gene 1: 162926_at
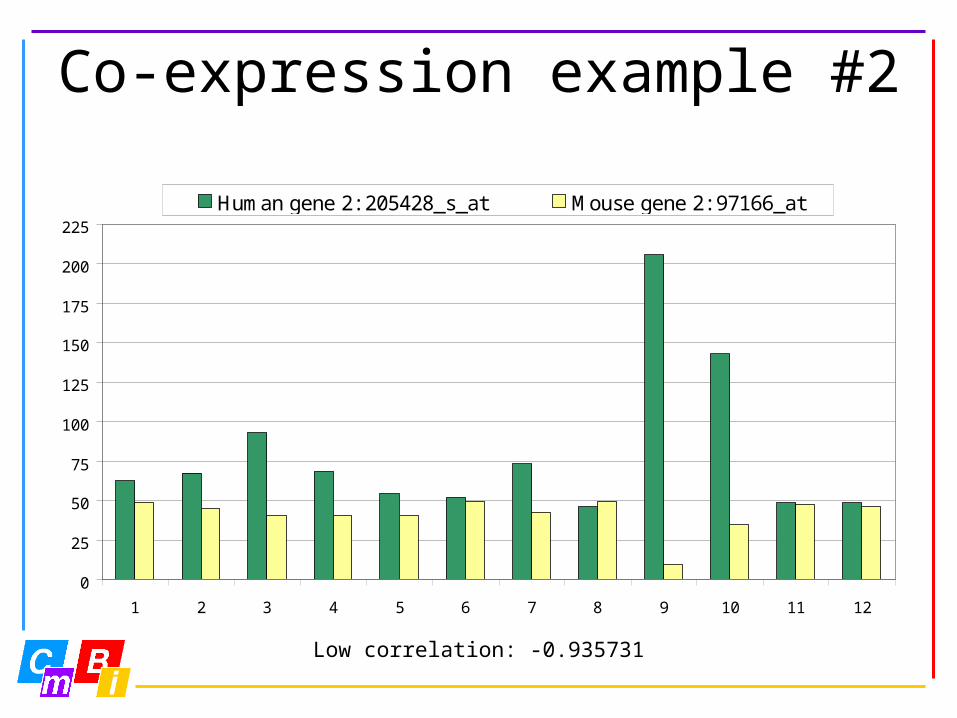
Co-expression example #2
Low correlation: -0.935731
0
25
50
75
100
125
150
175
200
225
1 2 3 4 5 6 7 8 9 10 11 12
Human gene 2: 205428_s_at Mouse gene 2: 97166_at
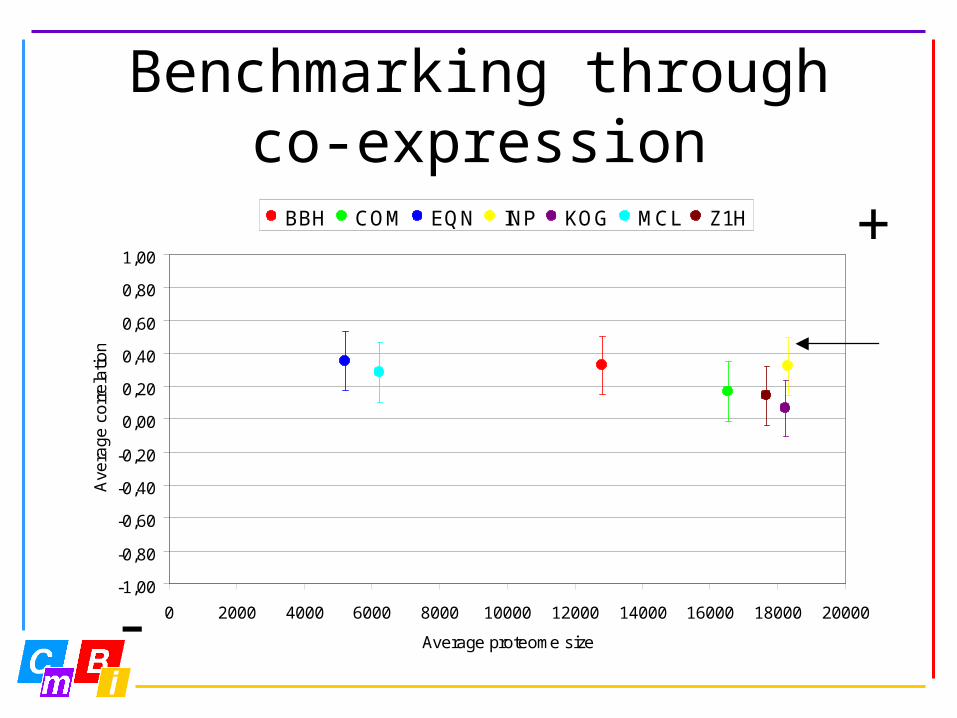
Benchmarking throughco-expression
-1,00
-0,80
-0,60
-0,40
-0,20
0,00
0,20
0,40
0,60
0,80
1,00
0 2000 4000 6000 8000 10000 12000 14000 16000 18000 20000
Average proteome size
Ave
rag
e c
orr
ela
tion
BBH COM EQN INP KOG MCL Z1H
-
+
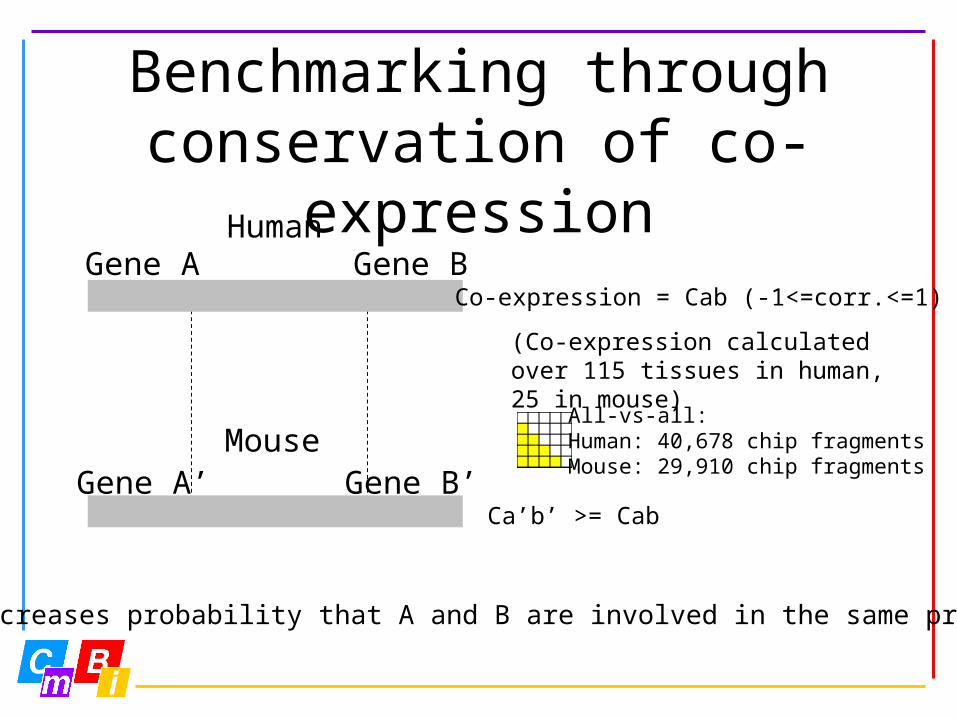
Benchmarking through conservation of co-
expressionHumanGene A Gene B
MouseGene A’ Gene B’
Co-expression = Cab (-1<=corr.<=1)
Ca’b’ >= Cab
Increases probability that A and B are involved in the same process
(Co-expression calculated over 115 tissues in human, 25 in mouse)
All-vs-all:Human: 40,678 chip fragmentsMouse: 29,910 chip fragments
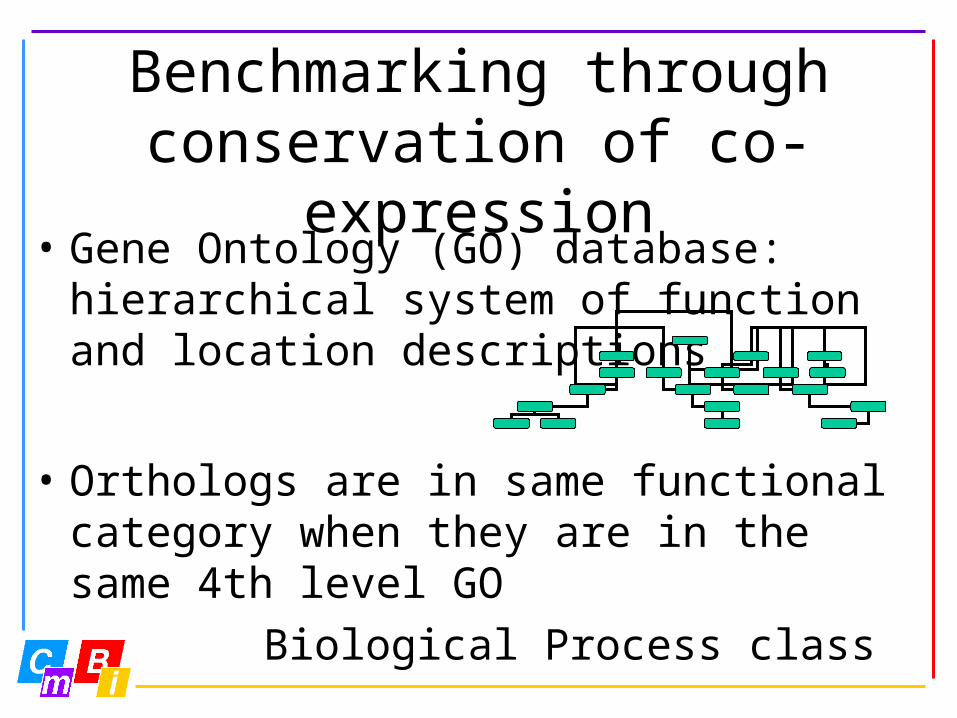
Benchmarking through conservation of co-
expression• Gene Ontology (GO) database:
hierarchical system of function and location descriptions
• Orthologs are in same functional category when they are in the same 4th level GO
Biological Process class
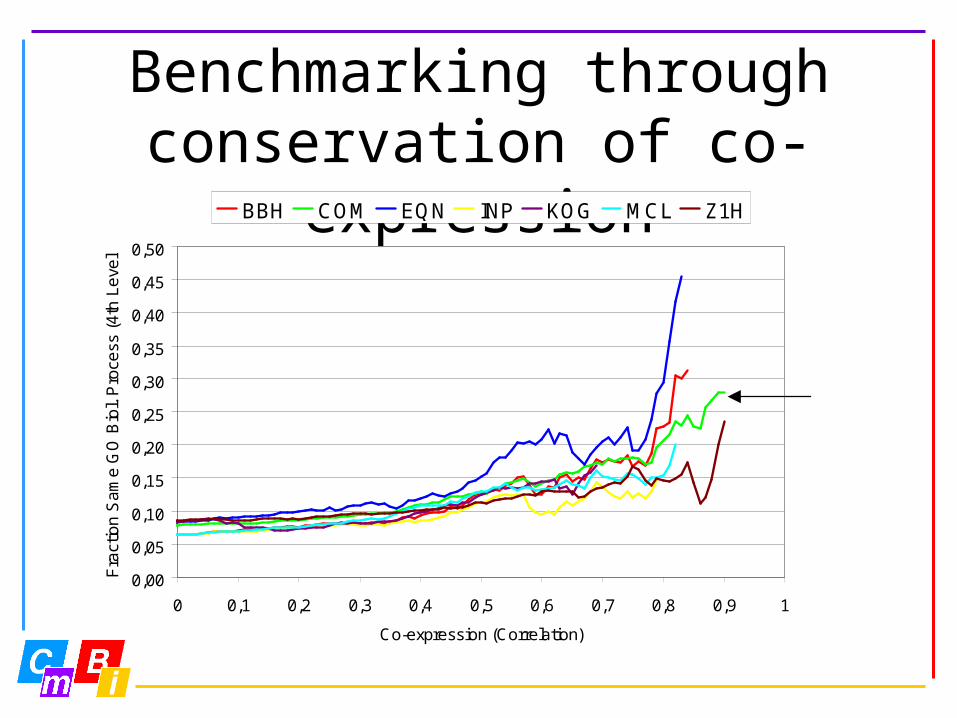
Benchmarking through conservation of co-
expression
0,00
0,05
0,10
0,15
0,20
0,25
0,30
0,35
0,40
0,45
0,50
0 0,1 0,2 0,3 0,4 0,5 0,6 0,7 0,8 0,9 1
Co-expression (Correlation)
Fra
ctio
n S
am
e G
O B
iol.
Pro
cess
(4
th L
eve
l)
BBH COM EQN INP KOG MCL Z1H
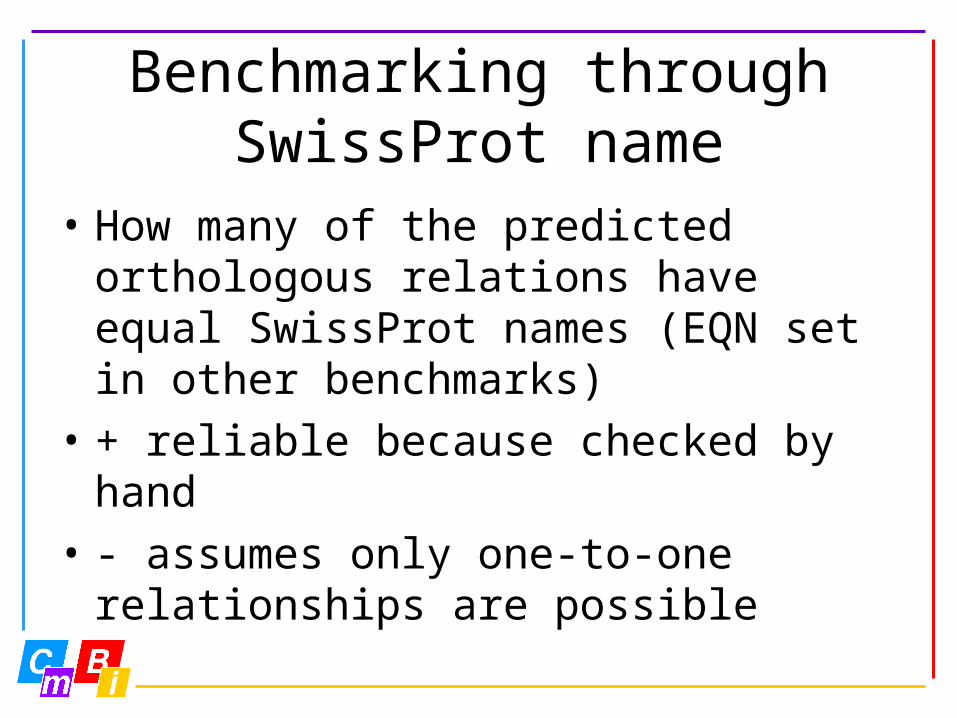
Benchmarking through SwissProt name
• How many of the predicted orthologous relations have equal SwissProt names (EQN set in other benchmarks)
• + reliable because checked by hand• - assumes only one-to-one
relationships are possible
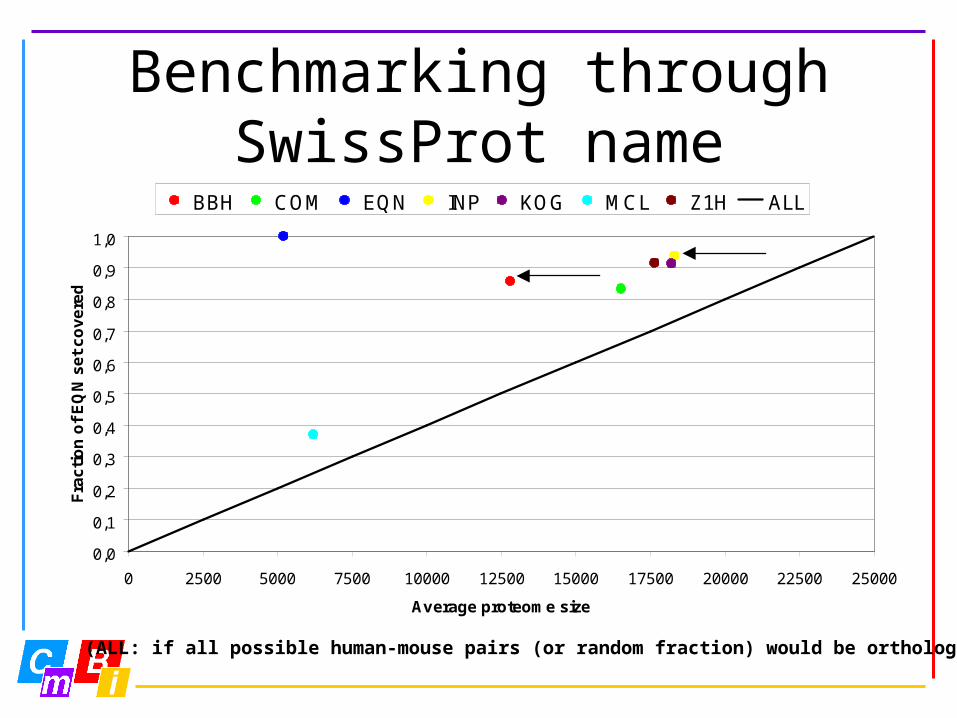
Benchmarking through SwissProt name
(ALL: if all possible human-mouse pairs (or random fraction) would be orthologs)
0,0
0,1
0,2
0,3
0,4
0,5
0,6
0,7
0,8
0,9
1,0
0 2500 5000 7500 10000 12500 15000 17500 20000 22500 25000
Average proteome size
Fra
cti
on
of
EQ
N s
et
co
ve
red
BBH COM EQN INP KOG MCL Z1H ALL

Conclusions• Hard to point out the ‘best’ orthology
determination method• In most cases: less=better,
more=worse• Method that should be used depends
on research question: do you need few reliable orthologies or many less reliable orthologies?
• Future directions: look at conservation of domain structure as a benchmark
Credits
• Martijn Huynen• Peter Groenen• Comics Group• Gert Vriend• Rest of CMBI• Organon Bioinf. Group