benchmarking of water loss, - africacheck.org · benchmarking of water loss, water use efficiency...
TRANSCRIPT


BENCHMARKING OF WATER LOSS,
WATER USE EFFICIENCY AND NON-
REVENUE WATER IN SOUTH AFRICAN
MUNICIPALITIES (2004/05 to 2015/16)
July 2017
Prepared by: Business Intelligence Support Team
ii
Document control
PEP: WP11084 (WP11047-PEP4): National WS Master Plan: Water Conceptual Design and Strategic Analysis Related to Feasibility/IRS/Non-Revenue and Other Related Study Categories
Title of document: Benchmarking of Water Loss, Water Use Efficiency and Non-Revenue Water in South African Municipalities (2004/05 to 2015/16)
PEP leader: WA Wegelin
PEP team members: RS McKenzie, T Godzwana, S Barnard
Author(s) of document: WA Wegelin
Contributors: T Godzwana, S Barnard
Reviewer: A Wensley
Report status: Final
Date: July 2017
Issued to: A Wensley
Keywords: Business Intelligence Support, NRW, Water losses, Efficiency, all municipalities
Version control
Version Date Comments
Final Draft June 2017
Final July 2017
Approval
WRP (Pty) Ltd
Approved for WRP (Pty) Ltd by:
________________________________
________________________________
WA Wegelin, PrEng Date
Project Manager
DEPARTMENT OF WATER AND SANITATION
Directorate: Water Services Macro Planning
Approved for Department of Water and Sanitation by:
______________________________
________________________________
A Wensley, PrEng Date
Project Manager

ii
Business Intelligence Support
EXECUTIVE SUMMARY
INTRODUCTION
The “National Development Plan – Vision 2030” (NDP) and the Second Edition of the National Water
Resource Strategy (NWRS2) state that reducing growth in water demand is just as important as
increasing its supply. South Africa is a water-stressed country and is facing a number of water
challenges and concerns, which include security of supply, environmental degradation and resource
pollution, and the inefficient use of water. In light of the urgency to protect our water resources and
the adverse effects of climate change, the NWRS2 submits that water conservation and water
demand management (WCWDM) should be one of the top priorities, and measures to reconcile
demand and supply in order to provide for the national goals of a better life for all through job creation
and inclusive economic growth.
Progress made with the implementation of WCWDM can only be measured against an accurate
baseline. The last comprehensive baseline assessment, of non-revenue water (NRW) and water
losses in South Africa, was published in 2015 with the No Drop publication of First Order Assessment
of Water Loss, Water Use Efficiency and Non-Revenue Water in Municipalities (DWS and SWPN,
Oct 2015). The key objectives of this study were as follows:
report on system input volume, non-revenue water, water loss and efficiency trends, based on
2004/05 to 2015/16 municipal financial year data
calculate a 2015/16 water balance for each municipality where no better information exists
disseminate non-revenue water / water loss benchmarking information in municipalities,
government organisations and consumers throughout South Africa to create awareness.
RESULTS
The estimated 2015/16 water balance, for all municipalities, indicate water losses of
1414.49 million m3/a (35.9%) and NRW of 1632.93 million m3/a (41.0%). These figures are higher
than the 2012/13 No Drop assessment of 27.6% water losses and 34.6% NRW. The 2013/14
No Drop assessment was based on 71 data sets, with an SIV of 2 997.6 million m3/a. The increased
water losses and NRW are attributed to the improved estimate of water losses and NRW in category
B3 and B4 (rural) municipalities.

iii
The estimated national water balance for 2015 /16, broken down per province is summarised in the
table below. The highest and lowest figure for each key performance indicator are highlighted in red
and green respectively.
Province Population SIV (m3/annum) NRW (m3/annum) % NRW % WL l/c/d ILI
EC 4 477 918 332 151 376 158 647 165 47.8% 45.0% 200 4.8
FS 2 723 028 207 835 805 106 908 574 51.4% 46.6% 209 4.8
GT 12 978 281 1 473 100 700 528 839 540 35.9% 27.4% 305 5.8
LIM 4 225 967 281 235 907 155 016 679 55.1% 55.1% 182 1.3
KZN 8 491 508 697 751 184 327 444 107 46.9% 43.0% 225 6.2
NW 3 039 995 206 496 825 105 577 898 51.1% 51.1% 186 4.7
NC 1 085 944 94 205 305 45 418 308 48.2% 45.5% 238 7.1
WC 6 108 993 482 695 411 102 720 237 21.3% 16.7% 201 2.4
MP 3 622 506 270 990 713 129 852 490 47.9% 43.9% 205 4.3
National 46 754 140 4 046 463 225 1 659 588 711 41.0% 35.9% 233 5.3
Gauteng is the largest water user in the country, and with KwaZulu-Natal and Western Cape, account
for 66% of the total demand. Gauteng and KwaZulu-Natal account for 52% of the NRW by volume.
Limpopo has the highest percentage NRW and water losses but these figures are contradicted by a
low litres / capita / day (l/c/d) and infrastructure leakage Index (ILI). This needs further investigation.
Western Cape is the overall best performing province. Gauteng has the highest per capita
consumption due to the high number of wet industries in the supply area.
To obtain an understanding of the water loss trends in the country, the water balance information for
107 municipalities, which submit information on a regular basis, was analysed. The system input
volume for the 107 municipalities has been consistently increasing since 2006 and the NRW has
been increasing since 2013. Water losses seemed to improve until 2014 but have subsequently
deteriorated again to 2012 levels. The municipalities have been tracking the projected water demand
without WCWDM and they are unlikely to achieve their 2017 targets.
System Input Volume = 4046.463
Water losses = 1452.329Real Losses = 1150.079 Real Losses = 1150.079
Non-revenue water = 1659.589
Authorised consumption = 2594.135
Apparent losses = 302.249 Apparent losses = 302.249
Revenue water = 2386.875
Unbilled authorised = 207.260 Unbilled unmetered = 153.987
Billed authorised = 2386.875
Billed unmetered = 412.301
Billed metered = 1974.574
59.0%
41.0% 35.9%
iv
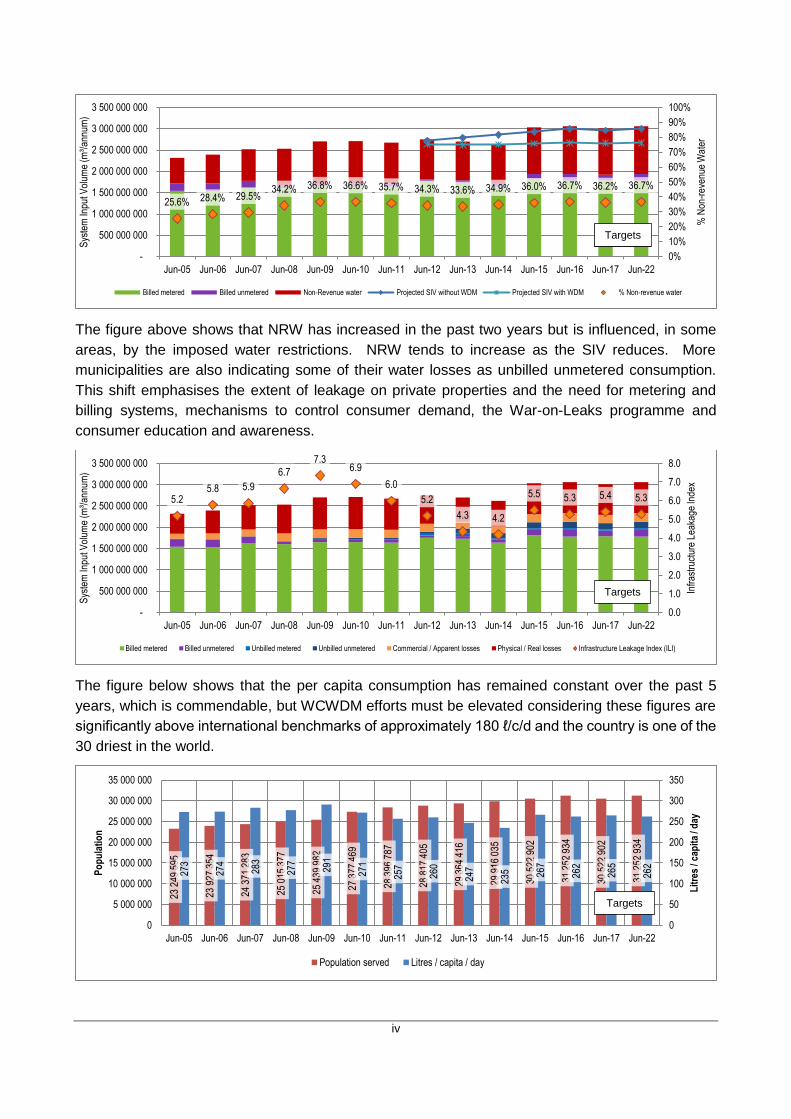
The figure above shows that NRW has increased in the past two years but is influenced, in some
areas, by the imposed water restrictions. NRW tends to increase as the SIV reduces. More
municipalities are also indicating some of their water losses as unbilled unmetered consumption.
This shift emphasises the extent of leakage on private properties and the need for metering and
billing systems, mechanisms to control consumer demand, the War-on-Leaks programme and
consumer education and awareness.
The figure below shows that the per capita consumption has remained constant over the past 5
years, which is commendable, but WCWDM efforts must be elevated considering these figures are
significantly above international benchmarks of approximately 180 ℓ/c/d and the country is one of the
30 driest in the world.
25.6% 28.4% 29.5%34.2% 36.8% 36.6% 35.7% 34.3% 33.6% 34.9% 36.0% 36.7% 36.2% 36.7%
0%
10%
20%
30%
40%
50%
60%
70%
80%
90%
100%
-
500 000 000
1 000 000 000
1 500 000 000
2 000 000 000
2 500 000 000
3 000 000 000
3 500 000 000
Jun-05 Jun-06 Jun-07 Jun-08 Jun-09 Jun-10 Jun-11 Jun-12 Jun-13 Jun-14 Jun-15 Jun-16 Jun-17 Jun-22
% N
on-r
even
ue W
ater
Sys
tem
Inpu
t Vol
ume
(m³/
annu
m)
Billed metered Billed unmetered Non-Revenue water Projected SIV without WDM Projected SIV with WDM % Non-revenue water
5.25.8 5.9
6.7
7.36.9
6.0
5.2
4.3 4.2
5.5 5.3 5.4 5.3
0.0
1.0
2.0
3.0
4.0
5.0
6.0
7.0
8.0
-
500 000 000
1 000 000 000
1 500 000 000
2 000 000 000
2 500 000 000
3 000 000 000
3 500 000 000
Jun-05 Jun-06 Jun-07 Jun-08 Jun-09 Jun-10 Jun-11 Jun-12 Jun-13 Jun-14 Jun-15 Jun-16 Jun-17 Jun-22
Infr
astr
uctu
re L
eaka
ge In
dex
Sys
tem
Inpu
t Vol
ume
(m³/
annu
m)
Billed metered Billed unmetered Unbilled metered Unbilled unmetered Commercial / Apparent losses Physical / Real losses Infrastructure Leakage Index (ILI)
23 2
49 5
95
23 9
27 3
54
24 3
71 2
83
25 0
15 3
77
25 4
39 9
82
27 3
77 4
69
28 3
96 7
87
28 8
17 4
05
29 3
64 4
16
29 9
16 0
35
30 5
22 9
02
31 2
52 9
34
30 5
22 9
02
31 2
52 9
34
273
274
283
277
291
271
257
260
247
235 26
7
262
265
262
0
50
100
150
200
250
300
350
0
5 000 000
10 000 000
15 000 000
20 000 000
25 000 000
30 000 000
35 000 000
Jun-05 Jun-06 Jun-07 Jun-08 Jun-09 Jun-10 Jun-11 Jun-12 Jun-13 Jun-14 Jun-15 Jun-16 Jun-17 Jun-22
Lit
res
/ cap
ita
/ day
Po
pu
lati
on
Population served Litres / capita / day
Targets Targets
Targets
Targets

v
CONCLUSION
The Eastern Cape municipalities have not achieved their 2016 targets and have been tracking the
projected water demand without WCWDM. Municipalities in the Eastern Cape are unlikely to achieve
their 2017 targets. The estimated 2015/16 water balance, for all municipalities in the Eastern Cape,
indicates water losses of 149.61 million m3/a (45.0%) and NRW of 158.65 million m3/a (47.8%). The
water balance has a low confidence due to the limited number of data sets and is highly influenced
by the Nelson Mandela Bay and Buffalo City metros, which account for 55% of the total demand.
In the Free State, Mangaung has been enforcing water restrictions since July 2015 and it exceeded
its June 2016 target by 12.2 million m³/a or 16%. Only Mangaung submits information on a regular
basis and leakage levels fluctuate considerably. It is difficult to assess if any progress is being made
with the reduction of NRW and water losses. The estimated 2015/16 water balance, for all
municipalities in the Free State, indicates water losses of 96.91 million m3/a (46.6%) and NRW of
106.91 million m3/a (51.4%). The water balance has a low confidence due to the limited number of
data sets. WCWDM must be implemented as a matter of priority to sustain current trends and
considering that water restrictions have already been imposed in several Free State municipalities.
There is significant scope for improvement in reporting levels, data accuracy and a reduction of
system input volume, NRW, water losses and efficiency.
Gauteng has been unable to reduce their demand in the past 9 years, although water use efficiency
seems to have been improving in the past 5 years. The estimated 2015/16 water balance, for all
municipalities in Gauteng, indicates water losses of 404.07 million m3/a (27.4%) and NRW of
528.84 million m3/a (35.9%). NRW and water loss levels have come down, which is commendable,
but WCWDM implementation levels must be elevated to ensure the targets of the Greater Vaal
reconciliation strategy are achieved. There is significant scope for improvement in the reduction of
system input volume, NRW, water losses and efficiency. Data accuracy and reporting are excellent
at metro-level but can improve for some of the smaller municipalities.
KwaZulu Natal has managed to maintain their system input, leakage levels and per capita
consumption in the past 5 to 6 years. The estimated 2015/16 water balance, for all KwaZulu-Natal
municipalities, indicates water losses of 299.80 million m3/a (43.0%) and NRW of 327.44 million m3/a
(46.9%). There is however, significant scope for improvement in the reduction of system input, NRW
and water losses in the province and WCWDM implementation levels must be elevated to ensure
the targets of the KZN Metropolitan areas reconciliation strategy are achieved, especially with the
looming / imposed water restrictions in the province. Data accuracy and reporting are excellent at
metro and secondary city level but there is significant scope for improvement in reporting levels and
data accuracy for the smaller municipalities.
The Limpopo province has been unable to reduce their demand in the past 9 years and water use
efficiency is at an all-time high of 209 ℓ/c/d. The estimated 2015/16 water balance, for all
municipalities in Limpopo, indicates water losses and NRW of 155.02 million m3/a (55.1%). The
water balance has a low confidence due to the limited number of data sets. Leakage levels and
NRW are also consistently increasing and WCWDM must be implemented as a matter of priority.
There is significant scope for improvement in reporting levels, data accuracy and reduction of system
input volume, NRW, water losses and efficiency.
The Mpumalanga province has been unable to reduce their demand in the past 8 years with some
signs of improvement in 2013, although this requires further investigation. The estimated 2015/16
vi
water balance, for all North West municipalities, indicates water losses and NRW of
105.58 million m3/a (51.1%). The water balance has a low confidence level due to the low number
of data sets. NRW and water losses have reduced slightly over the past 8 years despite a significant
increase in the system input volume and WCWDM must be implemented as a matter of priority.
There is significant scope for improvement in reporting levels, data accuracy and reduction of system
input volume, NRW, water losses and efficiency.
The North West province has been unable to reduce their demand in the past 9 years, except for
2011, and shows significant growth in the past 2 years. The estimated 2015/16 water balance, for
all North West municipalities, indicates water losses and NRW of 105.58 million m3/a (51.1%). NRW
have reduced slightly in the past year but water losses are consistently increasing. WCWDM must
be implemented as a matter of priority. There is significant scope for improvement in reporting levels,
data accuracy and reduction of system input volume, NRW, water losses and efficiency.
Northern Cape has managed to maintain their system input, NRW and per capita consumption in
the past 5 to 6 years. The estimated 2015/16 water balance for all Northern Cape municipalities
indicates water losses of 42.0 million m3/a (44.6%) and NRW of 44.5 million m3/a (47.3%). The
water balance has a medium confidence level and is highly influenced by //Khara Hais (Upington)
and Sol Plaatjie (Kimberley) which accounts for approximately 67% of the demand. Increased efforts
are required by municipalities to implement WCWDM to ensure targets are achieved and water
restrictions are mitigated in the driest province. There is significant scope for improvement in
reporting levels, data accuracy, reduction of system input, NRW and water losses in the province.
The Western Cape has been doing well to maintain their system input volume for the past 3 to 4
years, while reducing their water losses and per capita consumption. The 2015/16 water balance for
the 20 data sets, indicates water losses of 80.48 million m3/a (16.7%) and NRW of 102.7 million m3/a
(21.3%). Municipalities must continue their current trends and increase their efforts to implement
WCWDM.
Nationally, the system input volume has been consistently increasing since 2006 but the NRW has
been improving since 2011 and water losses since 2009. The estimated 2015/16 water balance, for
all municipalities, indicate water losses of 1462.01 million m3/a (36.1%) and NRW of
1659.59 million m3/a (41.0%). Per capita consumption has remained almost constant over the past
9 years, which is commendable, but WCWDM efforts must be elevated considering these figures are
significantly above international benchmarks of approximately 180 ℓ/c/d and the country is one of the
30 driest in the world. The reduction in NRW is encouraging but the figures are highly influenced by
the metros that have made considerable progress to reduce their non-revenue water while there is
significant scope for improvement in most of the other municipalities. The reduction in water losses
is mainly due to the shift of water losses to unbilled consumption in the water balance.
Only continuous monitoring and analyses will provide a credible benchmark against which the
progress made with the implementation of WCWDM may be measured. WCWDM must be
implemented as a matter of urgency in all provinces, especially with the looming and reported
droughts in the country. There is significant scope for improvement in reporting levels, data accuracy
and reduction of system input, NRW, water losses and improved efficiency across the country.
vii
RECOMMENDATIONS
The following recommendations are suggested to address the progress made with the
implementation of WCWDM in the eight large water distribution systems.
Maintenance of the reconciliation strategies must continue and be used to monitor the progress
made in the implementation of WCWDM. Municipalities must actively participate and report at
these meetings and use the outcomes to prioritise resources and budgets.
Municipalities should increase their efforts to achieve the targets set under the various water
reconciliation strategies to ensure water security. Targets need to be reviewed and reported on
a regular basis.
Too many local municipalities are not aware of the reconciliation strategies or expect DWS to
provide the necessary funding to implement these strategies. Municipalities must be reminded
of their responsibilities in terms of the Water Services Act and actively participate, budget through
the Integrated Development Plans (IDP) process and implement the results from the
reconciliation strategies.
Budgets are allocated towards new infrastructure projects through ACIP, MWIG, RBIG, MIG, etc.
funding programmes but the management of these funds is fragmented with emphasis on new
infrastructure and insufficient focus on WCWDM.
Ongoing monitoring and reporting of municipal NRW and water loss performance by DWS
against determined targets and baselines is critical.
Monitoring and reporting on water balances by municipalities could become more self-regulatory
if a policy is implemented that no new infrastructure projects will be funded unless the
municipality can provide actual consumption figures and proof that their water losses are under
control. The International Water Association’s water balance should become the backbone of
all water related management and decision support systems.
Municipalities should increase their efforts to reduce NRW and the negative impact it has on their
ability to generate own income and run a viable water business.
Municipalities should, through on-going awareness programmes, encourage the consumer to
appreciate the value of water and enforce the user pays principle.
Municipalities should increase payment levels, encourage consumer fixing of leaks, and
prosecution of illegal water connections and reduce theft of water.
Municipal asset management needs to be improved to ensure greater sustainability of water
supply services.
There are close correlation between operations, maintenance, low water losses and NRW.
Municipalities should implement proactive operations and maintenance programmes to coincide
with WCWDM programmes.
Closer involvement and collaboration with National Treasury and CoGTA is critical to ensure
issues related to funding of WCWDM programmes, metering and billing issues are resolved with
municipal finance departments.
WCWDM should be included in the performance plans of organisations and senior executives to
ensure execution and achievement of these plans.
On-going provision of mentorship to municipalities through the DWS Regional Offices is critical.
DWS Regional Offices / CMAs must upscale their skills and capacity to provide WCWDM support
to municipalities, monitoring and reporting.

viii
Some Regional Offices appointed a PSP to provide support with the development of reporting
templates, meeting with municipalities to confirm targets, analyse the water balance information
and provide feedback. The reporting structures in these regions are well established and all
municipalities are reporting on a quarterly basis. The initiative was supported by Regulations
sending directives to municipalities who did not respond. A similar approach could be followed
for all the other provinces to improve communications and water balance reporting.
The Regulations Relating to Compulsory National Standards and Measures to Conserve Water
(R509, 2001) state that a water services institution must fit a suitable water volume measuring
device or volume controlling device to every user connection to control demand. Many
municipalities do not comply with this regulation which results in excessive leakages on private
properties through leaking taps and toilets as there is no incentive for consumers to fix their
leaks. DWS should consider a policy whereby water services institutions are forced to either
measure and control or fix leaks on private properties, but government cannot continue to fund
new infrastructure projects to supplement leakage as a result of poor operations and
maintenance. DWS is already encouraging the fixing of leaks through the War on Leaks
programme.
The national non-revenue water assessment completed in 2011 suggests that 45% of
municipalities cannot provide basic information such as monthly consumption figures. One of
the key challenges with gathering the information is the poor communication channels with
municipalities which includes resigned staff and a considerable number of private e-mails.
Discussions also indicate that in some cases municipalities are unwilling to provide the
information as it reflects badly on them or they feel that the information has already been
submitted through the WSDP, various questionnaires, RPMS, Green drop, Blue drop etc.
Government needs to revisit communication channels with municipalities. Communications
should be more formal, avoid duplication and targeted at senior management in the organization.
In this regard, the circulars provided by National Treasury provide clear guidelines to
municipalities and communications are only with the mayor, municipal manager and CFO.
The results from the No Drop audit must be used to motivate for funding in the next financial
year. The No Drop incentive-based regulation programme should be rolled-out as planned in
conjunction with the other Drop programmes to elevate WCWDM in the municipal environment.
DWS should also enforce its regulatory mandate to penalise municipalities that do not comply.
Closer involvement and collaboration with CoGTA and SALGA is critical to address issues
relating to human resources' skills and capacity in municipalities, as well as resolving payment
for services and unauthorised water use.
Closer collaboration is required with other national, provincial and local departments that are big
water users. These include Departments of Education, Correctional Services, Public Works and
Housing to ensure leakages and wastage are brought under control.
The recommendations of the Second Edition of the National Water Resource Strategy (DWA,
June 2013), which calls for greater emphasis on meeting specific targets to reduce water loss,
must be implemented. WCWDM measures will have multiple benefits in terms of the
postponement of infrastructure augmentation, mitigation against climate change, support to
economic growth and ensuring that adequate water is available for equitable allocation.
The recommendations of South Africa’s National Development Plan (Vision for 2030)(NPC,
2013), which calls for clear national and local targets to be achieved by 2017 and 2022, must be
implemented.

ix
TABLE OF CONTENTS
Page
1 INTRODUCTION ..................................................................................................... 1
1.1 BACKGROUND ................................................................................................................ 1
1.2 OBJECTIVES .................................................................................................................... 2
1.3 IWA WATER BALANCE .................................................................................................... 2
1.4 WATER BALANCE SHEET ............................................................................................... 4
1.5 MUNICIPAL CATEGORISATION ...................................................................................... 7
1.6 2015/16 SAMPLE SIZE ..................................................................................................... 7
1.7 2015/16 ESTIMATED WATER BALANCE ......................................................................... 8
2 LITERATURE REVIEW ........................................................................................ 10
2.1 INTRODUCTION ............................................................................................................. 10
2.2 NO DROP 2015 NATIONAL FIRST ORDER ASSESSMENT .......................................... 11
2.3 NO DROP 2015 FULL METRO ASSESSMENT .............................................................. 12
2.4 NO DROP 2015 BENCHMARKING REPORT ................................................................. 13
2.5 OTHER SOURCES OF INFORMATION ......................................................................... 15
3 WATER BALANCE TRENDS ............................................................................... 16
3.1 EASTERN CAPE PROVINCE ......................................................................................... 16
3.2 FREE STATE PROVINCE ............................................................................................... 18
3.3 GAUTENG PROVINCE ................................................................................................... 20
3.4 KWAZULU-NATAL PROVINCE ....................................................................................... 22
3.5 LIMPOPO PROVINCE .................................................................................................... 24
3.6 MPUMALANGA PROVINCE ........................................................................................... 26
3.7 NORTH WEST PROVINCE ............................................................................................. 28
3.8 NORTHERN CAPE PROVINCE ...................................................................................... 30
3.9 WESTERN CAPE PROVINCE ........................................................................................ 32
3.10 NATIONAL WATER BALANCE TRENDS ....................................................................... 34
3.11 WATER BALANCE COMPARISON ................................................................................ 36
3.12 2015/16 KEY PERFORMANCE INDICATORS PER CATEGORY ................................... 36
6 CONCLUSIONS .................................................................................................... 42
7 RECOMMENDATIONS ......................................................................................... 44
Appendix A : Municipal water balance scorecards

x
ACRONYMS
CARL Current Annual Real Losses
DWS Department of Water and Sanitation
IDP Integrated Development Plan
ILI Infrastructure Leakage Index
IWA International Water Association
KPI Key Performance Indicator
NDP National Development Plan – Vision for 2030 (2011)
NRW Non-Revenue Water
NWRS2 National Water Resource Strategy 2 (2013)
SIV System Input Volume
UARL Unavoidable Annual Real Losses
WCWDM Water Conservation Water Demand Management
WSA Water Services Authority
WSP Water Services Provider

1
1 INTRODUCTION
1.1 BACKGROUND
The “National Development Plan – Vision for 2030” (NDP) states that reducing growth in water
demand is just as important as increasing its supply. The NDP assumes it is possible to achieve an
average reduction in water demand of 15% below baseline levels (“business as usual levels”) in
urban areas by 2030. Detailed targets have been set for different areas through the Reconciliation
Strategies and the All-Town Studies. The NDP also calls for a dedicated national water conservation
and water demand management (WCWDM) programme by 2012, with clear national and local
targets for 2017 and 2022.
The Second Edition of the National Water Resource Strategy (NWRS2) builds on the first National
Water Resource Strategy (NWRS1) published in 2004. The purpose of the NWRS2 is to ensure that
national water resources are protected, used, developed, conserved, managed and controlled in an
efficient and sustainable manner. The NWRS2 acknowledges that South Africa is a water-stressed
country and is facing a number of water challenges and concerns, which include security of supply,
environmental degradation and resource pollution, and the inefficient use of water. In light of the
urgency to protect our water resources and the adverse effects of climate change, the NWRS2
submits that WCWDM should be one of the top priorities, and measures to reconcile demand and
supply in order to provide for the national goals of a better life for all through job creation and
economic growth.
Progress made with the implementation of WCWDM can only be measured against an accurate
baseline. The last comprehensive baseline assessment, of non-revenue water (NRW) and water
losses in South Africa, was published in 2015 with the No Drop publication of First order assessment
of water loss, water use efficiency and non-revenue water in municipalities (DWS and SWPN, Oct
2015). The first order No Drop assessment was undertaken in 2014 as part of the 2014 Blue Drop
Assessment and focussed on all municipalities in South Africa. The No Drop component focussed
on three (3) key performance areas, namely water balance, strategy and planning, and performance
and compliance. The report was based on 2013/14 data and key outcomes included:
A total of 4 712 677 (87.6%) of all connections were metered and 669 936 (12.4%) were
unmetered
In total, 30% of the water supply systems obtained >50% No Drop score, with the balance of
70% attaining <50%. An overall National No Drop Score of 56.5% was achieved, which falls
within the No Drop category of “Average Performance”. Water Services Authorities (WSA)
need to achieve above 90% to achieve No Drop certification
Up to 51% of the 152 water services authorities had proper or partial WCWDM Strategies and
Plans in place, and were busy with some form of implementation in the field. Coupled with
38% to 40% of WSAs having proper or partial Water Balances in place, and a savings potential
of R 3 billion/annum, this makes a strong case to focus on improvement in the quality of
planning and the intensity and acceleration of implementation. Of concern was that 62% of
WSAs did not have WCWDM contained within their Integrated Development Plans (IDP).
The national water balance for the 2012/13 audit year showed a total System Input Volume
(SIV) of 2 997.58 million kl/annum of which 2 168.97 million kl/a (72.4%) was authorised
consumption and 828.61 million kl/a (27.6%) was water losses. The water losses was made

2
up of 165.32 million kl/a (20%) apparent losses and 663.29 million kl/a (80%) real losses, which
result in a NRW of 1 038.05 million kl/annum (34.6%).
A total volume of 1 038.05 million kl/annum was lost as NRW which, calculated at a unit cost
of R 6 / kl, amounted to R 6,228 million per annum for the country as a whole. By implementing
WCWDM projects, a potential saving of 331.65 million kl/annum could be achieved, which
translates to R1 989.9 million per year.
Reporting by all municipalities is therefore very important as it facilitates transparency, awareness,
provides management information for decision support systems and provides warning mechanisms
for councils, officials, business, industry, residents and Department of Water and Sanitation (DWS)
to monitor water security, improve municipal performance and improve efficiency among consumers.
1.2 OBJECTIVES
The key objectives of this study were as follows:
Report on SIV, NRW, water loss and efficiency trends, based on 2004/05 to 2015/16 municipal
financial year data
Calculate a 2015/16 water balance for each municipality where no better information exists
Disseminate NRW / water loss benchmarking information in municipalities, government
organisations and consumers throughout South Africa to create awareness.
1.3 IWA WATER BALANCE
The modified International Water Association (IWA) water balance was accepted as the standard
reporting format for NRW and water losses in South Africa in the late 1990s. The IWA water balance
is now generally accepted throughout most countries in the world as the most standard, robust and
comprehensive approach to report on NRW / water losses. The IWA water balance was slightly
modified for South Africa to include free basic water.
Modified IWA water balance
3
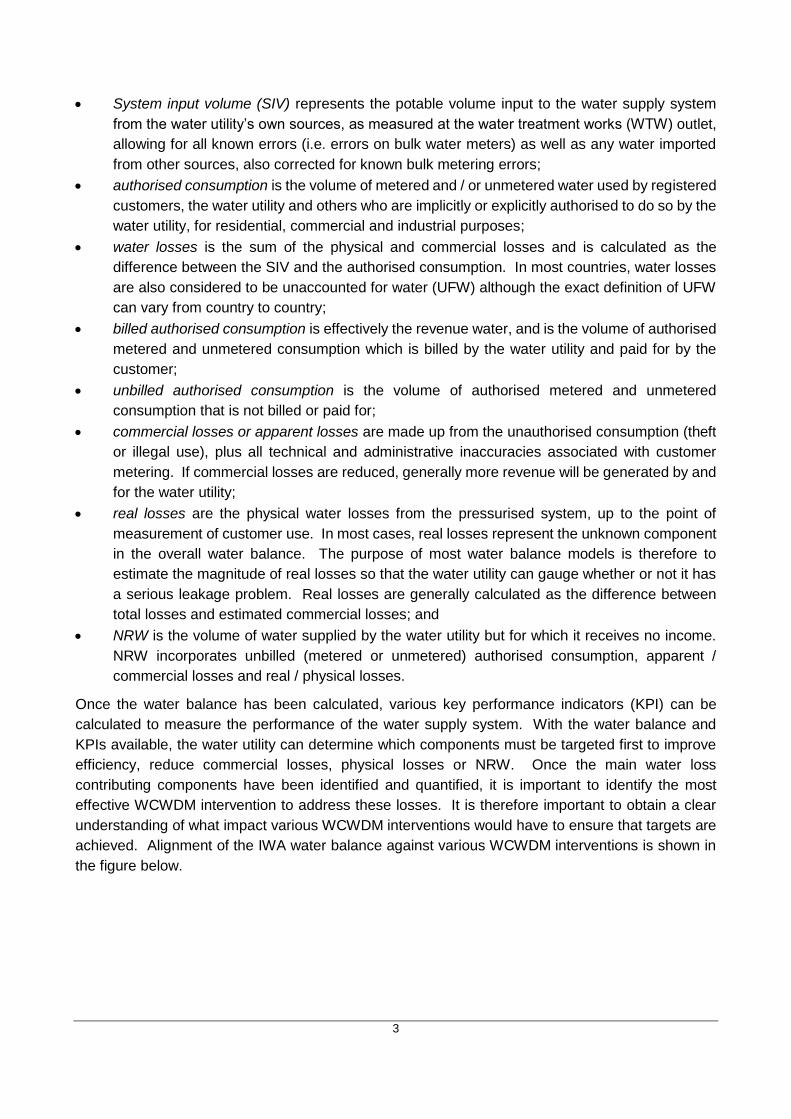
System input volume (SIV) represents the potable volume input to the water supply system
from the water utility’s own sources, as measured at the water treatment works (WTW) outlet,
allowing for all known errors (i.e. errors on bulk water meters) as well as any water imported
from other sources, also corrected for known bulk metering errors;
authorised consumption is the volume of metered and / or unmetered water used by registered
customers, the water utility and others who are implicitly or explicitly authorised to do so by the
water utility, for residential, commercial and industrial purposes;
water losses is the sum of the physical and commercial losses and is calculated as the
difference between the SIV and the authorised consumption. In most countries, water losses
are also considered to be unaccounted for water (UFW) although the exact definition of UFW
can vary from country to country;
billed authorised consumption is effectively the revenue water, and is the volume of authorised
metered and unmetered consumption which is billed by the water utility and paid for by the
customer;
unbilled authorised consumption is the volume of authorised metered and unmetered
consumption that is not billed or paid for;
commercial losses or apparent losses are made up from the unauthorised consumption (theft
or illegal use), plus all technical and administrative inaccuracies associated with customer
metering. If commercial losses are reduced, generally more revenue will be generated by and
for the water utility;
real losses are the physical water losses from the pressurised system, up to the point of
measurement of customer use. In most cases, real losses represent the unknown component
in the overall water balance. The purpose of most water balance models is therefore to
estimate the magnitude of real losses so that the water utility can gauge whether or not it has
a serious leakage problem. Real losses are generally calculated as the difference between
total losses and estimated commercial losses; and
NRW is the volume of water supplied by the water utility but for which it receives no income.
NRW incorporates unbilled (metered or unmetered) authorised consumption, apparent /
commercial losses and real / physical losses.
Once the water balance has been calculated, various key performance indicators (KPI) can be
calculated to measure the performance of the water supply system. With the water balance and
KPIs available, the water utility can determine which components must be targeted first to improve
efficiency, reduce commercial losses, physical losses or NRW. Once the main water loss
contributing components have been identified and quantified, it is important to identify the most
effective WCWDM intervention to address these losses. It is therefore important to obtain a clear
understanding of what impact various WCWDM interventions would have to ensure that targets are
achieved. Alignment of the IWA water balance against various WCWDM interventions is shown in
the figure below.

4
1.4 WATER BALANCE SHEET
A two-page water balance sheet is included in Appendix A for each municipality. Cognisance
should be taken of the following:
All information was provided by the respective municipalities or Water Services Authority
unless otherwise indicated
The water balance sheet is divided into four sections to ease the capturing and display of
information. The four sections include input data, water balance calculations, key performance
indicators and graphics
Target water balance and
possible savings
Potential savings from
various interventions
Syste
m I
nput
Vo
lum
e
Auth
orised
consum
ption
Billed authorised consumption Community awareness
Unbilled authorised consumption
Bylaws and enforcement
Potential savings from increased
water use efficiency
Implemented
through
Retrofit and removal of
wasteful devices
Tariff setting
Wate
r lo
sses
Unavoidable annual
commercial losses
Meter accuracy and
assumption errors
Economic level of commercial
losses reduction
Data transfer errors
Potential savings from a reduction
in commercial losses
Implemented
through
Data analysis and
assumption errors
Theft and unauthorised
consumption
Unavoidable annual
real losses
Pressure
reduction
Economic level of physical
losses reduction
Active and passive
leakage control
Potential savings from reduction
in physical losses
Implemented
through Mains
replacement
Speed and quality
of repairs

5
White cells require an input value, while yellow cells are calculated. The municipality is
required to provide only 15 values per annum to complete the sheet. The 15 values are split
between basic information, such as the population served, and the water balance information.
The basic information is used to calculate key performance indicators. The water balance
component follows the format of the IWA water balance
All volumes are in kℓ/annum (kℓ = m3 = 1000 litres) and based on the municipal financial year
(July to June). Data for “Year ending - Jun-05” therefore means water supply and demand
figures from July 2004 to June 2005
All underlined values were calculated using trends and / or averages based on previous years
The last two columns indicate the 2017 and 2022 targets in line with the NDP requirements
The targets were obtained from the relevant reconciliation and all town strategies, unless
otherwise indicated
Targets could not be obtained for all municipalities and were therefore only included for
selected municipalities where sufficient information was available. The analysis, evaluation,
interpretation and monitoring on the progress made with the implementation of WCWDM in
each province are therefore based on limited data sets
The provincial and district water balances are based on the sum of the municipalities located
within the province or district
The municipalities listed are in accordance with the boundary reform at the time of the
municipal election of 3 August 2016.
Example IWA Water Balance Diagram (million m3/annum)
A typical 2015/16 IWA water balance, with percentages for water losses, revenue and non-revenue
water, is shown for each municipality and province as shown in the example below:-
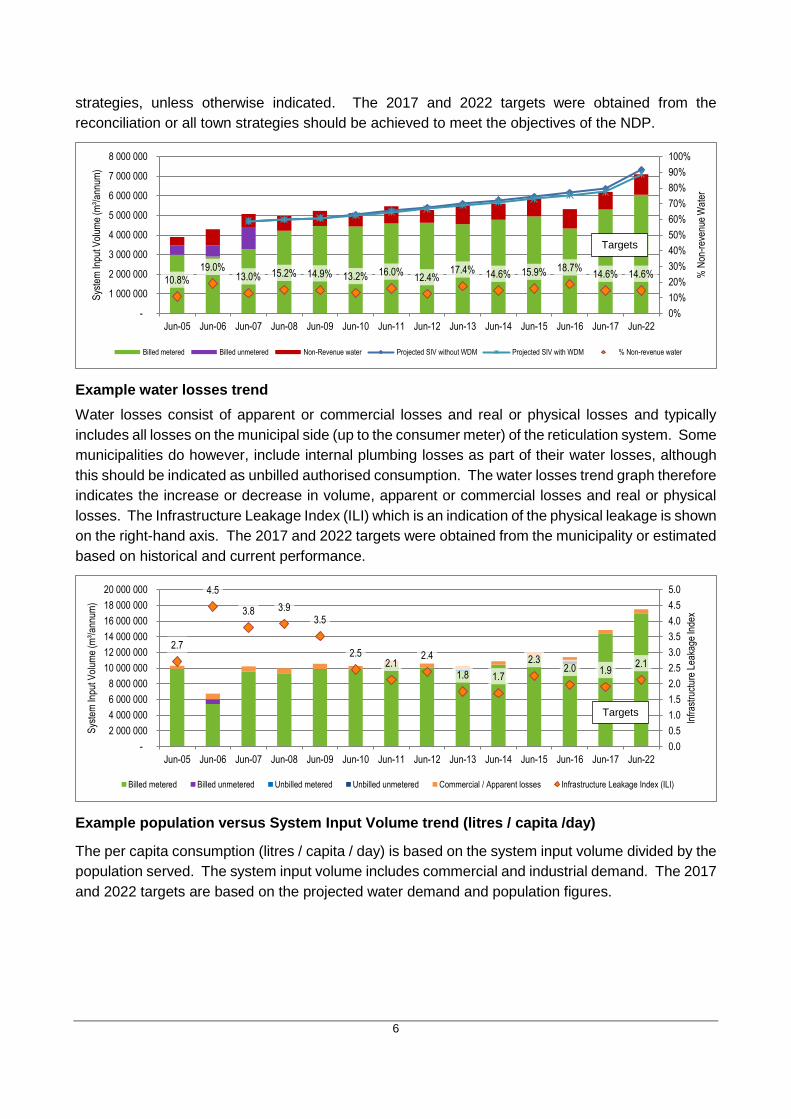
Example NRW trend
NRW consists of all unbilled authorised consumption and water losses. The example NRW trend
graph below shows the increase or decrease in volume and percentage NRW. It also shows the
projected demand with and without WCWDM as included in the DWS reconciliation or all town
System Input Volume = 580.299
Water losses = 158.771Real Losses = 114.315 Real Losses = 114.315
Non-revenue water = 233.356
Authorised consumption = 421.527
Apparent losses = 44.456 Apparent losses = 44.456
Revenue water = 346.942
Unbilled authorised = 74.585 Unbilled unmetered = 74.585
Billed authorised = 346.942
Billed unmetered = 75.097
Billed metered = 271.845
59.8%
40.2% 27.4%
6
strategies, unless otherwise indicated. The 2017 and 2022 targets were obtained from the
reconciliation or all town strategies should be achieved to meet the objectives of the NDP.
Example water losses trend
Water losses consist of apparent or commercial losses and real or physical losses and typically
includes all losses on the municipal side (up to the consumer meter) of the reticulation system. Some
municipalities do however, include internal plumbing losses as part of their water losses, although
this should be indicated as unbilled authorised consumption. The water losses trend graph therefore
indicates the increase or decrease in volume, apparent or commercial losses and real or physical
losses. The Infrastructure Leakage Index (ILI) which is an indication of the physical leakage is shown
on the right-hand axis. The 2017 and 2022 targets were obtained from the municipality or estimated
based on historical and current performance.
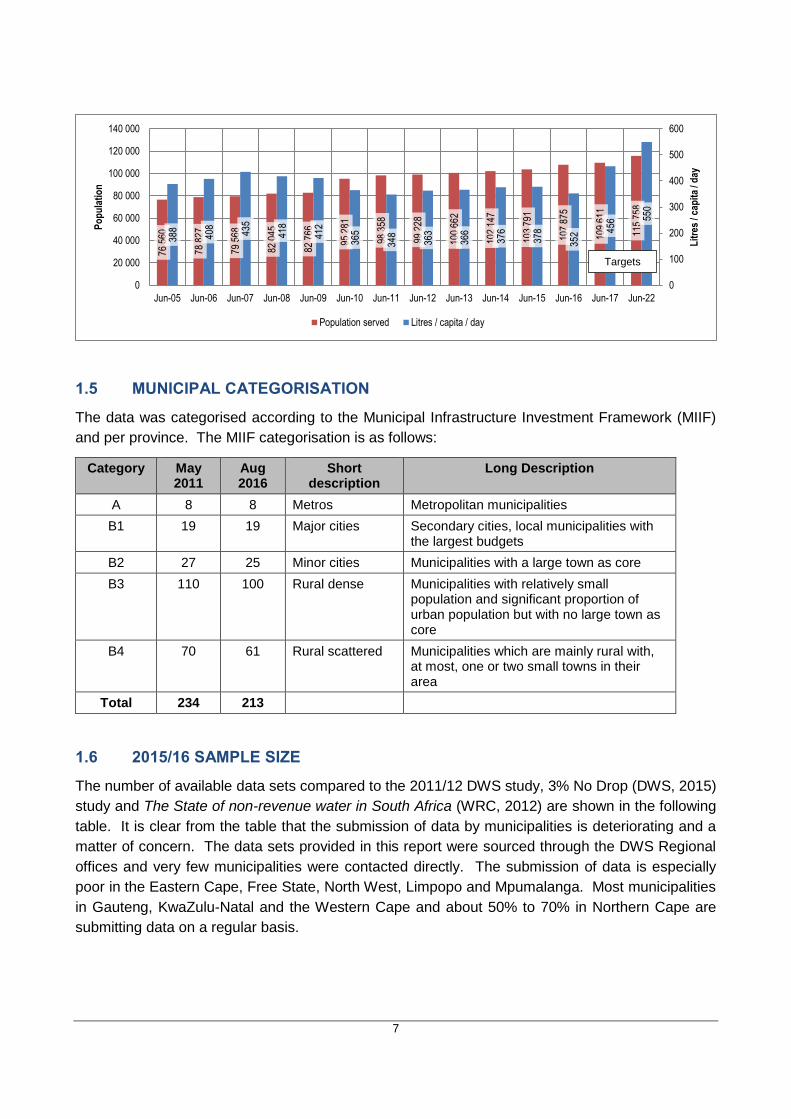
Example population versus System Input Volume trend (litres / capita /day)
The per capita consumption (litres / capita / day) is based on the system input volume divided by the
population served. The system input volume includes commercial and industrial demand. The 2017
and 2022 targets are based on the projected water demand and population figures.
10.8%
19.0%13.0% 15.2% 14.9% 13.2% 16.0%
12.4%17.4% 14.6% 15.9% 18.7%
14.6% 14.6%
0%
10%
20%
30%
40%
50%
60%
70%
80%
90%
100%
-
1 000 000
2 000 000
3 000 000
4 000 000
5 000 000
6 000 000
7 000 000
8 000 000
Jun-05 Jun-06 Jun-07 Jun-08 Jun-09 Jun-10 Jun-11 Jun-12 Jun-13 Jun-14 Jun-15 Jun-16 Jun-17 Jun-22
% N
on-r
even
ue W
ater
Sys
tem
Inpu
t Vol
ume
(m³/
annu
m)
Billed metered Billed unmetered Non-Revenue water Projected SIV without WDM Projected SIV with WDM % Non-revenue water
2.7
4.5
3.8 3.93.5
2.52.1
2.4
1.8 1.7
2.32.0 1.9
2.1
0.0
0.5
1.0
1.5
2.0
2.5
3.0
3.5
4.0
4.5
5.0
-
2 000 000
4 000 000
6 000 000
8 000 000
10 000 000
12 000 000
14 000 000
16 000 000
18 000 000
20 000 000
Jun-05 Jun-06 Jun-07 Jun-08 Jun-09 Jun-10 Jun-11 Jun-12 Jun-13 Jun-14 Jun-15 Jun-16 Jun-17 Jun-22
Infr
astr
uctu
re L
eaka
ge In
dex
Sys
tem
Inpu
t Vol
ume
(m³/
annu
m)
Billed metered Billed unmetered Unbilled metered Unbilled unmetered Commercial / Apparent losses Infrastructure Leakage Index (ILI)
Targets
Targets
7
1.5 MUNICIPAL CATEGORISATION
The data was categorised according to the Municipal Infrastructure Investment Framework (MIIF)
and per province. The MIIF categorisation is as follows:
Category May 2011
Aug 2016
Short description
Long Description
A 8 8 Metros Metropolitan municipalities
B1 19 19 Major cities Secondary cities, local municipalities with the largest budgets
B2 27 25 Minor cities Municipalities with a large town as core
B3 110 100 Rural dense Municipalities with relatively small population and significant proportion of urban population but with no large town as core
B4 70 61 Rural scattered Municipalities which are mainly rural with, at most, one or two small towns in their area
Total 234 213
1.6 2015/16 SAMPLE SIZE
The number of available data sets compared to the 2011/12 DWS study, 3% No Drop (DWS, 2015)
study and The State of non-revenue water in South Africa (WRC, 2012) are shown in the following
table. It is clear from the table that the submission of data by municipalities is deteriorating and a
matter of concern. The data sets provided in this report were sourced through the DWS Regional
offices and very few municipalities were contacted directly. The submission of data is especially
poor in the Eastern Cape, Free State, North West, Limpopo and Mpumalanga. Most municipalities
in Gauteng, KwaZulu-Natal and the Western Cape and about 50% to 70% in Northern Cape are
submitting data on a regular basis.
76 5
60
78 8
27
79 5
68
82 0
45
82 7
66
95 2
81
98 3
58
99 2
28
100
662
102
147
103
791
107
875
109
611
115
758
388
408
435
418
412
365
348
363
366
376
378
352 45
6 550
0
100
200
300
400
500
600
0
20 000
40 000
60 000
80 000
100 000
120 000
140 000
Jun-05 Jun-06 Jun-07 Jun-08 Jun-09 Jun-10 Jun-11 Jun-12 Jun-13 Jun-14 Jun-15 Jun-16 Jun-17 Jun-22
Lit
res
/ cap
ita
/ day
Po
pu
lati
on
Population served Litres / capita / day
Targets

8
Category State of NRW in
SA (2009/10) DWS (2011/12) 3% No Drop
(2012/13) 2015/16
A 8 8 8 8
B1 18 17 15 15
B2 26 21 15 15
B3 55 56 49 43
B4 25 20 14 26
Total 132 122 101 107
Total municipalities 234 234 234 213
Sample size 56% 52% 43% 50%
1.7 2015/16 ESTIMATED WATER BALANCE
All previous benchmarking reports calculated the national water balance based on an extrapolated
sample size. The national water balance is highly influenced by the metro and secondary city data,
which has high confidence level while data for the category B3 and B4 municipalities have a low
confidence and are poorly represented in the sample size. The extrapolated results provided NRW
figures between 35 to 40% depending on the methodology followed. To make a proper assessment
of the state of water losses in each province, a water balance was estimated for each municipality
where no information was available. The water balance was calculated as follows and calibrated if
necessary based on available information.
Municipal category
Average l/c/d consumption above RDP
Average l/c/d consumption below RDP
Red Book design figure (Table 9.11) Billing
efficiency
A 300 55 Very high development level = 260 to 480 l/c/d
Yard connections = 55 l/c/d (typical)
90%
B1 250 55 High development level = 130 to 280 l/c/d
Yard connections = 55 l/c/d (typical)
70%
B2 200 55 High development level = 130 to 280 l/c/d
Yard connections = 55 l/c/d (typical)
50%
B3 150 55 Moderate to high development level = 80 to 145 l/c/d
Yard connections = 55 l/c/d (typical)
30%
B4 100 25 Yard connections = 50 to 100 l/c/d
Standpipe = 10 to 50
10%
The water balance components were calculated as follows:
System input volume = Average consumption x population served
o The population served were obtained from the 2016 StatsSA Community Survey
Free Basic Water (FBW) = 6 kl x number of indigent households
o The number of indigent households were obtained from the Division of Revenue Bill
(2016/17 to 2018/19)
Billed consumption = (Total households - indigent households - unserved households) x
average consumption x billing efficiency

9
o The number of households was obtained from the 2016 StatsSA Community Survey
and Division of Revenue Bill (2016/17 to 2018/19)
o The average consumption and billing efficiency were obtained from the table above
NRW = SIV - FBW - billed consumption
In most cases, close correlation were obtained between historical data and the calculated value. For
larger municipalities and municipalities supplied from bulk service providers the average
consumption tended to be higher than expected. These communities are often supplied from large
water supply schemes at a higher level of development.
The tables below show the distribution of National Treasury’s 2016 equitable share per municipal
category and province. An indigent household is defined as a household with an income of less than
R 2300 per month.
Category Number of
households
Number of indigent
households % Indigent
Free basic water allocation
(m3/annum)
System Input volume
(m3/annum)
% billed consumption
A 6 560 289 3 287 219 50% 236 679 789 2 204 322 416 11%
B1 2 301 265 1 263 093 55% 90 942 678 714 128 992 13%
B2 1 235 172 726 120 59% 52 280 637 278 917 501 19%
B3 1 988 542 1 268 049 64% 91 299 461 428 026 024 21%
B4 3 132 593 2 342 651 75% 168 670 823 421 068 293 40%
Total 15 217 861 8 887 132 58% 639 873 388 4 046 463 225 16%
The results indicate that almost 9 million households or 58% are considered indigent and the
municipality receive equitable share on a monthly basis from National Treasury for the provision of
free basic water of 6 kl/month. Free basic water is billed at a zero rate and forms part of the
authorised billed metered or unmetered consumption in the IWA water balance. The free basic water
allocation in the category B4 municipalities is significant and means that on average the NRW cannot
be more than 60%. Limpopo has the highest percentage indigent households in the country.
Province Number of
households
Number of indigent
households (<R 2300 pm)
% Indigent
Free basic water allocation
(m3/annum)
System Input volume
(m3/annum)
% billed consumption
EC 1 733 805 1 187 761 69% 85 518 788 332 151 376 26%
FS 845 236 523 800 62% 37 713 618 207 835 805 18%
GT 4 183 543 2 091 387 50% 150 579 894 1 473 100 700 10%
KZN 2 638 912 1 659 922 63% 119 514 360 697 751 184 17%
LP 1 488 967 1 052 087 71% 75 750 240 281 235 907 27%
MP 1 147 059 705 259 61% 50 778 622 270 990 713 19%
NC 315 069 177 888 56% 12 807 951 94 205 305 14%
NW 1 138 712 704 370 62% 50 714 638 206 496 825 25%
WC 1 746 785 798 324 46% 57 479 307 482 695 411 12%
Total 15 238 087 8 900 799 58% 640 857 418 4 046 463 225 16%

10
2 LITERATURE REVIEW
2.1 INTRODUCTION
Various previous assessments of NRW have been undertaken in South Africa since the standard
IWA methodology was introduced in the late 1990s. The following main reports provide the
background to the latest assessment:
2002 – Development of a simple and pragmatic approach to benchmark real losses in potable
water distribution systems in South Africa. WRC Report TT 159/01 by Mckenzie and Lambert.
2005 – Benchmarking of Leakage from Water Reticulation Systems in South Africa. WRC
Report TT 244/05 by Mckenzie and Seago.
2007 – Non-Revenue Water in South Africa. WRC Report TT 300/07 by Seago and Mckenzie.
2012 – The State of Non-revenue Water in South Africa (2012). WRC Report TT by Mckenzie,
Siqalaba and Wegelin.
2013 - Metropolitan Municipality Non-Revenue / Water Loss Assessment by DWA Water
Services Directorate: Planning and Information - Business Intelligence Team.
2013 – Secondary City Non-Revenue / Water Loss Assessment by DWA Water Services
Directorate: Planning and Information - Business Intelligence Team.
2014 – National Non-Revenue / Water Loss Assessment by DWA Water Services Directorate:
Planning and Information - Business Intelligence Team.
2014 - A 2011/12 Assessment of Non-Revenue and Water Losses in South Africa by DWA
Water Services Directorate: Planning and Information - Business Intelligence Team.
2015 - No Drop Report - First order assessment of water loss, water use efficiency and non-
revenue water in municipalities, DWS and SWPN, Oct 2015.
2015 No Drop Report - The status of water loss, water use efficiency and non-revenue water
in metropolitan municipalities, DWS and SWPN, Oct 2015.
2015 No Drop Report - Benchmarking of Water Loss, Water Use Efficiency and Non-Revenue
Water in South African Municipalities (2004/05 to 2012/13), DWS and SWPN, Oct 2015.
These assessments provided updated and more reliable information on municipal water use than
the previous estimates, and in each case, the available database was expanded to include additional
municipalities which had not previously provided any useful information.
Key results from the latest three studies are summarised in the following section while the remaining
studies are available from the Water Research Commission (WRC) or the Department of Water and
Sanitation (DWS).

11
2.2 NO DROP 2015 NATIONAL FIRST ORDER ASSESSMENT
The purpose of this study was to provide an overview of the status of
municipalities as pertaining to their water losses, non-revenue water and
water use efficiency, based on the 2012/13 financial year. The
assessment is fully documented in the 2015 report entitled “2015 No Drop
Report - First order assessment of water loss, water use efficiency
and non-revenue water in municipalities, DWS and SWPN, Oct 2015”.
Based on verified evidence and data sets, the No Drop audit concluded
that all 152 water services authorities participated in the No Drop
assessment. Data sets were received for 71 water services authorities,
representing a total population of 32 580 710 and 9 043 534 households
which is approximately 62% of the country’s total population. These
households are supplied via a total mains network of 121 449 km and 5 382 613 connections, with
an average of 44 connections per km pipeline. A total of 4 712 677 (87.6%) of all connections are
metered and 669 936 (12.4%) are unmetered. The average system pressure is 45 m, ranging
between 52 m and 36 m reported by the various municipalities.
A total of 949 water supply systems have been assessed. In total, 30% of the water supply systems
obtained >50% No Drop score, with the balance of 70% attaining <50%. An overall National No
Drop Score of 56.5% was achieved, which falls within the No Drop category of ‘Average
Performance”. This (weighted) national score bodes well for the future of WCWDM in the country,
given that it is a first time assessment and steep learning curve for the municipalities. The higher
score is positively influenced by the good scores obtained by the metropolitan municipalities and
some of the municipalities with larger capacity systems.
Up to 51% of the 152 water services authorities have proper or partial WCWDM Strategies and Plans
in place, and are busy with some form of implementation in the field. Coupled with 38% to 40% of
WSAs having proper or partial Water Balances in place, and a savings potential of R 3 billion/annum,
this makes a strong case to focus on improvement in the quality of planning and the intensity and
acceleration of implementation. Of concern is that 62% of WSAs do not have WCWDM contained
within their IDPs. This is a fundamental requirement to ensure that projects are rolled out in the field.
Regulatory letters to Mayors and Municipal Managers, annexed to their No Drop results, will serve
to rectify this omission.
The National Water Balance for the 2012/13 audit year shows a total SIV 2 997.58 million kl/annum
of which 2 168.97 million kl/a (72.4%) is Authorised Consumption and 828.61 million kl/a (27.6%) is
Water Losses. The Water Losses is made up of 165.32 million kl/a (20%) apparent Losses and
663.29 million kl/a (80%) real losses, which result in a NRW of 1 038.05 million kl/annum (34.6%).
A total volume of 1 038.05 million kl/annum is lost as NRW which, calculated at a unit cost of R 6 / kl,
amounts to R 6,228 million per annum for the country as a whole. By implementing WCWDM
projects, a potential saving of 331.65 million kl/annum can be achieved, which translates to
R1 989.9 million per year. Savings in excess of R 3 billion can be projected if all 152 water services
authorities’ water balances are considered. The potential savings that can be realised by investing
in WCWDM in Category A and B1 municipalities is 84% of the national savings potential.

12
Water use efficiency is typically one of the key performance indicators and reported at national
government level. The average water use efficiency is 237 ℓ/c/d and 234 ℓ/c/d for the Provinces and
the WSA Categories, respectively. The reported efficiencies are significantly above the international
benchmark of 180 ℓ/c/d and municipalities must continue to plan for improvement towards an
average consumption of below 200 ℓ/c/d.
2.3 NO DROP 2015 FULL METRO ASSESSMENT
This report is the first full No Drop audit of metropolitan municipalities. The
assessment is fully documented in the 2015 report entitled “2015 No Drop
Report - The status of water loss, water use efficiency and non-
revenue water in metropolitan municipalities, DWS and SWPN, Oct
2015”.
All metros have strategies and business plans to address the NRW, water
losses and efficiency. Significant progress has been made with the
implementation of these strategies and business plans, but there is still a
lack of political support, budgets, alignment to the Department’s
reconciliation strategies and understanding of the possible consequences
of water restriction. The targets set under the various reconciliation
strategies are included in the NDP and NWRS2 and it is critical that these targets are achieved to
avoid possible water restriction and the subsequent detrimental economic impact. All metros must
revise their strategies and business plans to ensure targets are achieved and the risk of water
restrictions is minimised.
Asset management has a direct impact on WCWDM. Without proper operation and maintenance, it
will not be possible to monitor the water losses in a distribution system and perform basic functions
such as metering, billing and cost recovery. All metros could improve the operations and
maintenance of their assets, which have a direct impact on water loss control.
No water services authority would be able to implement WCWDM without the necessary staff
capacity and skills. Most WCWDM activities and preventative maintenance could be performed as
part of the daily operation and maintenance of the system. Staff capacity and skills obtained the
second lowest score of all the criteria and should be addressed as a matter of priority. A standard
must be developed to specify the skills and capacity required to operate and maintain a water
distribution system.
The information used to prepare a monthly water balance is, in general, credible, plausible and
readily available. Proper management, reading and billing of consumer meters cannot happen if
there is not a good relationship between the finance and technical departments. The finance and
technical departments in all metros should interact on a daily basis to ensure consumer meters are
properly installed, repaired, inspected, read and billed. All metros should strive to meter and bill,
based on actual meter readings, to ensure the financial sustainability of the metro and customer
satisfaction.
Key performance indicators and compliance with the water demand management regulations
contributed most to the overall score. Metros should endeavour to fix all leaks within 48 hours of
becoming aware thereof, improve water losses, NRW and efficiency and implement pressure
13
management. Improved compliance and performance will significantly improve the overall score of
all metros. The large number of unmetered connections and deemed (flat rate) consumers must be
addressed as a matter of priority to promote water use efficiency and generate income for the metros.
The results indicate that average system pressures are high and there is scope for aggressive
pressure reduction in all metros. Pressure reduction is a cost effective WCWDM measure and
should be implemented as a priority.
All metros have the necessary policies and bylaws, but enforcement could be improved through
political support and additional human resources. Metros will receive the benefit through reduced
water theft, consumer awareness and equality.
There is significant scope for increased community awareness in all metros. Consumers need to be
made aware that South Africa is a water scarce country and the value of water should be
appreciated. Community awareness programmes will improve the relationship between the metro
and its customers, create more informed consumers and reduce the risk of service delivery unrest.
Metros could benefit from WCWDM programmes through improved service delivery, sustainable
resources, financial viability, social and economic improvement. The key WCWDM interventions
identified by the metros, include pressure management, top consumer audits, household leak repair
programmes, metering of unmetered properties and water reuse, have been proven to provide a
very good return on investment, with payback periods of less than 3 years.
Metros require approximately R 2 billion per annum to fund their WCWDM programmes and currently
have a shortfall of R 500 million. A 10% reduction in SIV and reducing NRW to 25% can generate
approximately R 2 billion additional income for metros, through reduced water purchases and
increased water sales. There is a business case for obtaining funding from financial institutions, as
the estimated savings are equivalent to the average annual budget required for WCWDM.
2.4 NO DROP 2015 BENCHMARKING REPORT
This report is an update of the first comprehensive baseline assessment, of
NRW and water losses in South Africa, which was made in 2012 with the
publication of the The State of Non-revenue water in South Africa (2012)
(WRC, Report TT522/12). The assessment is fully documented in the 2015
report entitled “Benchmarking of Water Loss, Water Use Efficiency and
Non-Revenue Water in South African Municipalities (2004/05 to
2012/13), DWS and SWPN, Oct 2015”
The Eastern Cape has managed to maintain leakage levels and per capita
consumption in the past 5 years but, especially with the looming drought
situation, there is significant scope for improvement in reporting levels, data
accuracy and a reduction of NRW and water losses.
The Free State has been unable to reduce their demand in the past 9 years and water use efficiency
is at an all-time high of 270 ℓ/c/d. Leakage levels fluctuate considerably and it is difficult to assess if
any progress is being made with the reduction of NRW and water losses. WCWDM must be
implemented as a matter of priority, considering that water restrictions have already been imposed
in Mangaung metro. There is significant scope for improvement in reporting levels, data accuracy
and a reduction of system input volume, NRW, water losses and efficiency.

14
Gauteng has been unable to reduce their demand in the past 9 years, although water use efficiency
seems to have been improving in the past 5 years. NRW and water loss levels have come down,
which is commendable, but WCWDM implementation levels must be elevated to ensure the targets
of the Greater Vaal reconciliation strategy are achieved. There is significant scope for improvement
in the reduction of system input volume, NRW, water losses and efficiency. Data accuracy and
reporting are excellent at metro-level but can improve for some of the smaller municipalities.
KwaZulu Natal has managed to maintain their system input, leakage levels and per capita
consumption in the past 5 to 6 years. There is however, significant scope for improvement in the
reduction of system input, NRW and water losses in the province and WCWDM implementation
levels must be elevated to ensure the targets of the KZN Metropolitan areas reconciliation strategy
are achieved, especially with the looming / imposed water restrictions in the province. Data accuracy
and reporting are excellent at metro and secondary city level but there is significant scope for
improvement in reporting levels and data accuracy for the smaller municipalities.
The Limpopo province has been unable to reduce their demand in the past 9 years and water use
efficiency is at an all-time high of 205 ℓ/c/d. Leakage levels and NRW are also consistently increasing
and WCWDM must be implemented as a matter of priority. There is significant scope for
improvement in reporting levels, data accuracy and a reduction of system input volume, NRW, water
losses and efficiency.
The Mpumalanga province has been unable to reduce their demand in the past 8 years with some
signs of improvement in 2013, although this requires further investigation. NRW and water losses
have reduced slightly over the past 8 years despite a significant increase in the system input volume
and WCWDM must be implemented as a matter of priority. There is significant scope for
improvement in reporting levels, data accuracy and a reduction of system input volume, NRW, water
losses and efficiency.
The North West province has been unable to reduce their demand in the past 9 years and have
shown significant growth in the past 2 years. NRW have reduced slightly in the past year but water
losses are consistently increasing. WCWDM must be implemented as a matter of priority. There is
significant scope for improvement in reporting levels, data accuracy and a reduction of system input
volume, NRW, water losses and efficiency.
Northern Cape has managed to maintain their system input, NRW and per capita consumption in
the past 5 to 6 years. Increased efforts are required by municipalities to implement WCWDM to
ensure targets are achieved and water restrictions are mitigated in the driest province. There is
significant scope for improvement in reporting levels, data accuracy and a reduction of system input,
NRW and water losses in the province.
Municipalities in the Western Cape have been doing well to maintain their system input volume for
the past 3 to 4 years, while reducing their water losses and per capita consumption. Municipalities
must continue their current trends and increase their efforts to implement WCWDM.
Nationally, the system input volume has been consistently increasing since 2006 but the NRW has
been improving since 2011 and water losses since 2009. Per capita consumption has remained
almost constant over the past 9 years, which is commendable, but WCWDM efforts must be elevated
considering these figures are significantly above international benchmarks of approximately 180 ℓ/c/d
and the country is one of the 30 driest in the world.
15
The reduction in non-revenue water is encouraging but the figures are highly influenced by the
metros that have made considerable progress to reduce their non-revenue water while there is
significant scope for improvement in most of the other municipalities. The reduction in water losses
is mainly due to the shift of water losses to unbilled consumption in the water balance. This shift
emphasises the extent of leakage on private properties and the need for metering and billing
systems, mechanisms to control consumer demand, the War-on-Leaks programme and consumer
education and awareness.
Only continuous monitoring and analyses will provide a credible benchmark against which the
progress made with the implementation of WCWDM may be measured. WCWDM must be
implemented as a matter of urgency in all provinces, especially with the looming and reported
droughts in the country. There is significant scope for improvement in reporting levels, data accuracy
and reduction of system input, NRW, water losses and improved efficiency across the country.
2.5 OTHER SOURCES OF INFORMATION
Population and households served figures were obtained from the DWS
National Water Services Knowledge System (https://www.dwa.gov.za/wsks/).
These figures are compiled by DWS, in close collaboration with StatsSA, and are
used for all planning purposes, including the development of Water Services
Development Plans. Any household with access to potable water, regardless of
the level of service, is considered served. Municipalities should contact the
Directorate Water Services Planning and Information if they disagree with any of the figures.
Number of metered and unmetered connections was obtained from Census 2011 and
Community Survey 2016, where all house and yard connections were considered metered.
The balance between households served and metered connections were considered
unmetered connections. Municipalities should update this information from their billing system.
Close correlation between households served and number of connections is expected, except
in some municipalities with a high number of townhouse developments, with single connection,
or backyard dwellers.

16
3 WATER BALANCE TRENDS
The water balance trends for the nine provinces and a national perspective are provided in the
following sections. The water balance sheet for each municipality is included in Appendix A.
3.1 EASTERN CAPE PROVINCE
Reporting in the Eastern Cape has been very poor in recent years with only the Nelson Mandela Bay
and Buffalo City metros submitting water balance information on a regular basis. The DWS regional
office has no active WCWDM reporting and meeting programme in place.
The estimated 2015/16 water balance, for all municipalities in the Eastern Cape, indicates water
losses of 149.61 million m3/a (45.0%) and NRW of 158.65 million m3/a (47.8%). The water balance
has a low confidence due to the limited number of data sets and is highly influenced by the Nelson
Mandela Bay and Buffalo City metros, which account for 55% of the total demand. These figures
are slightly higher than the 2012/13 No Drop assessment of 40.3% water losses and 44.5% NRW.
The No Drop assessment was based on 19 data sets with a SIV of 219.75 million m3/a. The increase
is due to the increased losses in the metros and the inclusion of all category B3 and B4 municipalities,
which tend to have less budget and resources with subsequent higher losses and NRW.
The water balance and trends for the Eastern Cape are based on the two plausible data sets of the
metros of a possible 33 municipalities. NRW and water loss trends for the Eastern Cape metros
show a gradual increase from 2011 until 2016. The drop in demand from 2009 to 2011 is mainly
due to the water restrictions imposed in the Nelson Mandela Bay metro. Indications are that the
system input volume is quickly returning to previous levels since the lifting of the drought restrictions.
NRW has increased significantly in the past year but water losses have improved slightly. The results
indicate that metros in the Eastern Cape have not achieved their 2016 targets and have been
tracking the projected water demand without WCWDM. Municipalities in the Eastern Cape are
unlikely to achieve their 2017 targets.
System Input Volume = 332.151
Water losses = 149.605Real Losses = 121.589 Real Losses = 121.589
Non-revenue water = 158.647
Authorised consumption = 182.547
Apparent losses = 28.015 Apparent losses = 28.015
Revenue water = 173.504
Unbilled authorised = 9.043 Unbilled unmetered = 8.737
Billed authorised = 173.504
Billed unmetered = 74.534
Billed metered = 98.970
52.2%
47.8% 45.0%

17
The ILI for the two metros reached an all-time high of 6.6 in June 2015. In 2016, the ILI reduced to
5.6 due to an increase in commercial losses and unbilled consumption and not reduced real losses.
Per capita consumption for the two metros increased from 2005 and peaked in 2009 at 276 ℓ/c/d.
Since 2010 the per capita consumption has averaged 246 ℓ/c/d. The reduction in the per capita
consumption from 2015 to 2016 is due to a correction in the population figures and not as a result of
improved efficiency.
The Eastern Cape has managed to maintain leakage levels and per capita consumption in the past
7 years but, especially with the looming drought situation, there is significant scope for improvement
in reporting levels, data accuracy and a reduction of SIV, NRW and water losses.
31.84% 31.98%36.57% 37.09% 38.51% 38.39%
42.31% 40.71% 43.27% 41.26% 40.82%46.30%
31.32%24.28%
0%
10%
20%
30%
40%
50%
60%
70%
80%
90%
100%
-
50 000 000
100 000 000
150 000 000
200 000 000
250 000 000
Jun-05 Jun-06 Jun-07 Jun-08 Jun-09 Jun-10 Jun-11 Jun-12 Jun-13 Jun-14 Jun-15 Jun-16 Jun-17 Jun-22
% N
on-r
even
ue W
ater
Sys
tem
Inpu
t Vol
ume
(m³/
annu
m)
Billed metered Billed unmetered Non-Revenue water Projected SIV without WDM Projected SIV with WDM % Non-revenue water
4.6 4.5 4.4
5.55.7
5.35.6
4.6
5.75.3
6.6
5.6
3.6
2.9
0.0
1.0
2.0
3.0
4.0
5.0
6.0
7.0
-
20 000 000
40 000 000
60 000 000
80 000 000
100 000 000
120 000 000
140 000 000
160 000 000
180 000 000
200 000 000
Jun-05 Jun-06 Jun-07 Jun-08 Jun-09 Jun-10 Jun-11 Jun-12 Jun-13 Jun-14 Jun-15 Jun-16 Jun-17 Jun-22
Infr
astr
uctu
re L
eaka
ge In
dex
Sys
tem
Inpu
t Vol
ume
(m³/
annu
m)
Billed metered Billed unmetered Unbilled metered Unbilled unmetered Commercial / Apparent losses Physical / Real losses Infrastructure Leakage Index (ILI)
1 50
9.60
1 53
9.94
1 57
0.42
1 60
1.38
1 63
0.77
1 73
5.04
1 78
7.88
1 80
3.43
1 82
1.02
1 83
8.35
1 85
7.29
1 98
7.46
2 00
7.91
2 17
0.92
253
251
259
272
276
247
228
239
242
253
254
244
217
226
0
50
100
150
200
250
300
0
500
1 000
1 500
2 000
2 500
Jun-05 Jun-06 Jun-07 Jun-08 Jun-09 Jun-10 Jun-11 Jun-12 Jun-13 Jun-14 Jun-15 Jun-16 Jun-17 Jun-22
Lit
res
/ cap
ita
/ day
Po
pu
lati
on
('00
0)
Population served Litres / capita / day
Targets
Targets
Targets

18
3.2 FREE STATE PROVINCE
Reporting in the Free State has been very poor in recent years with only Mangaung metro submitting
water balance information on a regular basis. The DWS regional office has no active WCWDM
reporting and meeting programme in place.
The estimated 2015/16 water balance, for all municipalities in the Free State, indicates water losses
of 96.91 million m3/a (46.6%) and NRW of 106.91 million m3/a (51.4%). The water balance has a
low confidence due to the limited number of data sets. These figures are significantly higher than
the 2012/13 No Drop assessment of 30.7% water losses and 36.5% NRW. The No Drop assessment
was based on 11 data sets with a SIV of 204.15 million m3/a. The fluctuation is attributed to the poor
quality of data for the province. The water balance information is highly influenced by the Mangaung
metro and Matjhabeng municipality, which accounts for approximately 52% of the demand.
The water balance trend for the Free State is based on Mangaung metro as no other municipality is
submitting water balance information on a regular basis.
The SIV in Mangaung grew consistently from 2005 to 2014 with a slight improvement in 2011. SIV,
NRW and water losses have improved since 2014, mainly as a result of the WCWDM interventions
and 20% water restrictions undertaken in Mangaung municipality. The SIV, NRW and water losses
are expected to return to previous levels once the water restrictions have been lifted.
Mangaung has been enforcing water restrictions since July 2015 and it exceeded its June 2016
System Input Volume = 207.836
Water losses = 96.910Real Losses = 76.793 Real Losses = 76.793
Non-revenue water = 106.909
Authorised consumption = 110.926
Apparent losses = 20.117 Apparent losses = 20.117
Revenue water = 100.927
Unbilled authorised = 9.999Unbilled unmetered = 1.180
Billed authorised = 100.927
Billed unmetered = 31.752
Billed metered = 69.175
40.1% 42.4%
52.3% 51.1% 52.2% 50.3%
31.0%
43.1%49.9%
46.6%40.0% 40.9%
34.5%
25.9%
0%
10%
20%
30%
40%
50%
60%
70%
80%
90%
100%
-
20 000 000
40 000 000
60 000 000
80 000 000
100 000 000
120 000 000
Jun-05 Jun-06 Jun-07 Jun-08 Jun-09 Jun-10 Jun-11 Jun-12 Jun-13 Jun-14 Jun-15 Jun-16 Jun-17 Jun-22
% N
on-r
even
ue W
ater
Sys
tem
Inpu
t Vol
ume
(m³/
annu
m)
Billed metered Billed unmetered Non-Revenue water Projected SIV without WDM Projected SIV with WDM % Non-revenue water
48.6%
51.4% 46.6%
Targets

19
target by 12.2 million m³/a or 16%. The NRW of Mangaung remains above 40% for the past 10
years. Mangaung has been tracking the projected demand with WCWDM and will most likely
achieve its 2017 target if water restrictions remain in place.
ILI for Mangaung has steadily been declining since 2009 and reached an all-time low of 3.1 in June
2016. The results are encouraging and should be sustained. The ILI for Mangaung is below the
national average of 5.8.
Per capita consumption in Mangaung improved significantly in the past two years as a result of
WCWDM interventions and 20% water restrictions but remains high compared to the national
average of 233 litres per capita per day. Per capita consumption is an indication of water use
efficiency and high consumption could be as a result of poor metering and billing systems and lack
of awareness among consumers.
WCWDM must be implemented as a matter of priority to sustain current trends and considering that
water restrictions have already been imposed in several Free State municipalities. There is
significant scope for improvement in reporting levels, data accuracy and a reduction of system input
volume, NRW, water losses and efficiency.
4.24.7
7.0 7.17.6
7.0
5.34.8
4.1 4.3
3.3 3.1
5.14.6
0.0
1.0
2.0
3.0
4.0
5.0
6.0
7.0
8.0
-
20 000 000
40 000 000
60 000 000
80 000 000
100 000 000
120 000 000
Jun-05 Jun-06 Jun-07 Jun-08 Jun-09 Jun-10 Jun-11 Jun-12 Jun-13 Jun-14 Jun-15 Jun-16 Jun-17 Jun-22
Infr
astr
uctu
re L
eaka
ge In
dex
Sys
tem
Inpu
t Vol
ume
(m³/
annu
m)
Billed metered Billed unmetered Unbilled metered Unbilled unmetered Commercial / Apparent losses Physical / Real losses Infrastructure Leakage Index (ILI)
571
836
586
703
600
973
613
631
627
125
689
738
711
129
715
725
720
159
724
473
729
107
739
382
744
111
759
425
299
299 33
1
337
346
314
297
309
312
327
311
268 31
3 355
0
50
100
150
200
250
300
350
400
0
100 000
200 000
300 000
400 000
500 000
600 000
700 000
800 000
Jun-05 Jun-06 Jun-07 Jun-08 Jun-09 Jun-10 Jun-11 Jun-12 Jun-13 Jun-14 Jun-15 Jun-16 Jun-17 Jun-22
Lit
res
/ cap
ita
/ day
Po
pu
lati
on
Population served Litres / capita / day
Targets
Targets

20
3.3 GAUTENG PROVINCE
Reporting in the Gauteng has been good with most municipalities submitting water balance
information on a regular basis. The DWS regional office has an active WCWDM reporting
programme in place and is lauded for their efforts to implement active monitoring and reporting
mechanisms..
The estimated 2015/16 water balance, for all municipalities in Gauteng, indicates water losses of
404.07 million m3/a (27.4%) and NRW of 528.84 million m3/a (35.9%). The water balance has a high
confidence level and is highly influenced by City of Johannesburg, City of Tshwane, Ekurhuleni and
Emfuleni, which account for 95% of the demand. These figures are slightly higher than the 2012/13
No Drop assessment of 25.8% water losses and 34.5% NRW. The No Drop assessment was based
on 6 data sets with a SIV of 1337.54 million m3/a.
The water balance trends for the Gauteng are based on 6 (60%) plausible data sets of a possible
10 municipalities. The municipalities include City of Johannesburg, Ekurhuleni, City of Tshwane,
Emfuleni, Lesedi and Midvaal municipalities, which accounts for approximately 96% of the demand.
NRW and water losses have remained stable for the past 5 years but SIV has been consistently
increasing. Municipalities in Gauteng have been tracking the high population no WCWDM projection
and it is unlikely that the 2017 target will be achieved. There is a noticeable increase in the unbilled
consumption, which was previously included in the water loss component of the water balance.
System Input Volume = 1473.101
Water losses = 404.066Real Losses = 295.187 Real Losses = 295.187
Non-revenue water = 528.840
Authorised consumption = 1069.034
Apparent losses = 108.880 Apparent losses = 108.880
Revenue water = 944.261
Unbilled authorised = 124.773 Unbilled unmetered = 113.398
Billed authorised = 944.261
Billed unmetered = 119.464
Billed metered = 824.797
21.8%25.1% 26.0%
34.0% 35.7% 35.9% 38.3%34.9% 34.5% 36.6% 36.2% 35.7%
29.1%24.1%
0%
10%
20%
30%
40%
50%
60%
70%
80%
90%
100%
-
200 000 000
400 000 000
600 000 000
800 000 000
1 000 000 000
1 200 000 000
1 400 000 000
1 600 000 000
1 800 000 000
Jun-05 Jun-06 Jun-07 Jun-08 Jun-09 Jun-10 Jun-11 Jun-12 Jun-13 Jun-14 Jun-15 Jun-16 Jun-17 Jun-22
% N
on-r
even
ue W
ater
Sys
tem
Inpu
t Vol
ume
(m³/
annu
m)
Billed metered Billed unmetered Non-Revenue water Projected SIV without WDM Projected SIV with WDM % Non-revenue water
64.1%
35.9% 27.4%
Targets
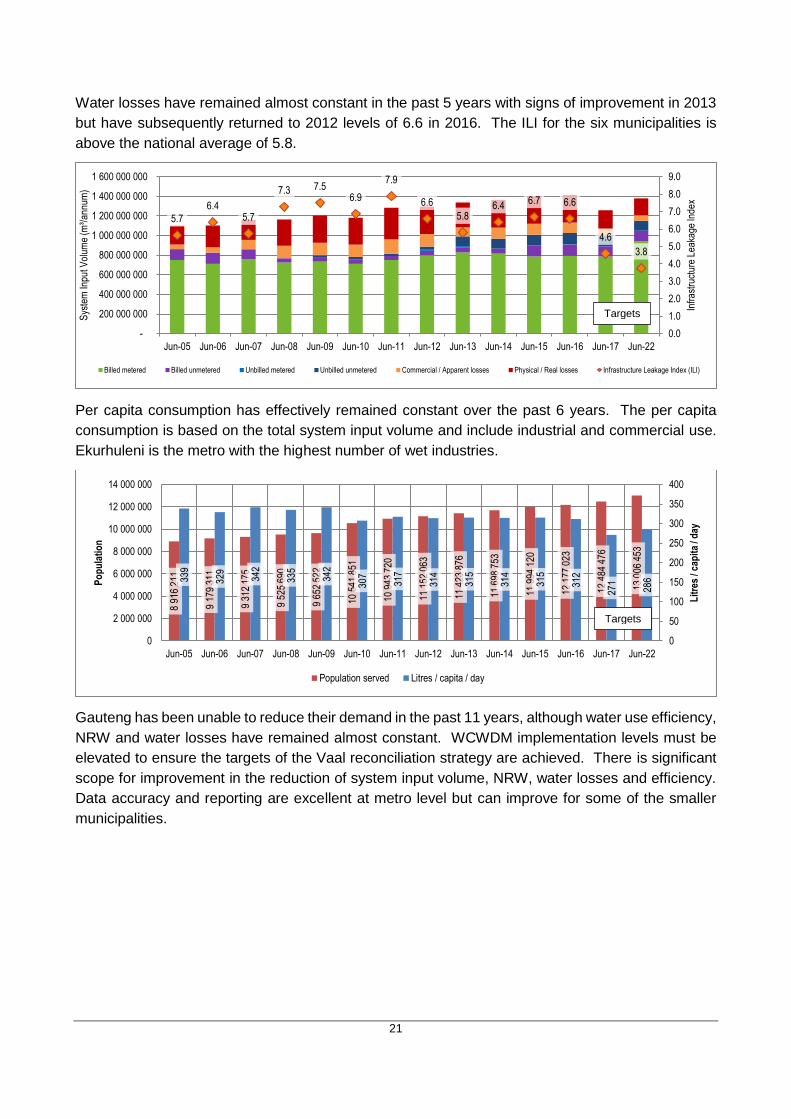
21
Water losses have remained almost constant in the past 5 years with signs of improvement in 2013
but have subsequently returned to 2012 levels of 6.6 in 2016. The ILI for the six municipalities is
above the national average of 5.8.
Per capita consumption has effectively remained constant over the past 6 years. The per capita
consumption is based on the total system input volume and include industrial and commercial use.
Ekurhuleni is the metro with the highest number of wet industries.
Gauteng has been unable to reduce their demand in the past 11 years, although water use efficiency,
NRW and water losses have remained almost constant. WCWDM implementation levels must be
elevated to ensure the targets of the Vaal reconciliation strategy are achieved. There is significant
scope for improvement in the reduction of system input volume, NRW, water losses and efficiency.
Data accuracy and reporting are excellent at metro level but can improve for some of the smaller
municipalities.
5.7
6.45.7
7.3 7.56.9
7.9
6.6
5.86.4
6.7 6.6
4.6
3.8
0.0
1.0
2.0
3.0
4.0
5.0
6.0
7.0
8.0
9.0
-
200 000 000
400 000 000
600 000 000
800 000 000
1 000 000 000
1 200 000 000
1 400 000 000
1 600 000 000
Jun-05 Jun-06 Jun-07 Jun-08 Jun-09 Jun-10 Jun-11 Jun-12 Jun-13 Jun-14 Jun-15 Jun-16 Jun-17 Jun-22
Infr
astr
uctu
re L
eaka
ge In
dex
Sys
tem
Inpu
t Vol
ume
(m³/
annu
m)
Billed metered Billed unmetered Unbilled metered Unbilled unmetered Commercial / Apparent losses Physical / Real losses Infrastructure Leakage Index (ILI)
8 91
6 21
1
9 17
9 31
1
9 31
2 17
5
9 52
5 69
0
9 65
2 52
2
10 5
41 8
51
10 9
43 7
20
11 1
52 0
63
11 4
23 8
76
11 6
98 7
53
11 9
94 1
20
12 1
77 0
23
12 4
84 4
76
13 0
06 4
53
339
329
342
335
342
307
317
314
315
314
315
312
271
286
0
50
100
150
200
250
300
350
400
0
2 000 000
4 000 000
6 000 000
8 000 000
10 000 000
12 000 000
14 000 000
Jun-05 Jun-06 Jun-07 Jun-08 Jun-09 Jun-10 Jun-11 Jun-12 Jun-13 Jun-14 Jun-15 Jun-16 Jun-17 Jun-22
Lit
res
/ cap
ita
/ day
Po
pu
lati
on
Population served Litres / capita / day
Targets
Targets

22
3.4 KWAZULU-NATAL PROVINCE
Reporting in the KwaZulu-Natal has been good with most municipalities submitting water balance
data on a regular basis. The DWS regional office has an active reporting and meeting programme
in place and is lauded for their efforts to implement active monitoring and reporting mechanisms.
The estimated 2015/16 water balance, for all KwaZulu-Natal municipalities, indicates water losses
of 299.80 million m3/a (43.0%) and NRW of 327.44 million m3/a (46.9%). Some of water balance
data sets submitted by the municipalities are questionable and the provincial water balance has a
medium confidence level. These figures are higher than the 2012/13 No Drop assessment of 37.6%
water losses and 40.4% NRW. The No Drop assessment was based on 12 data sets with a SIV of
541.54 million m3/a.
The water balance trends for the KwaZulu Natal are based on 4 plausible data sets of a possible 44
municipalities. These municipalities are eThekwini metro, Msunduzi, Newcastle and City of
uMhlathuze, which account for approximately 69% of the demand.
SIV and NRW for the KwaZulu Natal show a gradual increase from 2011. Water losses have
improved slightly over the same period but there is a noticeable increase in the unbilled consumption,
which was previously included in the water loss component of the water balance. The four
municipalities have been tracking the projected water demand without WCWDM and it is unlikely
that they will achieve their 2017 targets.
System Input Volume = 697.751
Water losses = 299.796Real Losses = 238.614 Real Losses = 238.614
Non-revenue water = 327.444
Authorised consumption = 397.955
Apparent losses = 61.182 Apparent losses = 61.182
Revenue water = 370.307
Unbilled authorised = 27.648 Unbilled unmetered = 11.612
Billed authorised = 370.307
Billed unmetered = 56.817
Billed metered = 313.490
33.7% 36.1% 37.5% 39.7% 41.8% 40.3%35.6% 37.3% 38.1% 39.8% 41.0% 42.1%
30.4%25.0%
0%
10%
20%
30%
40%
50%
60%
70%
80%
90%
100%
-
100 000 000
200 000 000
300 000 000
400 000 000
500 000 000
600 000 000
Jun-05 Jun-06 Jun-07 Jun-08 Jun-09 Jun-10 Jun-11 Jun-12 Jun-13 Jun-14 Jun-15 Jun-16 Jun-17 Jun-22
% N
on-r
even
ue W
ater
Sys
tem
Inpu
t Vol
ume
(m³/
annu
m)
Billed metered Billed unmetered Non-Revenue water Projected SIV without WDM Projected SIV with WDM % Non-revenue water
53.1%
46.9% 43.0%
Targets
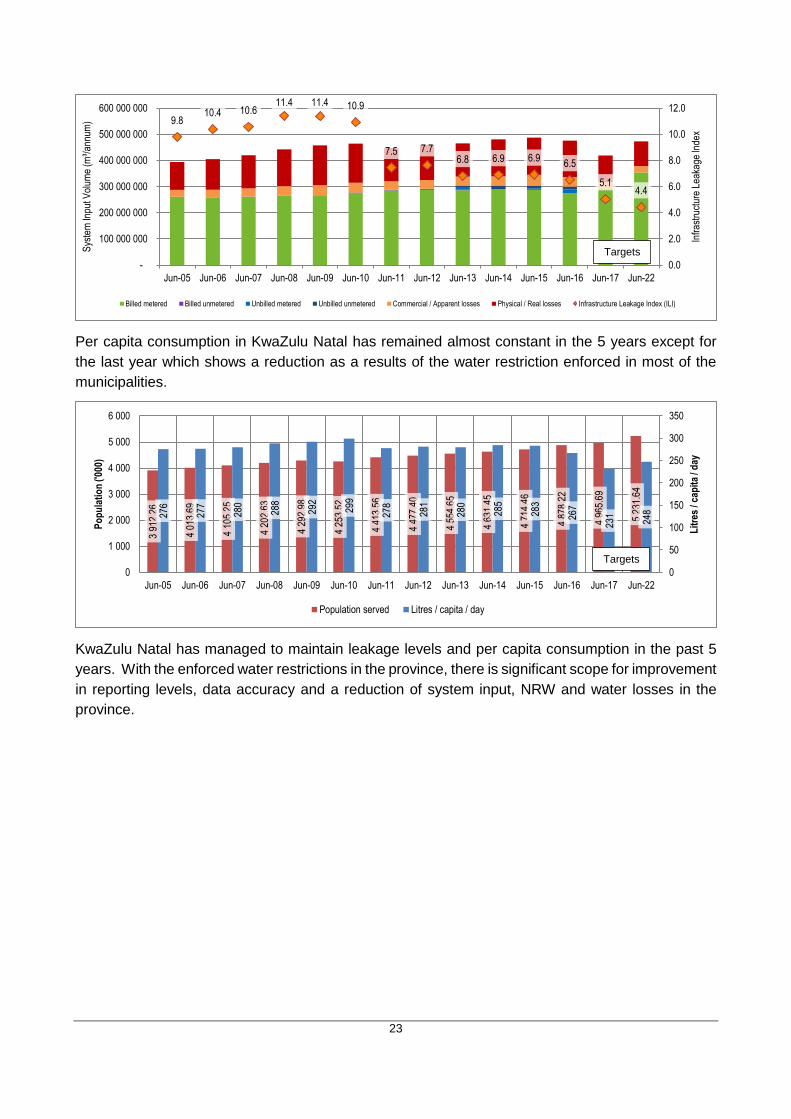
23
Per capita consumption in KwaZulu Natal has remained almost constant in the 5 years except for
the last year which shows a reduction as a results of the water restriction enforced in most of the
municipalities.
KwaZulu Natal has managed to maintain leakage levels and per capita consumption in the past 5
years. With the enforced water restrictions in the province, there is significant scope for improvement
in reporting levels, data accuracy and a reduction of system input, NRW and water losses in the
province.
9.810.4 10.6
11.4 11.4 10.9
7.5 7.76.8 6.9 6.9
6.5
5.14.4
0.0
2.0
4.0
6.0
8.0
10.0
12.0
-
100 000 000
200 000 000
300 000 000
400 000 000
500 000 000
600 000 000
Jun-05 Jun-06 Jun-07 Jun-08 Jun-09 Jun-10 Jun-11 Jun-12 Jun-13 Jun-14 Jun-15 Jun-16 Jun-17 Jun-22
Infr
astr
uctu
re L
eaka
ge In
dex
Sys
tem
Inpu
t Vol
ume
(m³/
annu
m)
Billed metered Billed unmetered Unbilled metered Unbilled unmetered Commercial / Apparent losses Physical / Real losses Infrastructure Leakage Index (ILI)
3 91
2.26
4 01
3.69
4 10
5.25
4 20
2.63
4 29
2.98
4 25
3.52
4 41
3.56
4 47
7.40
4 55
4.65
4 63
1.45
4 71
4.46
4 87
8.22
4 96
5.69
5 23
1.64
276
277
280
288
292
299
278
281
280
285
283
267
231
248
0
50
100
150
200
250
300
350
0
1 000
2 000
3 000
4 000
5 000
6 000
Jun-05 Jun-06 Jun-07 Jun-08 Jun-09 Jun-10 Jun-11 Jun-12 Jun-13 Jun-14 Jun-15 Jun-16 Jun-17 Jun-22
Lit
res
/ cap
ita
/ day
Po
pu
lati
on
('00
0)
Population served Litres / capita / day
Targets
Targets
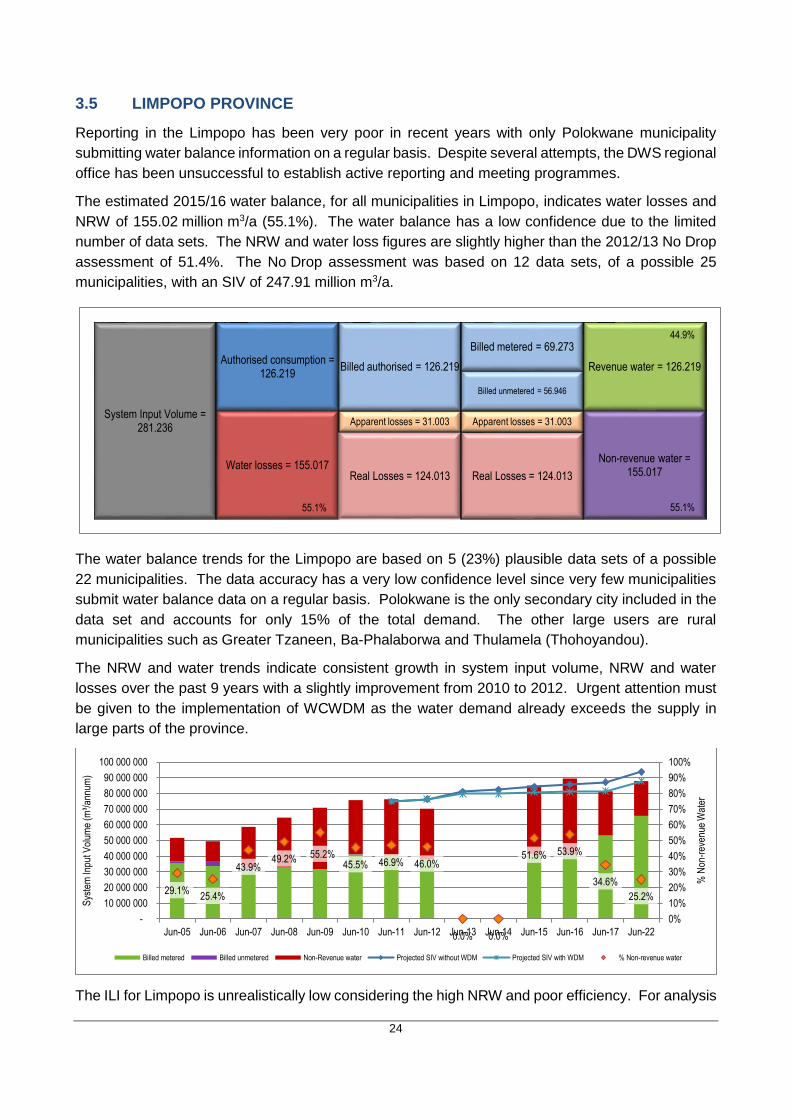
24
3.5 LIMPOPO PROVINCE
Reporting in the Limpopo has been very poor in recent years with only Polokwane municipality
submitting water balance information on a regular basis. Despite several attempts, the DWS regional
office has been unsuccessful to establish active reporting and meeting programmes.
The estimated 2015/16 water balance, for all municipalities in Limpopo, indicates water losses and
NRW of 155.02 million m3/a (55.1%). The water balance has a low confidence due to the limited
number of data sets. The NRW and water loss figures are slightly higher than the 2012/13 No Drop
assessment of 51.4%. The No Drop assessment was based on 12 data sets, of a possible 25
municipalities, with an SIV of 247.91 million m3/a.
The water balance trends for the Limpopo are based on 5 (23%) plausible data sets of a possible
22 municipalities. The data accuracy has a very low confidence level since very few municipalities
submit water balance data on a regular basis. Polokwane is the only secondary city included in the
data set and accounts for only 15% of the total demand. The other large users are rural
municipalities such as Greater Tzaneen, Ba-Phalaborwa and Thulamela (Thohoyandou).
The NRW and water trends indicate consistent growth in system input volume, NRW and water
losses over the past 9 years with a slightly improvement from 2010 to 2012. Urgent attention must
be given to the implementation of WCWDM as the water demand already exceeds the supply in
large parts of the province.
The ILI for Limpopo is unrealistically low considering the high NRW and poor efficiency. For analysis
System Input Volume = 281.236
Water losses = 155.017Real Losses = 124.013 Real Losses = 124.013
Non-revenue water = 155.017
Authorised consumption = 126.219
Apparent losses = 31.003 Apparent losses = 31.003
Revenue water = 126.219Billed authorised = 126.219
Billed unmetered = 56.946
Billed metered = 69.273
29.1%25.4%
43.9%49.2% 55.2%
45.5% 46.9% 46.0%
0.0% 0.0%
51.6% 53.9%
34.6%
25.2%
0%
10%
20%
30%
40%
50%
60%
70%
80%
90%
100%
-
10 000 000
20 000 000
30 000 000
40 000 000
50 000 000
60 000 000
70 000 000
80 000 000
90 000 000
100 000 000
Jun-05 Jun-06 Jun-07 Jun-08 Jun-09 Jun-10 Jun-11 Jun-12 Jun-13 Jun-14 Jun-15 Jun-16 Jun-17 Jun-22
% N
on-r
even
ue W
ater
Sys
tem
Inpu
t Vol
ume
(m³/
annu
m)
Billed metered Billed unmetered Non-Revenue water Projected SIV without WDM Projected SIV with WDM % Non-revenue water
44.9%
55.1% 55.1%

25
purposes, it was assumed that all systems are 100% pressurised. StatsSA Community Survey 2016,
however, indicates that Limpopo has a 40% reliability of supply, the lowest in the country. The ILI is
expected to increase with accurate number of connections, average pressure, time pressurised and
length of mains. An ILI of between 4 and 8 is expected based on international standards.
Per capita consumption for Limpopo indicates consistent growth from 2012 to 2016 and is currently
at an all-time high of 209 ℓ/c/d. The growth in per capita consumption aligns with the growth in SIV,
NRW and water losses. The growth could be an indication of deteriorating municipal structures and
the ability to meter and bill based on actual consumption.
The Limpopo province has been unable to reduce their demand in the past 9 years and water use
efficiency is at an all-time high of 209 ℓ/c/d. Leakage levels and NRW are also consistently increasing
and WCWDM must be implemented as a matter of priority. There is significant scope for
improvement in reporting levels, data accuracy and a reduction of system input volume, NRW, water
losses and efficiency.
2.11.7
3.5
4.2
5.1
2.2
1.2 1.1
0.0 0.0
1.3 1.4
0.80.6
0.0
1.0
2.0
3.0
4.0
5.0
6.0
-
10 000 000
20 000 000
30 000 000
40 000 000
50 000 000
60 000 000
70 000 000
80 000 000
90 000 000
100 000 000
Jun-05 Jun-06 Jun-07 Jun-08 Jun-09 Jun-10 Jun-11 Jun-12 Jun-13 Jun-14 Jun-15 Jun-16 Jun-17 Jun-22
Infr
astr
uctu
re L
eaka
ge In
dex
Sys
tem
Inpu
t Vol
ume
(m³/
annu
m)
Billed metered Billed unmetered Unbilled metered Unbilled unmetered Commercial / Apparent losses Physical / Real losses Infrastructure Leakage Index (ILI)
804.
35
845.
02
882.
97
920.
56
955.
29
1 02
1.73
1 07
4.55
1 08
1.67
1 09
2.78
1 10
4.11
1 12
0.59
1 17
6.02
1 19
3.71
1 27
2.88
176
161 18
2
192
203
203
194
178
0 0
208
209
187
189
0
50
100
150
200
250
0
200
400
600
800
1 000
1 200
1 400
Jun-05 Jun-06 Jun-07 Jun-08 Jun-09 Jun-10 Jun-11 Jun-12 Jun-13 Jun-14 Jun-15 Jun-16 Jun-17 Jun-22L
itre
s / c
apit
a / d
ay
Po
pu
lati
on
('00
0)
Population served Litres / capita / day
Targets
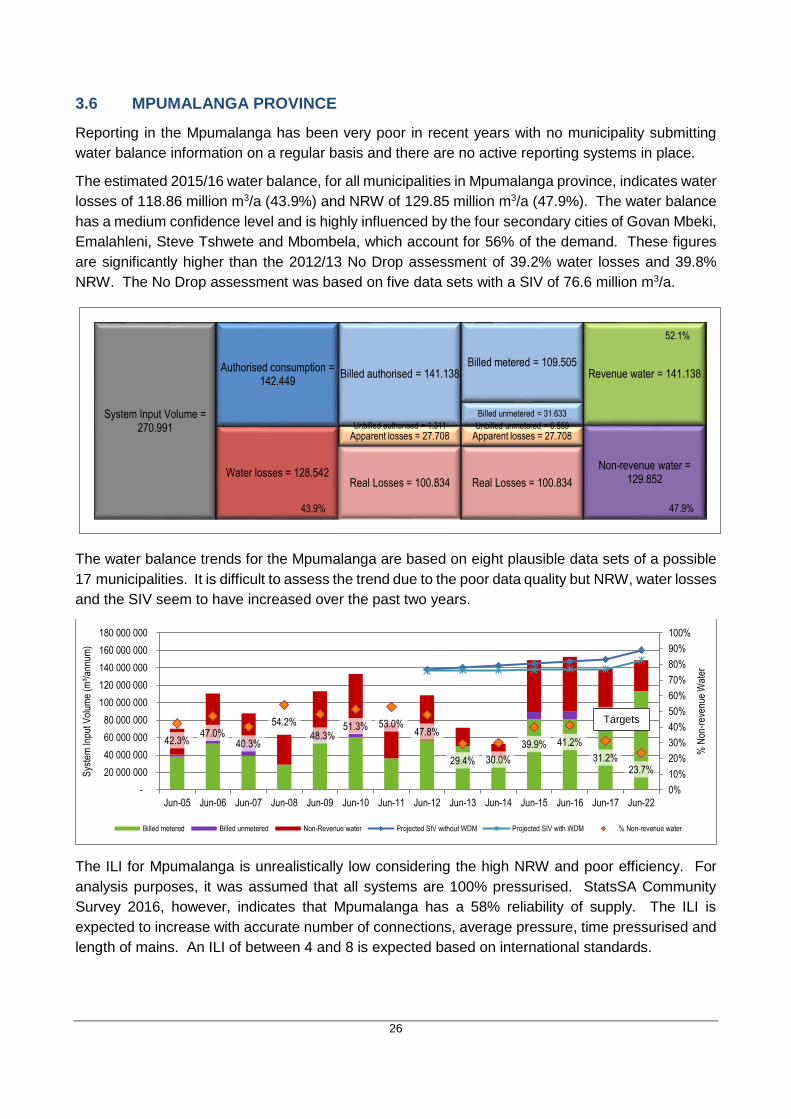
26
3.6 MPUMALANGA PROVINCE
Reporting in the Mpumalanga has been very poor in recent years with no municipality submitting
water balance information on a regular basis and there are no active reporting systems in place.
The estimated 2015/16 water balance, for all municipalities in Mpumalanga province, indicates water
losses of 118.86 million m3/a (43.9%) and NRW of 129.85 million m3/a (47.9%). The water balance
has a medium confidence level and is highly influenced by the four secondary cities of Govan Mbeki,
Emalahleni, Steve Tshwete and Mbombela, which account for 56% of the demand. These figures
are significantly higher than the 2012/13 No Drop assessment of 39.2% water losses and 39.8%
NRW. The No Drop assessment was based on five data sets with a SIV of 76.6 million m3/a.
The water balance trends for the Mpumalanga are based on eight plausible data sets of a possible
17 municipalities. It is difficult to assess the trend due to the poor data quality but NRW, water losses
and the SIV seem to have increased over the past two years.
The ILI for Mpumalanga is unrealistically low considering the high NRW and poor efficiency. For
analysis purposes, it was assumed that all systems are 100% pressurised. StatsSA Community
Survey 2016, however, indicates that Mpumalanga has a 58% reliability of supply. The ILI is
expected to increase with accurate number of connections, average pressure, time pressurised and
length of mains. An ILI of between 4 and 8 is expected based on international standards.
System Input Volume = 270.991
Water losses = 128.542Real Losses = 100.834 Real Losses = 100.834
Non-revenue water = 129.852
Authorised consumption = 142.449
Apparent losses = 27.708 Apparent losses = 27.708
Revenue water = 141.138
Unbilled authorised = 1.311 Unbilled unmetered = 0.559
Billed authorised = 141.138
Billed unmetered = 31.633
Billed metered = 109.505
42.3%47.0%
40.3%
54.2%
48.3%51.3% 53.0%
47.8%
29.4% 30.0%
39.9% 41.2%
31.2%23.7%
0%
10%
20%
30%
40%
50%
60%
70%
80%
90%
100%
-
20 000 000
40 000 000
60 000 000
80 000 000
100 000 000
120 000 000
140 000 000
160 000 000
180 000 000
Jun-05 Jun-06 Jun-07 Jun-08 Jun-09 Jun-10 Jun-11 Jun-12 Jun-13 Jun-14 Jun-15 Jun-16 Jun-17 Jun-22
% N
on-r
even
ue W
ater
Sys
tem
Inpu
t Vol
ume
(m³/
annu
m)
Billed metered Billed unmetered Non-Revenue water Projected SIV without WDM Projected SIV with WDM % Non-revenue water
52.1%
47.9% 43.9%
Targets
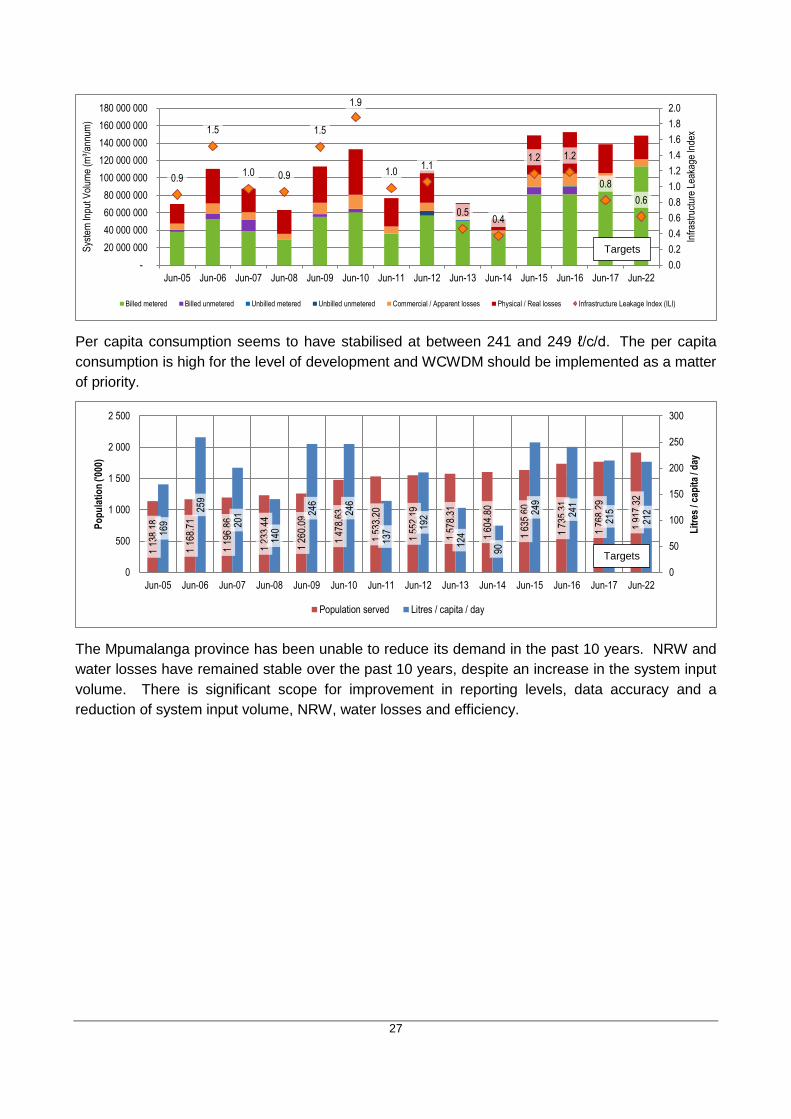
27
Per capita consumption seems to have stabilised at between 241 and 249 ℓ/c/d. The per capita
consumption is high for the level of development and WCWDM should be implemented as a matter
of priority.
The Mpumalanga province has been unable to reduce its demand in the past 10 years. NRW and
water losses have remained stable over the past 10 years, despite an increase in the system input
volume. There is significant scope for improvement in reporting levels, data accuracy and a
reduction of system input volume, NRW, water losses and efficiency.
0.9
1.5
1.0 0.9
1.5
1.9
1.01.1
0.50.4
1.2 1.2
0.8
0.6
0.0
0.2
0.4
0.6
0.8
1.0
1.2
1.4
1.6
1.8
2.0
-
20 000 000
40 000 000
60 000 000
80 000 000
100 000 000
120 000 000
140 000 000
160 000 000
180 000 000
Jun-05 Jun-06 Jun-07 Jun-08 Jun-09 Jun-10 Jun-11 Jun-12 Jun-13 Jun-14 Jun-15 Jun-16 Jun-17 Jun-22
Infr
astr
uctu
re L
eaka
ge In
dex
Sys
tem
Inpu
t Vol
ume
(m³/
annu
m)
Billed metered Billed unmetered Unbilled metered Unbilled unmetered Commercial / Apparent losses Physical / Real losses Infrastructure Leakage Index (ILI)
1 13
8.18
1 16
8.71
1 19
6.86
1 23
3.44
1 26
0.09
1 47
8.63
1 53
3.20
1 55
2.19
1 57
8.31
1 60
4.80
1 63
5.60
1 73
5.31
1 76
8.29
1 91
7.32
169
259
201
140
246
246
137 19
2
124
90
249
241
215
212
0
50
100
150
200
250
300
0
500
1 000
1 500
2 000
2 500
Jun-05 Jun-06 Jun-07 Jun-08 Jun-09 Jun-10 Jun-11 Jun-12 Jun-13 Jun-14 Jun-15 Jun-16 Jun-17 Jun-22
Lit
res
/ cap
ita
/ day
Po
pu
lati
on
('00
0)
Population served Litres / capita / day
Targets
Targets
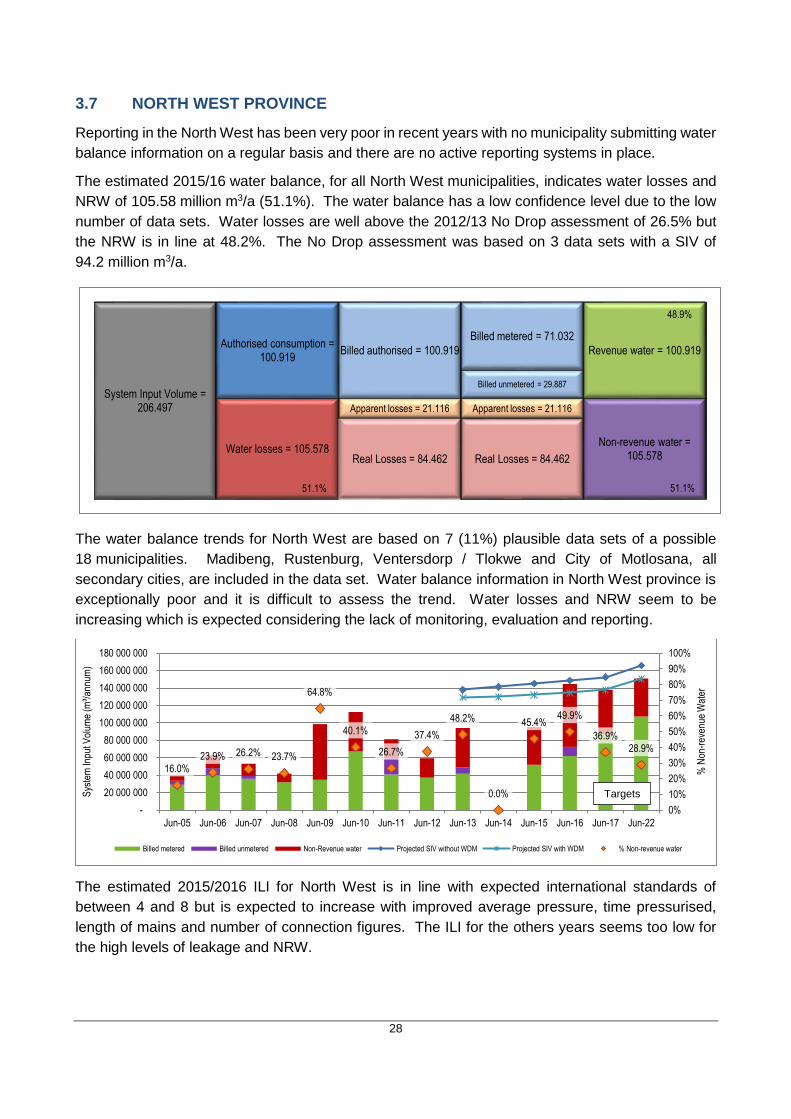
28
3.7 NORTH WEST PROVINCE
Reporting in the North West has been very poor in recent years with no municipality submitting water
balance information on a regular basis and there are no active reporting systems in place.
The estimated 2015/16 water balance, for all North West municipalities, indicates water losses and
NRW of 105.58 million m3/a (51.1%). The water balance has a low confidence level due to the low
number of data sets. Water losses are well above the 2012/13 No Drop assessment of 26.5% but
the NRW is in line at 48.2%. The No Drop assessment was based on 3 data sets with a SIV of
94.2 million m3/a.
The water balance trends for North West are based on 7 (11%) plausible data sets of a possible
18 municipalities. Madibeng, Rustenburg, Ventersdorp / Tlokwe and City of Motlosana, all
secondary cities, are included in the data set. Water balance information in North West province is
exceptionally poor and it is difficult to assess the trend. Water losses and NRW seem to be
increasing which is expected considering the lack of monitoring, evaluation and reporting.
The estimated 2015/2016 ILI for North West is in line with expected international standards of
between 4 and 8 but is expected to increase with improved average pressure, time pressurised,
length of mains and number of connection figures. The ILI for the others years seems too low for
the high levels of leakage and NRW.
System Input Volume = 206.497
Water losses = 105.578Real Losses = 84.462 Real Losses = 84.462
Non-revenue water = 105.578
Authorised consumption = 100.919
Apparent losses = 21.116 Apparent losses = 21.116
Revenue water = 100.919Billed authorised = 100.919
Billed unmetered = 29.887
Billed metered = 71.032
16.0%23.9% 26.2% 23.7%
64.8%
40.1%
26.7%
37.4%
48.2%
0.0%
45.4%49.9%
36.9%28.9%
0%
10%
20%
30%
40%
50%
60%
70%
80%
90%
100%
-
20 000 000
40 000 000
60 000 000
80 000 000
100 000 000
120 000 000
140 000 000
160 000 000
180 000 000
Jun-05 Jun-06 Jun-07 Jun-08 Jun-09 Jun-10 Jun-11 Jun-12 Jun-13 Jun-14 Jun-15 Jun-16 Jun-17 Jun-22
% N
on-r
even
ue W
ater
Sys
tem
Inpu
t Vol
ume
(m³/
annu
m)
Billed metered Billed unmetered Non-Revenue water Projected SIV without WDM Projected SIV with WDM % Non-revenue water
48.9%
51.1% 51.1%
Targets

29
Per capita consumption has been increasing consistently in the North West. The current per capita
consumption of 204 ℓ/c/d is in line with the level of development and considered the most realistic
estimate. The per capita consumption for most other years seems unrealistically low.
The North West province has been unable to submit plausible data sets in the past 9 years, and it is
difficult to assess the NRW, water loss and demand trends. WCWDM must be implemented as a
matter of priority. There is significant scope for improvement in reporting levels, data accuracy and
a reduction of system input volume, NRW, water losses and efficiency.
0.8
1.7 1.51.0
6.1
4.3
1.7 1.72.0
0.0
2.7
4.5
3.1
2.4
0.0
1.0
2.0
3.0
4.0
5.0
6.0
7.0
-
20 000 000
40 000 000
60 000 000
80 000 000
100 000 000
120 000 000
140 000 000
160 000 000
Jun-05 Jun-06 Jun-07 Jun-08 Jun-09 Jun-10 Jun-11 Jun-12 Jun-13 Jun-14 Jun-15 Jun-16 Jun-17 Jun-22
Infr
astr
uct
ure
Lea
kage
Ind
ex
Syst
em In
pu
t V
olu
me
(m³/
ann
um
)
Billed metered Billed unmetered Unbilled metered Unbilled unmetered Commercial / Apparent losses Physical / Real losses Infrastructure Leakage Index (ILI)
1 37
9 22
3
1 43
0 55
7
1 47
3 85
2
1 51
2 33
0
1 55
1 53
9
1 72
8 76
7
1 80
3 00
5
1 81
8 33
2
1 83
9 43
3
1 86
0 38
1
1 88
9 26
3
1 94
1 38
1
1 97
9 63
2
2 18
4 95
1
80
121
99
76
174
178
123
89
140
0
138
204
191
189
0
50
100
150
200
250
0
500 000
1 000 000
1 500 000
2 000 000
2 500 000
Jun-05 Jun-06 Jun-07 Jun-08 Jun-09 Jun-10 Jun-11 Jun-12 Jun-13 Jun-14 Jun-15 Jun-16 Jun-17 Jun-22
Lit
res
/ cap
ita
/ day
Po
pu
lati
on
Population served Litres / capita / day
Targets
Targets
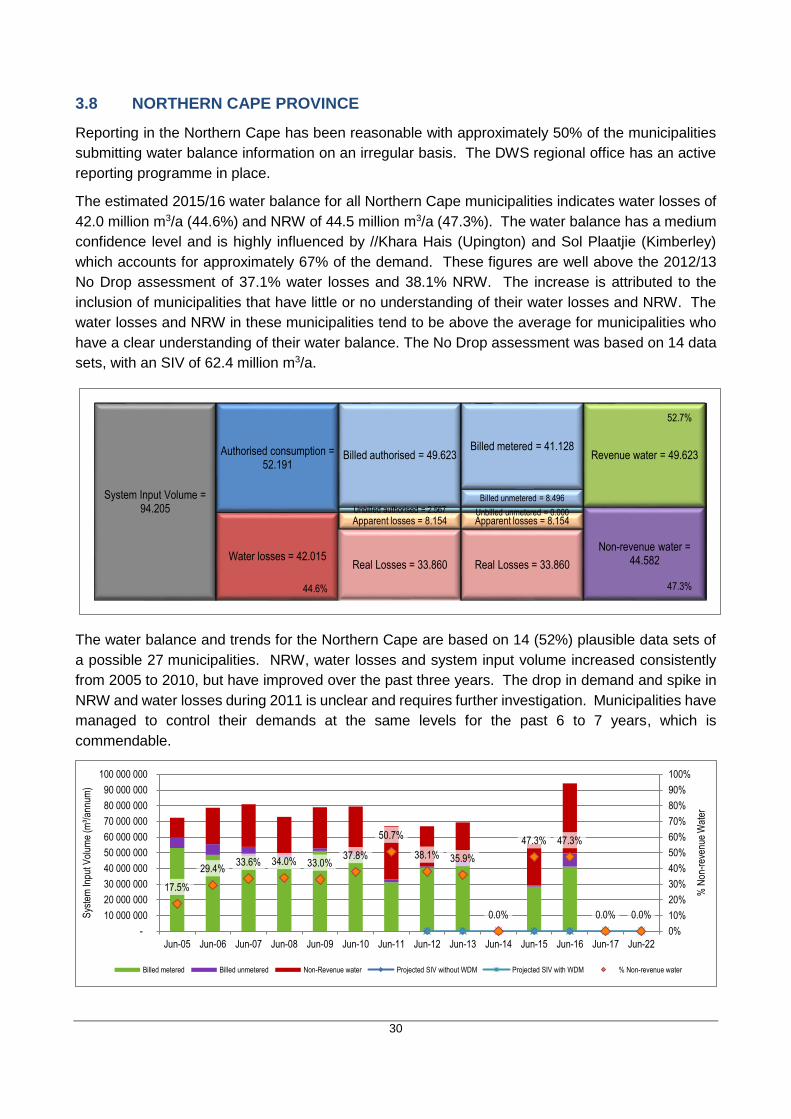
30
3.8 NORTHERN CAPE PROVINCE
Reporting in the Northern Cape has been reasonable with approximately 50% of the municipalities
submitting water balance information on an irregular basis. The DWS regional office has an active
reporting programme in place.
The estimated 2015/16 water balance for all Northern Cape municipalities indicates water losses of
42.0 million m3/a (44.6%) and NRW of 44.5 million m3/a (47.3%). The water balance has a medium
confidence level and is highly influenced by //Khara Hais (Upington) and Sol Plaatjie (Kimberley)
which accounts for approximately 67% of the demand. These figures are well above the 2012/13
No Drop assessment of 37.1% water losses and 38.1% NRW. The increase is attributed to the
inclusion of municipalities that have little or no understanding of their water losses and NRW. The
water losses and NRW in these municipalities tend to be above the average for municipalities who
have a clear understanding of their water balance. The No Drop assessment was based on 14 data
sets, with an SIV of 62.4 million m3/a.
The water balance and trends for the Northern Cape are based on 14 (52%) plausible data sets of
a possible 27 municipalities. NRW, water losses and system input volume increased consistently
from 2005 to 2010, but have improved over the past three years. The drop in demand and spike in
NRW and water losses during 2011 is unclear and requires further investigation. Municipalities have
managed to control their demands at the same levels for the past 6 to 7 years, which is
commendable.
System Input Volume = 94.205
Water losses = 42.015Real Losses = 33.860 Real Losses = 33.860
Non-revenue water = 44.582
Authorised consumption = 52.191
Apparent losses = 8.154 Apparent losses = 8.154
Revenue water = 49.623
Unbilled authorised = 2.567 Unbilled unmetered = 0.000
Billed authorised = 49.623
Billed unmetered = 8.496
Billed metered = 41.128
17.5%
29.4%33.6% 34.0% 33.0%
37.8%
50.7%
38.1% 35.9%
0.0%
47.3% 47.3%
0.0% 0.0%
0%
10%
20%
30%
40%
50%
60%
70%
80%
90%
100%
-
10 000 000
20 000 000
30 000 000
40 000 000
50 000 000
60 000 000
70 000 000
80 000 000
90 000 000
100 000 000
Jun-05 Jun-06 Jun-07 Jun-08 Jun-09 Jun-10 Jun-11 Jun-12 Jun-13 Jun-14 Jun-15 Jun-16 Jun-17 Jun-22
% N
on-r
even
ue W
ater
Sys
tem
Inpu
t Vol
ume
(m³/
annu
m)
Billed metered Billed unmetered Non-Revenue water Projected SIV without WDM Projected SIV with WDM % Non-revenue water
52.7%
47.3% 44.6%

31
The estimated 2015/2016 ILI for Northern Cape is in line with expected international standards of
between 4 and 8.
Per capita consumption reduced from 2009 to 2013, which is commendable and could be an
indication of the WCWDM interventions taking effect in the province.
Northern Cape has managed to maintain their system input, NRW and per capita consumption in
the past 5 to 6 years. Increased efforts are required by municipalities to implement WCWDM to
ensure targets are achieved and water restrictions are mitigated in the driest province. There is
significant scope for improvement in reporting levels, data accuracy and a reduction of system input,
NRW and water losses in the province.
10.3
12.5
6.0
11.510.7
4.23.4 3.6
0.0
4.4
7.1
0.0 0.0
0.0
2.0
4.0
6.0
8.0
10.0
12.0
14.0
-
10 000 000
20 000 000
30 000 000
40 000 000
50 000 000
60 000 000
70 000 000
80 000 000
90 000 000
100 000 000
Jun-06 Jun-07 Jun-08 Jun-09 Jun-10 Jun-11 Jun-12 Jun-13 Jun-14 Jun-15 Jun-16 Jun-17 Jun-22
Infr
astr
uctu
re L
eaka
ge In
dex
Sys
tem
Inpu
t Vol
ume
(m³/
annu
m)
Billed metered Billed unmetered Unbilled metered Unbilled unmetered Commercial / Apparent losses Physical / Real losses Infrastructure Leakage Index (ILI)
824
858
844
319
862
651
885
217
903
173
1 00
8 01
0
1 04
2 22
5
1 04
8 42
9
1 05
7 08
2
1 06
5 91
1
1 07
7 47
6
1 08
5 94
4
1 09
7 79
9
1 12
3 43
8
240
255
257
226
240
216
176
175
180
0
127 18
2
0 0
0
50
100
150
200
250
300
0
200 000
400 000
600 000
800 000
1 000 000
1 200 000
Jun-05 Jun-06 Jun-07 Jun-08 Jun-09 Jun-10 Jun-11 Jun-12 Jun-13 Jun-14 Jun-15 Jun-16 Jun-17 Jun-22
Lit
res
/ cap
ita
/ day
Po
pu
lati
on
Population served Litres / capita / day
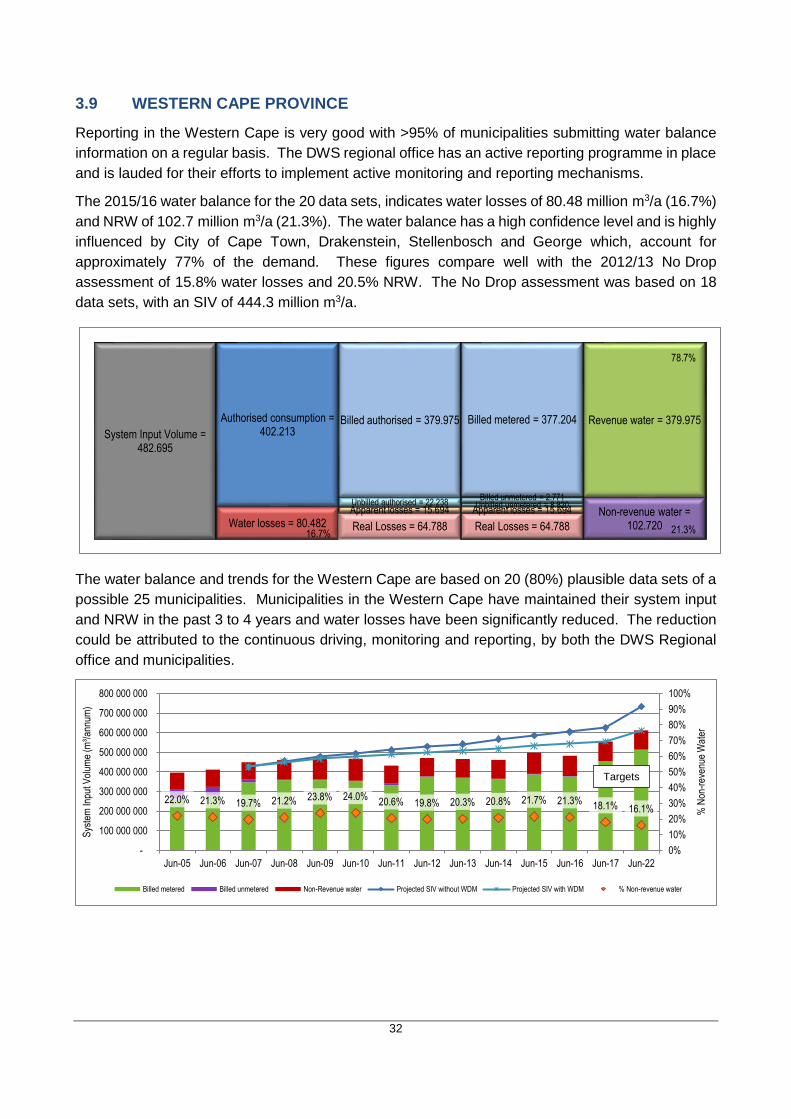
32
3.9 WESTERN CAPE PROVINCE
Reporting in the Western Cape is very good with >95% of municipalities submitting water balance
information on a regular basis. The DWS regional office has an active reporting programme in place
and is lauded for their efforts to implement active monitoring and reporting mechanisms.
The 2015/16 water balance for the 20 data sets, indicates water losses of 80.48 million m3/a (16.7%)
and NRW of 102.7 million m3/a (21.3%). The water balance has a high confidence level and is highly
influenced by City of Cape Town, Drakenstein, Stellenbosch and George which, account for
approximately 77% of the demand. These figures compare well with the 2012/13 No Drop
assessment of 15.8% water losses and 20.5% NRW. The No Drop assessment was based on 18
data sets, with an SIV of 444.3 million m3/a.
The water balance and trends for the Western Cape are based on 20 (80%) plausible data sets of a
possible 25 municipalities. Municipalities in the Western Cape have maintained their system input
and NRW in the past 3 to 4 years and water losses have been significantly reduced. The reduction
could be attributed to the continuous driving, monitoring and reporting, by both the DWS Regional
office and municipalities.
System Input Volume = 482.695
Water losses = 80.482 Real Losses = 64.788 Real Losses = 64.788
Non-revenue water = 102.720
Authorised consumption = 402.213
Apparent losses = 15.694 Apparent losses = 15.694
Revenue water = 379.975
Unbilled authorised = 22.238 Unbilled unmetered = 8.820
Billed authorised = 379.975
Billed unmetered = 2.771
Billed metered = 377.204
22.0% 21.3% 19.7% 21.2% 23.8% 24.0%20.6% 19.8% 20.3% 20.8% 21.7% 21.3%
18.1% 16.1%
0%
10%
20%
30%
40%
50%
60%
70%
80%
90%
100%
-
100 000 000
200 000 000
300 000 000
400 000 000
500 000 000
600 000 000
700 000 000
800 000 000
Jun-05 Jun-06 Jun-07 Jun-08 Jun-09 Jun-10 Jun-11 Jun-12 Jun-13 Jun-14 Jun-15 Jun-16 Jun-17 Jun-22
% N
on-r
even
ue W
ater
Sys
tem
Inpu
t Vol
ume
(m³/
annu
m)
Billed metered Billed unmetered Non-Revenue water Projected SIV without WDM Projected SIV with WDM % Non-revenue water
78.7%
21.3% 16.7%
Targets
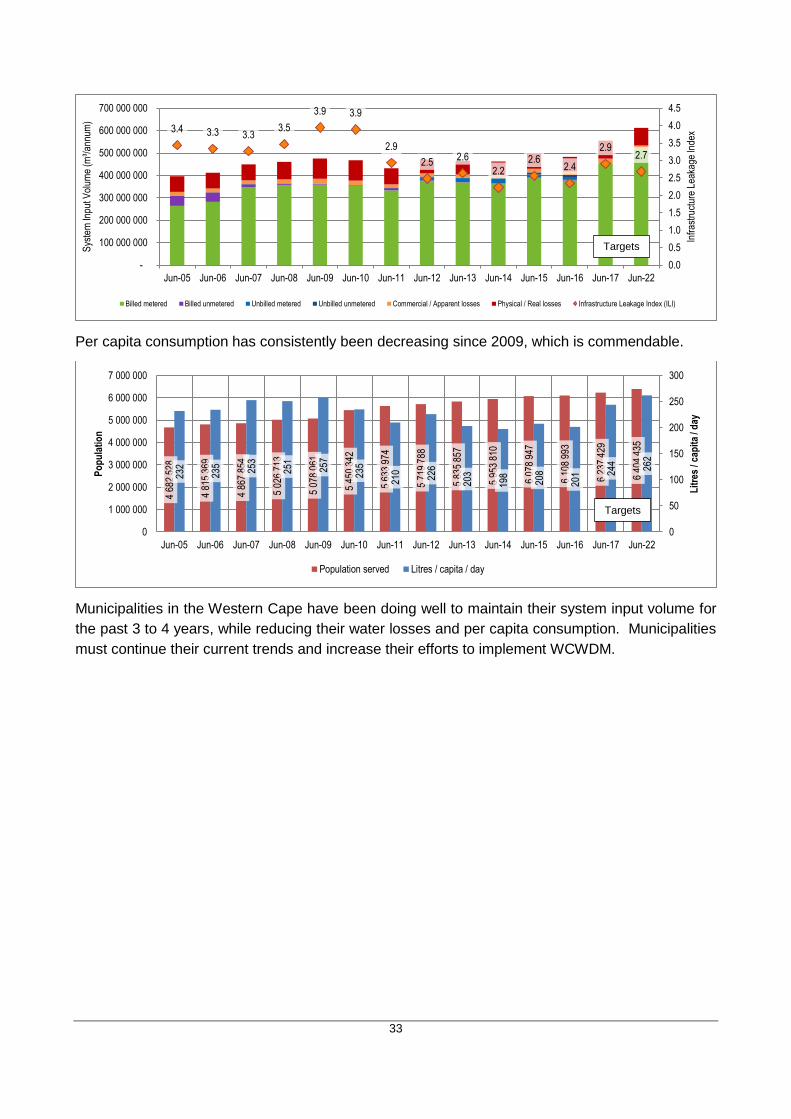
33
Per capita consumption has consistently been decreasing since 2009, which is commendable.
Municipalities in the Western Cape have been doing well to maintain their system input volume for
the past 3 to 4 years, while reducing their water losses and per capita consumption. Municipalities
must continue their current trends and increase their efforts to implement WCWDM.
3.4 3.3 3.33.5
3.9 3.9
2.9
2.52.6
2.22.6
2.4
2.92.7
0.0
0.5
1.0
1.5
2.0
2.5
3.0
3.5
4.0
4.5
-
100 000 000
200 000 000
300 000 000
400 000 000
500 000 000
600 000 000
700 000 000
Jun-05 Jun-06 Jun-07 Jun-08 Jun-09 Jun-10 Jun-11 Jun-12 Jun-13 Jun-14 Jun-15 Jun-16 Jun-17 Jun-22
Infr
astr
uctu
re L
eaka
ge In
dex
Sys
tem
Inpu
t Vol
ume
(m³/
annu
m)
Billed metered Billed unmetered Unbilled metered Unbilled unmetered Commercial / Apparent losses Physical / Real losses Infrastructure Leakage Index (ILI)
4 68
2 52
8
4 81
5 36
9
4 86
7 85
4
5 02
6 71
3
5 07
8 06
1
5 45
0 34
2
5 63
3 97
4
5 71
9 78
8
5 83
5 85
7
5 95
3 81
0
6 07
8 94
7
6 10
8 99
3
6 23
7 42
9
6 40
4 43
5
232
235
253
251
257
235
210
226
203
198
208
201 24
4
262
0
50
100
150
200
250
300
0
1 000 000
2 000 000
3 000 000
4 000 000
5 000 000
6 000 000
7 000 000
Jun-05 Jun-06 Jun-07 Jun-08 Jun-09 Jun-10 Jun-11 Jun-12 Jun-13 Jun-14 Jun-15 Jun-16 Jun-17 Jun-22
Lit
res
/ cap
ita
/ day
Po
pu
lati
on
Population served Litres / capita / day
Targets
Targets

34
3.10 NATIONAL WATER BALANCE TRENDS
The estimated 2015/16 water balance, for all municipalities, indicate water losses of
1462.01 million m3/a (36.1%) and NRW of 1659.59 million m3/a (41.0%). These figures are higher
than the 2012/13 No Drop assessment of 27.6% water losses and 34.6% NRW. The No Drop
assessment was based on 71 data sets, with an SIV of 2 997.6 million m3/a. The increased water
losses and NRW are attributed to the improved estimate of water losses and NRW in category B3
and B4 municipalities.
The estimated national water balance for 2015 /16, broken down per province, is summarised in the
table below. The highest and lowest figure for each key performance indicator are highlighted in red
and green respectively.
Province Population SIV (m3/annum) NRW (m3/annum) % NRW % WL l/c/d ILI
EC 4 477 918 332 151 376 158 647 165 47.8% 45.0% 200 4.8
FS 2 723 028 207 835 805 106 908 574 51.4% 46.6% 209 4.8
GT 12 978 281 1 473 100 700 528 839 540 35.9% 27.4% 305 5.8
LIM 4 225 967 281 235 907 155 016 679 55.1% 55.1% 182 1.3
KZN 8 491 508 697 751 184 327 444 107 46.9% 43.0% 225 6.2
NW 3 039 995 206 496 825 105 577 898 51.1% 51.1% 186 4.7
NC 1 085 944 94 205 305 44 582 022 47.3% 44.6% 238 7.0
WC 6 108 993 482 695 411 102 720 237 21.3% 16.7% 201 2.4
MP 3 622 506 270 990 713 129 852 490 47.9% 43.9% 205 4.3
National 46 754 140 4 046 463 225 1 659 588 711 41.0% 36.1% 233 5.3
Gauteng is the largest water user in the country, and with KwaZulu-Natal and Western Cape, account
for 66% of the total demand. Gauteng and KwaZulu-Natal account for 52% of the NRW by volume.
Limpopo has the highest percentage NRW and water losses but these figures are contradicted by a
low l/c/d and ILI. This needs further investigation. Western Cape is the overall best performing
province. Gauteng has the highest per capita consumption due to the high number of wet industries
in the supply area.
To obtain an understanding of the water loss trends in the country, the water balance information for
107 municipalities, which submit information on a regular basis, was analysed as indicated in the
figures below. The system input volume for the 107 systems has been consistently increasing since
System Input Volume = 4046.463
Water losses = 1462.011Real Losses = 1157.747 Real Losses = 1157.747
Non-revenue water = 1659.589
Authorised consumption = 2584.452
Apparent losses = 304.264 Apparent losses = 304.264
Revenue water = 2386.875
Unbilled authorised = 197.578 Unbilled unmetered = 144.304
Billed authorised = 2386.875
Billed unmetered = 412.301
Billed metered = 1974.574
59.0%
41.0% 36.1%

35
2006 and NRW has been increasing since 2013. Water losses seemed to improve until 2014 but
have subsequently deteriorated again to 2012 levels. Municipal demands have been tracking the
projected water demand without WCWDM and they are unlikely to achieve their 2017 targets.
NRW has increased in the past two years but is influenced, in some areas, by the imposed water
restrictions. NRW tends to increase as the SIV reduces. More municipalities are also indicating
some of their water losses as unbilled unmetered consumption. This shift emphasises the extent of
leakage on private properties and the need for metering and billing systems, mechanisms to control
consumer demand, the War-on-Leaks programme and consumer education and awareness.
As shown in the figure below, per capita consumption has remained constant over the past 5 years,
which is commendable, but WCWDM efforts must be elevated considering these figures are
significantly above international benchmarks of approximately 180 ℓ/c/d and the country is one of the
30 driest in the world. The per capita consumption is also significantly higher compared to the
previous study, The State of non-revenue water in South Africa (WRC, 2012) which was estimated
at 235 ℓ/c/d.
25.6% 28.4% 29.5%34.2% 36.8% 36.6% 35.7% 34.3% 33.6% 34.9% 36.0% 36.7% 36.2% 36.7%
0%
10%
20%
30%
40%
50%
60%
70%
80%
90%
100%
-
500 000 000
1 000 000 000
1 500 000 000
2 000 000 000
2 500 000 000
3 000 000 000
3 500 000 000
Jun-05 Jun-06 Jun-07 Jun-08 Jun-09 Jun-10 Jun-11 Jun-12 Jun-13 Jun-14 Jun-15 Jun-16 Jun-17 Jun-22
% N
on-r
even
ue W
ater
Sys
tem
Inpu
t Vol
ume
(m³/
annu
m)
Billed metered Billed unmetered Non-Revenue water Projected SIV without WDM Projected SIV with WDM % Non-revenue water
5.25.8 5.9
6.7
7.36.9
6.0
5.2
4.3 4.2
5.55.2 5.4 5.2
0.0
1.0
2.0
3.0
4.0
5.0
6.0
7.0
8.0
-
500 000 000
1 000 000 000
1 500 000 000
2 000 000 000
2 500 000 000
3 000 000 000
3 500 000 000
Jun-05 Jun-06 Jun-07 Jun-08 Jun-09 Jun-10 Jun-11 Jun-12 Jun-13 Jun-14 Jun-15 Jun-16 Jun-17 Jun-22
Infr
astr
uctu
re L
eaka
ge In
dex
Sys
tem
Inpu
t Vol
ume
(m³/
annu
m)
Billed metered Billed unmetered Unbilled metered Unbilled unmetered Commercial / Apparent losses Physical / Real losses Infrastructure Leakage Index (ILI)
Targets
Targets
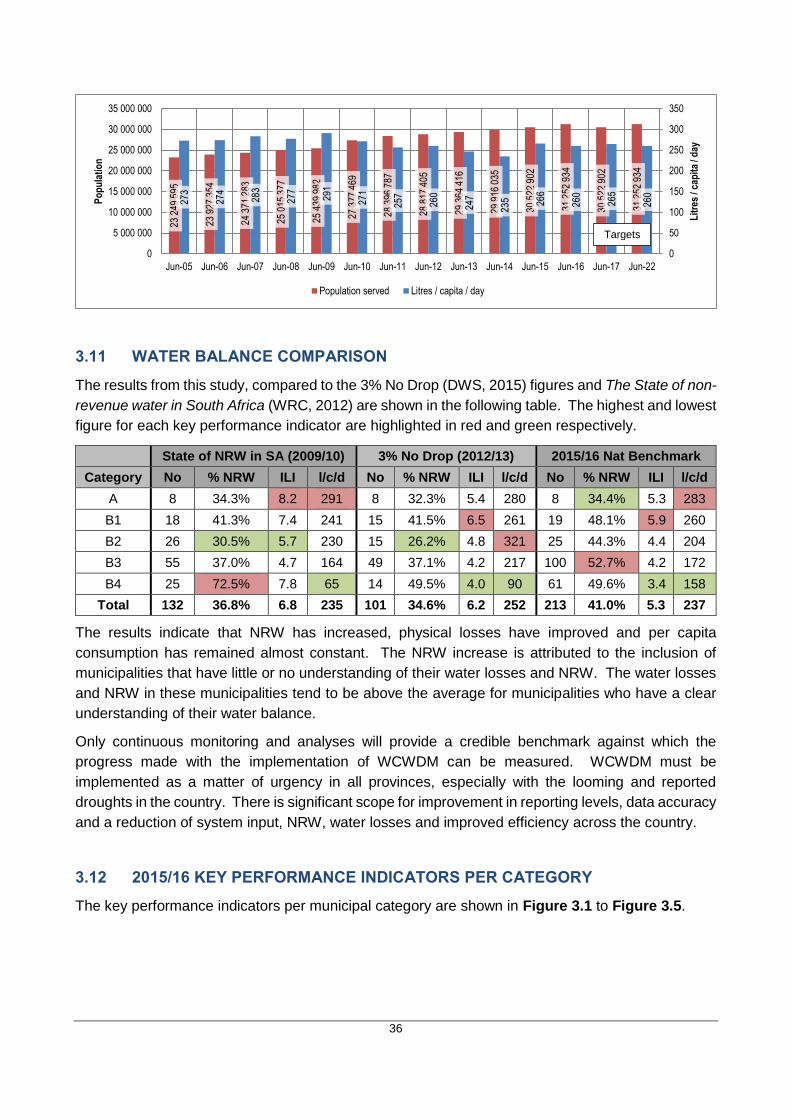
36
3.11 WATER BALANCE COMPARISON
The results from this study, compared to the 3% No Drop (DWS, 2015) figures and The State of non-
revenue water in South Africa (WRC, 2012) are shown in the following table. The highest and lowest
figure for each key performance indicator are highlighted in red and green respectively.
State of NRW in SA (2009/10) 3% No Drop (2012/13) 2015/16 Nat Benchmark
Category No % NRW ILI l/c/d No % NRW ILI l/c/d No % NRW ILI l/c/d
A 8 34.3% 8.2 291 8 32.3% 5.4 280 8 34.4% 5.3 283
B1 18 41.3% 7.4 241 15 41.5% 6.5 261 19 48.1% 5.9 260
B2 26 30.5% 5.7 230 15 26.2% 4.8 321 25 44.3% 4.4 204
B3 55 37.0% 4.7 164 49 37.1% 4.2 217 100 52.7% 4.2 172
B4 25 72.5% 7.8 65 14 49.5% 4.0 90 61 49.6% 3.4 158
Total 132 36.8% 6.8 235 101 34.6% 6.2 252 213 41.0% 5.3 237
The results indicate that NRW has increased, physical losses have improved and per capita
consumption has remained almost constant. The NRW increase is attributed to the inclusion of
municipalities that have little or no understanding of their water losses and NRW. The water losses
and NRW in these municipalities tend to be above the average for municipalities who have a clear
understanding of their water balance.
Only continuous monitoring and analyses will provide a credible benchmark against which the
progress made with the implementation of WCWDM can be measured. WCWDM must be
implemented as a matter of urgency in all provinces, especially with the looming and reported
droughts in the country. There is significant scope for improvement in reporting levels, data accuracy
and a reduction of system input, NRW, water losses and improved efficiency across the country.
3.12 2015/16 KEY PERFORMANCE INDICATORS PER CATEGORY
The key performance indicators per municipal category are shown in Figure 3.1 to Figure 3.5.
23 2
49 5
95
23 9
27 3
54
24 3
71 2
83
25 0
15 3
77
25 4
39 9
82
27 3
77 4
69
28 3
96 7
87
28 8
17 4
05
29 3
64 4
16
29 9
16 0
35
30 5
22 9
02
31 2
52 9
34
30 5
22 9
02
31 2
52 9
34
273
274
283
277
291
271
257
260
247
235 26
6
260
265
260
0
50
100
150
200
250
300
350
0
5 000 000
10 000 000
15 000 000
20 000 000
25 000 000
30 000 000
35 000 000
Jun-05 Jun-06 Jun-07 Jun-08 Jun-09 Jun-10 Jun-11 Jun-12 Jun-13 Jun-14 Jun-15 Jun-16 Jun-17 Jun-22
Lit
res
/ cap
ita
/ day
Po
pu
lati
on
Population served Litres / capita / day
Targets

37
Figure 3.1: 2015/16 estimated system input volume
The average SIV per municipality is 18.7 million m3/a. This figure is highly influenced by the category A and B1 municipalities, which account for
73% of the total SIV. The total estimated SIV for the country is 4020.27 million m3/a.
100 000
1 000 000
10 000 000
100 000 000
1 000 000 000
Buf
falo
City
eThe
kwin
i
Eku
rhul
eni
Ste
llenb
osch
Ste
ve T
shw
ete
New
cast
le
Sol
Pla
atjie
City
of u
Mhl
athu
ze
Mbo
mbe
la
Vul
ameh
lo
Gre
ater
Kok
stad
uMdo
ni
Mos
sel B
ay
Msu
kalig
wa
Daw
id K
ruip
er
Sal
danh
a B
ay
Bre
ede
Val
ley
Kin
g S
abat
a D
alin
dyeb
o
Kar
eebe
rg
Lain
gsbu
rg
Ubu
ntu
!Khe
is
Mag
aren
g
Tok
olog
o
Kou
-kam
ma
Mam
usa
Dik
gatlo
ng
Tsw
elop
ele
Dip
ales
eng
End
umen
i
Cap
e A
gulh
as
Man
tsop
a
Kop
anon
g
Maf
ube
Nke
toan
a
Sun
day'
s R
iver
Val
ley
Um
voti
Vic
tor
Kha
nye
Maq
uass
i Hill
s
eDum
be
Ndl
ambe
Am
ahla
thi
uMuz
iwab
antu
The
ewat
ersk
loof
Tsw
aing
Tha
ba C
hweu
Lese
di
Lekw
a
Ray
mon
d M
hlab
a
Ram
otsh
ere
Moi
loa
Aba
qulu
si
Ba-
Pha
labo
rwa
Nka
ndla
Nta
bank
ulu
Ndw
edw
e
Mfo
lozi
Eng
cobo
Um
hlab
uyal
inga
na
Em
alah
leni
uMsh
wat
hi
Um
lala
zi
Mol
emol
e
Um
zim
vubu
Aga
nang
Nya
nden
i
Gre
ater
Tau
ng
Mnq
uma
Man
deni
Elia
s M
otso
aled
i
Mos
es K
otan
e
Bus
hbuc
krid
ge
Syst
em In
pu
t V
ou
me
(m3 /
ann
um
)
Jun-16 Category average National average
B1 = 37.6 million m3/a
A= 275.4 million m3/a
B2 = 10.7 million m3/a B3 = 4.21 million m3/a B4 = 6.79 million m3/a
Average = 18.65 million m3/a

38
Figure 3.2: Volume non-revenue water
The average volume NRW per municipality is 7.65 million m3/a. This figure is highly influenced by the category A and B1 municipalities, which
account for 66% of the total NRW. The potential for savings are the greatest in these municipalities. The total estimated NRW for the country is
1 632.93 million m3/a.
100 000
1 000 000
10 000 000
100 000 000
1 000 000 000
Buf
falo
City
eThe
kwin
i
Eku
rhul
eni
Ste
llenb
osch
Ste
ve T
shw
ete
New
cast
le
Sol
Pla
atjie
City
of u
Mhl
athu
ze
Mbo
mbe
la
Vul
ameh
lo
Gre
ater
Kok
stad
uMdo
ni
Mos
sel B
ay
Msu
kalig
wa
Daw
id K
ruip
er
Sal
danh
a B
ay
Bre
ede
Val
ley
Kin
g S
abat
a D
alin
dyeb
o
Kar
eebe
rg
Lain
gsbu
rg
Ubu
ntu
!Khe
is
Mag
aren
g
Tok
olog
o
Kou
-kam
ma
Mam
usa
Dik
gatlo
ng
Tsw
elop
ele
Dip
ales
eng
End
umen
i
Cap
e A
gulh
as
Man
tsop
a
Kop
anon
g
Maf
ube
Nke
toan
a
Sun
day'
s R
iver
Val
ley
Um
voti
Vic
tor
Kha
nye
Maq
uass
i Hill
s
eDum
be
Ndl
ambe
Am
ahla
thi
uMuz
iwab
antu
The
ewat
ersk
loof
Tsw
aing
Tha
ba C
hweu
Lese
di
Lekw
a
Ray
mon
d M
hlab
a
Ram
otsh
ere
Moi
loa
Aba
qulu
si
Ba-
Pha
labo
rwa
Nka
ndla
Nta
bank
ulu
Ndw
edw
e
Mfo
lozi
Eng
cobo
Um
hlab
uyal
inga
na
Em
alah
leni
uMsh
wat
hi
Um
lala
zi
Mol
emol
e
Um
zim
vubu
Aga
nang
Nya
nden
i
Gre
ater
Tau
ng
Mnq
uma
Man
deni
Elia
s M
otso
aled
i
Mos
es K
otan
e
Bus
hbuc
krid
ge
Non
-rev
enue
Wat
er (
m3 /
annu
m)
Jun-16 Category average National average
B1 = 18.07 million m3/a
A= 94.8 million m3/a
B2 = 4.76 million m3/a B3 = 2.22 million m3/a B4 = 3.37 million m3/a
Average = 7.65 million m3/a

39
Figure 3.3: 2015/16 Percentage non-revenue water
The percentage NRW is the highest in the category B3 municipalities followed by category B4, B1, B2 and the lowest being the metros. The
weighted average compares well with previous studies. The average figure is significantly higher than the weighted average due to the influence
of the metros. The NRW for category B4 municipalities is lower than for B3 municipalities due to high number of indigents and equitable share.
0.0%
10.0%
20.0%
30.0%
40.0%
50.0%
60.0%
70.0%
80.0%
90.0%
City
of C
ape
Tow
n
City
of J
ohan
nesb
urg
Nel
son
Man
dela
Bay
Ste
llenb
osch
Gov
an M
beki
Mad
iben
g
New
cast
le
Sol
Pla
atjie
Mbo
mbe
la
Sal
danh
a B
ay
Kny
sna
Mid
vaal
Mer
afon
g C
ity
Maf
iken
g
Gre
ater
Kok
stad
Dih
labe
ng
Eno
ch M
gijim
a
Kin
g S
abat
a D
alin
dyeb
o
Han
tam
Sw
artla
nd
Bito
u
The
ewat
ersk
loof
Kar
eebe
rg
Mth
onja
neni
!Khe
is
Bel
a B
ela
Siy
ancu
ma
Kai
!Gar
ib
Tsa
ntsa
bane
Kou
-kam
ma
Kar
oo H
oogl
and
Gam
agar
a
Mkh
amba
thin
i
Sak
hisi
zwe
Kou
ga
Bea
ufor
t Wes
t
Ray
mon
d M
hlab
a
Blu
e C
rane
Rou
te
Nal
a
Tsw
elop
ele
Um
sobo
mvu
Man
tsop
a
Mpo
fana
Dip
ales
eng
The
mbe
lihle
Mas
ilony
ana
Lets
emen
g
Dits
obot
la
Mtu
batu
ba
End
umen
i
Mal
uti a
Pho
fung
Inko
si L
anga
libal
ele
Msi
nga
Eng
cobo
Mbi
zana
Man
deni
Map
hum
ulo
Nka
ndla
Mhl
ontlo
Dr
J S
Mor
oka
Ndw
edw
e
Um
zim
khul
u
Jozi
ni
Um
zum
be
Kag
isan
o M
olop
o
Blo
uber
g
Thu
lam
ela
Nko
maz
i
Lepe
le-N
kum
pi
Fet
akgo
mo/
Gre
ater
Tub
atse
uMsh
wat
hi
% N
on-r
even
ue W
ater
Jun-16 Category average National average Weighted average
B1 = 43.8%
A= 36.9%
B2 = 43.9% B3 = 49.0% B4 = 46.3%
Weighted average = 41.0%
Average = 46.7%

40
Figure 3.4: 2015/16 liters per capita per day
The liters per capita consumption is the highest in the metros due to the large number of wet industries. Category B3 and B4 municipalities have
the lowest per capita consumption and is in line with the level of service and level of development.
0
100
200
300
400
500
600
Cit
y o
f C
ape
Tow
n
eTh
ekw
ini
Eku
rhu
len
i
Geo
rge
Stev
e Ts
hw
ete
Mo
gale
Cit
y
Ven
ters
do
rp/T
lokw
e
Mb
om
bel
a
Cit
y o
f u
Mh
lath
uze
Kw
aDu
kuza
Mak
ana
Ran
d W
est
Cit
y
Dih
lab
eng
Mer
afo
ng
Cit
y
Ou
dts
ho
orn
Mo
ssel
Bay
Bre
ede
Val
ley
Sald
anh
a B
ay
Mth
on
jan
eni
Nta
mb
anan
a
Han
tam
Dik
gatl
on
g
Mo
dim
olle
/Mo
okg
op
ho
ng
Tsw
elo
pel
e
Kga
telo
pel
e
Ph
um
elel
a
Nke
toan
a
Nal
edi
Wal
ter
Sisu
lu
Lep
hal
ale
Pri
nce
Alb
ert
Dip
ales
eng
Lets
eme
ng
Wit
zen
ber
g
Mu
sin
a
Bel
a B
ela
Big
Fiv
e H
lab
isa
eDu
mb
e
!Kh
eis
Dit
sob
otl
a
Lekw
a
Kai
!G
arib
Ga-
Sego
nya
na
Mtu
bat
ub
a
Kh
ai-M
a
Thab
azim
bi
Dr
Bey
ers
Nau
dé
uM
uzi
wab
antu
Emth
anje
ni
Ph
okw
ane
Them
bel
ihle
eMad
lan
gen
i
Nq
uth
u
Um
lala
zi
Emal
ahle
ni
Mak
hu
du
tham
aga
Nko
maz
i
Bu
shb
uck
rid
ge
Blo
ub
erg
Ric
hm
on
d
Eph
raim
Mo
gale
Elu
nd
ini
Jozi
ni
Msi
nga
Engc
ob
o
Um
zim
vub
u
Mo
ses
Ko
tan
e
uP
ho
ngo
lo
Map
hu
mu
lo
Mb
izan
a
Okh
ahla
mb
a
Dr
J S
Mo
roka
Gre
ater
Tza
nee
n
Jun-16 Category average National average Weighted average
B1 = 260
A= 283
B2 = 204 B3 = 172 B4 = 158
Weighted average = 237
Average = 180
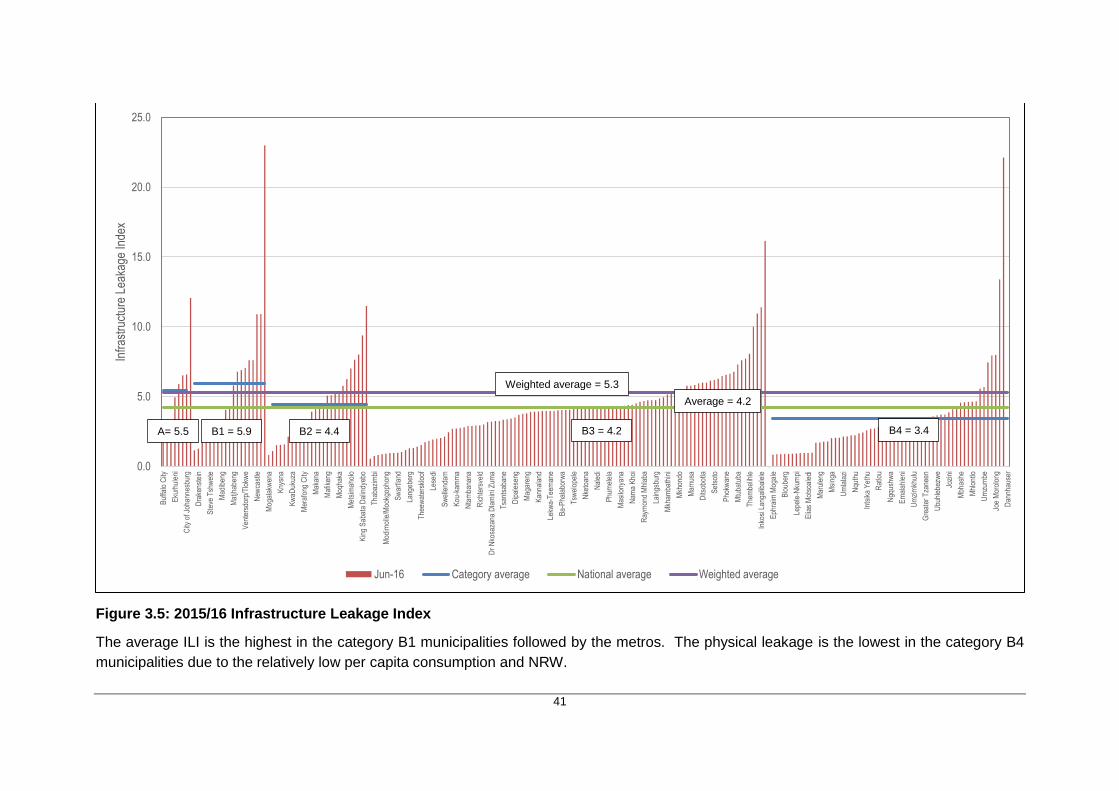
41
Figure 3.5: 2015/16 Infrastructure Leakage Index
The average ILI is the highest in the category B1 municipalities followed by the metros. The physical leakage is the lowest in the category B4
municipalities due to the relatively low per capita consumption and NRW.
0.0
5.0
10.0
15.0
20.0
25.0
Buf
falo
City
Eku
rhul
eni
City
of J
ohan
nesb
urg
Dra
kens
tein
Ste
ve T
shw
ete
Mad
iben
g
Mat
jhab
eng
Ven
ters
dorp
/Tlo
kwe
New
cast
le
Mog
alak
wen
a
Kny
sna
Kw
aDuk
uza
Mer
afon
g C
ity
Mak
ana
Maf
iken
g
Moq
haka
Met
sim
ahol
o
Kin
g S
abat
a D
alin
dyeb
o
Tha
bazi
mbi
Mod
imol
le/M
ookg
opho
ng
Sw
artla
nd
Lang
eber
g
The
ewat
ersk
loof
Lese
di
Sw
elle
ndam
Kou
-kam
ma
Nta
mba
nana
Ric
hter
svel
d
Dr
Nko
saza
na D
lam
ini Z
uma
Tsa
ntsa
bane
Dip
ales
eng
Mag
aren
g
Kan
nala
nd
Lekw
a-T
eem
ane
Ba-
Pha
labo
rwa
Tsw
elop
ele
Nke
toan
a
Nal
edi
Phu
mel
ela
Mas
ilony
ana
Nam
a K
hoi
Ray
mon
d M
hlab
a
Lain
gsbu
rg
Mkh
amba
thin
i
Mkh
ondo
Mam
usa
Dits
obot
la
Set
soto
Pho
kwan
e
Mtu
batu
ba
The
mbe
lihle
Inko
si L
anga
libal
ele
Eph
raim
Mog
ale
Blo
uber
g
Lepe
le-N
kum
pi
Elia
s M
otso
aled
i
Mar
ulen
g
Msi
nga
Um
lala
zi
Nqu
thu
Ints
ika
Yet
hu
Rat
lou
Ngq
ushw
a
Em
alah
leni
Um
zim
khul
u
Gre
ater
Tza
neen
Ubu
hleb
ezw
e
Jozi
ni
Mbh
ashe
Mhl
ontlo
Um
zum
be
Joe
Mor
olon
g
Dan
nhau
ser
Infr
astr
uctu
re L
eaka
ge In
dex
Jun-16 Category average National average Weighted average
B1 = 5.9 A= 5.5 B2 = 4.4 B3 = 4.2 B4 = 3.4
Weighted average = 5.3
Average = 4.2

42
6 CONCLUSIONS
The Eastern Cape municipalities have not achieved their 2016 targets and have been tracking the
projected water demand without WCWDM. Municipalities in the Eastern Cape are unlikely to achieve
their 2017 targets. The estimated 2015/16 water balance, for all municipalities in the Eastern Cape,
indicates water losses of 149.61 million m3/a (45.0%) and NRW of 158.65 million m3/a (47.8%). The
water balance has a low confidence due to the limited number of data sets and is highly influenced
by the Nelson Mandela Bay and Buffalo City metros, which account for 55% of the total demand.
In the Free State, Mangaung has been enforcing water restrictions since July 2015 and it exceeded
its June 2016 target by 12.2 million m³/a or 16%. Only Mangaung submits information on a regular
basis and leakage levels fluctuate considerably. It is difficult to assess if any progress is being made
with the reduction of NRW and water losses. The estimated 2015/16 water balance, for all
municipalities in the Free State, indicates water losses of 96.91 million m3/a (46.6%) and NRW of
106.91 million m3/a (51.4%). The water balance has a low confidence due to the limited number of
data sets. WCWDM must be implemented as a matter of priority to sustain current trends and
considering that water restrictions have already been imposed in several Free State municipalities.
There is significant scope for improvement in reporting levels, data accuracy and a reduction of
system input volume, NRW, water losses and efficiency.
Gauteng has been unable to reduce their demand in the past 9 years, although water use efficiency
seems to have been improving in the past 5 years. The estimated 2015/16 water balance, for all
municipalities in Gauteng, indicates water losses of 404.07 million m3/a (27.4%) and NRW of
528.84 million m3/a (35.9%). NRW and water loss levels have come down, which is commendable,
but WCWDM implementation levels must be elevated to ensure the targets of the Greater Vaal
reconciliation strategy are achieved. There is significant scope for improvement in the reduction of
system input volume, NRW, water losses and efficiency. Data accuracy and reporting are excellent
at metro-level but can improve for some of the smaller municipalities.
KwaZulu Natal has managed to maintain their system input, leakage levels and per capita
consumption in the past 5 to 6 years. The estimated 2015/16 water balance, for all KwaZulu-Natal
municipalities, indicates water losses of 299.80 million m3/a (43.0%) and NRW of 327.44 million m3/a
(46.9%). There is however, significant scope for improvement in the reduction of system input, NRW
and water losses in the province and WCWDM implementation levels must be elevated to ensure
the targets of the KZN Metropolitan areas reconciliation strategy are achieved, especially with the
looming / imposed water restrictions in the province. Data accuracy and reporting are excellent at
metro and secondary city level but there is significant scope for improvement in reporting levels and
data accuracy for the smaller municipalities.
The Limpopo province has been unable to reduce their demand in the past 9 years and water use
efficiency is at an all-time high of 209 ℓ/c/d. The estimated 2015/16 water balance, for all
municipalities in Limpopo, indicates water losses and NRW of 155.02 million m3/a (55.1%). The
water balance has a low confidence due to the limited number of data sets. Leakage levels and
NRW are also consistently increasing and WCWDM must be implemented as a matter of priority.
There is significant scope for improvement in reporting levels, data accuracy and reduction of system
input volume, NRW, water losses and efficiency.

43
The Mpumalanga province has been unable to reduce their demand in the past 8 years with some
signs of improvement in 2013, although this requires further investigation. The estimated 2015/16
water balance, for all North West municipalities, indicates water losses and NRW of
105.58 million m3/a (51.1%). The water balance has a low confidence level due to the low number
of data sets. NRW and water losses have reduced slightly over the past 8 years despite a significant
increase in the system input volume and WCWDM must be implemented as a matter of priority.
There is significant scope for improvement in reporting levels, data accuracy and reduction of system
input volume, NRW, water losses and efficiency.
The North West province has been unable to reduce their demand in the past 9 years, except for
2011, and shows significant growth in the past 2 years. The estimated 2015/16 water balance, for
all North West municipalities, indicates water losses and NRW of 105.58 million m3/a (51.1%). NRW
have reduced slightly in the past year but water losses are consistently increasing. WCWDM must
be implemented as a matter of priority. There is significant scope for improvement in reporting levels,
data accuracy and reduction of system input volume, NRW, water losses and efficiency.
Northern Cape has managed to maintain their system input, NRW and per capita consumption in
the past 5 to 6 years. The estimated 2015/16 water balance for all Northern Cape municipalities
indicates water losses of 42.0 million m3/a (44.6%) and NRW of 44.5 million m3/a (47.3%). The
water balance has a medium confidence level and is highly influenced by //Khara Hais (Upington)
and Sol Plaatjie (Kimberley) which accounts for approximately 67% of the demand. Increased efforts
are required by municipalities to implement WCWDM to ensure targets are achieved and water
restrictions are mitigated in the driest province. There is significant scope for improvement in
reporting levels, data accuracy, reduction of system input, NRW and water losses in the province.
Municipalities in the Western Cape have been doing well to maintain their system input volume for
the past 3 to 4 years, while reducing their water losses and per capita consumption. The 2015/16
water balance for the 20 data sets, indicates water losses of 80.48 million m3/a (16.7%) and NRW
of 102.7 million m3/a (21.3%). Municipalities must continue their current trends and increase their
efforts to implement WCWDM.
Nationally, the system input volume has been consistently increasing since 2006 but the NRW has
been improving since 2011 and water losses since 2009. The estimated 2015/16 water balance, for
all municipalities, indicate water losses of 1462.01 million m3/a (36.1%) and NRW of
1659.59 million m3/a (41.0%). Per capita consumption has remained almost constant over the past
9 years, which is commendable, but WCWDM efforts must be elevated considering these figures are
significantly above international benchmarks of approximately 180 ℓ/c/d and the country is one of the
30 driest in the world. The reduction in NRW is encouraging but the figures are highly influenced by
the metros that have made considerable progress to reduce their non-revenue water while there is
significant scope for improvement in most of the other municipalities. The reduction in water losses
is mainly due to the shift of water losses to unbilled consumption in the water balance.
Only continuous monitoring and analyses will provide a credible benchmark against which the
progress made with the implementation of WCWDM may be measured. WCWDM must be
implemented as a matter of urgency in all provinces, especially with the looming and reported
droughts in the country. There is significant scope for improvement in reporting levels, data accuracy
and reduction of system input, NRW, water losses and improved efficiency across the country.

44
7 RECOMMENDATIONS
The following recommendations are suggested to address the progress made with the
implementation of WCWDM in the eight large water distribution systems.
Maintenance of the reconciliation strategies must continue and be used to monitor the progress
made in the implementation of WCWDM. Municipalities must actively participate and report at
these meetings and use the outcomes to prioritise resources and budgets.
Municipalities should increase their efforts to achieve the targets set under the various water
reconciliation strategies to ensure water security. Targets need to be reviewed and reported on
a regular basis.
Too many local municipalities are not aware of the reconciliation strategies or expect DWS to
provide the necessary funding to implement these strategies. Municipalities must be reminded
of their responsibilities in terms of the Water Services Act and actively participate, budget through
the IDP process and implement the results from the reconciliation strategies.
Budgets are allocated towards new infrastructure projects through ACIP, MWIG, RBIG, MIG, etc.
funding programmes but the management of these funds is fragmented with emphasis on new
infrastructure and insufficient focus on WCWDM.
Ongoing monitoring and reporting of municipal NRW and water loss performance by DWS
against determined targets and baselines is critical.
Monitoring and reporting on water balances by municipalities could become more self-regulatory
if a policy is implemented that no new infrastructure projects will be funded unless the
municipality can provide actual consumption figures and proof that their water losses are under
control. The IWA water balance should become the backbone of all water related management
and decision support systems.
Municipalities should increase their efforts to reduce NRW and the negative impact it has on their
ability to generate own income and run a viable water business.
Municipalities should, through on-going awareness programmes, encourage the consumer to
appreciate the value of water and enforce the user pays principle.
Municipalities should increase payment levels, encourage consumer fixing of leaks, and
prosecution of illegal water connections and reduce theft of water.
Municipal asset management needs to be improved to ensure greater sustainability of water
supply services.
There are close correlation between operations, maintenance, low water losses and NRW.
Municipalities should implement proactive operations and maintenance programmes to coincide
with WCWDM programmes.
Closer involvement and collaboration with National Treasury and CoGTA is critical to ensure
issues related to funding of WCWDM programmes, metering and billing issues are resolved with
municipal finance departments.
WCWDM should be included in the performance plans of organisations and senior executives to
ensure execution and achievement of these plans.
On-going provision of mentorship to municipalities through the DWS Regional Offices is critical.
DWS Regional Offices / CMAs must upscale their skills and capacity to provide WCWDM support
to municipalities, monitoring and reporting.
45
Some Regional Offices appointed a PSP to provide support with the development of reporting
templates, meeting with municipalities to confirm targets, analyse the water balance information
and provide feedback. The reporting structures in these regions are well established and all
municipalities are reporting on a quarterly basis. The initiative was supported by Regulations
sending directives to municipalities who did not respond. A similar approach could be followed
for all the other provinces to improve communications and water balance reporting.
The Regulations Relating to Compulsory National Standards and Measures to Conserve Water
(R509, 2001) state that a water services institution must fit a suitable water volume measuring
device or volume controlling device to every user connection to control demand. Many
municipalities do not comply with this regulation which results in excessive leakages on private
properties through leaking taps and toilets as there is no incentive for consumers to fix their
leaks. DWS should consider a policy whereby water services institutions are forced to either
measure and control or fix leaks on private properties, but government cannot continue to fund
new infrastructure projects to supplement leakage as a result of poor operations and
maintenance. DWS is already encouraging the fixing of leaks through the War on Leaks
programme.
The national non-revenue water assessment completed in 2011 suggests that 45% of
municipalities cannot provide basic information such as monthly consumption figures. One of
the key challenges with gathering the information is the poor communication channels with
municipalities which includes resigned staff and a considerable number of private e-mails.
Discussions also indicate that in some cases municipalities are unwilling to provide the
information as it reflects badly on them or they feel that the information has already been
submitted through the WSDP, various questionnaires, RPMS, Green drop, Blue drop etc.
Government needs to revisit communication channels with municipalities. Communications
should be more formal, avoid duplication and targeted at senior management in the organization.
In this regard, the circulars provided by National Treasury provide clear guidelines to
municipalities and communications are only with the mayor, municipal manager and CFO.
The results from the No Drop audit must be used to motivate for funding in the next financial
year. The No Drop incentive-based regulation programme should be rolled-out as planned in
conjunction with the other Drop programmes to elevate WCWDM in the municipal environment.
DWS should also enforce its regulatory mandate to penalise municipalities that do not comply.
Closer involvement and collaboration with CoGTA and SALGA is critical to address issues
relating to human resources' skills and capacity in municipalities, as well as resolving payment
for services and unauthorised water use.
Closer collaboration is required with other national, provincial and local departments that are big
water users. These include Departments of Education, Correctional Services, Public Works and
Housing to ensure leakages and wastage are brought under control.
The recommendations of the Second Edition of the National Water Resource Strategy (DWA,
June 2013), which calls for greater emphasis on meeting specific targets to reduce water loss,
must be implemented. WCWDM measures will have multiple benefits in terms of the
postponement of infrastructure augmentation, mitigation against climate change, support to
economic growth and ensuring that adequate water is available for equitable allocation.
The recommendations of South Africa’s National Development Plan (Vision for 2030)(NPC,
2013), which calls for clear national and local targets to be achieved by 2017 and 2022, must be
implemented.