benchmarking of irrigation projectsnhp.mowr.gov.in/docs/nhp/webevent/dk singh_benchmarking of...
TRANSCRIPT
Benchmarking of Irrigation Projects
Dr. D. K. Singh
Principal Scientist
Water Technology Centre ICAR-Indian Agricultural Research Institute
New Delhi
Meeting on “Irrigation bench marking” National Hydrology Project, Ministry of Water
Resources, River Development & Ganga Rejuvenation April 26, 2019
Benchmarking of Irrigation Projects
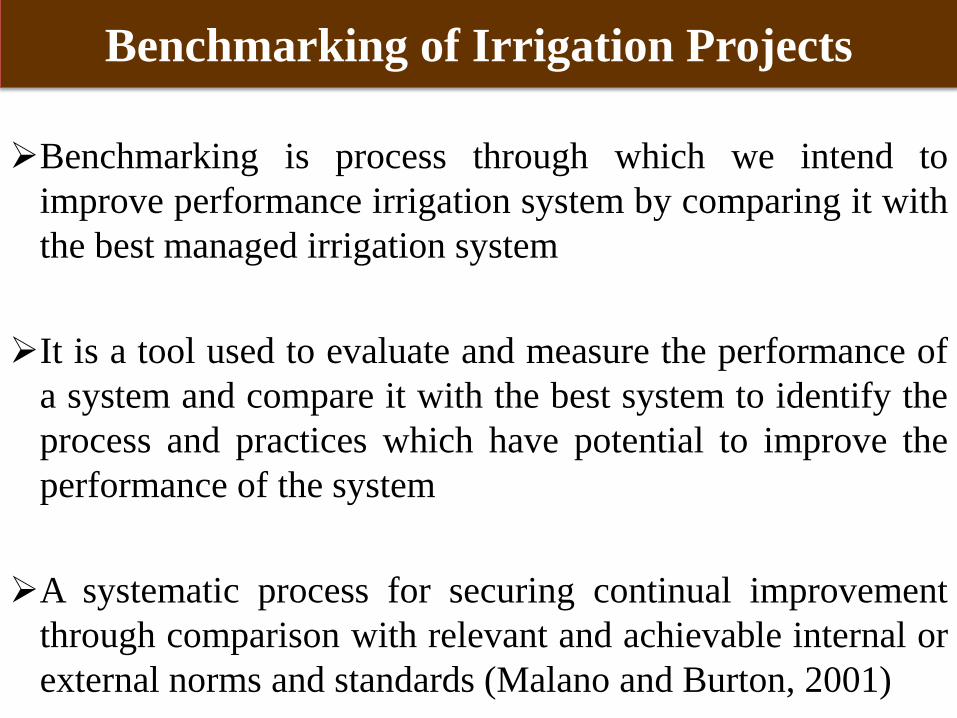
Benchmarking is process through which we intend to
improve performance irrigation system by comparing it with
the best managed irrigation system
It is a tool used to evaluate and measure the performance of
a system and compare it with the best system to identify the
process and practices which have potential to improve the
performance of the system
A systematic process for securing continual improvement
through comparison with relevant and achievable internal or
external norms and standards (Malano and Burton, 2001)
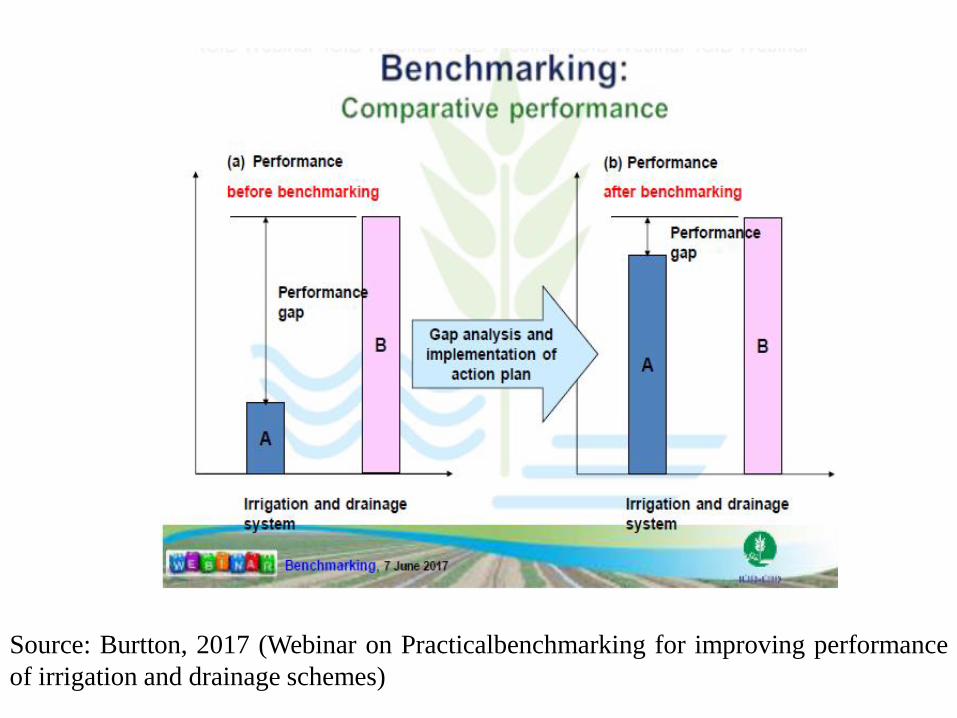
Source: Burtton, 2017 (Webinar on Practicalbenchmarking for improving performance
of irrigation and drainage schemes)
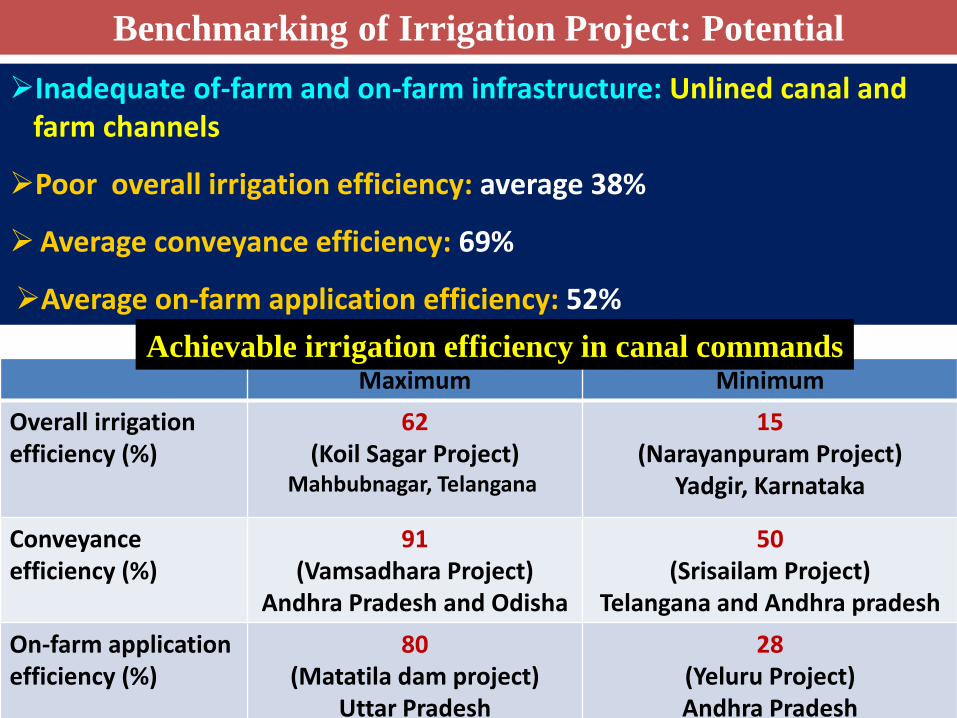
Benchmarking of Irrigation Project: Potential
Inadequate of-farm and on-farm infrastructure: Unlined canal and farm channels
Poor overall irrigation efficiency: average 38%
Average conveyance efficiency: 69%
Average on-farm application efficiency: 52%
Maximum Minimum
Overall irrigation efficiency (%)
62 (Koil Sagar Project)
Mahbubnagar, Telangana
15 (Narayanpuram Project)
Yadgir, Karnataka
Conveyance efficiency (%)
91 (Vamsadhara Project)
Andhra Pradesh and Odisha
50 (Srisailam Project)
Telangana and Andhra pradesh
On-farm application efficiency (%)
80 (Matatila dam project)
Uttar Pradesh
28 (Yeluru Project) Andhra Pradesh
Achievable irrigation efficiency in canal commands
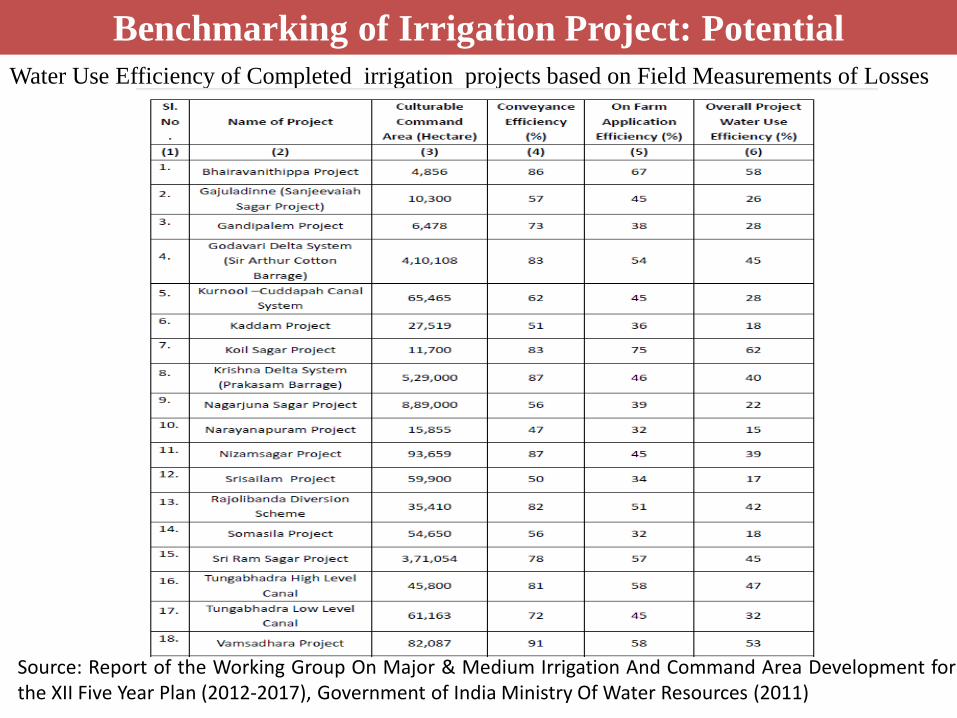
Water Use Efficiency of Completed irrigation projects based on Field Measurements of Losses
Benchmarking of Irrigation Project: Potential
Source: Report of the Working Group On Major & Medium Irrigation And Command Area Development for the XII Five Year Plan (2012-2017), Government of India Ministry Of Water Resources (2011)
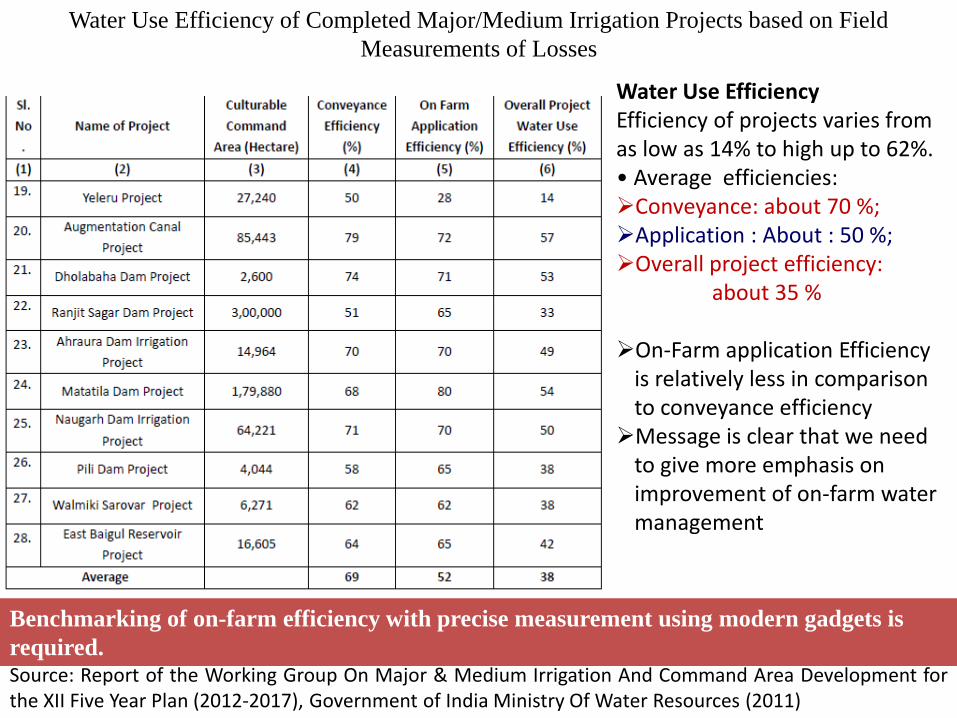
Water Use Efficiency of Completed Major/Medium Irrigation Projects based on Field
Measurements of Losses
Source: Report of the Working Group On Major & Medium Irrigation And Command Area Development for the XII Five Year Plan (2012-2017), Government of India Ministry Of Water Resources (2011)
Water Use Efficiency Efficiency of projects varies from as low as 14% to high up to 62%. • Average efficiencies: Conveyance: about 70 %; Application : About : 50 %; Overall project efficiency: about 35 %
On‐Farm application Efficiency
is relatively less in comparison to conveyance efficiency
Message is clear that we need to give more emphasis on improvement of on-farm water management
Benchmarking of on-farm efficiency with precise measurement using modern gadgets is
required.
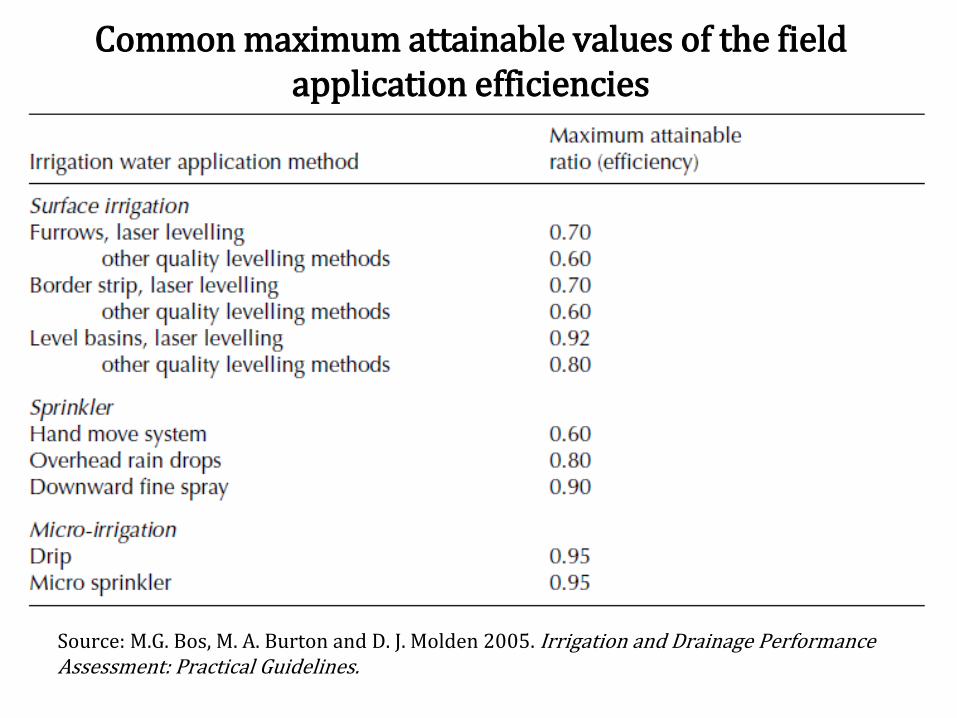
Common maximum attainable values of the field application efficiencies
Source: M.G. Bos, M. A. Burton and D. J. Molden 2005. Irrigation and Drainage Performance Assessment: Practical Guidelines.
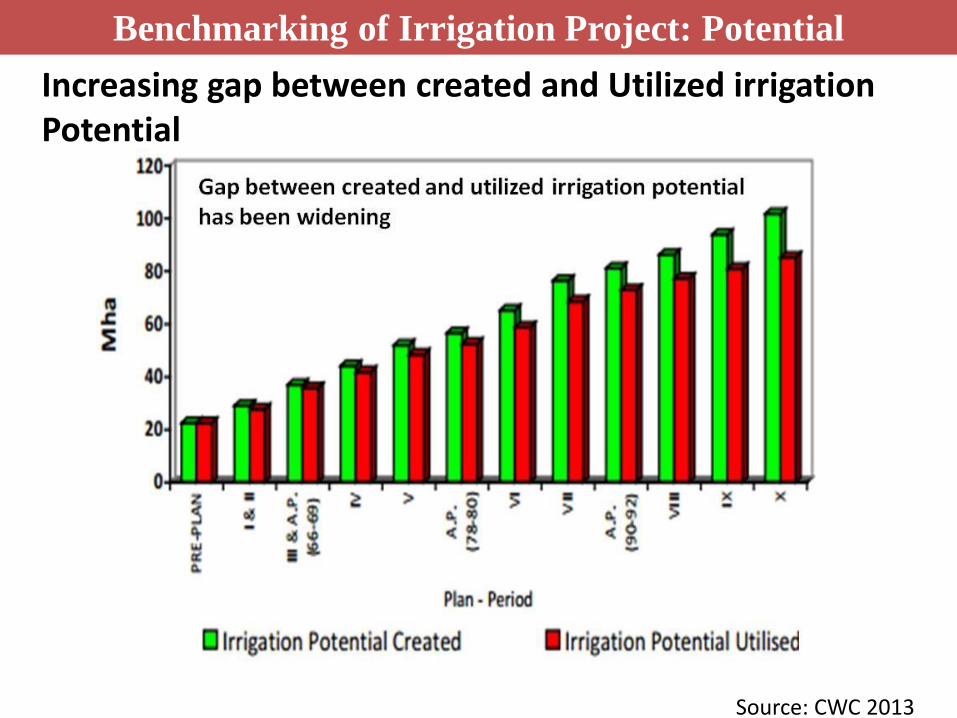
Benchmarking of Irrigation Project: Potential
Source: CWC 2013
Increasing gap between created and Utilized irrigation Potential
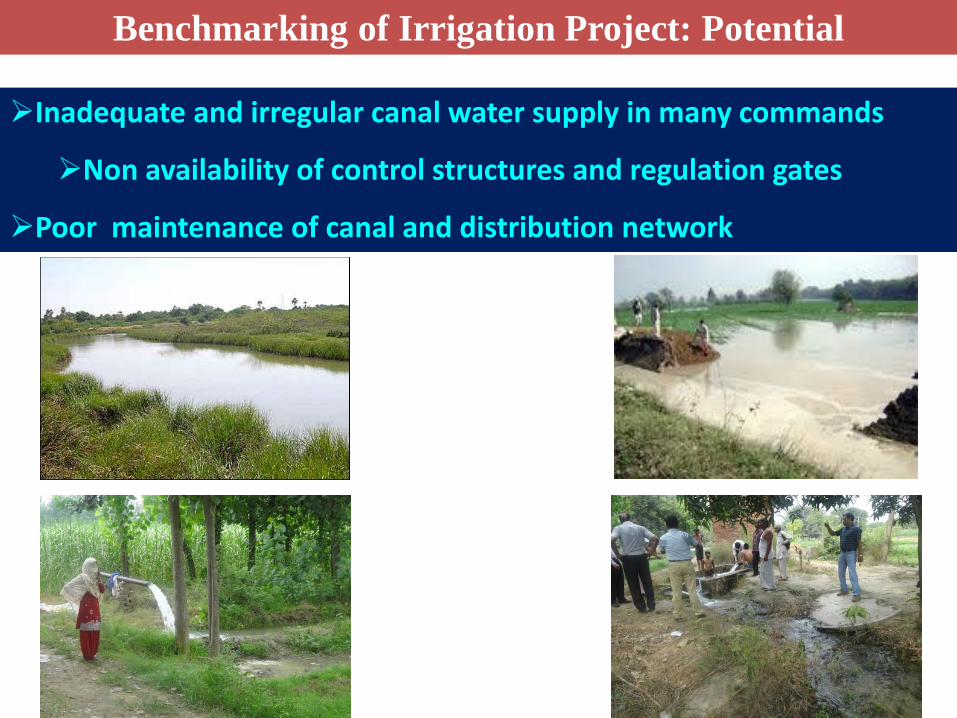
Inadequate and irregular canal water supply in many commands
Non availability of control structures and regulation gates
Poor maintenance of canal and distribution network
Benchmarking of Irrigation Project: Potential
Benchmarking of Irrigation Project: Potential
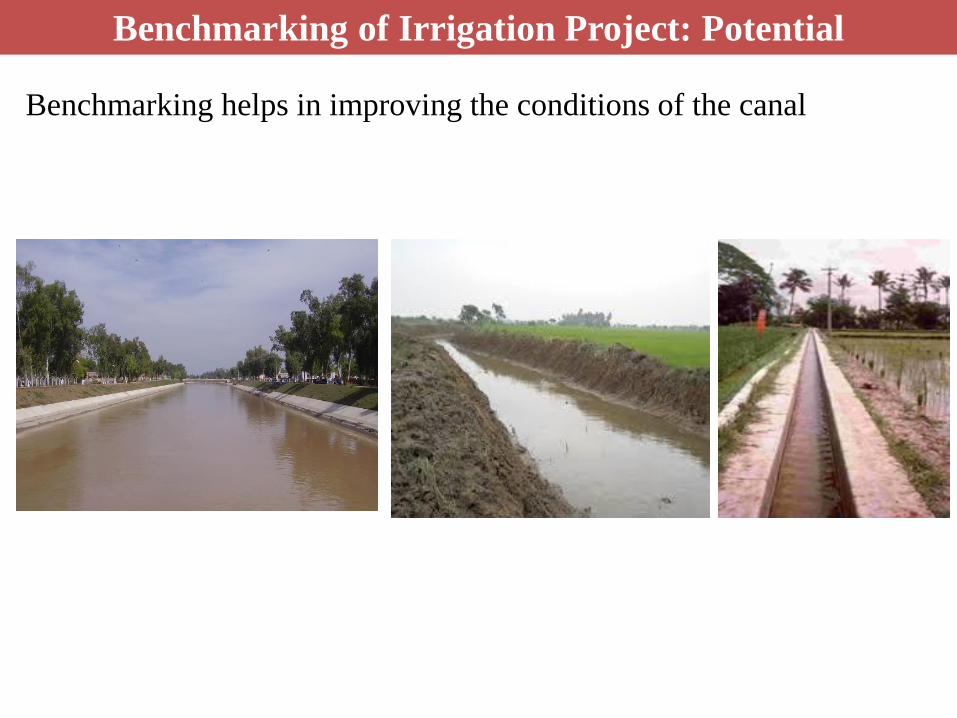
Benchmarking helps in improving the conditions of the canal
Benchmarking of Irrigation Project: Constraints
Data availability
Collection of primary and secondary data
Reliability of data
lack of modern tools and gadgets required for measurements
(in third phase of NHP it may improve)
Lack of coordination among participating organizations
Precise methodology
Trained man power
Budget
Way Forward
The main aim of irrigation projects are to increase
productivity and production without causing to land , water
and environment.
This can be achieved by supply of adequate water in
the entire command, improvement in irrigation
efficiencies, application of measured quantity of water
through efficient method of irrigation
On-farm application losses are more (Average on-farm
application efficiency is only 52%) than the conveyance
losses.
There is need to give more emphasis on bench
marking of on- farm irrigation efficiencies of
various irrigation projects
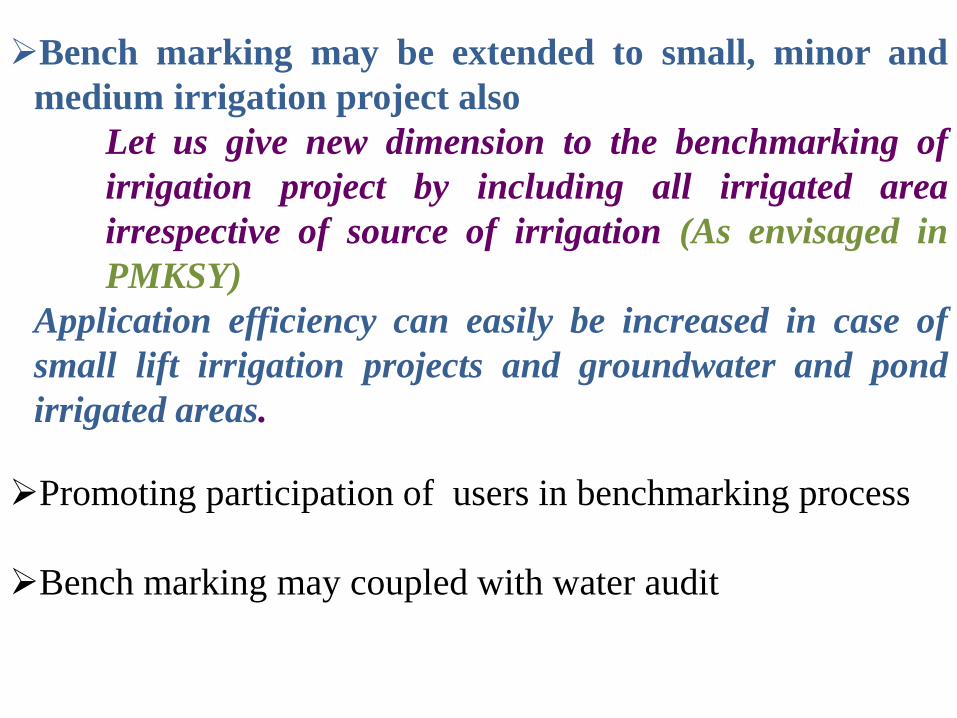
Bench marking may be extended to small, minor and
medium irrigation project also
Let us give new dimension to the benchmarking of
irrigation project by including all irrigated area
irrespective of source of irrigation (As envisaged in
PMKSY)
Application efficiency can easily be increased in case of
small lift irrigation projects and groundwater and pond
irrigated areas.
Promoting participation of users in benchmarking process
Bench marking may coupled with water audit
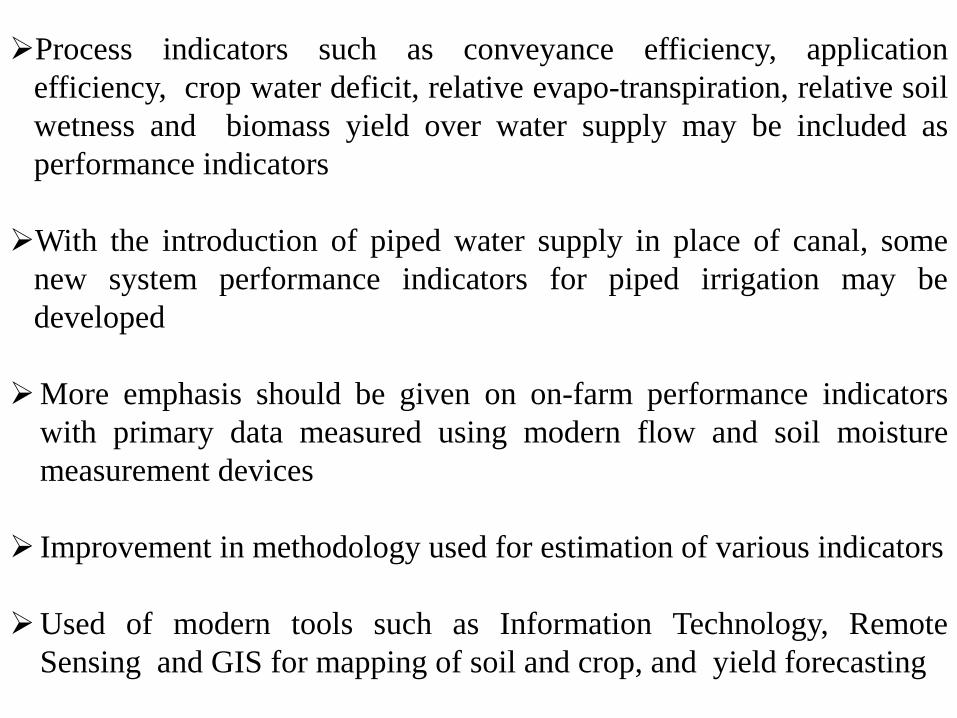
Process indicators such as conveyance efficiency, application
efficiency, crop water deficit, relative evapo-transpiration, relative soil
wetness and biomass yield over water supply may be included as
performance indicators
With the introduction of piped water supply in place of canal, some
new system performance indicators for piped irrigation may be
developed
More emphasis should be given on on-farm performance indicators
with primary data measured using modern flow and soil moisture
measurement devices
Improvement in methodology used for estimation of various indicators
Used of modern tools such as Information Technology, Remote
Sensing and GIS for mapping of soil and crop, and yield forecasting
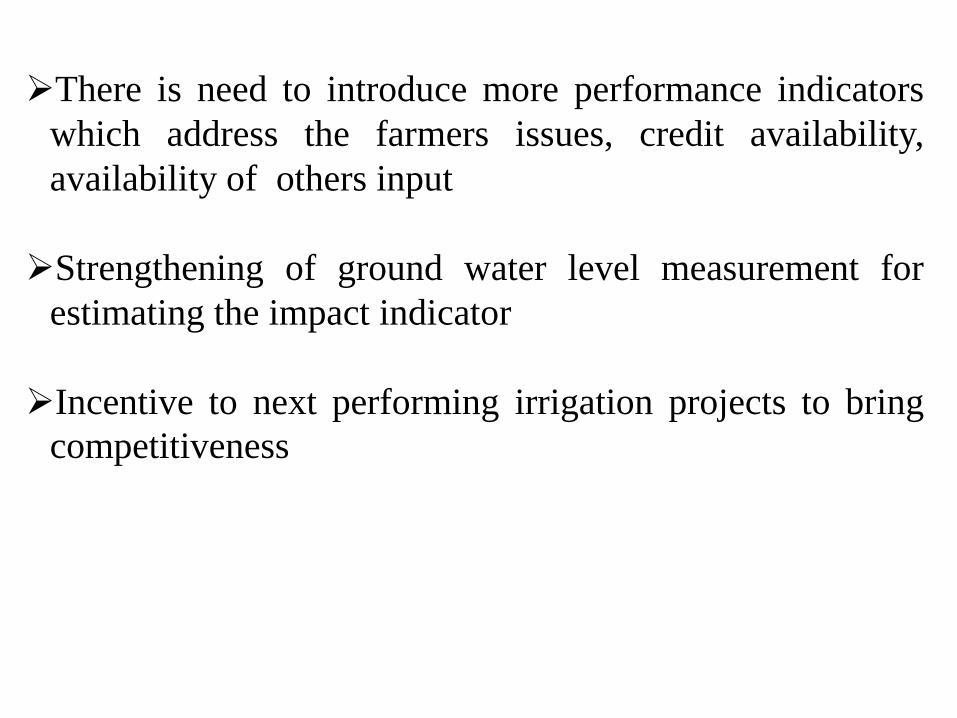
There is need to introduce more performance indicators
which address the farmers issues, credit availability,
availability of others input
Strengthening of ground water level measurement for
estimating the impact indicator
Incentive to next performing irrigation projects to bring
competitiveness
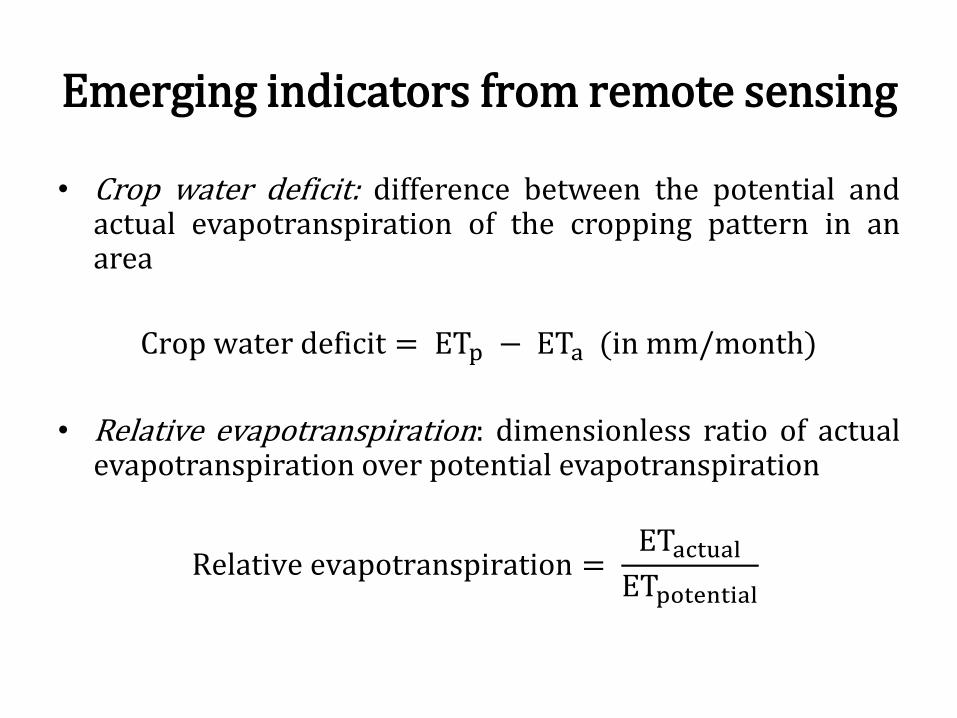
• Crop water deficit: difference between the potential and actual evapotranspiration of the cropping pattern in an area
Crop water deficit = ETp − ETa (in mm/month)
• Relative evapotranspiration: dimensionless ratio of actual evapotranspiration over potential evapotranspiration
Relative evapotranspiration = ETactual
ETpotential
Emerging indicators from remote sensing
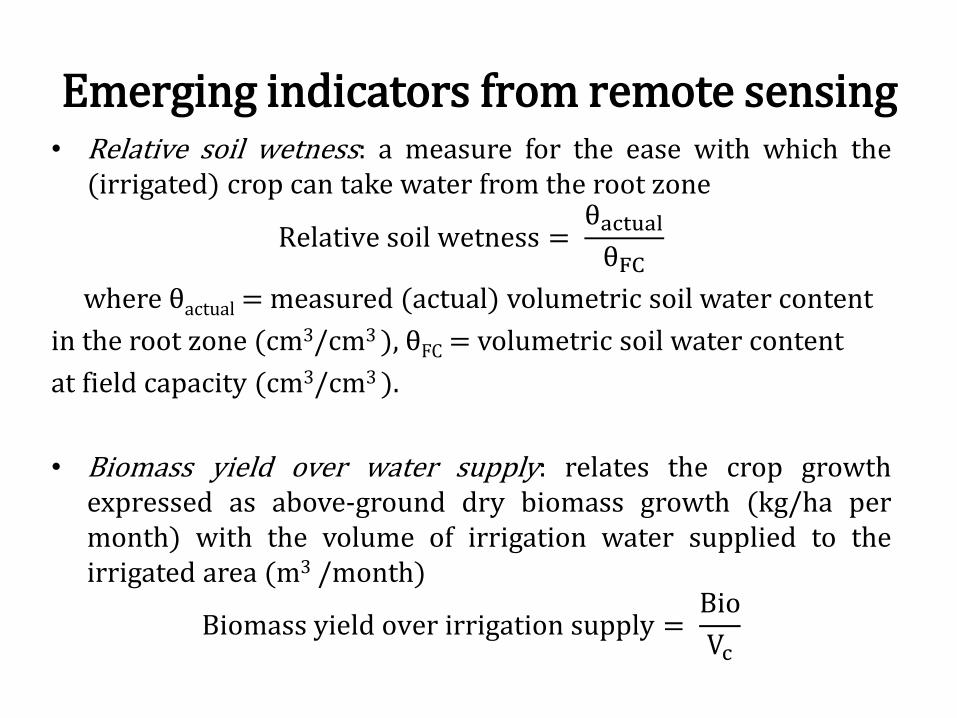
• Relative soil wetness: a measure for the ease with which the (irrigated) crop can take water from the root zone
Relative soil wetness = θactual
θFC
where θactual = measured (actual) volumetric soil water content
in the root zone (cm3/cm3 ), θFC = volumetric soil water content
at field capacity (cm3/cm3 ).
• Biomass yield over water supply: relates the crop growth expressed as above-ground dry biomass growth (kg/ha per month) with the volume of irrigation water supplied to the irrigated area (m3 /month)
Biomass yield over irrigation supply = Bio
Vc
Emerging indicators from remote sensing
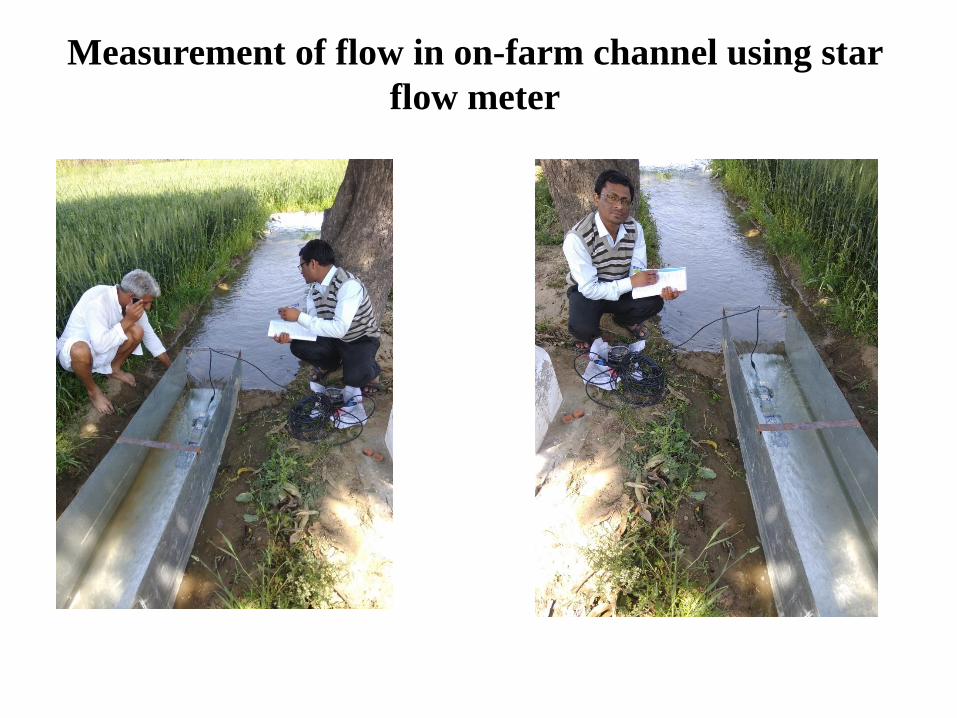
Measurement of flow in on-farm channel using star
flow meter
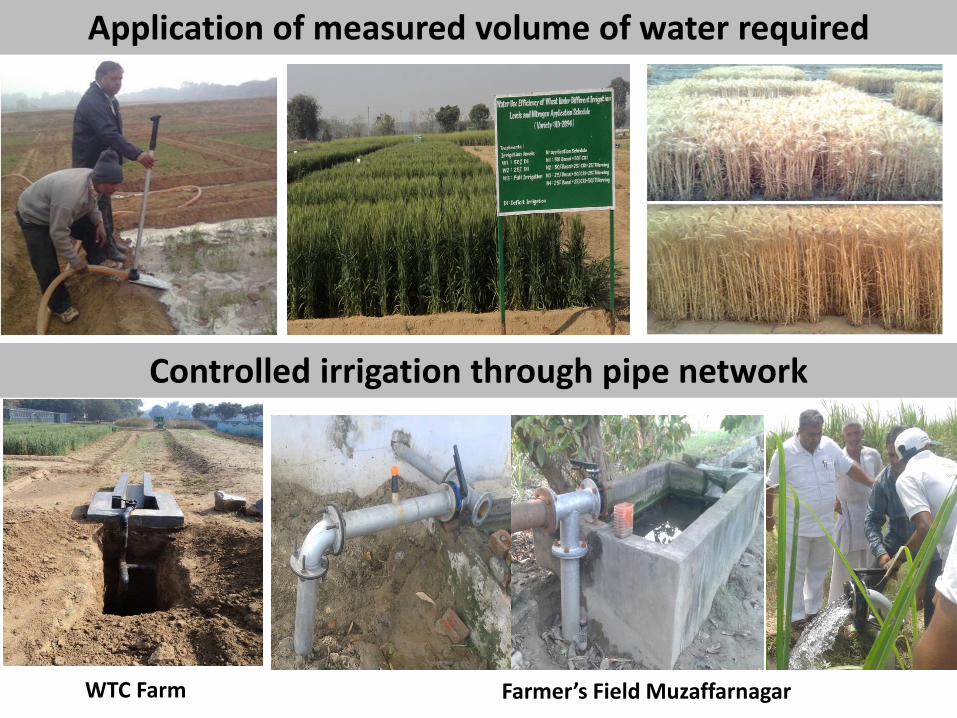
Application of measured volume of water required
Controlled irrigation through pipe network
WTC Farm Farmer’s Field Muzaffarnagar
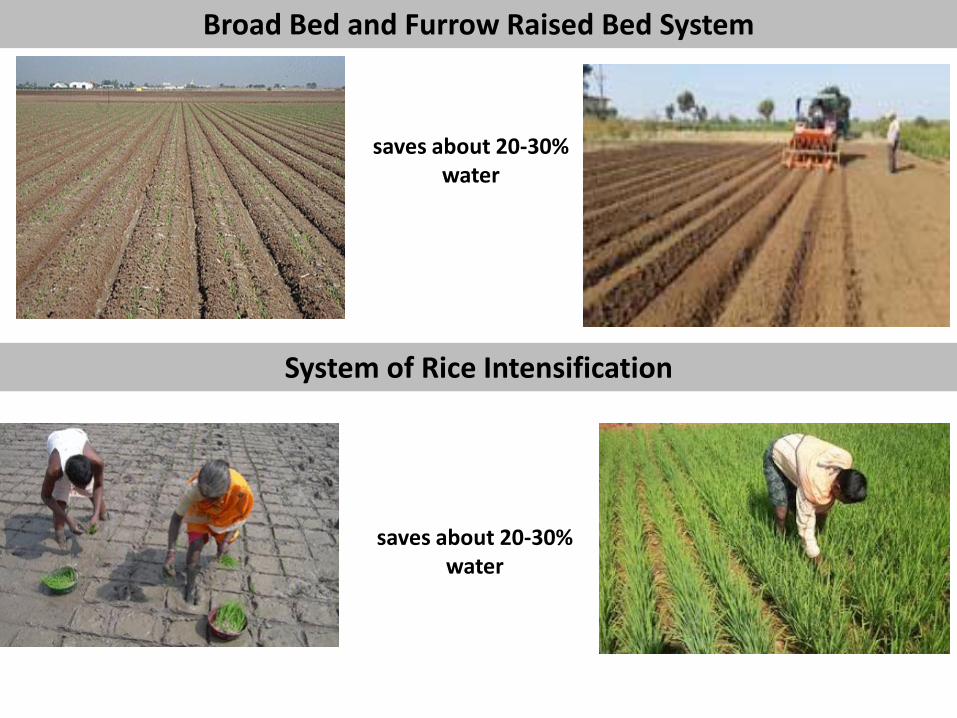
Broad Bed and Furrow Raised Bed System
System of Rice Intensification
saves about 20-30% water
saves about 20-30% water
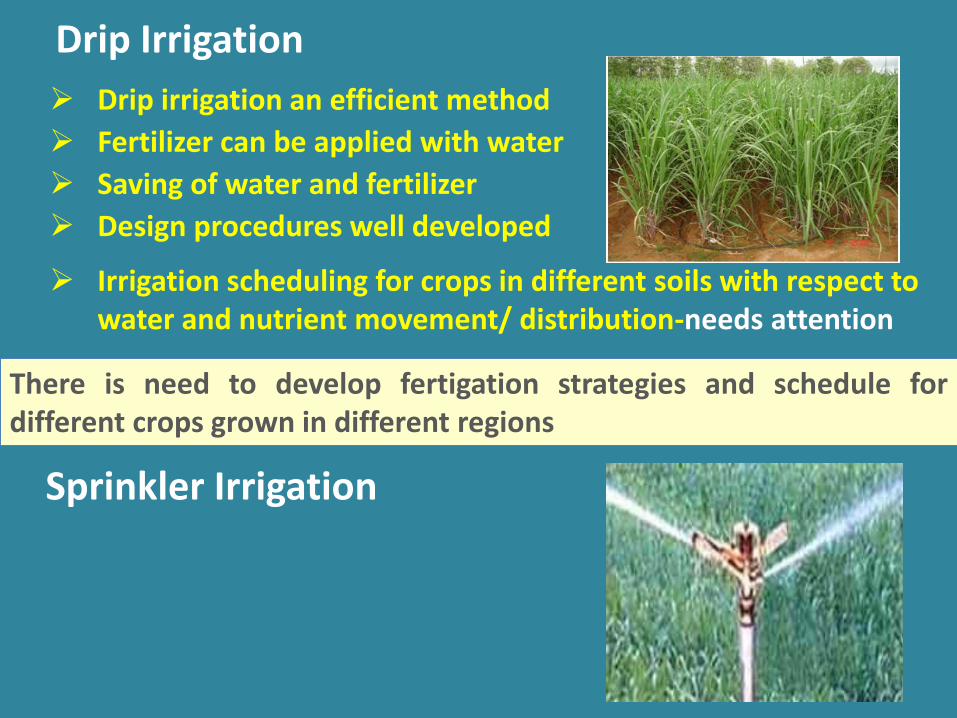
Drip irrigation an efficient method
Fertilizer can be applied with water
Saving of water and fertilizer
Design procedures well developed
Irrigation scheduling for crops in different soils with respect to water and nutrient movement/ distribution-needs attention
Drip Irrigation
There is need to develop fertigation strategies and schedule for different crops grown in different regions
Sprinkler Irrigation
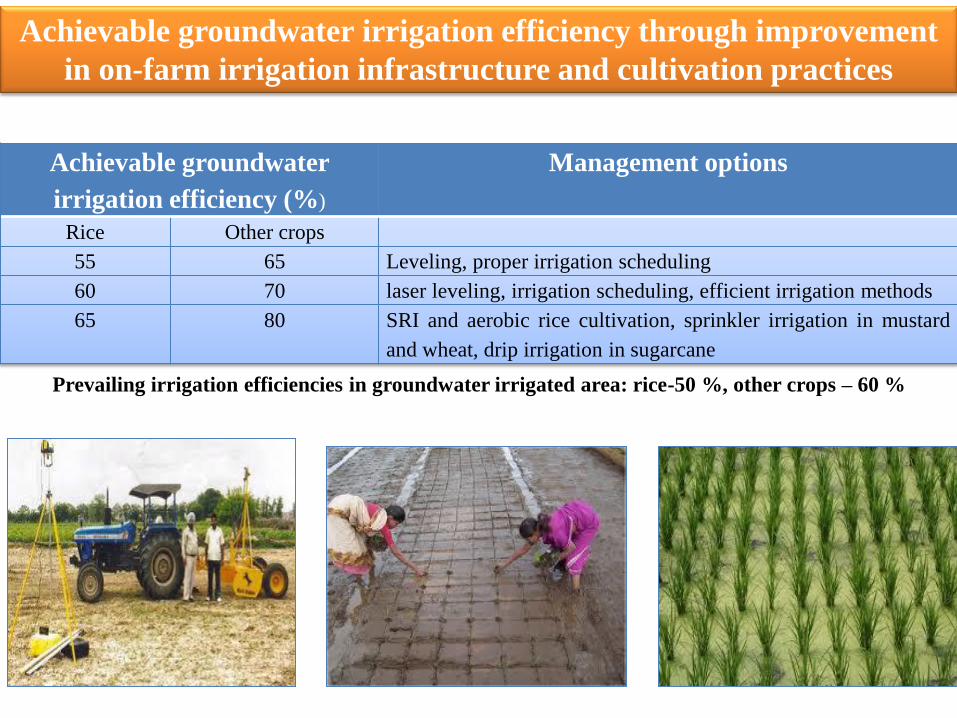
Achievable groundwater irrigation efficiency through improvement
in on-farm irrigation infrastructure and cultivation practices
Achievable groundwater
irrigation efficiency (%)
Management options
Rice Other crops
55 65 Leveling, proper irrigation scheduling
60 70 laser leveling, irrigation scheduling, efficient irrigation methods
65 80 SRI and aerobic rice cultivation, sprinkler irrigation in mustard
and wheat, drip irrigation in sugarcane
Prevailing irrigation efficiencies in groundwater irrigated area: rice-50 %, other crops – 60 %
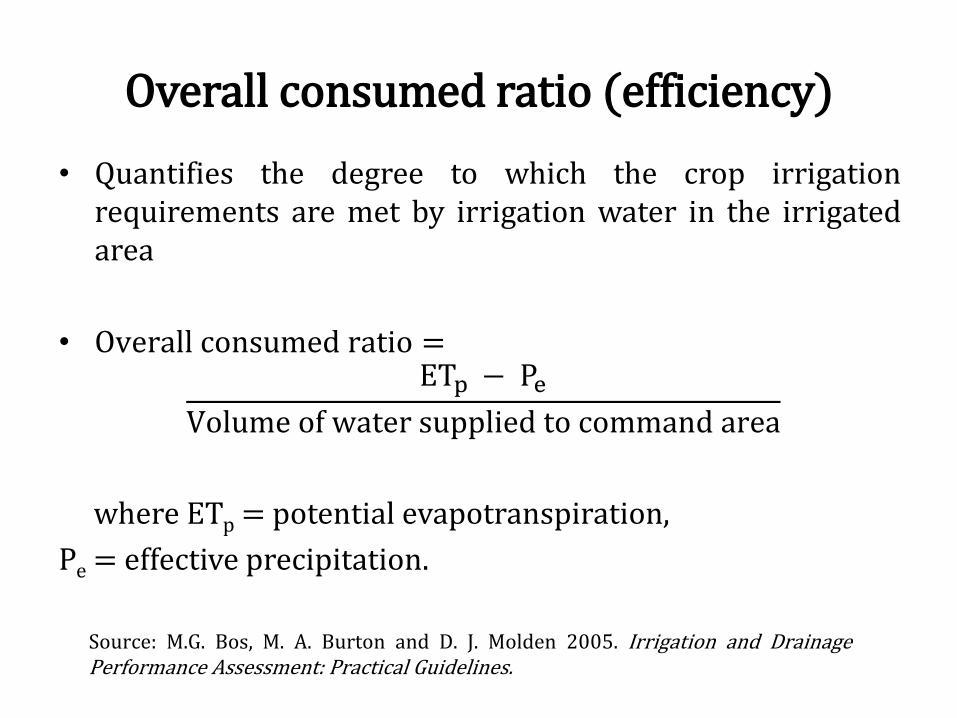
• Quantifies the degree to which the crop irrigation requirements are met by irrigation water in the irrigated area
• Overall consumed ratio =
ETp − Pe
Volume of water supplied to command area
where ETp = potential evapotranspiration,
Pe = effective precipitation.
Overall consumed ratio (efficiency)
Source: M.G. Bos, M. A. Burton and D. J. Molden 2005. Irrigation and Drainage Performance Assessment: Practical Guidelines.
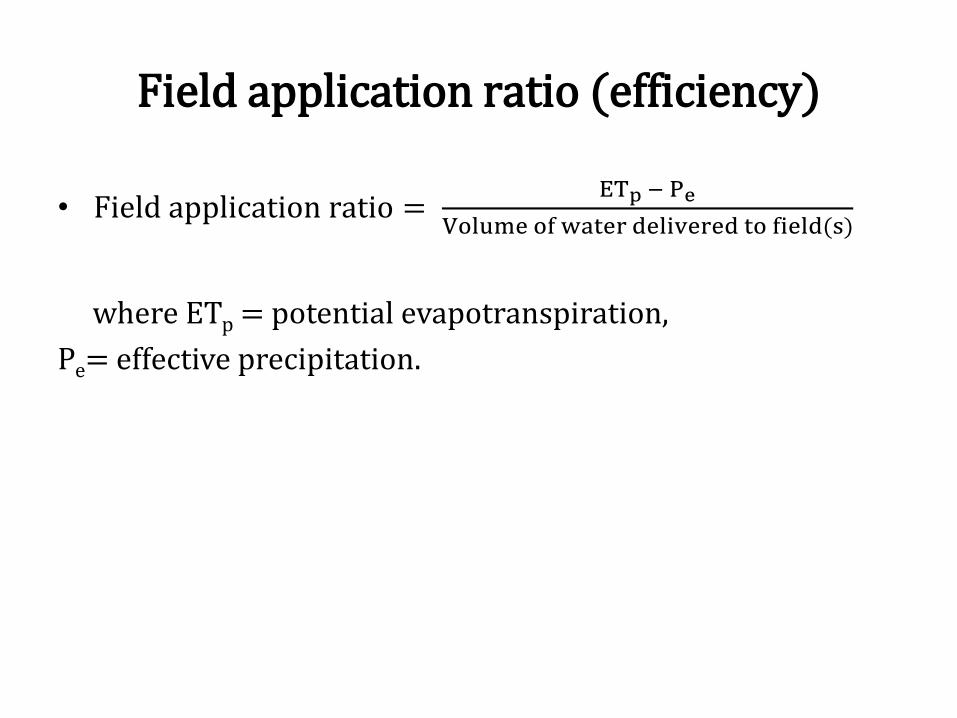
• Field application ratio = ETp − Pe
Volume of water delivered to field(s)
where ETp = potential evapotranspiration,
Pe= effective precipitation.
Field application ratio (efficiency)
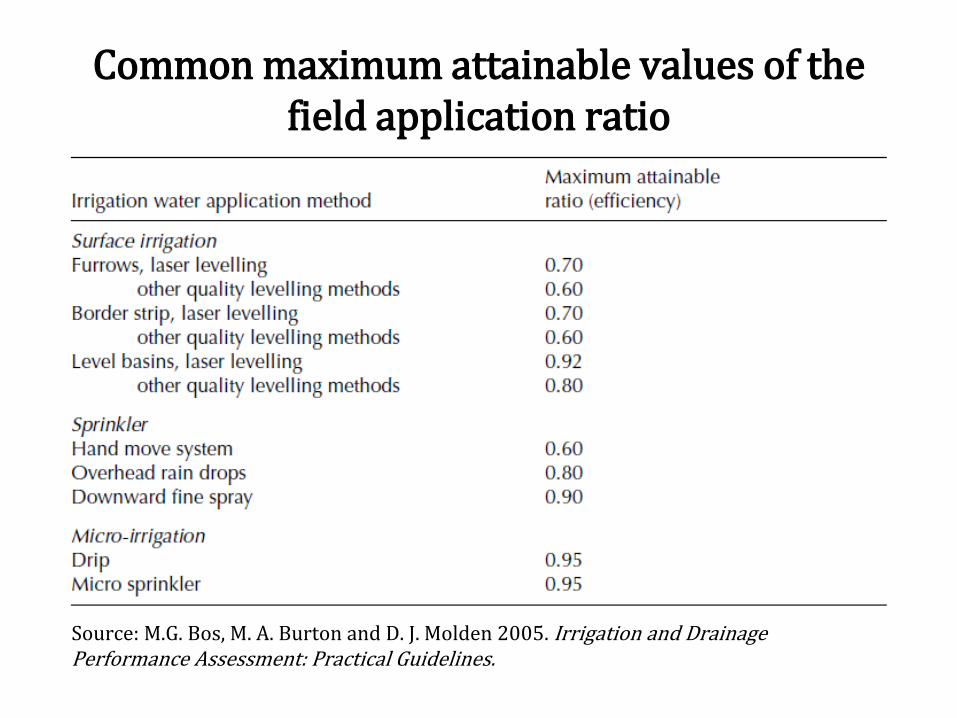
Common maximum attainable values of the field application ratio
Source: M.G. Bos, M. A. Burton and D. J. Molden 2005. Irrigation and Drainage Performance Assessment: Practical Guidelines.
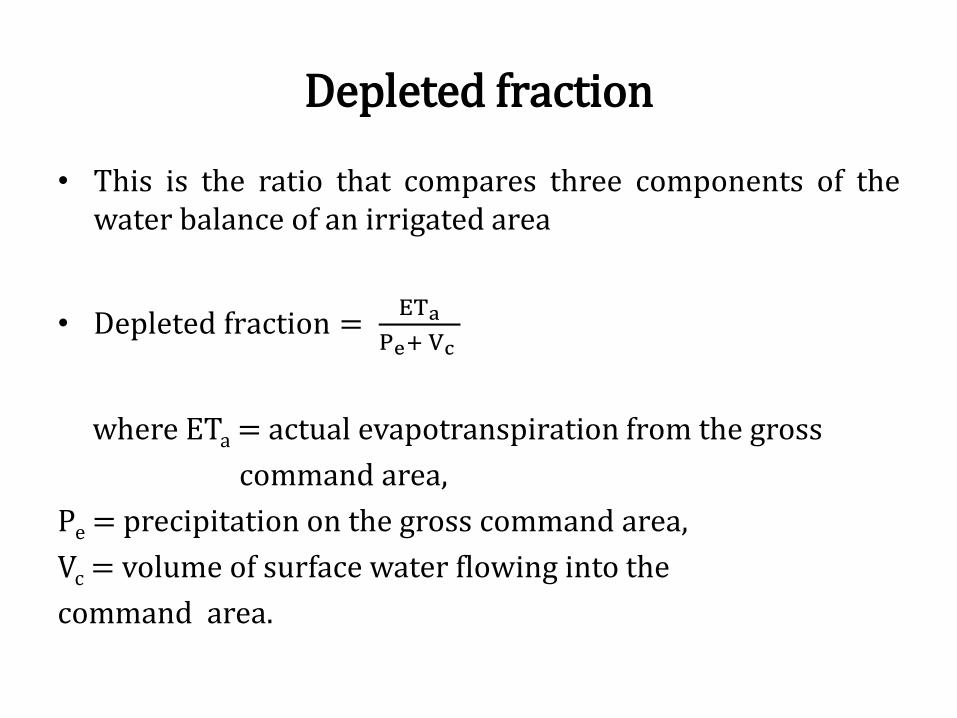
• This is the ratio that compares three components of the water balance of an irrigated area
• Depleted fraction = ETa
Pe+ Vc
where ETa = actual evapotranspiration from the gross
command area,
Pe = precipitation on the gross command area,
Vc = volume of surface water flowing into the
command area.
Depleted fraction
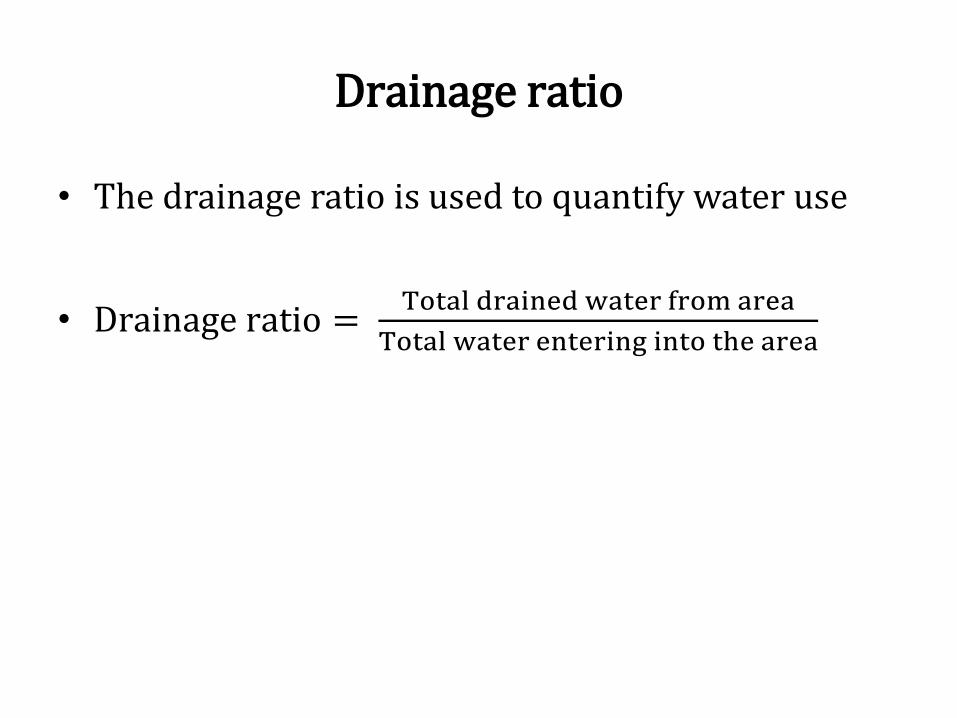
• The drainage ratio is used to quantify water use
• Drainage ratio = Total drained water from area
Total water entering into the area
Drainage ratio
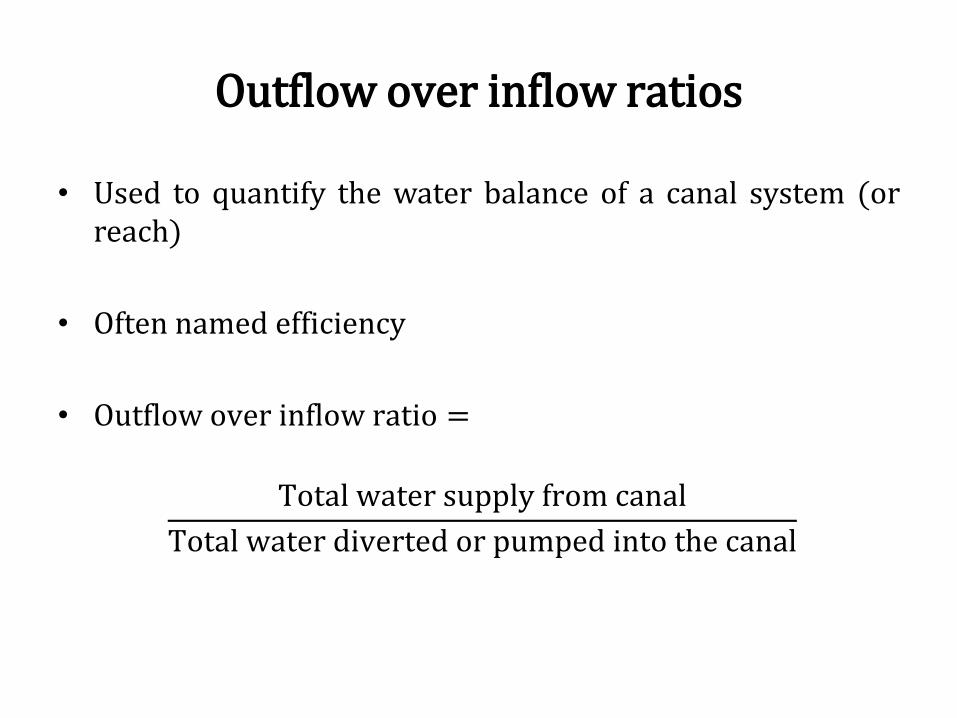
• Used to quantify the water balance of a canal system (or reach)
• Often named efficiency
• Outflow over inflow ratio =
Total water supply from canal
Total water diverted or pumped into the canal
Outflow over inflow ratios
• Enables a manager to determine the extent to which water is actually delivered as intended during a selected period and at any location in the system
• Delivery performance ratio = Actual flow of water
Intended flow of water
Delivery performance ratio
• This is the productivity in terms of actual evapotranspiration and in terms of the volume of supplied irrigation water
• Water productivity ET = Yield of harvested crop
ETactual
• Water productivity m3 = Yield of harvested crop
Volume of supplied irrigation water
Water productivity
Crop yield ratio = Actual crop yield
Intended crop yield
Crop yield ratio
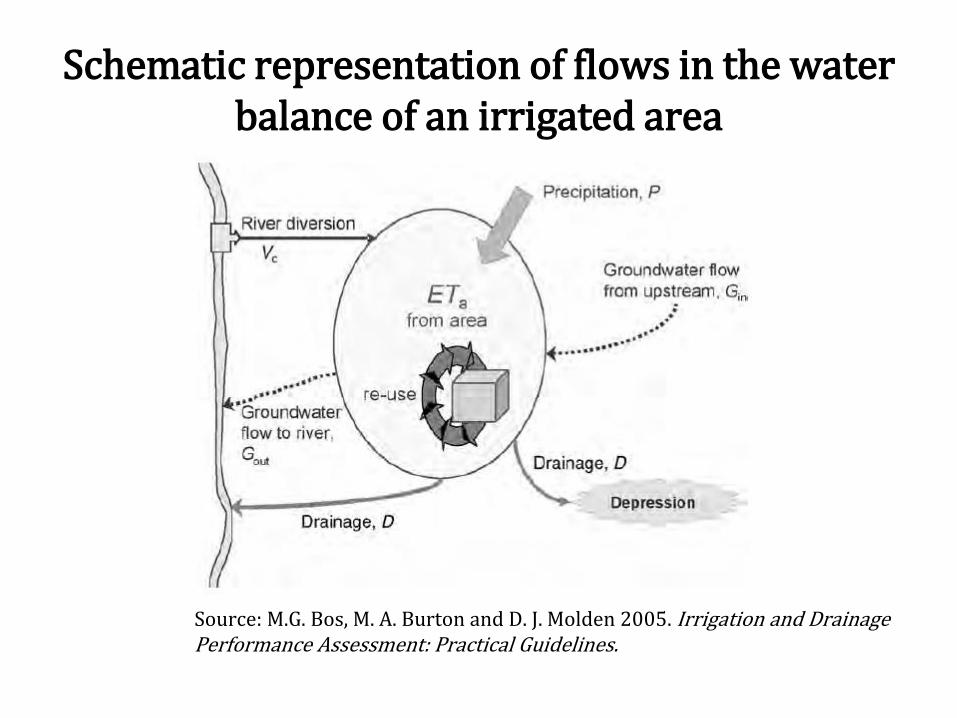
Schematic representation of flows in the water balance of an irrigated area
Source: M.G. Bos, M. A. Burton and D. J. Molden 2005. Irrigation and Drainage Performance Assessment: Practical Guidelines.

Key points in implementation of benchmarking of
irrigation projects
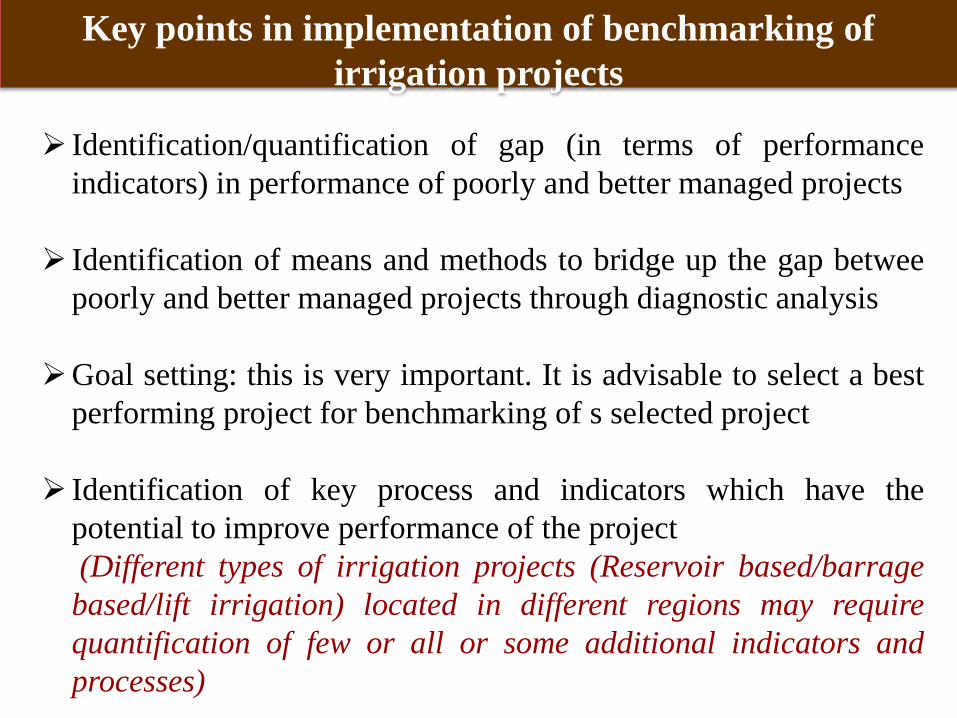
Identification/quantification of gap (in terms of performance
indicators) in performance of poorly and better managed projects
Identification of means and methods to bridge up the gap betwee
poorly and better managed projects through diagnostic analysis
Goal setting: this is very important. It is advisable to select a best
performing project for benchmarking of s selected project
Identification of key process and indicators which have the
potential to improve performance of the project
(Different types of irrigation projects (Reservoir based/barrage
based/lift irrigation) located in different regions may require
quantification of few or all or some additional indicators and
processes)
Key points in implementation of benchmarking of
irrigation projects
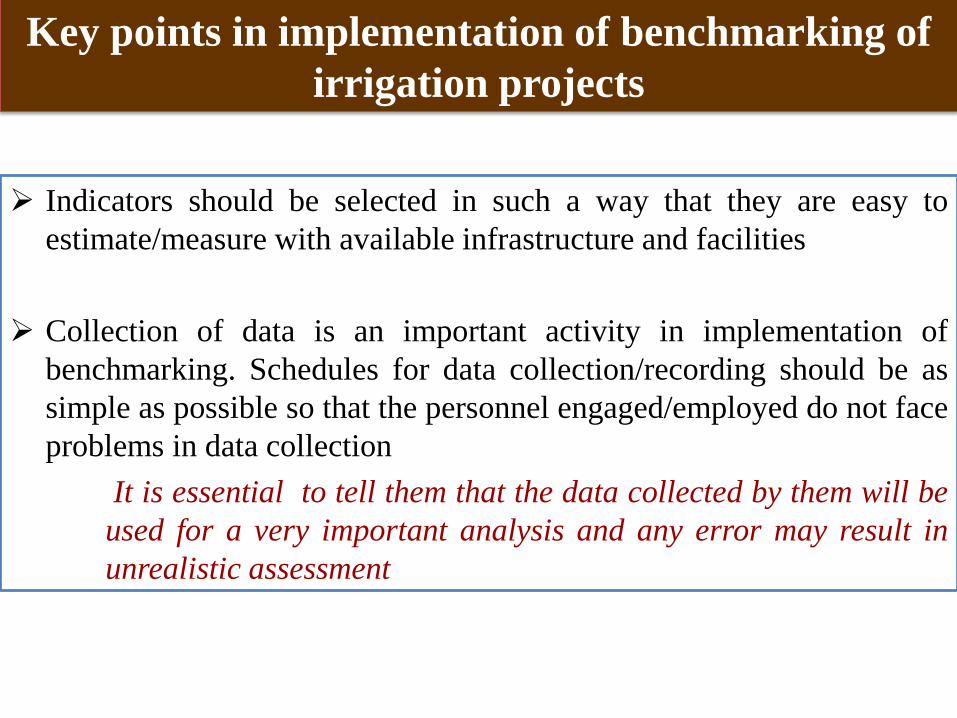
Indicators should be selected in such a way that they are easy to
estimate/measure with available infrastructure and facilities
Collection of data is an important activity in implementation of
benchmarking. Schedules for data collection/recording should be as
simple as possible so that the personnel engaged/employed do not face
problems in data collection
It is essential to tell them that the data collected by them will be
used for a very important analysis and any error may result in
unrealistic assessment
Steps in implementation of benchmarking
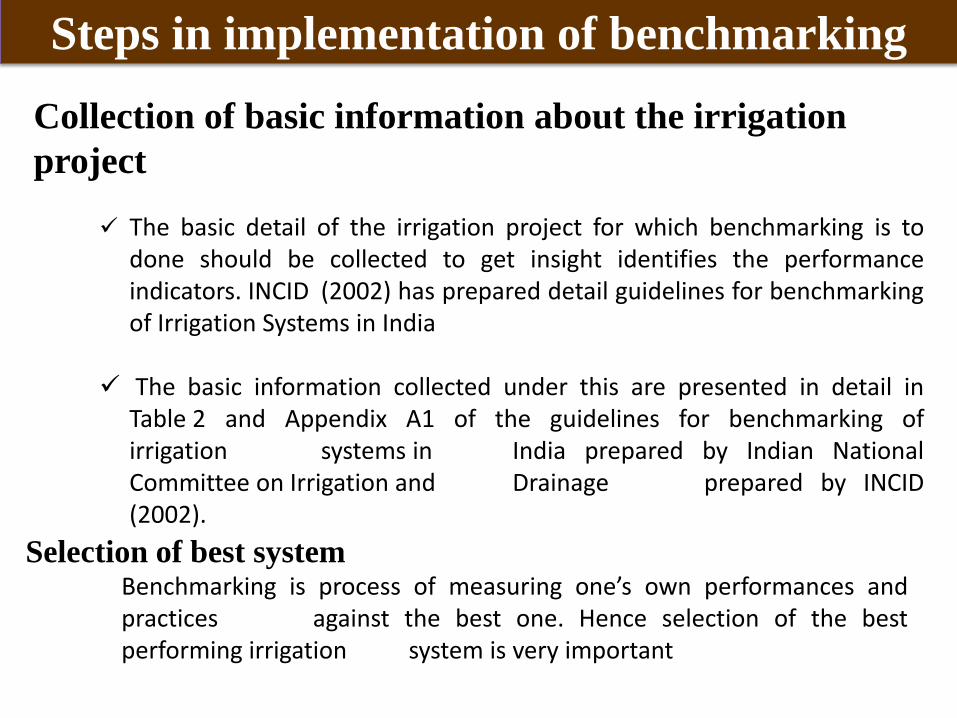
Collection of basic information about the irrigation
project
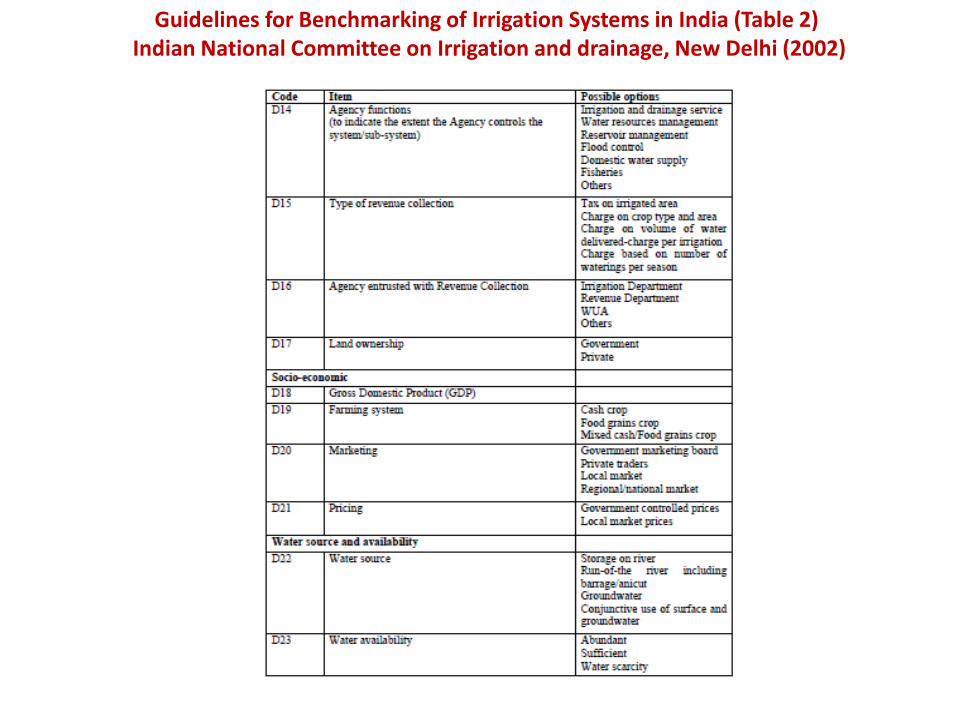
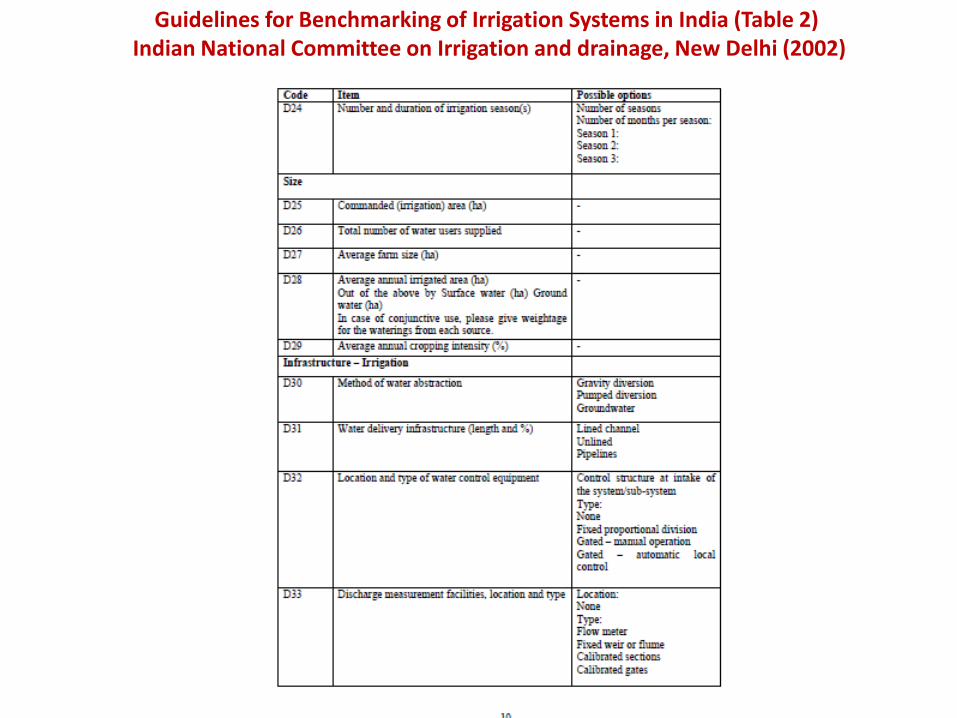
The basic detail of the irrigation project for which benchmarking is to done should be collected to get insight identifies the performance indicators. INCID (2002) has prepared detail guidelines for benchmarking of Irrigation Systems in India The basic information collected under this are presented in detail in Table 2 and Appendix A1 of the guidelines for benchmarking of irrigation systems in India prepared by Indian National Committee on Irrigation and Drainage prepared by INCID (2002).
Selection of best system Benchmarking is process of measuring one’s own performances and practices against the best one. Hence selection of the best performing irrigation system is very important
Data collection, processing and analysis
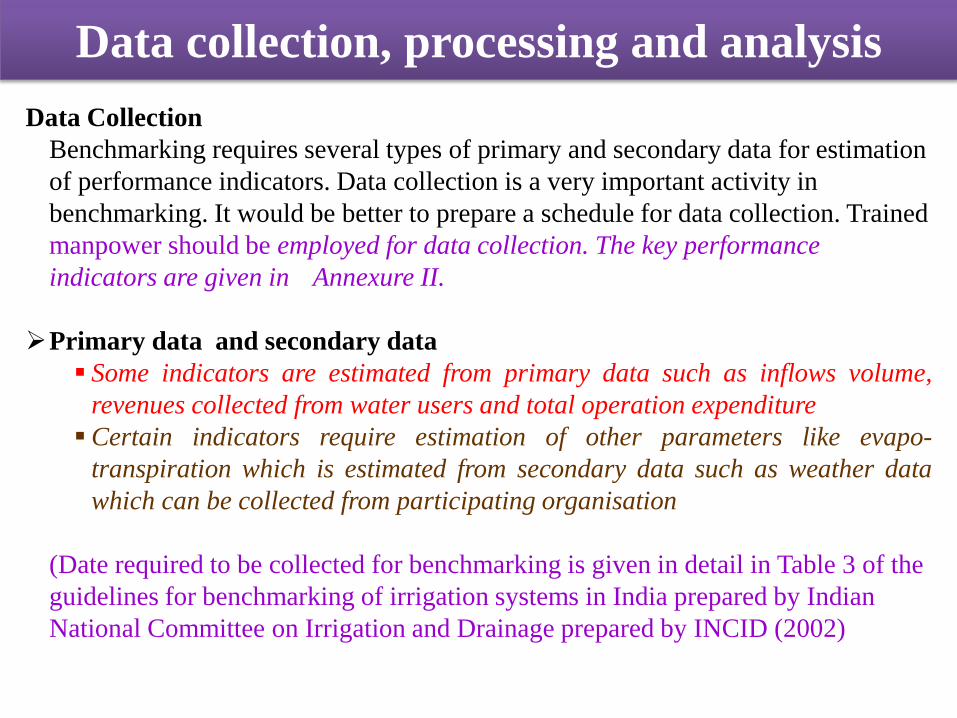
Data Collection
Benchmarking requires several types of primary and secondary data for estimation
of performance indicators. Data collection is a very important activity in
benchmarking. It would be better to prepare a schedule for data collection. Trained
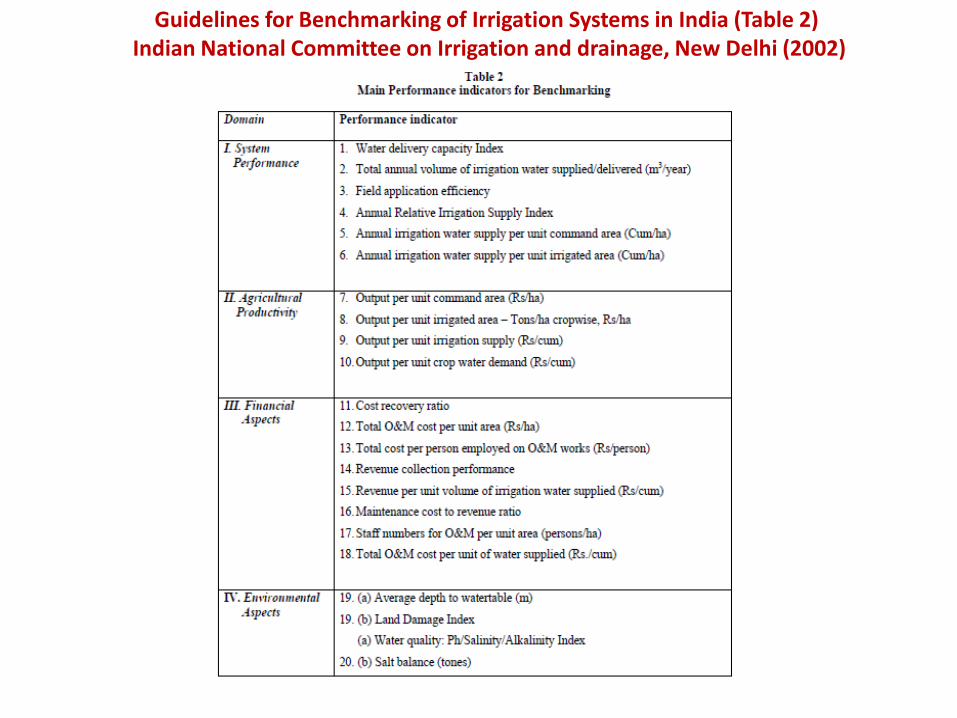
manpower should be employed for data collection. The key performance
indicators are given in Annexure II.
Primary data and secondary data
Some indicators are estimated from primary data such as inflows volume,
revenues collected from water users and total operation expenditure
Certain indicators require estimation of other parameters like evapo-
transpiration which is estimated from secondary data such as weather data
which can be collected from participating organisation
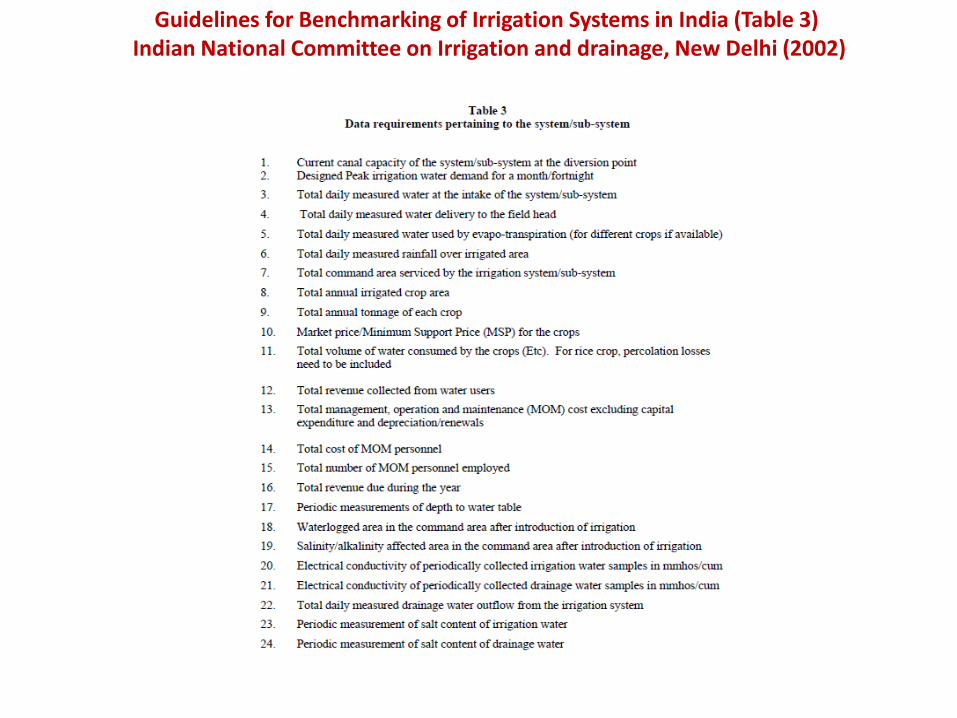
(Date required to be collected for benchmarking is given in detail in Table 3 of the
guidelines for benchmarking of irrigation systems in India prepared by Indian
National Committee on Irrigation and Drainage prepared by INCID (2002)
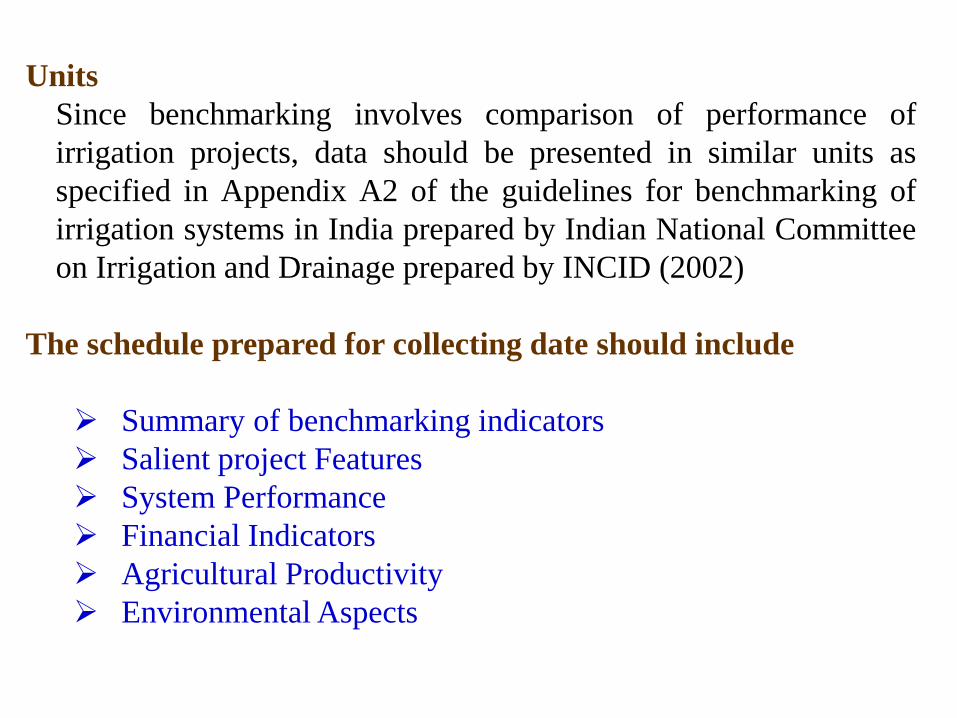
Units
Since benchmarking involves comparison of performance of
irrigation projects, data should be presented in similar units as
specified in Appendix A2 of the guidelines for benchmarking of
irrigation systems in India prepared by Indian National Committee
on Irrigation and Drainage prepared by INCID (2002)
The schedule prepared for collecting date should include
Summary of benchmarking indicators
Salient project Features
System Performance
Financial Indicators
Agricultural Productivity
Environmental Aspects
Analysis
In benchmarking, data analysis involves estimation of ratios
produce the value of the required performance indicator
Participating organizations might have collected data in different
format
These should be arranged in the manner outlined in Appendix A2
of the guidelines for benchmarking of irrigation systems in India
prepared by Indian National Committee on Irrigation and Drainage
prepared by INCID (2002)
Before analysis it necessary to do the auditing of collected data to
remove anomalies.
Programme implementation
After collection of data performance indicators are estimated as per
the benchmarking guidelines of by Indian National Committee on
Irrigation and Drainage prepared by INCID (2002)
Periodic reviews should be done so that the programme remains
flexible and relevant to the benchmarking partners. If required new
performance indicators may be included to ensure that emerging
issues and processes are taken care off.
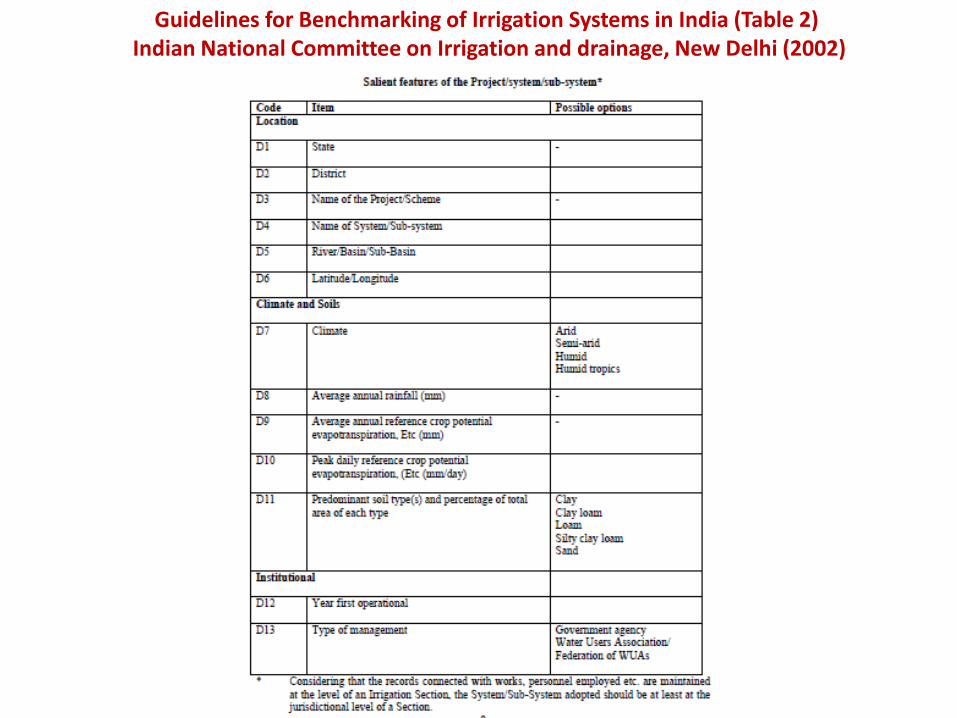
Guidelines for Benchmarking of Irrigation Systems in India (Table 2) Indian National Committee on Irrigation and drainage, New Delhi (2002)
Guidelines for Benchmarking of Irrigation Systems in India (Table 2) Indian National Committee on Irrigation and drainage, New Delhi (2002)
Guidelines for Benchmarking of Irrigation Systems in India (Table 2) Indian National Committee on Irrigation and drainage, New Delhi (2002)
Guidelines for Benchmarking of Irrigation Systems in India (Table 2) Indian National Committee on Irrigation and drainage, New Delhi (2002)
Guidelines for Benchmarking of Irrigation Systems in India (Table 3) Indian National Committee on Irrigation and drainage, New Delhi (2002)

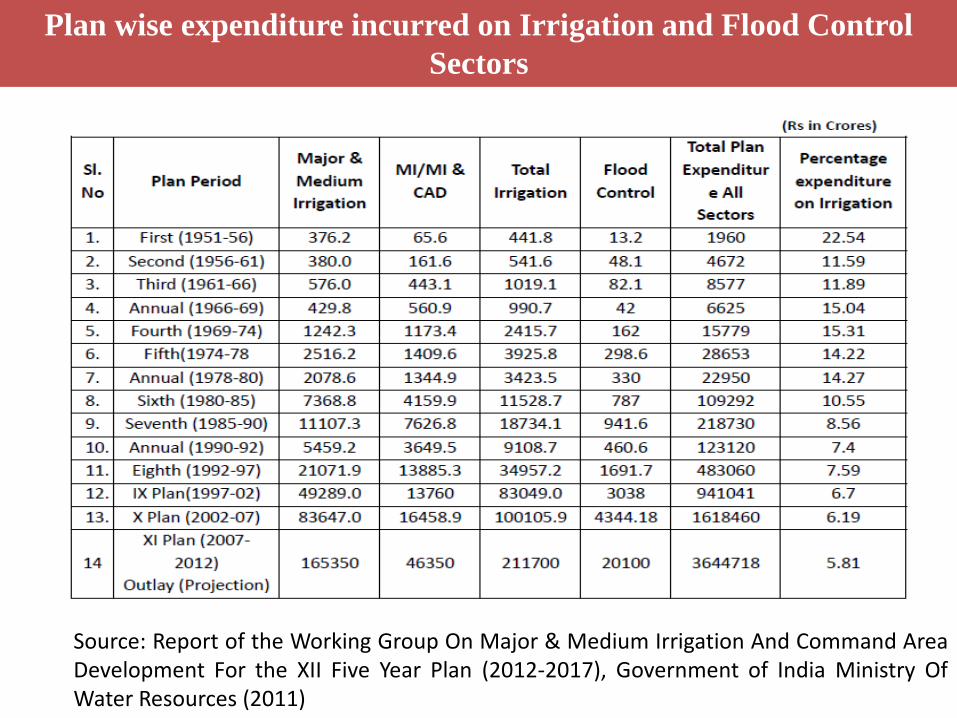
Plan wise expenditure incurred on Irrigation and Flood Control
Sectors
Source: Report of the Working Group On Major & Medium Irrigation And Command Area Development For the XII Five Year Plan (2012-2017), Government of India Ministry Of Water Resources (2011)
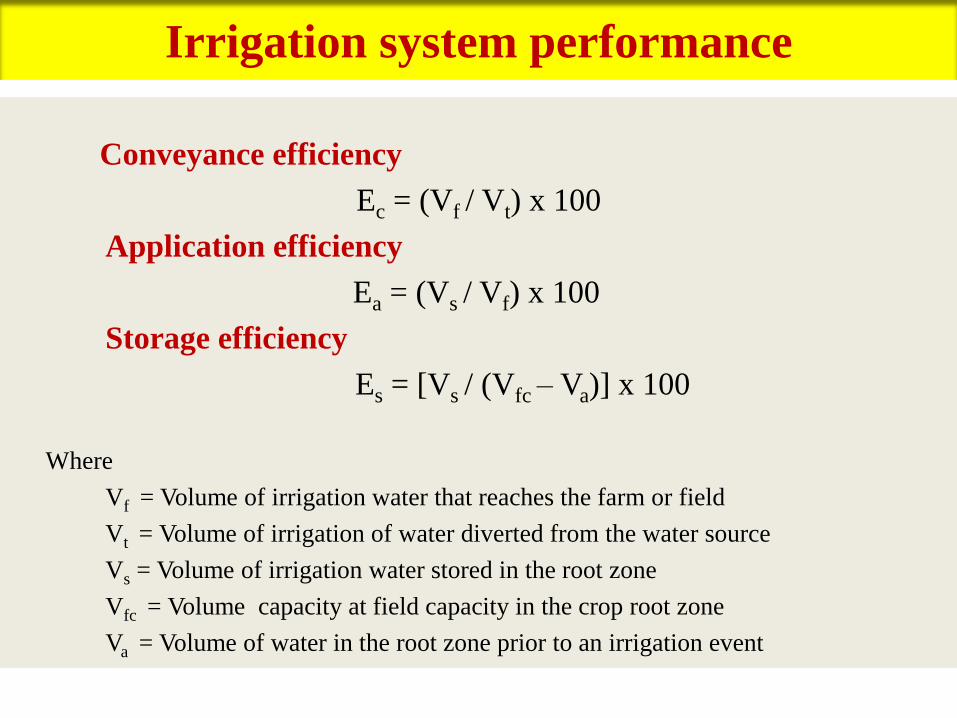
Irrigation system performance
Conveyance efficiency
Ec = (Vf / Vt) x 100
Application efficiency
Ea = (Vs / Vf) x 100
Storage efficiency
Es = [Vs / (Vfc – Va)] x 100
Where
Vf = Volume of irrigation water that reaches the farm or field
Vt = Volume of irrigation of water diverted from the water source
Vs = Volume of irrigation water stored in the root zone
Vfc = Volume capacity at field capacity in the crop root zone
Va = Volume of water in the root zone prior to an irrigation event
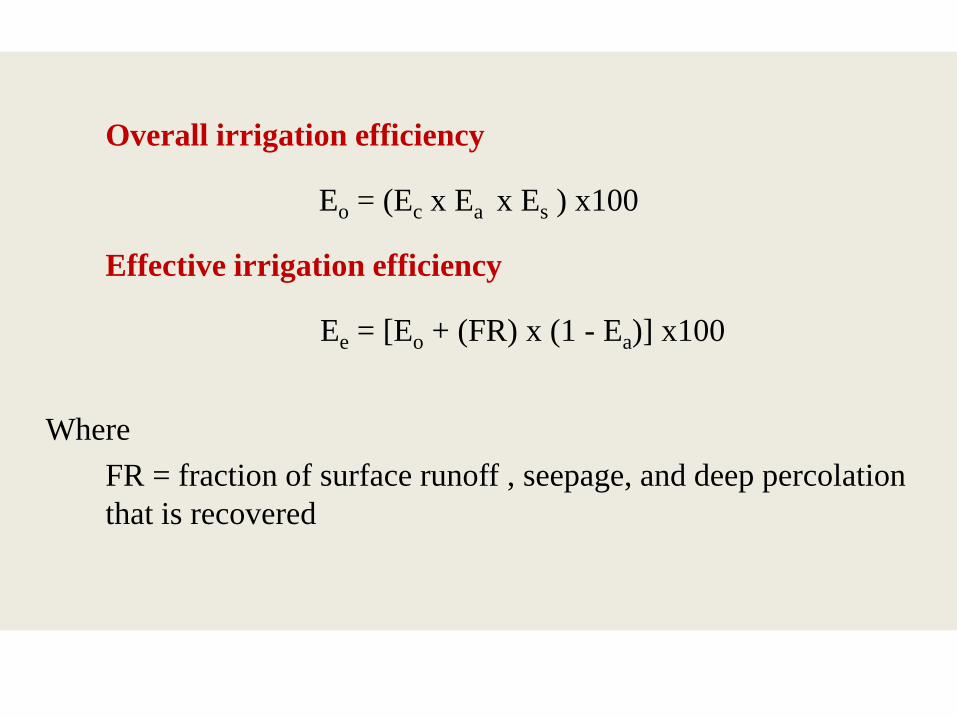
Overall irrigation efficiency
Eo = (Ec x Ea x Es ) x100
Effective irrigation efficiency
Ee = [Eo + (FR) x (1 - Ea)] x100
Where
FR = fraction of surface runoff , seepage, and deep percolation
that is recovered
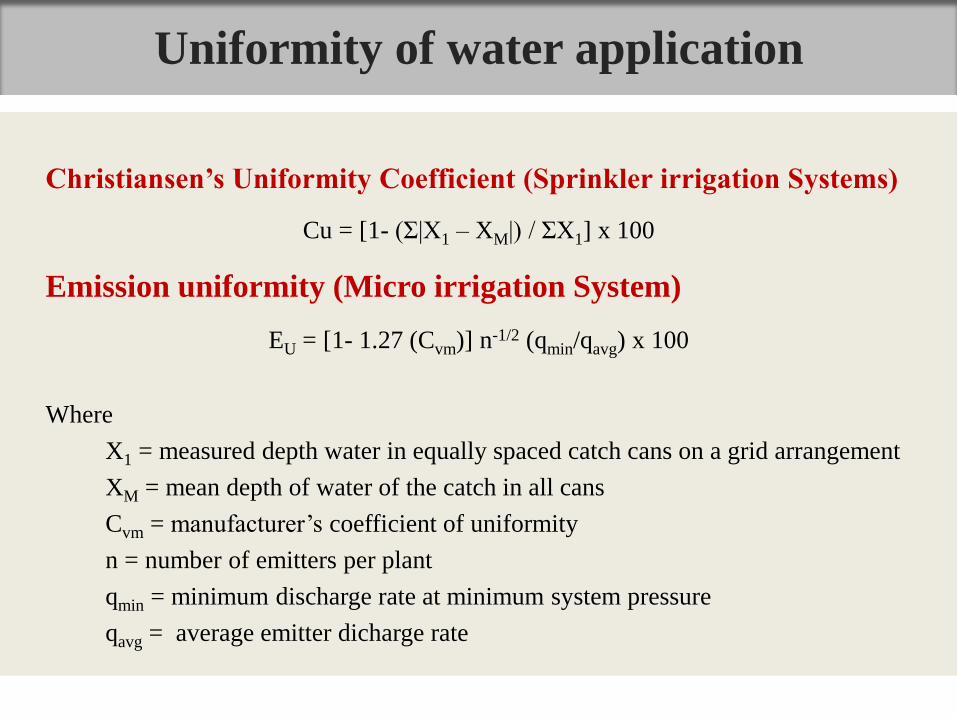
Uniformity of water application
Christiansen’s Uniformity Coefficient (Sprinkler irrigation Systems)
Cu = [1- (Ʃ|X1 – XM|) / ƩX1] x 100
Emission uniformity (Micro irrigation System)
EU = [1- 1.27 (Cvm)] n-1/2 (qmin/qavg) x 100
Where
X1 = measured depth water in equally spaced catch cans on a grid arrangement
XM = mean depth of water of the catch in all cans
Cvm = manufacturer’s coefficient of uniformity
n = number of emitters per plant
qmin = minimum discharge rate at minimum system pressure
qavg = average emitter dicharge rate
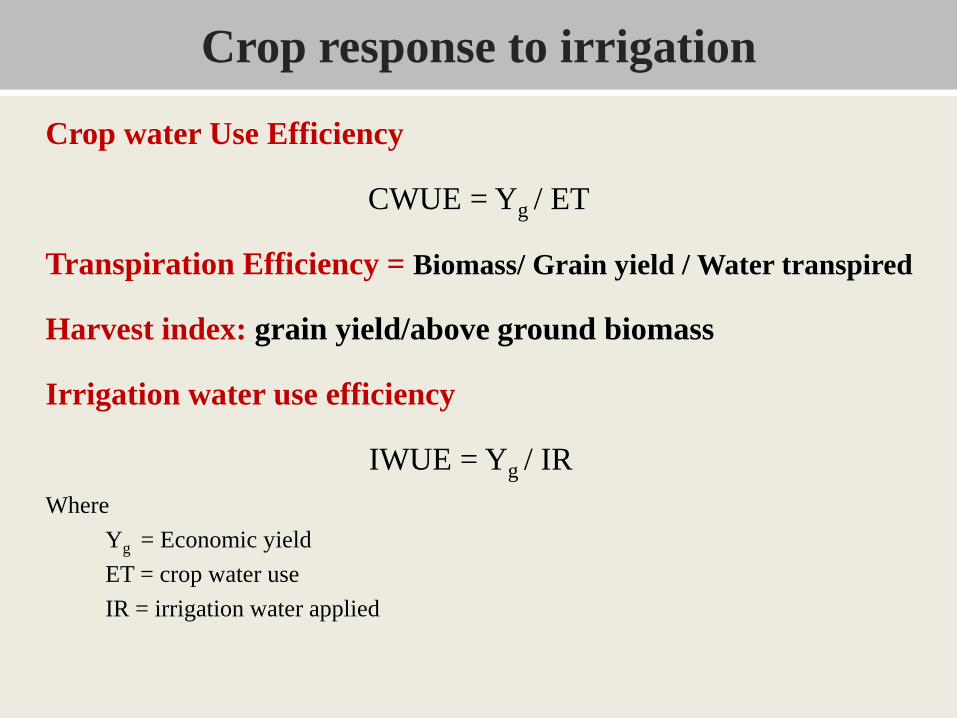
Crop response to irrigation
Crop water Use Efficiency
CWUE = Yg / ET
Transpiration Efficiency = Biomass/ Grain yield / Water transpired
Harvest index: grain yield/above ground biomass
Irrigation water use efficiency
IWUE = Yg / IR
Where
Yg = Economic yield
ET = crop water use
IR = irrigation water applied
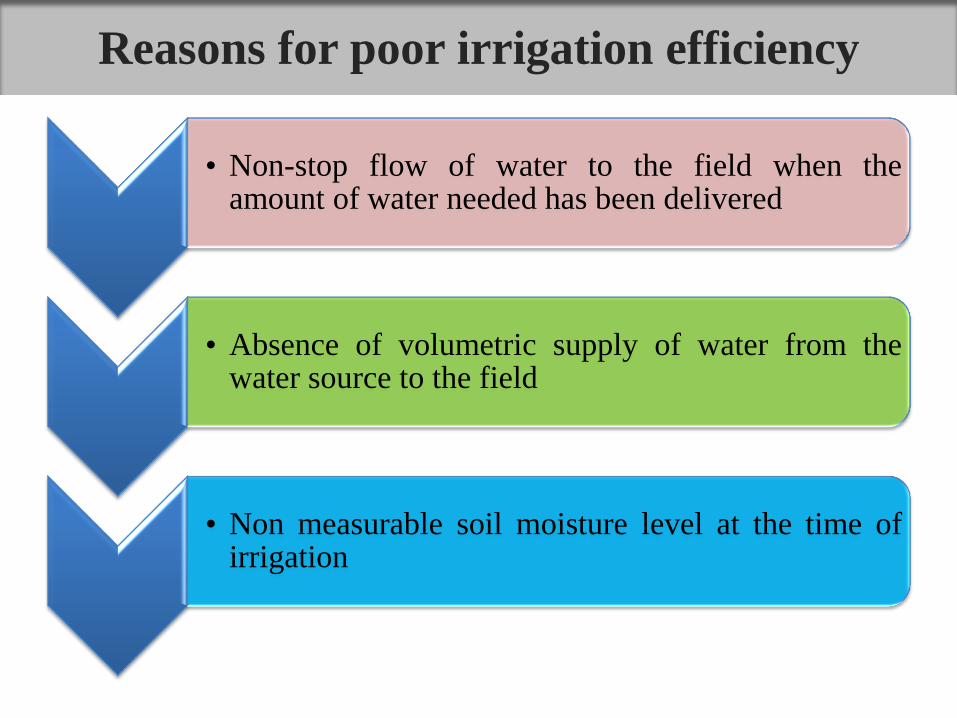
Reasons for poor irrigation efficiency
• Non-stop flow of water to the field when the amount of water needed has been delivered
• Absence of volumetric supply of water from the water source to the field
• Non measurable soil moisture level at the time of irrigation
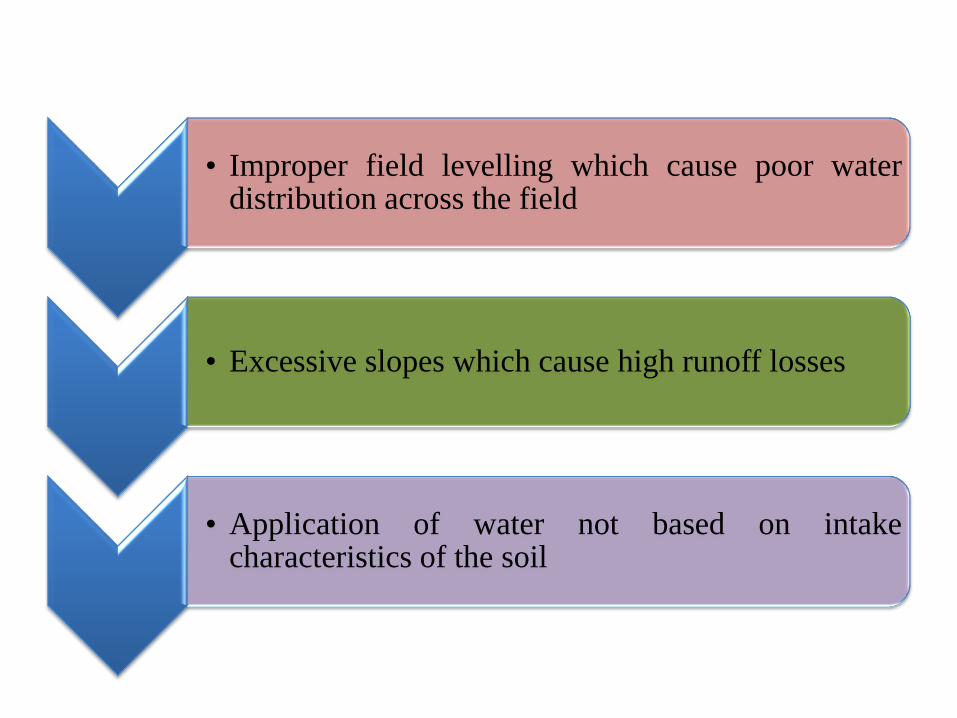
• Improper field levelling which cause poor water distribution across the field
• Excessive slopes which cause high runoff losses
• Application of water not based on intake characteristics of the soil
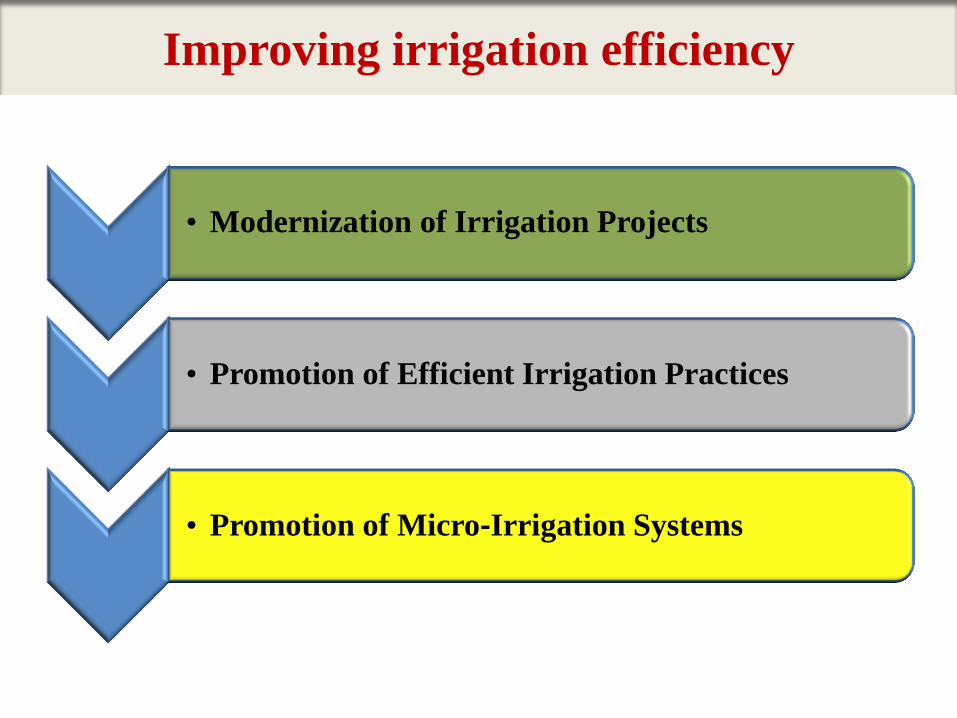
• Modernization of Irrigation Projects
• Promotion of Efficient Irrigation Practices
• Promotion of Micro‐Irrigation Systems
Improving irrigation efficiency
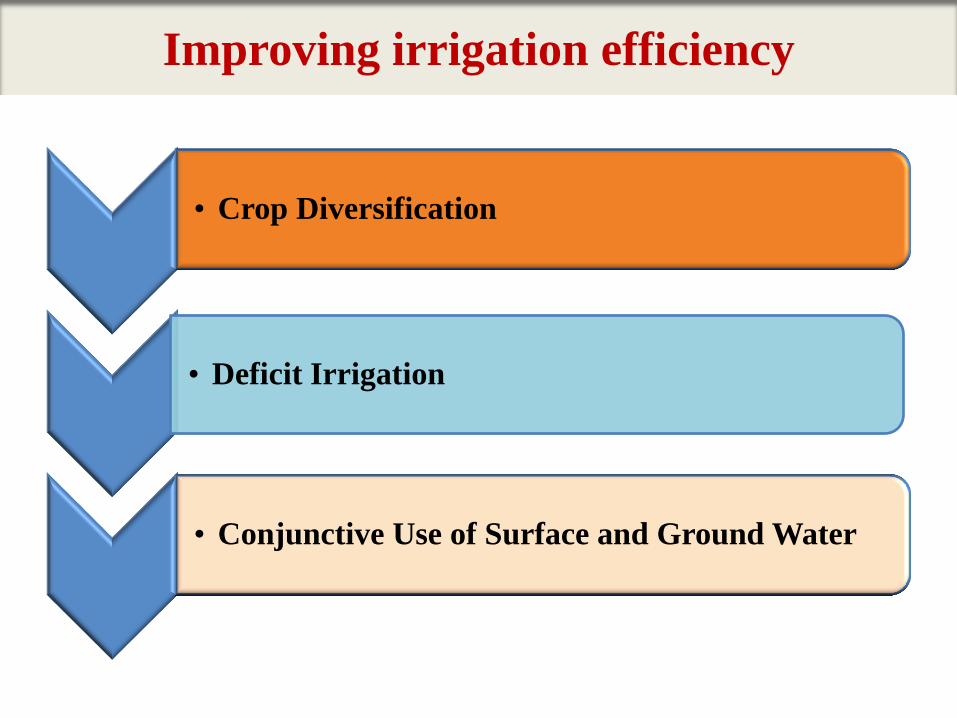
• Crop Diversification
• Deficit Irrigation
• Conjunctive Use of Surface and Ground Water
Improving irrigation efficiency
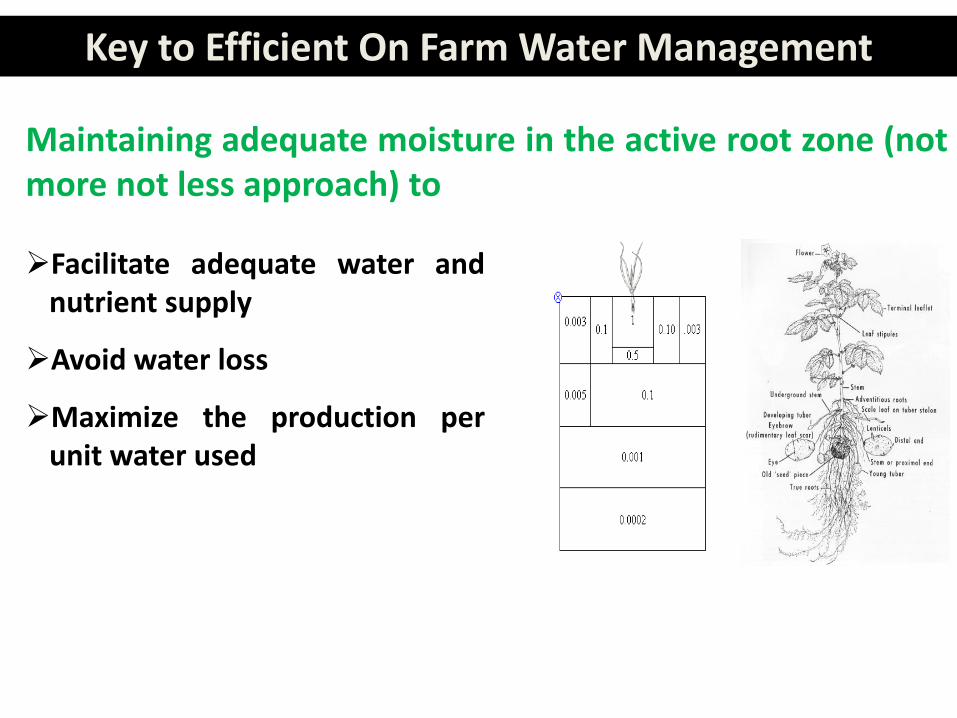
Key to Efficient On Farm Water Management
Maintaining adequate moisture in the active root zone (not more not less approach) to
Facilitate adequate water and nutrient supply
Avoid water loss
Maximize the production per unit water used
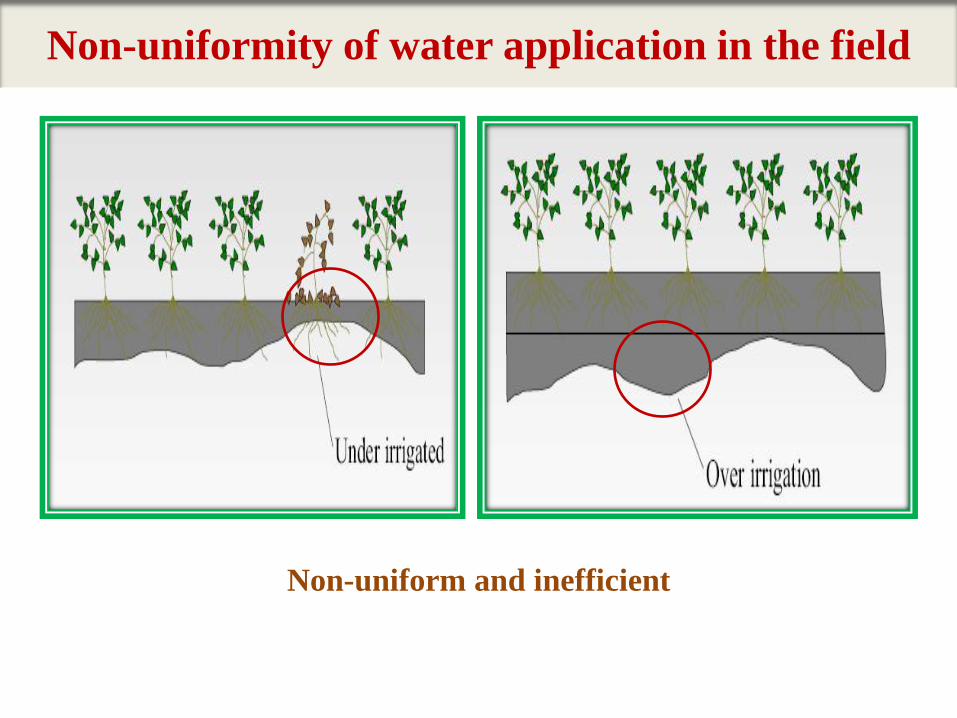
Non-uniformity of water application in the field
Non-uniform and inefficient
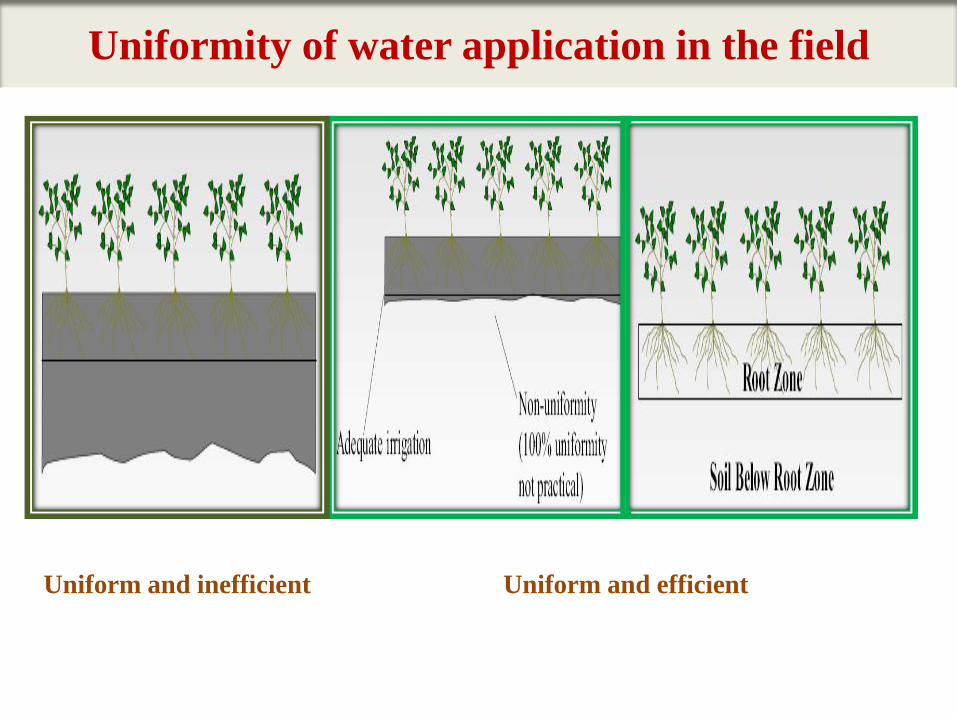
Uniformity of water application in the field
Uniform and efficient Uniform and inefficient
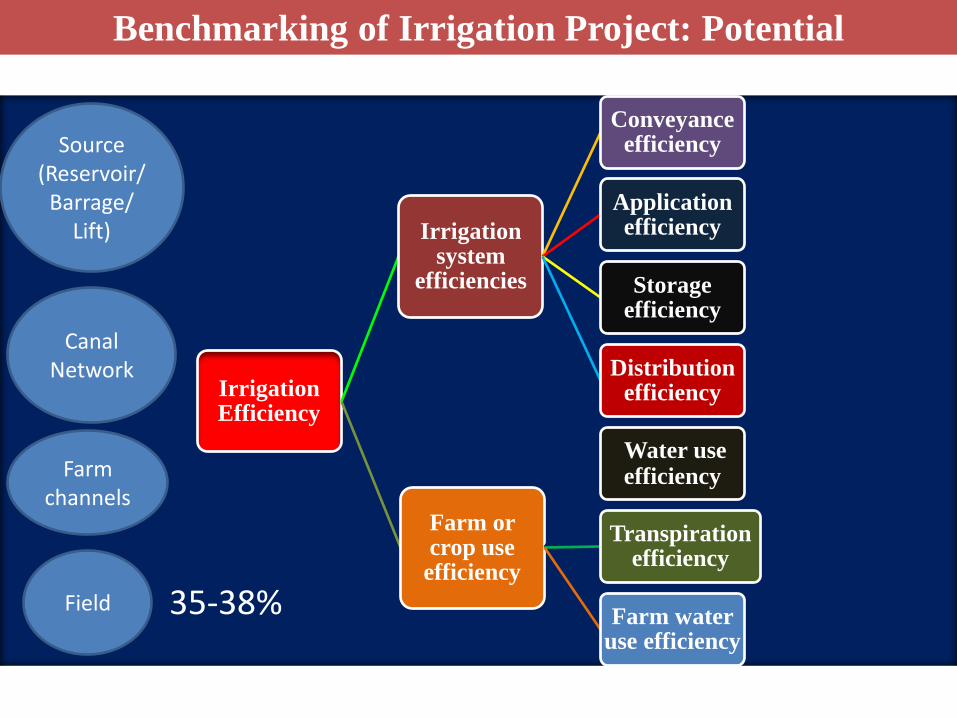
Irrigation Efficiency
Irrigation system
efficiencies
Conveyance efficiency
Application efficiency
Storage efficiency
Distribution efficiency
Farm or crop use
efficiency
Water use efficiency
Transpiration efficiency
Farm water use efficiency
Source (Reservoir/
Barrage/ Lift)
Canal Network
Field
Farm channels
35-38%
Benchmarking of Irrigation Project: Potential