benchmarking master slides - franchise.org · • reverse engineer “elite” customer...
TRANSCRIPT


BENCHMARKING MADE EASY –HOW BENCHMARKING CAN BOOSTFRANCHISE SYSTEM PERFORMANCE

SPEAKERS
Brian Spindel CFE President & COOBrian Spindel, CFE, President & COO,
PostNet International Franchise Corp.
Mi h l M I k P id & COOMichael M. Isakson, President & COO,
ServiceMaster Company
Catherine Monson, CEO, FASTSIGNS International
Mike Bidwell, CFE, President, The Dwyer Group
SESSION OVERVIEW
• Best Practices for ways to utilize• Best Practices for ways to utilize benchmarking to boost system performance
E l f h f hi• Examples of how franchise systems use benchmarking in different ways
• Highlights of OnTrack™ ‐‐ IFA’s new web‐based benchmarking service

ABOUT POSTNET
• Been franchising for 19 years• 750 locations in 8 countries• 750 locations in 8 countries• Used benchmarking extensively over the past 4 years for:years for:– Top Line Sales/AUV, Ranking, Transaction Counts, Average Transaction, Group Comparison, etc.
– Financial/Profitability, Expenses as a % of Sales, Gross Profit Margin, etc.
H d l d b t d hb d l l• Have developed robust dashboard regularly monitored by franchisees.

CUSTOMER RELATIONSHIP ANALYSIS
• Challenge ‐ Go from a pure transactional
model to a relationship modelmodel to a relationship model.
• Needed better/more customer data collection and accuracy at the POSaccuracy at the POS.
• Needed active customer feedback with system wide benchmarkingbenchmarking.
• Needed customer segmentation model to benchmark against system leaders.benchmark against system leaders.

OUR PLAN
• Learn what we don’t know• Learn what we don t know.
• Improve data collection at the POS and HQ levels.
• Put a system in place to inform and motivate• Put a system in place to inform and motivate Franchisees using benchmarking.
• Use information to grow our and franchisees• Use information to grow our and franchisees business.

STARTING POINT‐WHAT WE LEARNED
• Very little customer data being collected by franchisees.
• No importance placed on accuracy‐ data hygiene a problem.
• Customer data generally not linked/attached to i hitransaction history.
• No real understanding of customer behavior or t tisegmentation.
IMPROVING DATA COLLECTION AND ANALYSIS
• Worked with POS vendor and developed internal system of customer data.
• Needed to measure and compare New Customers to file (“capture”) and their behavior (“attachment” to transactions)transactions).
• Used CRM expert to develop “buckets” to segment customers based on RFMX scorescustomers based on RFMX scores.

CAPTURE AND ATTACHMENT

SEGMENTATION BENCHMARKING

BACK‐END ACTIONABLE DATA FOR FRANCHISEES
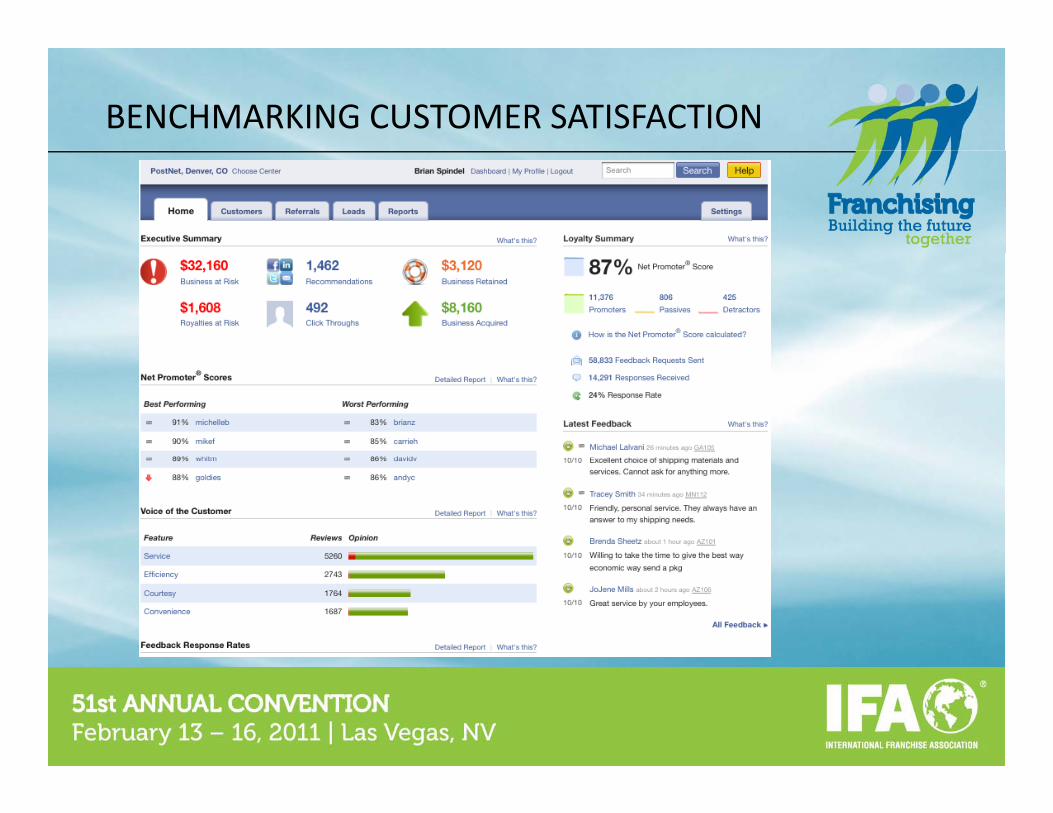
BENCHMARKING CUSTOMER SATISFACTION

CRM BENCHMARKING BENEFITS
• Reverse engineer “elite” customer demographics to identify and approve store locations.
• Better utilize the NAF and more effective local advertising by targeting customer groups with “elite” hcharacteristics.
• Franchisees more engaged in understanding t b d d t di h t th d tcustomer base and understanding what they need to
do to grow their businesses.

ABOUT SERVICEMASTER
• Been franchising for 58 years
l• 5,500 locations in 12 countries
• Use benchmarking extensively for: – Region Performance Quartiling
– Franchise Sales Lead to award sales
– Mid to Executive Compensation
– Franchise Network Groupsp

BENCHMARKING FRANCHISE NETWORK GROUPS
• Began October 2009
• Top 50 Disaster Restoration Businesses
• Meet in groups of ten at member location twice yearly
• Group webinars and video conferences pbetween meetings

PROGRAM GOALS
• Develop and achieve franchisee SMART p
goals (Specific, Measurable, Attainable, Realistic, Timely)
• Accelerated support for large franchise network participants
• Develop Disaster Restoration best business practices for implementation across the network
• Networking for most successful franchisees

KEY MEETING COMPONENTS
• Financial Key Performance Indicators
• SMART Goal Review• SMART Goal Review
• In‐Depth Host Business Presentation
E l S• Employee Survey
• Group Deep Dive (Examples: Managing a marketing/sales team Disaster Restorationmarketing/sales team, Disaster Restoration Profitability Study, Technician Training System)

FINANCIAL KPIS
Period Revenue CurrentDebt to
COGS% GPM % Prod Fixed Net DSO Prodivity /
Revenue
Expense
Marketing As Total
Measured Ratio Equity Labor % OH %
Profit % Employee
Growth %
Growth %
% of Revenue
Employeesq y p y
2010 YTD
Smith $10,756,111 1.91 1.23 61.5% 38.5% 22.4% 30.3% 9.1% 37.9 $82739 7.5% 3.2% 11.85% 130
Jones $8,270,233 1.24 0.08 54.00% 46.0% 14.0% 34.0% 12.0% 47 $123,436 ‐6.70% ‐2.00% 4.0% 67
Purple $6,749,417 4.46 0.21% 36.06% 63.94% 19.25% 53.19% 10.75% 52 $119,990 26.62% 14.89% 6.33% 75
White $3,832,000 7.90 0.47 43.00% 57.0% 16.0% 39.7% 17.30% $ 112,705 119.00% 101.00% 6.2% 34
Pink $7,396,226 1.06 8.67 61.32% 38.68% 21.51% 29.36% 9.32% 49 $99,612 14.56% ‐26.45% 2.53% 99
Blue $2,135,844 1.02 5.28 61.00% 39.00% 23.40% 22.70% 16.30% 76 $158,211 119.77% ‐8.83% 0.76% 18
Red $2,670,367 1.07 12.38 68.58% 31.42% 21.87% 30.21% 1.21% 42 $91,295 ‐18.16% ‐40.19% 4.31% 39
Orange $2,590,525 1.07 5.25 54.10% 45.90% 19.80% 34.00% 11.90% 35 $82,239 16.66% ‐0.71% 2.22% 42
Black $2,968,169 4.99 37.00% 55.40% 44.60% 17.70% 29.30% 15.30% 39 $87,299 9.00% 5.00% 4.64% 34
Brown $4,419,815 5.31 0.28 50.1% 49.9% 17.9% 44.8% 5.1% 70 $83,393 65.51% 9.34% 2.8% 53
Gray $1 953 884 6 14 0 10 48 00% 52 0% 19 8% 36 2% 15 8% 22 $93 042 24 58% 8 86% 1 3% 21Gray $1,953,884 6.14 0.10 48.00% 52.0% 19.8% 36.2% 15.8% 22 $93,042 ‐24.58% 8.86% 1.3% 21
Magenta $671,341 1.04 11.14 51.40% 48.6% 21.0% 64.0% ‐15.4% 91 $74,593 ‐77.38% ‐12.41% 3.2% 9
Yellow 4947,540. 2.31 ‐5.37 56.90% 43.1% 20.4% 48.1% ‐4.6% 54.64 $ 105,266 15.50% ‐5.60% 3.9% 57

SMART GOALS
ServiceMaster by Smith: Improve RAM capabilities to be able to manage multiple (3 vs. current capability of 1) out‐of‐state minicats & commercial projects w/o loss of local business.
1. Train all of our Restoration Project Managers to handle RAM j gcommercial losses (Completed by 4/1/10. Gerry owns.)
2. Strengthen our temp and subcontractor labor base for traveling purposes (by 4/1/10 – partially completed; will be fully completed by 7/1/10. Joe owns.)
3. Strengthen our own labor force for traveling purposes (On track to be completed by 7/1/10. Gerry owns.)
4 Id tif d t i t it j t dit (O t k t b4. Identify and train two onsite project auditors (On track to be completed by 7/1/10. Joe owns)

EMPLOYEE SURVEYS
ServiceMaster By Smith
I know how the company measures its performance.
Answer Options Response Percent Response Count
Strongly Agree37.5% 6
Mostly Agree25.0% 4
I know how the company measures its performance.
Strongly Agree
Agree25.0% 4
Mostly Disagree12.5% 2
Strongly Disagree0.0% 0
d ti 16Mostly Agree
Agree
M tl
answered question 16
skipped question 0
Mostly Disagree
Strongly Disagree

DEEP DIVE MARKETING KPIS
ServiceMaster by Jones Actual Q1 Goal Q1 Distance to Q1 Goal
LEADS 27 28 +1
JOBS 14 15 ‐1
Sales in $ $265713 $250000 106%
Agent Visits 443 500 ‐57Agent Visits 443 500 57
Face to Face Meetings 310 140 +170
New Contacts Made 179 210 31
866 Recover Accounts signed 5 5 ‐
ABOUT FASTSIGNS
• Been franchising for 26 years
l• 530 locations in 7 countries
• Used benchmarking with franchise partners extensively for:– Improve their profitability
– Improve their finance stability
– Improve the selling processp g p
– Improve customer satisfaction

ANNUAL FINANCIAL BENCHMARKING SURVEY
• Over 50% participation in 2009
• Calculate average and profit leaders• Calculate average and profit leaders
• Use Benchmarking results for training, coaching and motivationmotivation
• Awards at Convention based on profitability

INCOME STATEMENT BENCHMARKING2008 2009
Average Sales $688,543 $548,063
Cost of Goods 26.8% 26.5%
Labor Expense (includes Owner) 35.4% 36.2%
Advertising Expenses 4.5% 4.4%
Auto Expenses 1.5% 1.5%
Facility Expenses 7 5% 9 1%Facility Expenses 7.5% 9.1%
Equipment Expenses 1.4% 1.4%
G & A Expenses 13.3% 14.7%
Owner’s Discretionary Profit $113,132 $70,625
ODP % 16.4% 12.9%
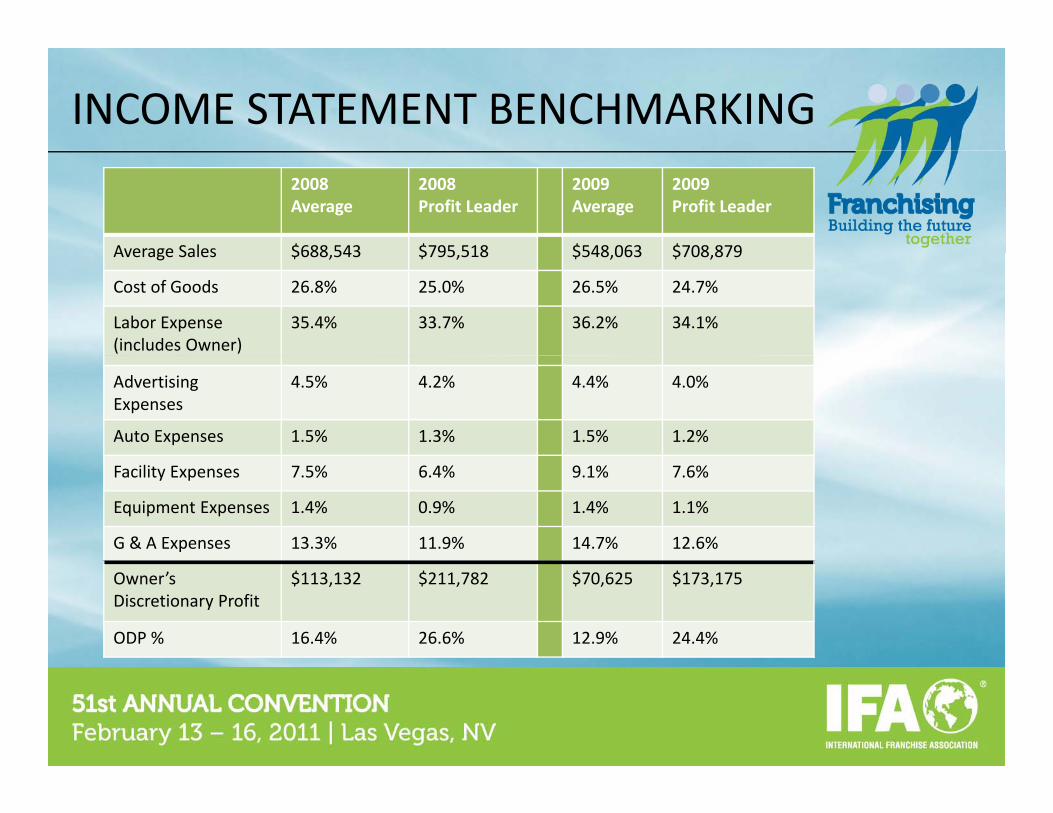
INCOME STATEMENT BENCHMARKING2008Average
2008Profit Leader
2009Average
2009 Profit Leader
Average Sales $688 543 $795 518 $548 063 $708 879Average Sales $688,543 $795,518 $548,063 $708,879
Cost of Goods 26.8% 25.0% 26.5% 24.7%
Labor Expense (includes Owner)
35.4% 33.7% 36.2% 34.1%
Advertising Expenses
4.5% 4.2% 4.4% 4.0%
Auto Expenses 1.5% 1.3% 1.5% 1.2%
Facility Expenses 7.5% 6.4% 9.1% 7.6%
Equipment Expenses 1.4% 0.9% 1.4% 1.1%
G & A Expenses 13.3% 11.9% 14.7% 12.6%
Owner’s Discretionary Profit
$113,132 $211,782 $70,625 $173,175
ODP % 16.4% 26.6% 12.9% 24.4%

BALANCE SHEET BENCHMARKING
• Current Ratio Target: 2:1• Current Ratio Target: 2:1
• Profit Leaders: 1.79:1
• Average: 1.26:1

POINT OF SALE BENCHMARKING
$• Average Invoice Target: $300
• Profit Leaders: $294.33
• Average: $259.77

POINT OF SALE BENCHMARKING
New vs. Repeat Customers• Center 7 years or older: 20% new• Center 7 years or older: 20% new
• Average: 31% new
P fit L d 22%• Profit Leaders: 22% new

POINT OF SALE BENCHMARKING
• Average AR Collection Days Target: 28
• Profit Leaders: 34
• Average: 46

POINT OF SALE BENCHMARKING
Customer Satisfaction Survey (1 to 5 scale)• Target: 4.75g
• Average: 4.51
• Profit Leaders: 4 74Profit Leaders: 4.74

ABOUT THE DWYER GROUP
• Been franchising for 30 years
l• 1290 locations
• 7 Franchise Brands
• Used benchmarking extensively for:Key statistic comparison across our companiesKey statistic comparison across our companies
Budgeting & planning
To establish target KPI’s for franchiseesTo establish target KPI s for franchisees

Key Statistics 2009 by Concept
Company A Company B Company C Company D Company E Company F TotalRevenues: Royalties 10,000,000$ 6,000,000$ 3,000,000$ 5,000,000$ 2,500,000$ 2,000,000$ 28,500,000$ Franchise Fees - Domestic 2,000,000 2,500,000 2,000,000 3,500,000 2,500,000 2,000,000 14,500,000
F hi F I t ti l 100 000 100 000 Franchise Fees - International 100,000 - - - - - 100,000 Franchise Fees - Transfers & Other 200,000 75,000 30,000 60,000 25,000 50,000 440,000 Other 300,000 400,000 200,000 400,000 300,000 250,000 1,850,000
Total 12,600,000$ 8,975,000$ 5,230,000$ 8,960,000$ 5,325,000$ 4,300,000$ 45,390,000$
EBITDA 5,000,000$ 2,500,000$ 500,000$ 3,000,000$ 1,000,000$ 250,000$ 12,250,000$
EBITDA / Revenues 39.7% 27.9% 9.6% 33.5% 18.8% 5.8% 27.0%
# of Franchisees (U. S. & Canada): Beginning of Year 279 178 176 190 176 156 1,155 Additions 36 34 35 60 48 39 252 Transfers (5) (4) (5) (2) (6) (9) (31) Terminations (16) (19) (23) (24) (28) (15) (125) End of Period 294 189 183 224 190 171 1,251
# of Support Personnel (1) 11 10 7 10 7 6 51
Franchisees per Support Person 26 18 26 21 26 27 24
Royalties per Support Person 909,091$ 600,000$ 428,571$ 500,000$ 357,143$ 333,333$ 558,824$
End of Period: # of Direct Support Employees (3) 10 9 6 9 6 5 45 Franchisees per Franchise Consultant 29 21 30 25 28 33 28
Avg. Monthly Domestic Franchise Sales 124,767$ 125,788$ 142,988$ 307,295$ 145,213$ 161,370$ 1,007,419$
# of Salespeople (2) 3 3 5 5 5 4 25.0
Avg. Monthly Sales per Salesperson 41,589$ 41,929$ 28,598$ 61,459$ 29,043$ 40,342$ 40,297$
Selling Expenses 1,160,293$ 1,162,011$ 1,175,971$ 1,996,367$ 1,409,274$ 1,530,011$ 8,433,927$
Selling Expenses / Franchise Sales 58.0% 46.5% 58.8% 57.0% 56.4% 76.5% 58.2%
U. S. and Canada Systemwide Sales 250,000,000$ 125,000,000$ 60,000,000$ 58,000,000$ 61,600,000$ 33,000,000$ 587,600,000$
U. S. and Canada Sales per Franchisee 875,000$ 675,000$ 325,000$ 280,193$ 336,612$ 201,835$ 488,446$
Support Overhead 1,350,000$ 1,200,000$ 950,000$ 1,297,625$ 942,346$ 677,090$ 6,417,061$
Support Overhead / Systemwide Sales 0.5% 1.0% 1.6% 2.2% 1.5% 2.1% 1.1%
Support Overhead / Royalties 13.5% 20.0% 31.7% 26.0% 37.7% 33.9% 22.5%
Bad Debts 750,000$ 1,000,000$ 400,000$ 457,169$ 406,131$ 405,315$ 3,418,615$
Bad Debts / Revenues 6.0% 11.1% 7.6% 5.1% 7.6% 9.4% 7.5%
Job Average 420$ 250$ 650$ 1,040$ 641$ 152$ N/A
Population of U. S. Territories Sold 188,000,000 177,000,000 81,000,000 65,000,000 41,400,000 58,600,000 611,000,000
% of U. S. (Assume 280 Million Salable) 67.1% 63.2% 28.9% 23.2% 14.8% 20.9% N/A
U. S. Sales per Capita 1.19$ 0.69$ 0.71$ 0.89$ 1.49$ 0.56$ 0.92$ Per Capita High Water Mark 8.72$ 7.24$ 8.85$ 16.64$ 8.27$ 2.29$ 8.67$
International Systemwide Sales 30,000,000$ -$ 10,000,000$ 165,000,000$ 167,000$ -$ 205,167,000$
# of International Franchisees 93 0 59 122 14 0 288
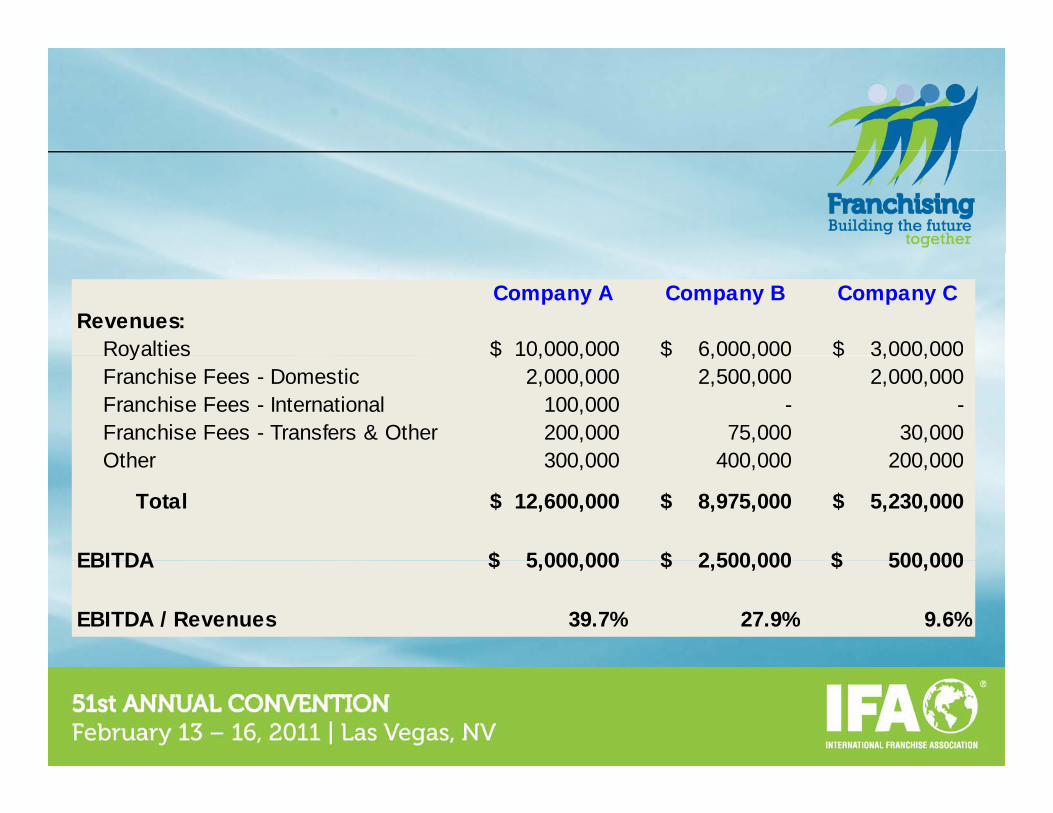
Company A Company B Company CRevenues:
Royalties 10,000,000$ 6,000,000$ 3,000,000$ Royalties 10,000,000$ 6,000,000$ 3,000,000$ Franchise Fees - Domestic 2,000,000 2,500,000 2,000,000 Franchise Fees - International 100,000 - - Franchise Fees - Transfers & Other 200,000 75,000 30,000
Other 300 000 400 000 200 000 Other 300,000 400,000 200,000
Total 12,600,000$ 8,975,000$ 5,230,000$
EBITDA 5 000 000$ 2 500 000$ 500 000$EBITDA 5,000,000$ 2,500,000$ 500,000$
EBITDA / Revenues 39.7% 27.9% 9.6%

U. S. and Canada Systemwide Sales 250,000,000$ 125,000,000$ 60,000,000$
U. S. and Canada Sales per Franchisee 875,000$ 675,000$ 325,000$
Support Overhead 1,350,000$ 1,200,000$ 950,000$
Support Overhead / Systemwide Sales 0.5% 1.0% 1.6%
Support Overhead / Royalties 13.5% 20.0% 31.7%Support Overhead / Royalties 13.5% 20.0% 31.7%

# of Support Personnel (1) 11 10 7
Franchisees per Support Person 26 18 26
Royalties per Support Person 909,091$ 600,000$ 428,571$
End of Period: # of Direct Support Employees (3) 10 9 6
Franchisees per Franchise Consultant 29 21 30 Franchisees per Franchise Consultant 29 21 30

# of Salespeople (2) 3 3 5
Avg. Monthly Sales per Salesperson 41,589$ 41,929$ 28,598$
Selling Expenses 1,160,293$ 1,162,011$ 1,175,971$
Selling Expenses / Franchise Sales 58.0% 46.5% 58.8%
Population of U. S. Territories Sold 188,000,000 177,000,000 81,000,000
% of U. S. (Assume 280 Million Salable) 67.1% 63.2% 28.9%
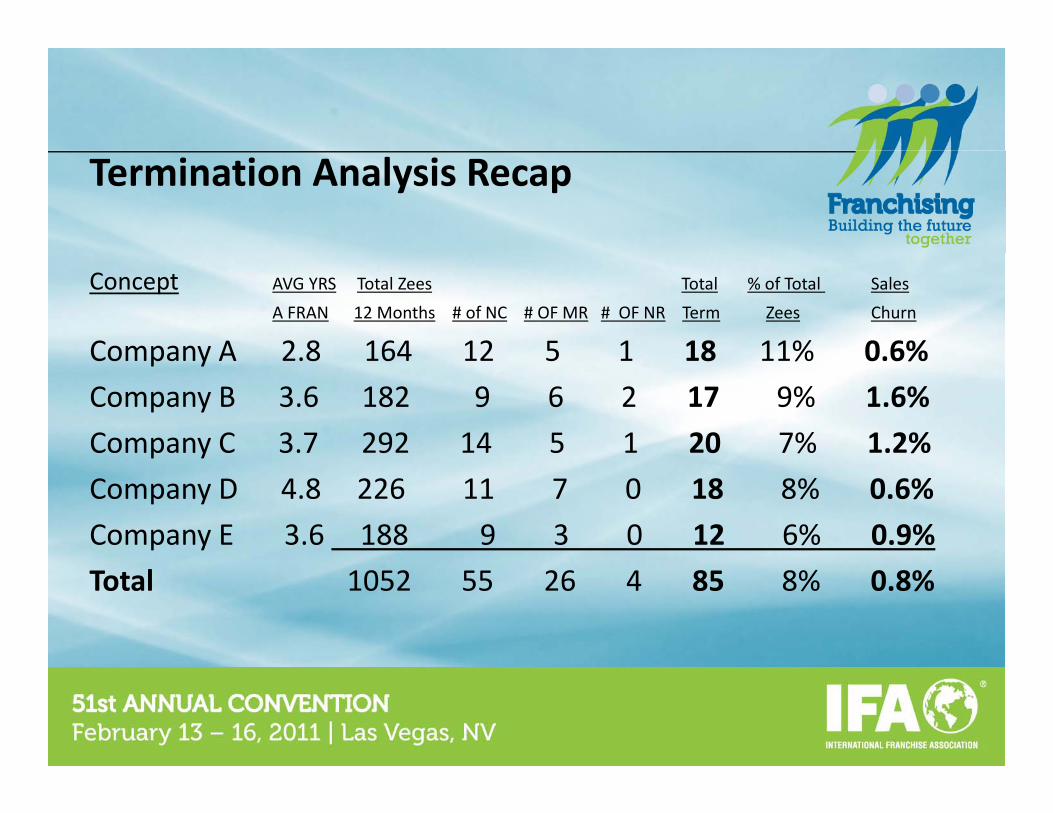
Termination Analysis Recap
Concept AVG YRS Total Zees Total % of Total Sales
A FRAN 12 Months # of NC # OF MR # OF NR Term Zees Churn
Company A 2 8 164 12 5 1 18 11% 0 6%Company A 2.8 164 12 5 1 18 11% 0.6%
Company B 3.6 182 9 6 2 17 9% 1.6%
Company C 3.7 292 14 5 1 20 7% 1.2%p y
Company D 4.8 226 11 7 0 18 8% 0.6%
Company E 3.6 188 9 3 0 12 6% 0.9%
Total 1052 55 26 4 85 8% 0.8%

2010 T12 2011 Budget 2010 T12 2011 Budget 2010 T12 2011 BudgetCOMPANY AVERAGECompany BCompany A
Travel per Zee 180 175 245 290 175 190
Travel per Zee 650 850 800 950 1,100 800
Meals per Zee 150 175 300 220 230 180
Franchise Relations per 40 45 20 30 75 55

TRIP REPORT2011 BUDGET
Company A Company B Company C Average
Trip Count 140 150 2006301 Travel 145,000 180,000 275,0006201 Meals and Entertainment 28,000 45,000 65,000, , ,
Cost per Trip 1,200 1,500 1,700 1,344
Travel per Trip 1,036 1,200 1,375 1,096Meals/Entertainment per Trip 200 300 325 251

On Track™ is a free online benchmarking tool for IFA members ‐‐
• Compare the performance of your franchise system to your peers.• View KPIs by system size, business category, totalView KPIs by system size, business category, total revenue, investment cost, and years in franchising.• Get analysis on unit metrics, lead costs, expenses, and employee allocationsemployee allocations.• Access 24/7 with an easy to use interface for information when you need it.

SEGUE – ONTRACK HIGHLIGHTS
• Benchmarking Task Force shared data and identified key i id f l f f himetrics to provide most useful KPIs for franchisors.
• Focused on ways to decrease time required for gathering data and using reports and charts.and using reports and charts.
• Developed criteria and selected software vendor, Dynamic Benchmarking, to create web‐based platform.
• Pilot group of IFA members tested and refined OnTrack™ prior to release at IFA Convention.

Using On Track™ is easy• Log into On Track™ via the IFA website using a unique user
d d iname and password to protect privacy• Enter your key performance data. Data entry time should not
exceed 30‐45 minutes.• Compare your performance to your peers by ‐‐
• Primary Line of Business / Number of Franchised Units /• Franchise Investment Cost / Years in Franchising / Total RevenueFranchise Investment Cost / Years in Franchising / Total Revenue
• Download reports on revenue, operations expenses, financial KPI’s and more

My Company ‐ Enter yourMy Company Enter your data
Compare Companies ‐Compare your company to
ADD SCREENSHOT HERE –p y p y
others in the database
Reports and Charts ‐Download PowerPoint
ONTRACK GATEWAY PAGEcharts with ratio analysis
• On Track’s questions are grouped intoOn Track s questions are grouped into major categories. • Click on the gray sub‐groups to begin data entry.

Line charts display your results compared to your peers using 25th Percentile, Median, 75th Percentile, and your company’s results (in blue)

Use filters to compare your company to groups of other companies.
Select one filter, two filters or all of the filters to create a peer group that provides meaningful performance comparison.
Create scenarios for comparisons to groups of companies that are similar to yours, bigger, smaller, different industry – it is your choice!

PowerPoint charts designed by the IFA are ready to download and use f il i tifor email communication, presentations, and capturing historic snapshots.
These charts provide valuable peer comparison information with datainformation with data analysis, ratios and key performance indicators.

Over 25 individual charts display performance comparisons for ‐‐• Revenue• Revenue• Operations expenses• Financial KPIs• Employees• Sales

SEGUE – ONTRACK HIGHLIGHTS
Summary –
• Decision‐making tool for improving performance through peerDecision making tool for improving performance through peer comparisons.
• Professional reports for viewing and downloading.
• Valuable financial and employee‐related KPIs by company’s size, business category, franchise investment cost, level of revenue and years in franchisingrevenue and years in franchising.
• Simple and intuitive user interface with 24/7 information availability .

WHAT IFA MEMBERS SAY. . .
“Many thanks to IFA for developing a great new service for IFAmembers. OnTrack is an easy to use system. In less than an hour it y yprovided me with quality information for benchmarking.”Shelly Sun, CFE, CEO & Co‐Founder, Brightstar Franchising
“OnTrack is very user‐friendly, focusing on metrics that are important to franchisors such as franchise sales, operations, training and support. OnTrack gives franchisors a way to compare performance to other great IFA members.” Mik C l CFO d S i VP D i B dMike Carlet, CFO and Senior VP, Driven Brands
“OnTrack is an excellent benchmarking tool that IFA members can use to identify areas for improvement. It’s very easy to organize data and select reports andareas for improvement. It s very easy to organize data and select reports and charts with the click of a mouse.” Joe Bourdow, CFE, Senior Advisor, Valpak
