benchmarking in healthcare in healthcare... · 20resources/casestudies/xerox-benchmarking-1.htm...
TRANSCRIPT

Prof Anupam Sibal MD, FIAP, FIMSA, FRCP (Lon), FRCP (Glas), FRCPCH, FAAP
Group Medical Director, Apollo Hospitals Group
Clinical Professor
Faculty of Medicine and Health Sciences
Macquarie University, Sydney, Australia
Senior Consultant
Pediatric Gastroenterologist and Hepatologist
Apollo Centre for Advanced Pediatrics
Delhi, India
Benchmarking in Healthcare


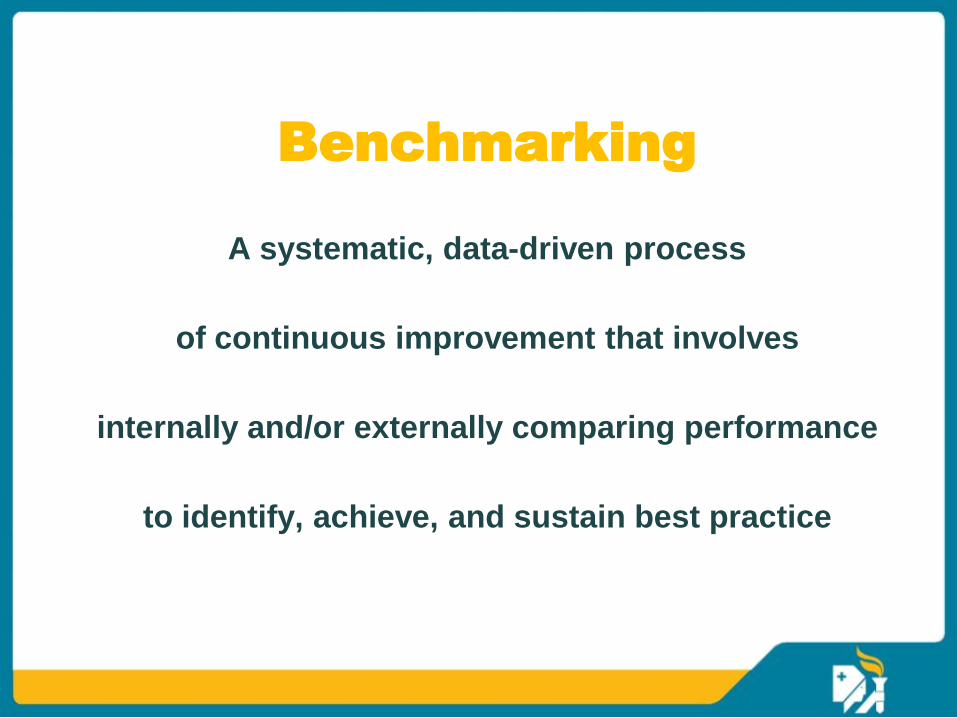
Benchmarking
A systematic, data-driven process
of continuous improvement that involves
internally and/or externally comparing performance
to identify, achieve, and sustain best practice

Efficiency
Measures
Time
Measures
Quality
Measures
The Measurement Philosophy
Contributing factors in the
operating environment
Driven by Strategic Vision
Establish quality mind set
Focused on Selected Core
Processes
Analytically based

Confusion

Establishing target performance level or benchmark to
evaluate current performance
Comparing these benchmarks
Translating data into action by informing performance
improvement initiatives


http://www.icmrindia.org/free%20resources/casestudies/xerox-benchmarking-1.htm
Company share in copier market dropped from 84% to 17% in
1974-1982
David Kearns took over as CEO in 1982
“Leadership through Quality”
Ten key factors, 67 sub-processes

American Express for billing and collection
Honda for supplier development
Toyota for quality management
Dupont for manufacturing safety
Sales improved from 152 - 328%
Deming Award
Malcolm Baldridge National Quality Award
European Quality Award
http://www.icmrindia.org/free%20resources/casestudies/xerox-benchmarking-1.htm

Refueling time between flights 40 minutes
Benchmarked refueling operations against NASCAR, a top performer pit
crew in Formula One
Performance determination
Singular focus of each employee or unique assignments
Great approach towards teamwork

Turned around refueling processes
Reduces refueling time between flights to 12 minutes, created
a benchmark for the entire industry

Average length of stay for inpatients
Nursing hours per inpatient day
Operating theatre utilization rate
Anesthetists to operating tables ratio
Occupancy rates in ICUs
Cost

Unplanned re-admission rate
Pre anesthetic consultation rate
Patient falls
Pressure ulcers
Needle stick injuries
Quality

Waiting times for emergency
Admission waiting time
Door to CT in head injury cases
Waiting times for physician consult
Length of stay post laparoscopic cholecystectomy
Time


A Well Planned Approach to
Benchmarking
Determining what to study
Forming a benchmarking team
Identifying benchmarking partners -
either external or internal
Collecting data
Analyzing data
Taking action
Clearly defined problem (key factor of success)
Staff commitment to the project
Quantitative and qualitative data
Well-defined process for data collection
Benchmark establishment
PDCA


The JCI Journey of the Apollo Group...
2005
2006
2012
2006
2008 2008
2007
2009
Indraprastha Apollo
Delhi
Apollo Chennai
Apollo Hyderabad
Apollo Ludhiana
Apollo Dhaka
Apollo Bangalore
Apollo Kolkata Apollo Mauritius
The first JCI accredited
hospital in India
The first JCI accredited
Stroke program in the
world
The first JCI accredited
hospital in Bangladesh 2016
Apollo Ahmedabad

Apollo Speciality
Hospitals
Madurai
ASH Nandanam,
Chennai
Apollo Hospitals
Ahmedabad
Apollo Hospitals
Noida
Apollo Hospitals
Secunderabad
Apollo Hospitals
Bilaspur
Apollo BGS
Hospitals
Mysore
Jehangir
Hospital Pune
Apollo Hospitals
Bhubaneswar
Apollo Hospital
Hyderguda
ASH, Vanagram
Chennai
Apollo Hospital,
Kakinada
Apollo Hospitals
Bhilai Apollo Hospital
Trichy
The NABH Journey of the Apollo Group...
Apollo Hospital
Nashik


What Patients Want
Excellent clinical outcomes
Value for money
Service quality

What Physicians Want
Excellent clinical outcomes
Patient experience - ‘wow’
Conducive milieu

What Health Insurance Wants
Excellent clinical outcomes
Lower pay outs
Retention of clients

The Common Bond
Clinical Outcomes

Clinical balanced scorecard
25 parameters assessed against international bench
marks
Apollo Light House
ACE@25

International Benchmarks
Cleveland Clinic
Mayo Clinic
National Healthcare Safety Network
Massachusetts General Hospital
AHRQ US
Columbia University Medical Center
US Census Bureau
National Kidney Foundation Disease Outcomes Quality Initiative
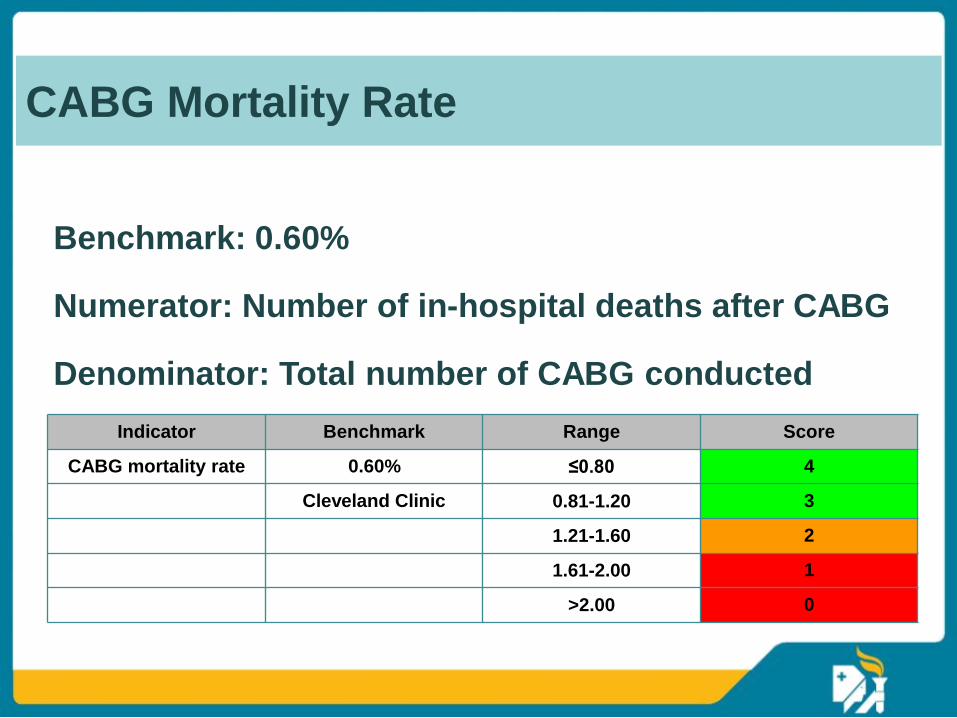
Benchmark: 0.60%
Numerator: Number of in-hospital deaths after CABG
Denominator: Total number of CABG conducted
Indicator Benchmark Range Score
CABG mortality rate 0.60% ≤0.80 4
Cleveland Clinic 0.81-1.20 3
1.21-1.60 2
1.61-2.00 1
>2.00 0
CABG Mortality Rate

Bench mark: 60 minutes
Numerator: Average lag time between arrival of the patient, to start
of the thrombolysis in patients with ischemic stroke in ER
Denominator: Total number of ischemic stroke patients in ER
Door to thrombolysis time
in ischemic stroke in ER 60 minutes ≤60.00 4
Massachusetts 60.01-70.00 3
General Hospital 70.01-80.00 2
Emergency 80.01-90.00 1
>90 0
Door to thrombolysis time in ischemic stroke in ER

Parameters scored as a percentage
Maximum score attainable 100
Over all hospital cumulative scores
> 75
50 - 75
< 50
ACE@25

37
@ Apollo

@ Apollo


Medication Errors
Apollo Quality Plan

Apollo Mortality Review
Process flow for mortality review
Death
Check if it fits the trigger for mortality
review
If, yes
Peer review by 2 senior faculty
members from the specialty
Fill the mortality review checklist
and categorize death
Case presentation by treating team in a monthly
mortality review meeting to institutionalize
learning from the case. Membership should
include medical head, faculty from the
concerned specialty, quality head, pathologist,
head of infection control and representative
from radiology.

Apollo Incident Reporting System
Location: Month:
S.no Parameters Value
1 Patient falls
2 Patient falls as per 1000 adjusted patient days
3 Needle stick injuries
4 Patient pressure ulcers
5 Patient Pressure ulcers per 1000 adjusted patient days
6 Missing patient records
7 Missing patients records per 100 discharges
8 Legal cases against the hospital
9 Legal cases against the hospital per 100 discharges
10 Legal action against the hospital
11 Any Sentinel Events

ACPPP
Clinical care
Nursing care
Managerial processes
Utility systems and infrastructure requirement
Apollo Clinical Policies Plans and Procedures


