benchmarking demystifying data and myths nancy babbitt, facmpe
TRANSCRIPT

BenchmarkingDemystifying Data and Myths
Nancy Babbitt, FACMPE
Learning Objectives
• Measure against industry norms
• Do’s and Don'ts
• Improvement Checklists
• Using data for ICD10
Top Healthcare Trends
• Healthcare Improvement– Improve Quality– Reduce Cost– Enhance Patient Experience
• Payment Reform– Payment Methodology– Physician Compensation
• Organizational Alignment


Use DATA and Benchmarking
• Know where you are
• Know where you want to go
• Improvements
• Concentrate resources to get the most impact
• Measure Success

Data… Internal and External
• Internal – show progress over time– Historical – establish a baseline– Ongoing – identify problems– Control fraud and embezzlement
• External – compare to others– MGMA– Specialty Society
• MGMA Best Practices– Profitability and Cost Management– Productivity, Capacity and Staffing– Accounts Receivable Management

Do’s and Don’ts of Benchmarking
• Use the Median, not the Mean– Median – mid-point of a set of data– Mean – observations divided by observations
• Don’t default to the highest benchmark– Can represent the best or worst, depending on type of data
• Use tables with “metrics” that apply– Per FTE Physician– FTE Provider– Per patient

Do’s and Don’ts of Benchmarking
• Be aware of the population– Higher the population, more robust data
• “Best Fit” data– 1st look for data based on specialty and ownership model– Then review all benchmarks, size, region, number of providers

TIPS
• Illustrate your findings to Physicians and Staff– Graphs– Tables– Dashboards
• Use Productivity Benchmarks to set reasonable targets– Example: Encounter data to set daily visit goal
• Create daily, monthly, yearly goals– Update staff regularly
• Attract and retain quality staff by using compensation and benefit benchmarks

KEY Benchmarks
• Gross Collection Rate• Gross Charges per Provider• Gross Charges per Patient• Number of Procedures• Number of Patients• Days in Accounts Receivable• Patient point of care collection rate• Total Accounts Receivable
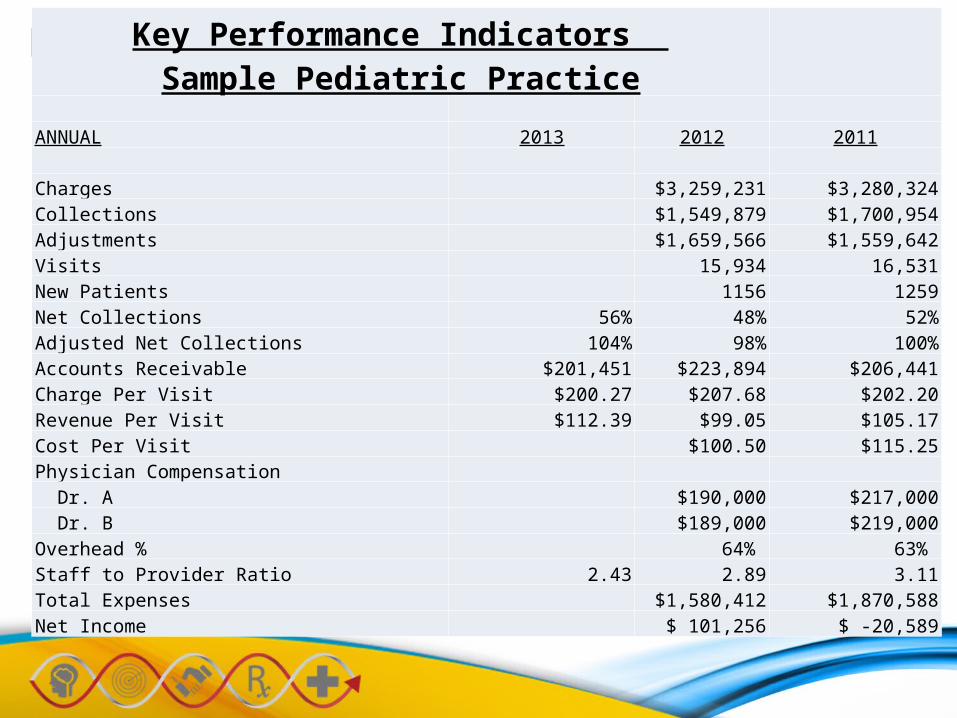
KEY BenchmarksKey Performance Indicators Sample Pediatric Practice
ANNUAL 2013 2012 2011 Charges $3,259,231 $3,280,324Collections $1,549,879 $1,700,954Adjustments $1,659,566 $1,559,642Visits 15,934 16,531New Patients 1156 1259Net Collections 56% 48% 52%Adjusted Net Collections 104% 98% 100%Accounts Receivable $201,451 $223,894 $206,441Charge Per Visit $200.27 $207.68 $202.20Revenue Per Visit $112.39 $99.05 $105.17Cost Per Visit $100.50 $115.25Physician Compensation Dr. A $190,000 $217,000 Dr. B $189,000 $219,000Overhead % 64% 63% Staff to Provider Ratio 2.43 2.89 3.11Total Expenses $1,580,412 $1,870,588Net Income $ 101,256 $ -20,589

MGMA DataDive
Physician Compensation and Production: 2013 Report Based on 2012 Data
Family Medicine (without OB) reported by: Geographic Section
Metric Phys Med Pracs Mean 10th %tile 25th %tile Median 75th %tile 90th %tile
Total Compensation 5,557 881 $225,701 $141,598 $169,826 $207,117 $262,990 $337,869
Metric Phys Med Pracs Mean 10th %tile 25th %tile Median 75th %tile 90th %tileEastern 1,097 269 $218,237 $135,659 $164,766 $200,972 $256,110 $326,910Midwest 2,004 147 $224,306 $143,282 $171,340 $208,946 $258,715 $329,224Southern 1,448 375 $239,047 $143,340 $171,913 $215,056 $283,942 $379,148Western 1,008 90 $217,425 $140,779 $169,853 $202,775 $251,364 $315,759
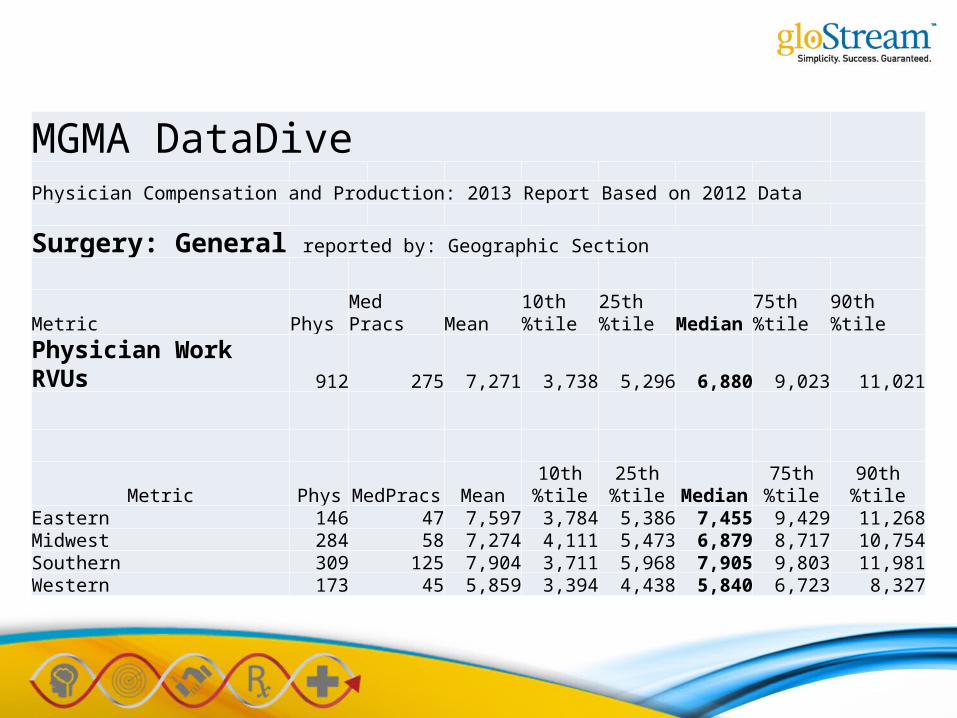
MGMA DataDive
Physician Compensation and Production: 2013 Report Based on 2012 Data
Surgery: General reported by: Geographic Section
Metric Phys Med Pracs Mean 10th %tile25th %tileMedian 75th %tile90th %tilePhysician Work RVUs 912 275 7,271 3,738 5,296 6,880 9,023 11,021
Metric Phys MedPracs Mean 10th %tile25th %tile Median 75th %tile 90th %tileEastern 146 47 7,597 3,784 5,386 7,455 9,429 11,268Midwest 284 58 7,274 4,111 5,473 6,879 8,717 10,754Southern 309 125 7,904 3,711 5,968 7,905 9,803 11,981Western 173 45 5,859 3,394 4,438 5,840 6,723 8,327

MGMA DataDive
Cost Survey: 2013 Report Based on 2012 Data
Multispecialty Practices
Metric, per Patient Count Mean 10th %tile 25th %tile Median 75th %tile 90th %tile
Total cost 122 $598.42 $192.57 $262.53 $488.81 $880.55 $1,161.05
Total support staff FTE 122 32.06 9.43 16.46 29.04 45.18 60.35
Physician work RVUs 103 4.60 1.46 2.17 3.95 6.82 8.73
Total gross charges 118 $956.65 $248.16 $333.40 $692.42 $1,364.34 $2,334.03
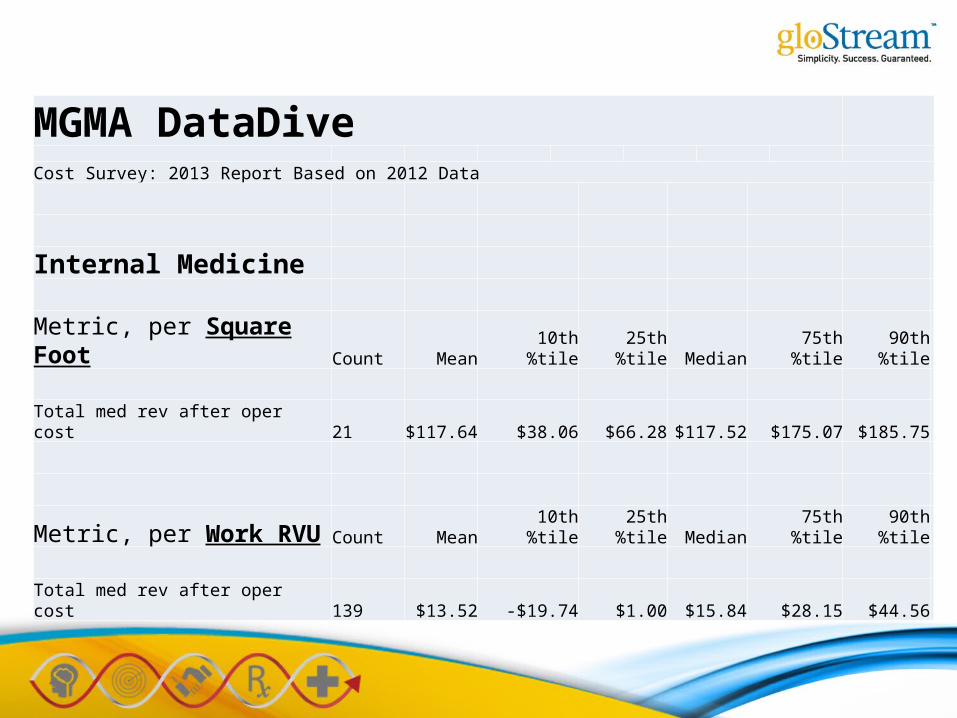
MGMA DataDive
Cost Survey: 2013 Report Based on 2012 Data
Internal Medicine
Metric, per Square Foot Count Mean 10th %tile 25th %tile Median 75th %tile 90th %tile
Total med rev after oper cost 21 $117.64 $38.06 $66.28 $117.52 $175.07 $185.75
Metric, per Work RVU Count Mean 10th %tile 25th %tile Median 75th %tile 90th %tile
Total med rev after oper cost 139 $13.52 -$19.74 $1.00 $15.84 $28.15 $44.56

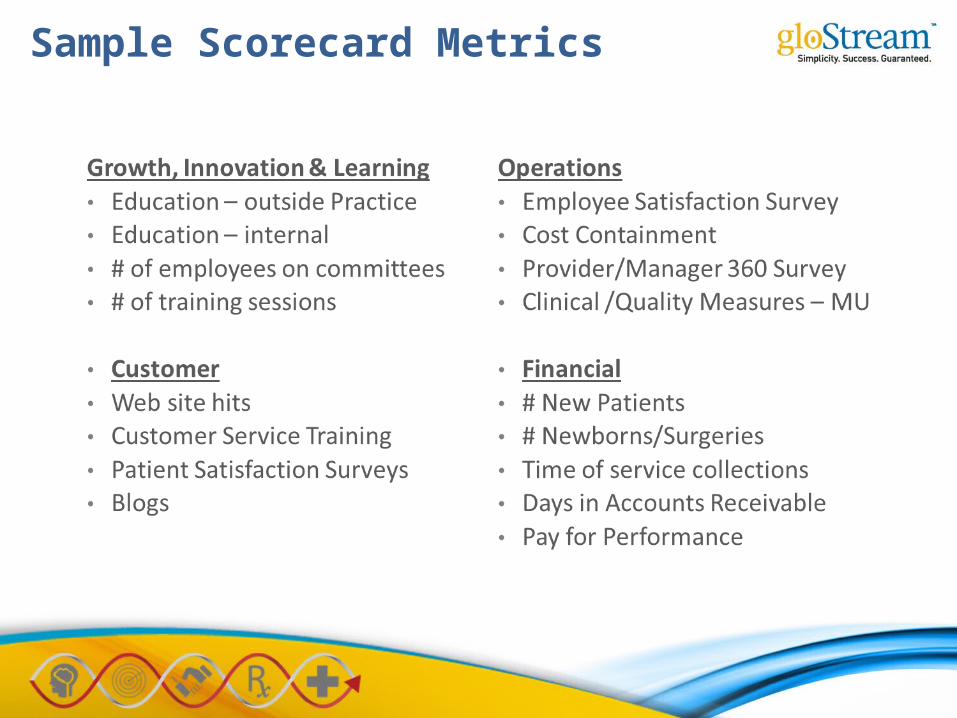
Sample Scorecard Metrics

Improve Accounts Receivable with Management and Culture
• Involve all staff and Providers
• Measure A/R on a regular basis
• Tie staff bonuses to A/R performance
• Provide thorough training and ongoing training to staff
• Educate Physicians on their role
• Keep everyone updated on policies and changes

MGMA Patient Portal
data.mgma.com/ptsat

How do you measure up?

Use the MGMA-ACMPE / SullivanLuallinonline patient satisfaction dashboard
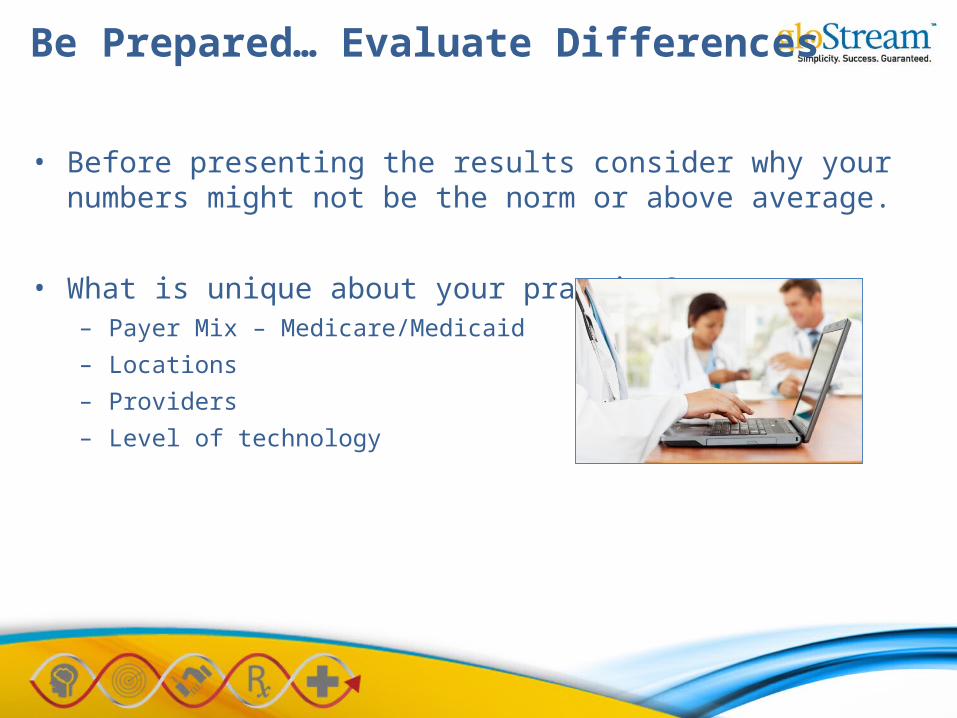
Be Prepared… Evaluate Differences
• Before presenting the results consider why your numbers might not be the norm or above average.
• What is unique about your practice?– Payer Mix – Medicare/Medicaid– Locations– Providers– Level of technology

Characteristics of Better Performing Groups
• Higher Revenue Per Physician
• Higher Operating Costs
• Higher Staff to Physician Ratio
• Increased Collections
• Greater % of Revenue available for Physician Compensation
• Smart use of Technology
• Emphasis on Ancillary Services
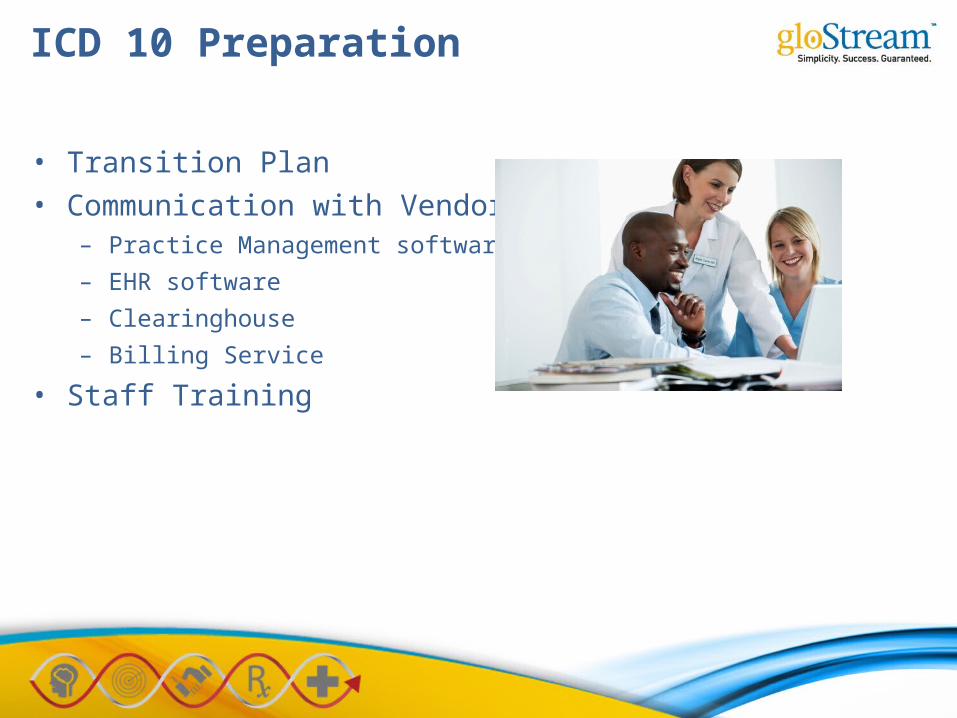
ICD 10 Preparation
• Transition Plan• Communication with Vendors
– Practice Management software– EHR software– Clearinghouse– Billing Service
• Staff Training

ICD 10 Use Data To Help Prepare
• Identify ICD 9– Usage reports– Areas where used
• Watch claim lag• Customize Forms/Templates• Identify support for ICD 10 code selection

Ensure Success
• Work Smart / Automate
• Network & learn from other organizations
• Set goals / Celebrate successes

Thanks for Attending!
Nancy Babbitt, FACMPE Babbitt & Associates
www.BabbittandAssociates.com

Attachments
Improvement Checklists

Improving Accounts Receivable
• Patient Scheduling• Review account balances when scheduling
• Verify eligibility, co-pay, well care, before
• Large obligations, assign a financial counselor• The Visit• Confirm Insurance status
• Follow up on missing info
• Collect all money due at Time of Service
• Assist Providers with CPT & DX coding• Staff Involvement• Reward successes
• Set standards, goals and expectations
• Cross train front office and A/R process
• Define clean claims elements
• Encourage staff to get CPT coding education

Improving Accounts Receivable – Page 2
• Payer Relations / Contracting• Manage relationships / monitor contracts
• Get to know your representative, if they have one!
• Make sure contracts define clean claims, timely submission and payment, appeals process, termination causes, times, and methods.
• Document all interactions with payers
• Billing & Collections• Post and file charges the same day
• Use electronic remittance advice and deposits
• Audit reports or EOB - get your contracted rate
• Follow up on outstanding claims
• Prioritize claims by amount, age, insurance company
• Establish payment plans
• Document all billing calls

Improving Provider Productivity
• Sample Behaviors• Establish cultural values that promote work ethic• Utilize Productivity based compensation• Use mid-level Providers• Maintain optimal staffing levels• Mentor new physicians• Develop recruitment protocols that ensure new physicians understand productivity
expectations• Design operational systems and facilities to promote productivity• Evaluate physicians coding habits• Empower supervisors/staff to be decision makers• Hold physicians and staff members accountable
• Essential Metrics• Encounters/procedures per physician• Revenue per physician• Staff per physician• Billable days per month per physician• No Show rates• Referral patterns / trends
Improving Financial & Operational Areas
• Perform annual budget and business planning• Monitor your performance against your budget• Incorporate financial goals into strategic plan• Benchmark and set financial objectives• Scrutinize all expenses• Regularly bid contracts• Participate in Group Purchasing Organization• Reward Physicians/Staff for cost savings• Give them control and accountability• Document, train, and keep policies current • Maximize use of technology and automation• Develop and manage formal marketing plan• Keep physicians involved