benchmark assessment development in the ... - ati-online.com
TRANSCRIPT

Technical Manual
Benchmark AssessmentDevelopment in the Galileo
Educational Management System
Submitted by:Assessment Technology, Incorporated
6700 E. Speedway Boulevard Tucson, Arizona 85710
Phone: 520.323.9033 • Fax: 520.323.9139© 2011 Assessment Technology, Incorporated
byJohn Richard Bergan, Ph.D.
Christine Guerrera Burnham, Ph.D. John Robert Bergan, Ph.D.
and Kerrie Cole Bergan, M.S.

Copyright © 2011 by Assessment Technology, Incorporated
All rights reserved. No part of this document may be reproduced or transmitted in any form or by any means, electronic or mechanical, including photocopy, recording, or any information storage and retrieval system, without permission from the publisher.
Assessment Technology, Incorporated, Publishers
Tucson, Arizona, U.S.A. Printed in the United States of America. V4-050411

Benchmark Assessment Development 1.800.367.4762
in the Galileo K-12 Online Educational - i - ati-online.com Management System © Assessment Technology, Incorporated 2011
Benchmark Assessment Development in the Galileo Educational Management System
John Richard Bergan, Ph.D.
Christine Guerrera Burnham, Ph.D. John Robert Bergan, Ph.D. Kerrie Cole Bergan, M.S.
Assessment Technology, Incorporated
Table of Contents
Table of Contents ............................................................................................................. i Acknowledgements .......................................................................................................... ii
I. Introduction ......................................................................................................... 1 A. Benchmark Utility and Standards Mastery ............................................... 1 B. Benchmark Utility and Forecasts of Standards Mastery ............................ 1 C. Reliability, Validity, and Forecasting Utility ................................................ 2 D. Local Control of Benchmark Test Specifications ....................................... 2 E. Change as a Benchmark Assessment Constant ....................................... 3
II. Item Development ............................................................................................... 4
A. Item Specifications .................................................................................... 4 B. Item Construction ...................................................................................... 5 C. Item Review and Certification ................................................................... 6
III. Item Banking ....................................................................................................... 6
A. Item Classification ..................................................................................... 7 B. Item Attributes ........................................................................................... 8 C. Security ................................................................................................... 10
IV. Test Development ............................................................................................. 11
A. Test Specifications .................................................................................. 11 B. Test Assembly......................................................................................... 12 C. Test Review ............................................................................................ 12 D. Test Instructions ...................................................................................... 13 E. Test Publication....................................................................................... 14
V. Benchmark Psychometrics .............................................................................. 14
A. The Item Calibration Process .................................................................. 14 B. Reliability ................................................................................................. 20 C. Validity .................................................................................................... 24
VI. Conclusion ......................................................................................................... 54
VII. References ......................................................................................................... 56

Benchmark Assessment Development 1.800.367.4762
in the Galileo K-12 Online Educational - ii - ati-online.com Management System © Assessment Technology, Incorporated 2011
Acknowledgements
The authors would like to thank David Thissen for his review and thoughtful comments regarding this manuscript. We would also like to thank Kathryn Bergan and Jody Jepson for their preparation of this document. John R. Bergan, Ph.D. President, Assessment Technology Incorporated

Benchmark Assessment Development 1.800.367.4762
in the Galileo K-12 Online Educational - 1 - ati-online.com Management System © Assessment Technology, Incorporated 2011
I. Introduction Benchmark assessments are a relatively new form of assessment designed to provide information on standards mastery for the purpose of guiding instruction. ATI provides benchmark assessments to local educational agencies through the Galileo Educational Management System (EMS). This manual outlines the process of developing Benchmark assessments for use in the Galileo EMS and the psychometric analyses conducted to evaluate their utility for guiding instruction to promote standards mastery.
A. Benchmark Utility and Standards Mastery The utility of benchmark assessments for guiding instruction is a direct function of the extent to which they adequately reflect the mastery of standards targeted for instruction in local educational agencies. For example, benchmark assessments can be used to indicate those standards that have been mastered and those standards that have not been mastered following instruction. Benchmark results can be used to plan and implement interventions aimed at promoting mastery of those standards. The utility of benchmark results for guiding instruction is enhanced to the extent that benchmark results can be used to determine which of the non-mastered standards should be targeted for instruction next. Item Response Theory (IRT) provides a useful mechanism for determining next instructional steps because in IRT ability and item difficulty are placed on a common scale. The common scale provides a foundation for determining the likelihood of standards mastery based on ability. IRT also makes it possible to place scale scores from different benchmark assessments on a common scale. ATI uses item calibration techniques based on IRT to produce a scale score called a developmental level score. The developmental level score is used to determine next instructional steps and to track progress across a series of benchmark assessments. Item calibration based on IRT will be discussed in detail later in this manual.
B. Benchmark Utility and Forecasts of Standards Mastery Assessing standards mastery in local educational environments is not the only factor determining benchmark utility. Currently standards mastery in states across the nation is ultimately determined by student performance on statewide tests. The utility of local benchmarks is affected not only by the extent to which they are useful in guiding instruction, but also by the extent to which they can effectively forecast standards mastery on statewide tests. Effective forecasting adds utility to benchmark assessments because it increases the information available to guide instruction toward standards mastery on statewide assessments.

Benchmark Assessment Development 1.800.367.4762
in the Galileo K-12 Online Educational - 2 - ati-online.com Management System © Assessment Technology, Incorporated 2011
C. Reliability, Validity, and Forecasting Utility Insofar as benchmarks are to be used in forecasting, it is important that these instruments be reliable and valid. Adequate levels of reliability are essential to obtaining adequate validity. Validity is supported to the extent that benchmark assessments are related to other measures of student achievement. An unreliable test is not adequately related even to itself. Benchmark validity as it relates to forecasting focuses on the relationship between benchmark tests and statewide tests. In order to use benchmarks effectively to forecast standards mastery, the benchmarks should correlate significantly with statewide assessments. However, the correlations should not be of such magnitude as to support the argument that benchmarks and statewide tests are parallel forms of the same assessment. Benchmark tests and statewide tests serve different purposes. Benchmark assessments are designed to assess standards targeted for instruction during specific time periods in the school year. Statewide tests measure a sample of the content reflected in standards at the end of the year for accountability purposes. It is important to point out that if either the guidance or forecasting functions are absent, overall utility may be seriously compromised. For example, if a given set of benchmarks were useful only for guiding instruction, there would be a significant risk that guidance would not effectively promote standards mastery on the statewide assessment. Likewise, if a test provided effective forecasting, but was not designed and administered at times reflecting the local curriculum it would be of little value in guiding instruction to promote standards mastery.
D. Local Control of Benchmark Test Specifications If benchmark assessments are to be used to measure standards targeted for instruction in schools, schools need to have a significant degree of control over benchmark test specifications. For example, if a school targets a particular set of standards for instruction during a given time period, the school will need a benchmark test assessing those standards. Moreover, in order to ensure the adequacy of the assessment for each standard, the school will probably want to control the number of items selected to assess each standard. In addition, the school may wish to select items that reflect varying depths of knowledge (see e.g. Webb, 2006) reflected in the specific skills targeted for instruction. They may also want items that are sensitive to the experiences of students from diverse backgrounds represented in the district. Finally, they will typically need to control the length of the assessment to cover the targeted content and to meet time constraints such as the length of periods during which assessments can be scheduled.
Benchmark Assessment Development 1.800.367.4762
in the Galileo K-12 Online Educational - 3 - ati-online.com Management System © Assessment Technology, Incorporated 2011
i. Technology Supporting Local Control Technology is required to achieve effective local control of benchmark specifications. ATI builds several thousand benchmark assessments customized to school district specifications each year. Providing this level of customization requires technology that allows districts to express required specifications efficiently, to review draft measures built according to those specifications, and to modify those measures to insure that published versions of assessments meet district specifications. The Galileo EMS includes a series of online tools including a Assessment Planner, a Test Review feature, and a Generate Test feature that provide the necessary technology to support customization. These tools will be described in detail in subsequent sections of this manual.
ii. Specification Guidelines and Consultation Services Supporting Local Control and Benchmark Utility
In addition to technological support, the local control requirement calls for advanced information that can assist districts to adopt specifications likely to yield assessments with adequate utility for guiding instruction towards standards mastery. Various factors under district control may affect the utility of benchmark assessments. For example, reliability is a direct function of test length. If a district adopts test specifications that call for an extremely short test, test utility is likely to be compromised by the unreliability of the test. The Galileo EMS provides test specification guidelines that are designed to assist districts to adopt specifications that are likely to produce reliable and valid tests. In addition, ATI provides consultation services through its Educational Management Services Department to facilitate district adoption of specifications likely to produce reliable and valid assessments that will be useful in guiding instruction and forecasting standards mastery.
E. Change as a Benchmark Assessment Constant Benchmark assessment takes place in the context of a rapidly changing educational landscape. Educational standards are under continual review and revision. Curriculums are continually altered to accommodate changes in standards. Local demographics frequently change creating unique local needs. As a consequence, not only is there a demand for initial customization of benchmark assessments, but also the likelihood that the same assessments will be used over time is small. The constant changes occurring in the educational environment limit the utility of dated psychometric information. In the past, educational assessments were often used without change over a period of years. Technical manuals were written containing psychometric information that was relied upon to describe the technical characteristics of assessments over an extended time span. Benchmark assessments change continually. Consequently, continual

Benchmark Assessment Development 1.800.367.4762
in the Galileo K-12 Online Educational - 4 - ati-online.com Management System © Assessment Technology, Incorporated 2011
psychometric analyses are required to evaluate their utility. In order to make the results of psychometric analyses continually available to clients, ATI engages in a continuous research program. Results of psychometric studies are provided dynamically in reports available in the Galileo EMS. For example, the Item Parameter Report available in the system provides information on item parameter estimates for local benchmark assessments. The Item Analysis Report provides information on student responses to distractors in multiple choice items. In addition to reports available in the system, ATI provides customized reports to districts on various issues such as accuracy in forecasting risk on not meeting standards on statewide assessments. The pages that follow detail the processes used to build and maintain the item banks needed to construct customized benchmark assessments. Then the procedures used to construct, review, and assemble benchmark tests are described. Subsequently the discussion turns to the results of psychometric analyses used in examining the utility of benchmark assessments. These results are intended to be illustrative of the process of evaluating benchmark assessments. The actual utility of any particular benchmark assessment is assessed through the ongoing research program and dynamic reporting system provided through the Galileo EMS.
II. Item Development Meals are only as good as their ingredients and the ways they are combined. And, benchmark assessments are only as good as their items. Therefore, the item development process for benchmark assessments in Galileo has been carefully designed to produce high quality items. This process includes the development of item specifications, item construction, and item review with certification.
A. Item Specifications When new items are to be added to the benchmark item bank, the first step is to review the standard which is to be assessed. The standard is broken down into the skills that make up the standard. These skills are the starting point for developing an online list of item specifications defining the characteristics of the particular class of items to be written. Item specifications indicate the defining characteristics of the item class, the rationale for the class, and the required characteristics for each item component. For example, in the case of multiple choice items, the required characteristics of the stem and the alternatives are specified. Specifications address such factors as the depth of knowledge intended for items included in the specification, the appropriateness of vocabulary, requirements related to readability levels, and the alignment of the item with standards.

Benchmark Assessment Development 1.800.367.4762
in the Galileo K-12 Online Educational - 5 - ati-online.com Management System © Assessment Technology, Incorporated 2011
The value of creating specifications as a guide for the item development process is recognized as a critical part of a process documenting that assessments are reliable and valid indicators of the ability they are intended to measure (Haladyna, 2004). Their structure and specificity also affords many advantages for ensuring that assessments may be readily adapted as district needs and or state/federal requirements change. Figure 1 provides an example of an item specification in the area of language arts.
Figure 1 Sample item specification
B. Item Construction
After specifications have been written, items are constructed corresponding to the specifications using the online Bank Builder utility. Bank Builder includes features that promote item quality. For example, images constructed using Bank Builder conform to size and resolution standards that yield items that are visually suited to both online and offline administration. Similarly, fonts available in Bank Builder are chosen to work across platforms, for readability both onscreen and in printed material. Bank Builder also allows for the use of item families, or groups of items that refer to the same contextual material. For example, several language arts items may refer to the same reading passage.

Benchmark Assessment Development 1.800.367.4762
in the Galileo K-12 Online Educational - 6 - ati-online.com Management System © Assessment Technology, Incorporated 2011
The item construction process also includes attention to important principles of item writing. For example, when writing multiple choice items, incorrect alternatives must be plausible answers that may provide clues to the manner in which the student conceptualizes the problem reflected in the question. Distractors should resemble the correct choice in grammatical form, style and length (Haladyna, 2004). Care is also taken to ensure that items are written to accommodate students from diverse backgrounds. Sensitivity to diversity reflected in the needs of local programs is addressed in the test review process, which enables districts to select items appropriate for use with their students. For example, items are written to include a diversity of ethnic and multi-ethnic names so that districts will have choices available to meet local needs when deciding on which items to include. The test review process will be discussed in detail later in this manual. When writing items, including contextual material, careful attention is also paid to insure that the material is at the appropriate reading level. Although the reading level of a passage may be quantified in several ways, there is a subjective component as well. Neither the complexity of sentence structure, the difficulty in comprehending the concepts presented in a passage, nor the level of abstraction can be quantified. For example, “I think, therefore I am.” results in a very easy readability level (2.8 grade level using the Flesch-Kincaid Index), but the concepts addressed by the sentence are not so easy to understand. The appropriateness of a given passage for a given grade level is also an issue. Therefore, while we do use one measure of readability, we also analyze the reading passages more subjectively to ensure that reading ability does not get in the way of, for example, correctly answering a math question. For the measure of readability, we have chosen the Flesch-Kincaid Index, which is a formula based on the number of words per sentence and the number of syllables per word.
C. Item Review and Certification Item construction is followed by internal online item review. Reviewers may accept an item, reject the item, or accept the item with modifications. If an item is accepted with modifications, the reviewer will provide the item writer with a list of suggested modifications, which will guide item revision. When an item has been accepted by two reviewers, it is certified. Certified items are locked so that they cannot be changed by users of Galileo. Only certified items are provided by ATI for use by school districts.
III. Item Banking
Galileo K-12 Online uses a flag to segregate items used in district-wide assessments from items used in short formative assessments such as classroom
Benchmark Assessment Development 1.800.367.4762
in the Galileo K-12 Online Educational - 7 - ati-online.com Management System © Assessment Technology, Incorporated 2011
quizzes. The flag has the effect of creating two separate item banks, one that is secure and reserved for use in building district-wide assessments and another, the formative item bank, that is available for use by teachers and other school-level personnel for creating quizzes and other informal assessments. All of the items available for use in either bank are aligned to state standards and are certified. As of May 9, 2008, the Galileo K-12 Online item banks contained 59,728 items for use in math, English language arts, and science assessments in grades K-12. New items are created continually by ATI staff. The current rate of production adds approximately 1,400 new items to the item banks each month.
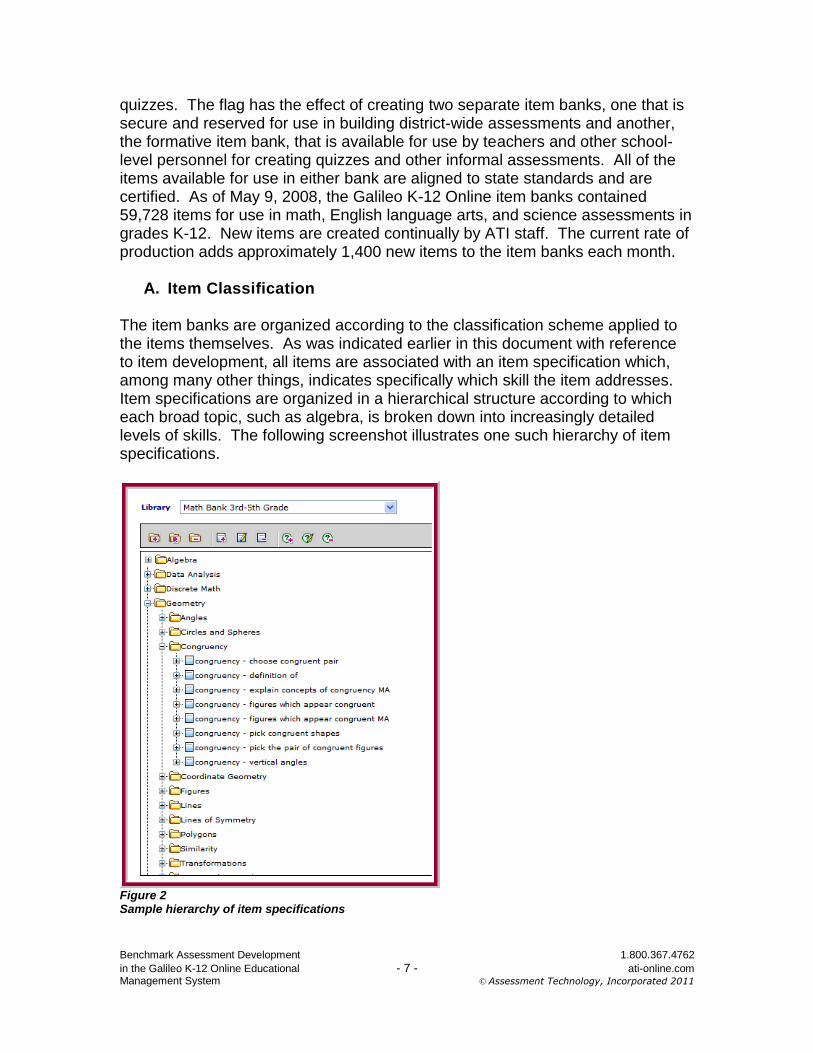
A. Item Classification The item banks are organized according to the classification scheme applied to the items themselves. As was indicated earlier in this document with reference to item development, all items are associated with an item specification which, among many other things, indicates specifically which skill the item addresses. Item specifications are organized in a hierarchical structure according to which each broad topic, such as algebra, is broken down into increasingly detailed levels of skills. The following screenshot illustrates one such hierarchy of item specifications.
Figure 2 Sample hierarchy of item specifications

Benchmark Assessment Development 1.800.367.4762
in the Galileo K-12 Online Educational - 8 - ati-online.com Management System © Assessment Technology, Incorporated 2011
The purpose of Galileo K-12 Online is to facilitate data-driven decision making in standards-based education, and so all assessment items in the Galileo K-12 Online item banks are aligned to state standards. However, state standards are often quite broad, with each one encompassing a broad array of skills that the student must demonstrate. In such cases a single state standard will have a number of item specifications associated with it. The following screenshot illustrates one particularly broad standard and the variety of item specifications that are linked to that standard.
Figure 3 Aligning a single state standard to numerous, more specific, item specifications
Each assessment item is aligned to an item specification, and each item specification is aligned to a single standard for a given state.
B. Item Attributes Every item in the Galileo K-12 Online item banks is evaluated according to a number of criteria, including depth of knowledge and item quality based on the values of IRT parameter estimates.
i. Depth of Knowledge
All items in the Galileo K-12 Online item banks are evaluated and scored for Depth of Knowledge (DOK). ATI uses Webb’s (2006) DOK levels to indicate the depth of knowledge targeted by assessment items. Webb’s DOK levels are designed to be applied to either individual assessment items or to state

Benchmark Assessment Development 1.800.367.4762
in the Galileo K-12 Online Educational - 9 - ati-online.com Management System © Assessment Technology, Incorporated 2011
standards. In Galileo K-12 Online the DOK classification is applied at the level of item specification that was described earlier in this section. The item specification level is the most appropriate level to which Webb’s criteria should be applied because it constitutes a more precise statement of skills to be assessed than many state standards do. In addition, since all multiple-choice items associated with a given item specification share the same stem structure, they will automatically all fall within the same DOK level. This is because in Webb’s system, the DOK level is determined largely by the keywords (the verb) in the question stem or standard. Examples of keywords in Level 1 items include identify, recall, and measure. Some keywords for level 2 items are classify, estimate, and make observations. In Galileo K-12 Online all multiple-choice assessment items share the same stem structure as defined by the item specification to which they are linked. It is more efficient, therefore, to apply Webb’s DOK criteria to item specifications than to individual assessment items.
ii. Item Parameters
In addition to the Depth of Knowledge attribute assigned to each item specification by ATI item development staff, all benchmark assessment items that are in use by districts of sufficient size are subjected to item analysis using Item Response Theory (IRT). IRT assumes that a student’s response to a test item is determined by the student’s ability and certain item parameters, i.e., characteristics of the item. For multiple-choice tests, ATI typically uses an IRT model including three item parameters: a discrimination parameter, a difficulty parameter, and a guessing parameter. The discrimination parameter reflects the relationship between the item and the underlying ability being measured. Items with high discrimination values make a positive contribution to test reliability. Values approaching or exceeding 1.0 discriminate between levels of ability very well. Values close to 0.0 discriminate between different ability levels very poorly. The difficulty parameter provides information on the relative difficulty of items on the test. Zero is the average ability of the students. An item difficulty of zero is of appropriate difficulty for the average student. If item difficulty is above zero, the item is more difficult. When item difficulty is negative, the item is less difficult. Tests including a broad range of difficulties are sensitive to a broad range of abilities. Such tests generally correlate higher with criterion measures (e.g., statewide assessments) than do tests that are sensitive to a limited range of abilities. The guessing parameter indicates the likelihood that a student who does not know the answer to a question will guess the correct answer. Given a multiple-choice item with four alternative choices, it is reasonable to expect that the chances of guessing the correct answer will be about one in four, or .25. Information regarding item parameter estimates for items in benchmark tests is provided through an Item Parameter Report available in Galileo K-12 Online. A portion of a sample report is shown below.

Benchmark Assessment Development 1.800.367.4762
in the Galileo K-12 Online Educational - 10 - ati-online.com Management System © Assessment Technology, Incorporated 2011
Figure 4 Sample Item Parameter Report
In addition to item parameter information for items on a particular district benchmark assessment, parameter information is measured and calibrated for all assessment items in the Galileo K-12 Online benchmark item bank. The benchmark item calibration process will be described in detail later in this document.
C. Security As indicated above, Galileo K-12 Online segregates benchmark items from formative items. Security constraints limit access to benchmark items. These constraints insure that benchmark items can only be used for the development of district benchmark assessments. Access to benchmark items is restricted to the ATI Test Development staff and to reviewers selected by the district to review draft benchmark assessments. These reviewers may view benchmark items if they elect to replace an item on the assessment. Formative items are available to teachers and all district users for use in the construction of district-, campus-, or classroom-developed assessments.

Benchmark Assessment Development 1.800.367.4762
in the Galileo K-12 Online Educational - 11 - ati-online.com Management System © Assessment Technology, Incorporated 2011
IV. Test Development
A. Test Specifications Using ATI’s proprietary Assessment Planner, district staff participate in the design of district assessments aligned to state standards and sequenced according to district curriculum and pacing guides. The interface for the Assessment Planner is shown on the following page.
Figure 5 Sample Assessment Planner
The Assessment Planner allows the school district to determine how many benchmark assessments there will be during the year, when benchmark testing will occur, which standards will be covered in instruction and benchmark assessment, and how many items will be included for each standard on each benchmark assessment. ATI Educational Management Services staff work closely with district personnel during the design phase to ensure that the resulting benchmark assessments are

Benchmark Assessment Development 1.800.367.4762
in the Galileo K-12 Online Educational - 12 - ati-online.com Management System © Assessment Technology, Incorporated 2011
of the highest possible quality. For example, a district may request benchmark assessments that are too short to provide reliable data. In such cases, ATI staff explains the importance of reliability and encourages the district to modify the benchmark plan so that each assessment contains at least 35 to 40 items. Similarly, on occasion a district may request an assessment that is of sufficient length but which addresses only a few standards, with 7 or 10 questions addressing each standard. Under these circumstances ATI staff may encourage the selection of a broader range of standards.
B. Test Assembly Once the design of a district’s benchmark assessments has been finalized in the Assessment Planner, the district user responsible for finalizing the plan presses the Plan Complete button on the Planner. This generates an automatic email advising ATI Educational Management Services staff that the benchmark planning process has been completed. Assessment and Instruction Development staff then generates the tests to match the submitted plan using ATI’s extensive bank of benchmark assessment items. The goal in test generation is to create a test that represents the goals to be measured at a variety of ability levels to give teachers the ability to measure student achievement and to identify areas that should be the focus of additional instruction. In assembling the Reading/English Language Arts test, the focus is to provide these items in conjunction with a reasonable number of text sources to ensure students are able to complete the assessments in a timely manner.
C. Test Review
After tests are assembled, they may be reviewed by the district. During the review phase, tests are moved to a secure library accessible to client district staff and those individuals who are designated by the district as reviewers. The representatives of the district participating in the review process are afforded the opportunity to replace items on the draft version of the assessment by using item replacement tools to select an item that is more closely aligned to their expectations or instructional focus for this assessment. For example, some math objectives include a number of operations in the wording of the standard, but the district curriculum may have emphasized one of these operations in the particular period leading up to the assessment so reviewers may choose to redistribute the selection of items for that objective to reflect this emphasis. Test review is conducted using the online Test Review utility. This utility provides the capability to review each item contained in a test. Comment boxes in the utility afford the ability to make comments regarding the overall test. The use of the Test Review utility is controlled with appropriate permissions. Two levels of permissions are provided. One allows for a series of initial reviewers. The

Benchmark Assessment Development 1.800.367.4762
in the Galileo K-12 Online Educational - 13 - ati-online.com Management System © Assessment Technology, Incorporated 2011
second designates a final reviewer responsible for accepting a final version of the test under review.
Figure 6 Sample final review interface
D. Test Instructions
Each assessment includes a set of specific instructions to teachers detailing how to administer the assessments. These directions are crafted to ensure that all students being evaluated on a particular item are provided with the same level of information and support in attempting the item. For example, objectives in early elementary have instructions specifying which items require teacher involvement and to what degree each teacher is to assist the students in order to assess the item without biasing the measurement of the standard.
Benchmark Assessment Development 1.800.367.4762
in the Galileo K-12 Online Educational - 14 - ati-online.com Management System © Assessment Technology, Incorporated 2011
E. Test Publication Following the completion of assessment review, the district-designated final reviewer clicks on the Review Complete button. At this time Assessment staff will move the tests back to the ATI production areas to archive the comments and to address any requests or comments that were not addressed by district users via item replacement. Once all of the comments/requests have been addressed, the test will be published to a secure library accessible only to district level staff until such time as the assessment is scheduled to be implemented.
V. Benchmark Psychometrics
Psychometric analyses are carried out on benchmark assessments each time a benchmark test is administered. The discussion that follows outlines the process of item calibration for benchmark tests and the procedures used to provide evidence regarding the reliability and validity of benchmark assessments.
A. The Item Calibration Process The item calibration process implemented by ATI is based on Item Response Theory (IRT). The process is designed to place scores obtained from assessments constructed from ATI item banks on a common scale. In addition, the calibration process is intended to produce assessments that are sensitive to changes in student performance associated with continuing changes in educational goals and methods that are occurring in our rapidly changing society. Placing assessment scores on a common scale makes it possible to measure progress (Williams, Pommerich, & Thissen, 1998). Sensitivity to societal change insures that assessments will reflect current examinee capabilities as well as changes in capabilities associated with societal changes occurring over time. ATI implements the Maximum Marginal Likelihood approach to parameter estimation using the Multilog computer program (Thissen, Chen, & Bock, 2003). The procedures implemented through Multilog relate item parameter estimates in ATI item banks for a given subject and grade to a common score distribution for that subject and grade. In the typical case, three item parameters are estimated: Item difficulty, item discrimination, and guessing. IRT makes it possible to locate test items and ability on the same scale (Thissen & Wainer, 2001). In IRT, the characteristics of the ability distribution directly affect the values of estimates of item parameters. Conversely, assumptions regarding item parameter characteristics directly affect characteristics of the ability distribution. The relationship between items and ability assumed in IRT provides a convenient approach for placing scores from different assessments on a common scale because it achieves the common scale objective as an integral part of the process of estimating item parameters.

Benchmark Assessment Development 1.800.367.4762
in the Galileo K-12 Online Educational - 15 - ati-online.com Management System © Assessment Technology, Incorporated 2011
i. Initiating Item Calibration with Two Assessments
ATI initiated item calibration by estimating item parameters for items included in an initial assessment of students in an Arizona school district. The data used for the initial calibration were the Fall 2005 benchmark assessment scores. The characteristics of the initial calibration district are indicated in Tables 1 and 2, and further details regarding the initial data set are provided in Table 3. No claim was made that the students were representative of the population of students in Arizona at the time of the initial assessment. The goal was to place test scores on a common scale, not to reflect normative performance reflecting the population of Arizona Students. Subsequent to the item calibration process, an analysis of student scores on the 2006 statewide assessment was conducted in order to determine whether the students of the initial calibration (IC) district were representative of Arizona students. The results are presented in Tables 1 and 2. Considering proficient English language users first, the mean scores of IC district students were quite similar to, though slightly higher than, scores for students statewide. The IC district students of limited English proficiency scored somewhat higher in some grades and subjects than did their counterparts statewide. TABLE 1 Comparison of mean 2006 statewide assessment scale scores for Initial Calibration (IC) District with scores for entire state
Grade State IC District Difference State IC District Difference
3 455 465 10 461 470 9
4 490 496 6 478 485 7
5 512 513 1 496 503 7
6 524 532 8 503 515 12
7 551 553 2 519 523 4
8 562 566 4 526 532 6
10 708 709 1 710 716 6
3 413 425 12 408 420 12
4 441 456 15 422 435 13
5 458 455 -3 440 440 0
6 467 467 0 444 436 -8
7 493 507 14 457 454 -3
8 503 502 -1 462 466 4
10 663 675 12 642 657 15
Math Reading
Category 2: English Language Learners*
Category 1: Proficient English Language Users*
*Category 1 students are students who are fully English proficient or have been in an English
Language Learner program for four or more years. Category 2 students are students whose first
language is not English. The two categories are not mutually exclusive.

Benchmark Assessment Development 1.800.367.4762
in the Galileo K-12 Online Educational - 16 - ati-online.com Management System © Assessment Technology, Incorporated 2011
The greatest dissimilarity between the IC district and the population of Arizona students is with regard to the number of students categorized as being English learners. The percent of IC district students classified as being of limited English proficiency is substantially smaller than is typically the case statewide. TABLE 2 Comparison of approximate* percent of students categorized as English Language Learners for Initial Calibration (IC) District with approximate percent for entire state
Grade State IC District Difference State IC District Difference
3 18.6 3.1 -15.5 18.6 3.1 -15.4
4 16.7 2.4 -14.3 16.6 2.6 -14.0
5 13.7 2.2 -11.6 13.6 2.1 -11.6
6 12.6 2.0 -10.6 12.5 2.0 -10.5
7 12.4 2.6 -9.8 12.4 2.6 -9.8
8 12.1 1.9 -10.2 12.0 2.2 -9.9
10 7.0 2.0 -4.9 7.1 2.1 -5.0
*Percentages are approximate because Category 1 and Category 2 are not mutually exclusive
Math Reading
Approximate* Percent of Students Categorized as English Language Learners
The initial implementation of item calibration produced item parameter estimates under the assumption that the ability distribution in the population of students represented by the district was standard normal. The process of placing scores from subsequent assessments on the scale reflected by the same standard normal distribution as that determined for the initial assessment began as follows: A second assessment was constructed, which included items from the initial assessment and items not included in the initial assessment. The parameter estimates for approximately 20 percent of the items from the initial assessment were fixed at the values determined from the initial assessment. The fixed parameter estimates provided the basis for placing scores for the second assessment on the scale reflected in the same standard normal population as scores for the initial assessment. Parameters for items in the second assessment that were not included in the initial assessment were estimated from the data. In addition, the mean and standard deviation for the second assessment were estimated from the data. The estimated mean and standard deviation affected the estimated values of the item difficulty and discrimination parameters in a manner that adjusted for the fact that the second assessment was administered to a different group of students at a different time than the initial assessment. When the analysis of the second assessment was completed, the parameter estimates for the set of items from both assessments were linked to the standard normal population distribution assumed for the initial assessment. Scores obtained for assessments composed of items from the set were on a common scale.

Benchmark Assessment Development 1.800.367.4762
in the Galileo K-12 Online Educational - 17 - ati-online.com Management System © Assessment Technology, Incorporated 2011
ii. Continuing the Calibration Process with Additional Assessments
The initial set of calibrated items was expanded by replicating the calibration procedures described above. Table 3 summarizes the benchmark assessments used in this phase of the item calibration process. TABLE 3 Descriptive statistics for benchmark assessment used in benchmark item calibration process
District Grades Subject(s)
Mean Sample Size
per Assessment
Mean Length of
Assessments
1 (IC) 1-10 math, reading 962 41
2 2-8 math, reading 631 43
3 1-10 math, reading 1609 42
4 1-8 math, reading 1514 44
5 2-8 math, reading 858 47
6 2-10 math, reading 4396 37 Each implementation of the process included an anchor assessment containing items with previously estimated item parameters and a new assessment containing anchor assessment items and additional items not included in the anchor assessment. The parameters for the anchor item set were fixed at their previously estimated values. The number of fixed parameters was determined by multiplying the length of the new assessment by .20. A forty-item assessment, for example, required a minimum of 8 items fixed at their previously estimated values. The parameters for the additional items were estimated following test administration. The fixed parameters provided the vehicle making it possible to place the score for the new assessment on a common scale with the chain of assessments previously constructed in the calibration process.
iii. Calibration Using the Bank as Anchor
As the number of calibrated items increased, the bank of calibrated items served as the anchor assessment in the calibration process. Items included in new assessments were calibrated using the bank as anchor. Using the bank as anchor provided increased flexibility in selecting the set of items whose parameters were to be fixed in the calibration process. The goal was to select a fixed parameter item set from the item bank that closely matched parameter estimates for items on the new assessment. In order to identify the items on the new assessment that best matched the parameter values stored in the item bank, an IRT analysis was run on the assessment without fixing any of the item parameters to item bank values. The mean and standard deviation of student

Benchmark Assessment Development 1.800.367.4762
in the Galileo K-12 Online Educational - 18 - ati-online.com Management System © Assessment Technology, Incorporated 2011
ability levels on this first run were fixed to 0.00 and 1.00, respectively. The resulting item parameter estimates were reviewed for extreme estimates, e.g., a discrimination parameter of greater than 3.99 or less than 0.14, or a difficulty parameter greater than 3.99 or less than -3.99. The Multilog syntax file was modified so that, on a second run of the IRT analysis, a Gaussian prior distribution for the problematic parameters was imposed. For the discrimination parameter, a prior mean of 2.24 and standard deviation of 0.50 was found to be generally effective in bringing the estimated value in line. Imposing a prior distribution for the discrimination parameter in this manner often simultaneously brought a problematic difficulty parameter for that item in line. For those cases where the difficulty parameter remained problematic after imposing a prior distribution for the discrimination parameter, a prior distribution for the difficulty parameter was also imposed. For the difficulty parameter a prior mean of 0.00 and standard deviation of 2.00 was often effective, although further experimentation with the specific values was sometimes required. In rare case in which the difficulty parameter could not be brought within an acceptable range through the imposition of a prior distribution, then the value was fixed to the extreme acceptable value: 3.98 for values that remain well above that point, and -3.98 for the rare value that remained well below that point. Having completed an IRT run that generates acceptable parameter value estimates, the next step was to select the items for which the parameter values were fixed to the item bank values on the final IRT run. First, available current item bank parameter values for items on the new assessment were retrieved from the database. Items with low discrimination parameters were removed from consideration. Items with extreme difficulty parameters were also eliminated from consideration. Items that remained after this first set of eliminations were subject to the next step, which was a comparison between the item bank parameter values and the parameter estimates generated for the new assessment on the first IRT analysis for the assessment. For the purposes of this comparison, attention was focused on the discrimination parameter. If the item bank discrimination parameter did not differ from the newly estimated discrimination parameter by more than an arbitrarily set value of 0.25, then the item was selected as one for which the parameters were fixed to the item bank values on the final IRT analysis. If the required minimum of items remained at this point, then they comprised the set of items for which parameters were fixed to the item bank values, and the final IRT analysis was run. If, however, fewer than 20% had survived the culling process at this point, the acceptable range for differences between item bank and district discrimination parameter estimates was broadened to 0.50, and then, on very rare occasions, to 0.75, until the minimum number of items had been identified. Once the set of items that were to be fixed to item bank parameters was identified, the final IRT analysis was run. In this analysis, in addition to fixing a set of item parameters to the item bank values, the mean and standard deviation of the ability distribution were estimated.

Benchmark Assessment Development 1.800.367.4762
in the Galileo K-12 Online Educational - 19 - ati-online.com Management System © Assessment Technology, Incorporated 2011
Item calibration is a continuous process in the ATI system. The ongoing approach to item calibration continues to utilize the bank as anchor. The only notable change is that the number of items with fixed parameters has been increased to 30%. Currently approximately 180,000 students from the states of Arizona, Massachusetts, and California contribute to the item calibration process.
iv. Accommodating Stability and Change
The item calibration process outlined above anchors all of the items in a bank to a common scale. The provision of an anchor providing a common scale makes it possible to assess progress over time. This benefit occurs within the context of a rapidly changing educational landscape. Standards are changing as states struggle with the task of establishing goals that adequately reflect the challenges of citizenry in the 21st century. Instructional content is also changing to keep pace with rapid advances in knowledge and technology. In order to adequately reflect progress in the context of rapid technical and social change, the item calibration techniques used to place test scores on a common scale must provide the necessary anchor to reflect progress and at the same time be sensitive to technical and social advances that are changing educational goals, instructional methods and student performance. ATI has adopted a dynamic approach to item calibration to meet the challenge of accommodating change. As indicated above, each time an assessment is administered, parameter estimates for some items are fixed at previously estimated values. The fixed estimates provide the foundation for the anchor needed to place scores on a common scale. Parameters for other items are estimated from the data. Items with estimated parameters make it possible to accommodate change by continuously refreshing the parameter estimates in ATI item banks. Over time parameter estimates for all items are refreshed. For example, an item whose parameters are fixed for one assessment may be estimated in a different assessment. The process of continuously refreshing item parameters creates a set of parameter estimates for each item in a bank. The stability of the estimates can be assessed by examination variations in estimates within each parameter set (D. Thissen, personal communications, March, 2005, January, 2007). The combination of fixed and estimated parameters provides the necessary stability to place scores from different assessments on a common scale and the flexibility to detect and accommodate change as it inevitably occurs over time. Over time, the process of refreshing item parameters produces a set of parameter estimates for each item. All parameter estimates for a given item are retained in the database. However, it is the most recent estimate that is used to place assessment scores on a common scale. The set of parameter estimates for each item serves as a history of that item’s performance on many district assessments in the context of different item selections. ATI periodically reviews

Benchmark Assessment Development 1.800.367.4762
in the Galileo K-12 Online Educational - 20 - ati-online.com Management System © Assessment Technology, Incorporated 2011
the history of items in the item banks for consistency of performance. A fair degree of consistency is generally observed as described below.
v. Monitoring Item Bank Parameter Stability
A primary concern has been the need to ensure that the calibration process works properly as additional item parameter estimates are added to the item banks and existing parameter estimates are refreshed. If the calibration process is functioning correctly, we would expect the mean parameter estimates within each grade and subject to remain relatively stable as the number of parameter estimates increases. ATI has been monitoring the mean item parameter estimates closely and has found very little change over time. For example, Table 4 indicates that the mean item parameter estimates for the banks changed very little during the period from February 14, 2007 to February 1, 2008, in spite of a 39% increase in the number of items with parameter estimates and numerous re-estimates of existing item parameters. The mean discrimination and guessing parameters are remarkably stable. To the extent that there is movement with the mean difficulty parameter, the trend is generally (with the exception of 1st and 4th grade math) one of movement toward a mean b value of 0.00. TABLE 4 Mean item parameter estimates for each grade/subject item bank
ScaleLevel Count a b c Count a b c Count a b c
Math 01 358 1.00 -0.35 0.22 490 1.01 -0.46 0.22 132 0.01 -0.11 0.00
Math 02 513 0.97 -0.71 0.22 645 0.95 -0.47 0.22 132 -0.02 0.24 0.00
Math 03 531 0.97 -0.52 0.22 813 1.00 -0.52 0.23 282 0.03 0.00 0.01
Math 04 623 0.93 -0.22 0.22 859 0.97 -0.34 0.23 236 0.04 -0.12 0.01
Math 05 549 0.97 -0.06 0.22 762 1.01 -0.01 0.23 213 0.04 0.05 0.01
Math 06 535 0.99 0.16 0.22 832 1.00 0.14 0.23 297 0.01 -0.02 0.01
Math 07 597 1.03 0.09 0.22 869 1.01 0.09 0.23 272 -0.02 0.00 0.01
Math 08 535 0.98 0.45 0.22 837 0.99 0.44 0.23 302 0.01 -0.01 0.01
Math HS 593 1.02 0.80 0.20 984 1.04 0.70 0.22 391 0.02 -0.10 0.02
Reading 01 269 1.04 0.04 0.22 342 1.10 -0.04 0.22 73 0.06 -0.08 0.00
Reading 02 373 1.11 0.52 0.22 512 1.04 0.32 0.22 139 -0.07 -0.20 0.00
Reading 03 407 1.12 0.03 0.21 643 1.10 -0.07 0.22 236 -0.02 -0.10 0.01
Reading 04 400 1.10 -0.07 0.21 603 1.10 -0.07 0.22 203 0.00 0.00 0.01
Reading 05 434 1.09 0.08 0.21 607 1.03 0.04 0.22 173 -0.06 -0.04 0.01
Reading 06 483 0.97 -0.17 0.21 674 1.03 -0.06 0.23 191 0.06 0.11 0.02
Reading 07 492 1.09 -0.14 0.21 537 1.12 0.01 0.23 45 0.03 0.15 0.02
Reading 08 445 0.96 -0.28 0.22 503 0.97 -0.16 0.22 58 0.01 0.12 0.00
Reading 09 302 1.04 -0.29 0.21 432 1.02 -0.07 0.21 130 -0.02 0.22 0.00
Reading 10 330 1.02 0.17 0.21 335 0.99 0.08 0.22 5 -0.03 -0.09 0.01
Reading 11 143 1.07 0.25 0.19 182 1.02 0.15 0.20 39 -0.05 -0.10 0.01
Reading 12 153 1.17 0.33 0.21 168 1.12 0.34 0.21 15 -0.05 0.01 0.00
Total/Mean 9065 1.03 0.01 0.21 12629 1.03 0.00 0.22 3564 -0.001 -0.003 0.008
SD 0.06 0.35 0.01 0.05 0.30 0.01 0.038 0.116 0.007
February 14, 2007 February 1, 2008 Magnitude of Change
B. Reliability If benchmark tests are to serve the purposes for which they are intended, they must be reliable. Reliability has to do with the consistency of information provided by an assessment. A particularly important form of reliability for

Benchmark Assessment Development 1.800.367.4762
in the Galileo K-12 Online Educational - 21 - ati-online.com Management System © Assessment Technology, Incorporated 2011
benchmark assessment as well as other types of assessment is internal consistency. Measures of internal consistency provide information regarding the extent to which all of the items on a test are related to the underlying ability that the test is designed to measure. Benchmark tests are designed to correlate with other measures of student proficiency including statewide assessments. A test that lacks internal consistency does not correlate well even with itself. Therefore, it is unlikely that it would correlate well with other measures. ATI routinely assesses marginal reliability as a part of the IRT analysis that is conducted on every benchmark assessment that is administered by a district. IRT analysis and marginal reliability estimation are conducted using Multilog (Thissen, Chen, & Bock, 2003). Marginal reliability coefficients are measures of internal consistency that may be easily computed in the course of psychometric analyses involving IRT. The marginal reliability coefficient combines measurement error estimated at different points on the ability continuum into an overall reliability coefficient, which corresponds quite closely to other widely used coefficients such as coefficient alpha. In this section we provide sample results of marginal reliability estimates.
i. Reliability Analysis: Sample and Method
The sample data illustrating the reliability of ATI benchmark assessments as well as that used in the discussion of validity in the following section are drawn from 20 school districts in Arizona and Massachusetts. The analyses focused on student performance on the 2006-07 benchmark assessments administered by these districts. The correlation and forecasting analysis conducted to assess the validity of benchmark assessments also included student scores on the spring, 2007 statewide high stakes assessment. In the case of Arizona school districts, the statewide test was the Arizona Instrument to Measure Standards (AIMS). In the Massachusetts districts, the statewide test was the Massachusetts Comprehensive Assessment System (MCAS). In both states, the high stakes statewide assessment is administered in grades 3-8 and high school. Although some of the sample districts administered benchmark assessments beyond this range of grade levels, only those grades were included in the analyses of reliability and validity, because the validity analyses conducted here require comparison of student scores on the benchmark assessments to those on the statewide assessments. Table 5 provides a descriptive summary of the sample included in the investigations presented on the following page. Note that the benchmark assessment scale is a within-grade scale, with reported scores that are built around a mean that increases by 100 points with each successive grade level, beginning with a mean of 500 for kindergarten. The standard deviation is set to 100 at each grade level. While this creates a "developmental scale" for scores on the several benchmark assessments administered within each grade, it does not create an across-grade scale like that for the scores for Arizona's statewide assessment tabulated in Table 1.

Benchmark Assessment Development 1.800.367.4762
in the Galileo K-12 Online Educational - 22 - ati-online.com Management System © Assessment Technology, Incorporated 2011
TABLE 5 Descriptive statistics for samples included in correlation and forecasting analyses presented in this document
District State Grades Subject(s)
Number of
Benchmark
Assessments
Mean Sample
Size per
Assessment
Mean Length
of
Assessments
1 MA 6-8 math 4 484 42
2 MA 3-8 math 3 413 42
3 MA 3-8 math 3 457 41
4 MA 5-8 math 3 1010 41
5 MA 6-8 math 4 773 36
6 MA 6-8 math 4 434 39
7 AZ 3-8 math, reading 3 1517 41
8 AZ 3-8 math, reading 3 346 42
9 AZ 3-8 math, reading 3 1746 42
10 AZ 3-8 math 3 455 50
11 AZ 3-8 math, reading
3 for grades 3-5,
2 for grades 6-8 259 38
12 AZ 3-8 math, reading 4 676 56
13 AZ 3-8, HS math, reading 3 416 40
14 AZ 3-8, HS
math all, reading in grades
3-8
3 except 2 for HS
math 418 43
15 AZ 3-8, HS math, reading
4 for grades 3-8,
1 for HS 485 45
16 AZ 3-8, HS math, reading
4 for grades 3-8,
1 for HS 443 44
17 AZ 3-8 math, reading 3 778 43
18 AZ 3-8, HS math, reading 4 1888 36
19 AZ 3-8, HS math, reading
3, except 2 for
HS reading 1238 50
20 AZ 3-8, HS math, reading 3 3307 38

Benchmark Assessment Development 1.800.367.4762
in the Galileo K-12 Online Educational - 23 - ati-online.com Management System © Assessment Technology, Incorporated 2011
ii. Reliability Analysis: Results
Figure 7 illustrates internal consistency information for benchmark assessments. The table presents marginal reliabilities for the 648 benchmark assessments included in the sample that is described in Table 5.
Count of sample benchmark assessments at each level of marginal reliability estimate
0
20
40
60
80
100
120
140
160
0.7
0
0.7
1
0.7
2
0.7
3
0.7
4
0.7
5
0.7
6
0.7
7
0.7
8
0.7
9
0.8
0
0.8
1
0.8
2
0.8
3
0.8
4
0.8
5
0.8
6
0.8
7
0.8
8
0.8
9
0.9
0
0.9
1
0.9
2
0.9
3
0.9
4
0.9
5
Marginal Reliability
Co
un
t
Figure 7 Marginal reliabilities for benchmark tests
In this example, the mean marginal reliability estimate is 0.88, with a standard deviation of 0.03. ATI benchmark tests with reliabilities in the .80s and .90s have been used effectively in forecasting and multi-test standards mastery initiatives. Reliability is directly affected by test length. Longer tests tend to be more reliable than shorter tests. Figure 8 plots the relationship between benchmark test length and reliability for the 648 sample benchmark assessments under consideration. The data in the figure suggest that adequate levels of reliability can generally be achieved with benchmark assessments that include 40 or more items. ATI recommends that benchmark assessments contain a minimum of forty-five items to ensure adequate reliability.

Benchmark Assessment Development 1.800.367.4762
in the Galileo K-12 Online Educational - 24 - ati-online.com Management System © Assessment Technology, Incorporated 2011
Figure 8 Relationship between assessment length and marginal reliability
C. Validity
Benchmark tests are district-wide assessments designed to measure the achievement of standards that have been targeted for instruction by the district. Benchmark assessments are interim measures of standards mastery, designed to be related to subsequent statewide assessments, which ultimately determine overall standards mastery. Insofar as benchmark tests are intended to reflect what is being taught in the district, they are generally customized to reflect the district curriculum. Insofar as benchmarks are used as indicators of standards mastery on statewide tests, they are subject to reliability and validity requirements not associated with short formative assessments.
Benchmark assessments are designed to serve four major functions. First, they can provide information on the mastery of standards targeted for instruction during specific time periods in the school year. Second, they can provide guidance as to which standards should be targeted next to promote further learning. Third, they can be used to estimate the probability of standards mastery on statewide assessments. Fourth, they can be used to measure progress toward standards mastery. This information can be used to adjust instruction in cases in which students are not making adequate progress in meeting standards. Examination of the validity of benchmark assessment data for these purposes must be investigated on an ongoing basis. Changes in state standards, district
Relationship between Assessment Length and Marginal Reliability
0.5
0.55
0.6
0.65
0.7
0.75
0.8
0.85
0.9
0.95
1
0 10 20 30 40 50 60 70 80 90
Assessment Length
Marg
inal
Reli
ab
ilit
y

Benchmark Assessment Development 1.800.367.4762
in the Galileo K-12 Online Educational - 25 - ati-online.com Management System © Assessment Technology, Incorporated 2011
curriculum, or enrollment all impact the performance of a given assessment with regard to these functions. The discussion that follows will illustrate the approach that is taken for evaluating the efficacy of the assessments for each function.
i. Mastery of Standards Targeted for Instruction
Benchmarks are typically designed to mirror the pacing calendar established by the district. One of the scores produced is a measure of student mastery of a given standard. This score is intended to provide a means for evaluating questions such as whether a given lesson has been effective or if additional instruction would be helpful. Typically benchmark assessments are constructed containing multiple items for each standard assessed. For example, a benchmark test could be constructed containing four items for each assessed standard. The next step is to establish cutoff points reflecting varying levels of mastery. The assignment of cutoff points reflecting varying performance levels requires judgments, which are generally provided by designated experts (Cizek, 2001). In the Galileo system, the judges responsible for determining performance levels come from each district engaged in benchmark assessment using the Galileo system. Variations in raw scores are used in establishing the cut points. For example, a district may define the cut point for standards mastery as three correct responses out of four. This approach is attractive to districts because it is easy to understand. However, a theoretically more satisfying approach is to use Item Response Theory (IRT) to estimate the true score for the subset of items (see, for example, Lord, 1980). The cut off points may then be applied to the estimated true score rather than to the observed score. One of the problems with subscale scores for small sets of items is that they tend to be unreliable. Procedures are available to enhance the reliability of item subsets. For example, it is possible to use an augmented scoring approach, which takes advantage of information from the entire test in estimating the score for the subset of items of interest (Thissen & Wainer, 2001). Because the approach takes advantage of information from the entire test, it increases the reliability of estimated scores. ATI has tools to estimate true scores for subsets of items and to implement the augmented scoring approach to increase reliability. As teachers and administrators become increasingly familiar with assessment occurring in the context of standards-based education, the probability of introducing these tools without creating excessive levels of confusion increases. ATI engages in consultation with the districts it serves regarding the introduction of these advanced tools into the system. Figure 9 below is a screenshot of the Galileo K-12 Online Development Profile report, which shows some sample standard level mastery data for a district in Arizona. In this case, the district has elected to have 5 items per standard on the assessment. District staff selected the items and determined the cut points that

Benchmark Assessment Development 1.800.367.4762
in the Galileo K-12 Online Educational - 26 - ati-online.com Management System © Assessment Technology, Incorporated 2011
would be used using review tools within Galileo. In this particular instance, the cut point for exceeding the standard was set at 80% or 4 items correct out of the 5 selected for the standard. The remaining cut points where 60% and 40% respectively for meets the standard and approaches the standard.
Figure 9 Development Profile Report, indicating student mastery of individual learning standards
The results that are shown in this report can be used to target the specific errors being made by students. For example, the teacher could drill down into the 29.36% group who fell far below the standard on the standard involving classification of triangles as scalene, isosceles, or equilateral. In doing so, it might become clear that all of the students in the group made similar types of errors. This piece of information could be used to guide future instructional decision making.
ii. Validation Considerations
Evaluation of the validity of these scores includes two issues, which must be evaluated each time a benchmark assessment is implemented. The first is whether the skills being tested by the items that district staff has selected for a given standard reflect all the skills included in the standard. For example, one of the standards listed in Table 1 above includes both addition and subtraction of

Benchmark Assessment Development 1.800.367.4762
in the Galileo K-12 Online Educational - 27 - ati-online.com Management System © Assessment Technology, Incorporated 2011
decimals. It would be important to know if the test included only items involving addition of decimals. As indicated earlier, ATI implements a benchmark assessment review process that enables districts to evaluate whether items selected to measure a given standard reflect the skills targeted for instruction. In the event that the district reviewers determine that an item does not reflect what is being taught, they replace the item. The second issue that should be considered is the psychometric performance of the items that have been selected. For example, it is important to consider whether the items include a sufficient range of difficulty to be useful in assessing students of varying abilities. This question is answered by reviewing the item parameter report, which is automatically produced for each benchmark assessment. In the typical case in which a three-parameter model is implemented, the report shows the Discrimination, Difficulty, and Guessing parameters for all the items selected for the test. The report allows the user to sort items by standard. Thus, it is possible to view the range of item difficulties represented within each standard assessed. The screen shot below shows an example of the item parameter report.
Figure 10 Sample Item Parameter Report

Benchmark Assessment Development 1.800.367.4762
in the Galileo K-12 Online Educational - 28 - ati-online.com Management System © Assessment Technology, Incorporated 2011
iii. Determining Which Standards to Target Next
Benchmark assessments serve the function of providing data that can assist the teacher in making determinations not only about the mastery of individual standards, but also in estimating the probability that a given standard will be suitable to teach next. Benchmark results can be used to determine the probability that students of a given ability level will be able to master a given set of standards. This information can be used to guide instruction. The estimated probability of standards mastery for students of a given ability level may be computed using IRT. The IRT estimate is based on ability level and characteristics of the items used to assess the standards. The estimated probabilities of standards mastery for a set of standards can be used to guide instruction for an individual student. For example, in providing individualized instruction, a teacher might initially choose to target the standard that the student would be most likely to be able to master. Instruction in more difficult standards would follow. Estimated probabilities of standards mastery can also be used in planning instruction for groups of students. For example, a teacher might choose to plan instruction for a group of students at risk for not meeting state standards. In this case the selection of standards to be targeted for instruction would be based on the average ability of the group and characteristics of the items used to assess standards mastery. Results from the teaching strategy report are shown in Figure 11 below. This report is designed to present information on mastery probability in a fashion that will allow the teacher to make decisions about learning standards that they might wish to target in fashioning an intervention. The IRT based probability estimate is shown along with the raw score,.

Benchmark Assessment Development 1.800.367.4762
in the Galileo K-12 Online Educational - 29 - ati-online.com Management System © Assessment Technology, Incorporated 2011
Figure 11 Teaching Strategy Report
Note that the standards are listed with those that have the lowest probability of mastery on the top of the list. The Teaching Strategy Report allows the teacher to see which standards would have the greatest impact on overall score were they to be mastered. In those cases where the teacher has run this report for a group of students who are suspected of needing intervention in order to keep them on track to pass the state test, the standards at the top of the list may be selected as a starting point. The teacher may also choose to start at the bottom of the list with those standards that have a higher probability for mastery.
iv. Validity Analysis: Relationship Between Mastery of Individual Standards and Demonstrating Mastery on Statewide Assessment
The issues that must be considered in evaluating the validity of the scores produced for this function are similar to those described for evaluating overall mastery. The psychometric performance of the items must be evaluated as should the skills that are covered by the items included on the assessment. As mentioned above, these can be evaluated on the item parameter report and in item review, which provides district staff the opportunity to evaluate the items selected for inclusion. Also of interest for validation is the extent to which mastery of the individual standards included on an assessment are associated with the likelihood of meeting the standard on the statewide test. This question may be evaluated

Benchmark Assessment Development 1.800.367.4762
in the Galileo K-12 Online Educational - 30 - ati-online.com Management System © Assessment Technology, Incorporated 2011
using categorical data analysis procedures to evaluate the relationship between achieving mastery on the individual standards and ultimately meeting the standard on the state test.
a. Sample and Method
The analysis of the relationship between mastery of individual standards and meeting the standard on the state test was conducted independently of the analyses of reliability, correlation and forecasting that are discussed elsewhere in this section. However, the data set was comprised primarily of the same Arizona districts that were used on those investigations and described in Table 5. Two of the districts included in Table 5 were not included in the current investigation because the statewide assessment data for those students had not yet been received from the client. In addition, one district, indicated as District 21 in Table 6, was included in the current analysis but not in the reliability, correlation, and forecasting analyses because of the limited sample size. The districts from which data were drawn in order to conduct the current analysis are listed in Table 6.

Benchmark Assessment Development 1.800.367.4762
in the Galileo K-12 Online Educational - 31 - ati-online.com Management System © Assessment Technology, Incorporated 2011
TABLE 6 Descriptive statistics for samples included in analysis of the relationship between mastery of individual standards and the demonstration of mastery on the statewide assessment
District State Grades Subject(s)
Number of
Benchmark
Assessments
Mean Sample
Size per
Assessment
Mean Length
of
Assessments
7 AZ 3-8 math, reading 3 1517 41
8 AZ 3-8 math, reading 3 346 42
9 AZ 3-8 math, reading 3 1746 42
10 AZ 3-8 math 3 455 50
11 AZ 3-8 math, reading
3 for grades 3-5,
2 for grades 6-8 259 38
12 AZ 3-8 math, reading 4 676 56
13 AZ 3-8, HS math, reading 3 416 40
14 AZ 3-8, HS
math all, reading in grades
3-8
3 except 2 for HS
math 418 43
17 AZ 3-8 math, reading 3 778 43
18 AZ 3-8, HS math, reading 4 1888 36
19 AZ 3-8, HS math, reading
3, except 2 for
HS reading 1238 50
20 AZ 3-8, HS math, reading 3 3307 38
21 AZ 3-8, HS math, reading 4 263 37 The analysis was conducted by first gathering each student’s data in response to all 2006-07 benchmark assessments. Student mastery of a specific standard was determined by the number of correct responses to assessment questions addressing the standard. All assessments administered within the 2006-07 school year were considered. A student was classified as having demonstrated mastery on the standard if he or she responded correctly to at least 70% of the questions targeting the standard. Standards that had been assessed with only one question during the year for a given student were not considered. The students’ scores on statewide assessment were also included in the data set. For each standard, a 2 x 2 matrix was created with the count of students in each possible configuration of demonstration of mastery on the individual standard in the context of the benchmark assessments and on the statewide assessment. Next, an odds ratio was calculated for each matrix and, finally, a chi-square goodness of fit test was also conducted for each matrix. Figure 12 presents some sample matrices and the resulting odds ratios and chi-square values for individual standards.

Benchmark Assessment Development 1.800.367.4762
in the Galileo K-12 Online Educational - 32 - ati-online.com Management System © Assessment Technology, Incorporated 2011
Standard:
Non-Master Master
Non-Master 2917 1703
Master 1411 7798
Odds Ratio: 9.47 3271.49
Standard:
Non-Master Master
Non-Master 346 680
Master 177 454
Odds Ratio: 1.31 5.83
Standard:
Non-Master Master
Non-Master 898 498
Master 164 803
Odds Ratio: 8.83 518.01
Standard:
Non-Master Master
Non-Master 3681 2934
Master 330 2209
Odds Ratio: 8.4 1355.67
Standard:
Non-Master Master
Non-Master 3404 2678
Master 495 2684
Odds Ratio: 6.89 1397.73
Individual
Standard
Chi-square goodness of fit:
Individual
Standard
Chi-square goodness of fit:
R08-S3C2-04. Evaluate the adequacy of details and facts from
functional text as it relates to a specific purpose.
AIMS
Individual
Standard
Chi-square goodness of fit:
M08-S3C3-04. Translate a sentence written in context into an
algebraic equation involving two operations.
AIMS
Individual
Standard
Chi-square goodness of fit:
R06-S1C4-03. Use context to identify the intended meaning of
words with multiple meanings (e.g., definition, example,
restatement, or contrast.)
AIMS
M04-S3C3-03. Solve one-step equations with one variable
represented by a letter or symbol using multiplication of whole
numbers. (e.g., 12 = n x 4)
M04-S4C2-02. Identify a tessellation.
AIMS
AIMS
Individual
Standard
Chi-square goodness of fit:
Figure 12 Mastery matrices, odds ratios, and chi-square goodness of fit values for several sample standards

Benchmark Assessment Development 1.800.367.4762
in the Galileo K-12 Online Educational - 33 - ati-online.com Management System © Assessment Technology, Incorporated 2011
b. Results
Figures 13 and 14 below show stem and leaf plots of the odds ratios obtained for Arizona math and reading performance objectives and the statewide test for Arizona (AIMS). The stem and leaf plots make it possible to display in a single figure hundreds of odds ratios showing relationships between individual standards, which are called performance objectives in Arizona, and standards mastery on the statewide test. The stem at the far left reflects the overall range of the ratios expressed in whole numbers. For example, the values in Figure 13 indicate ratios ranging from 1 over 17. The leaves (values after the decimal point) combined with the stem reflect the specific ratios observed for individual standards. For example, the highest ratio of 17.7 in Figure 13 indicates that students mastering a particular Arizona performance objective were 17.7 times more likely to meet the math standard on the Arizona statewide test than students who did not meet the standard on the performance objective.
Figure 13 Odds Ratios for Arizona Performance Objectives for Math, Grades 3-8
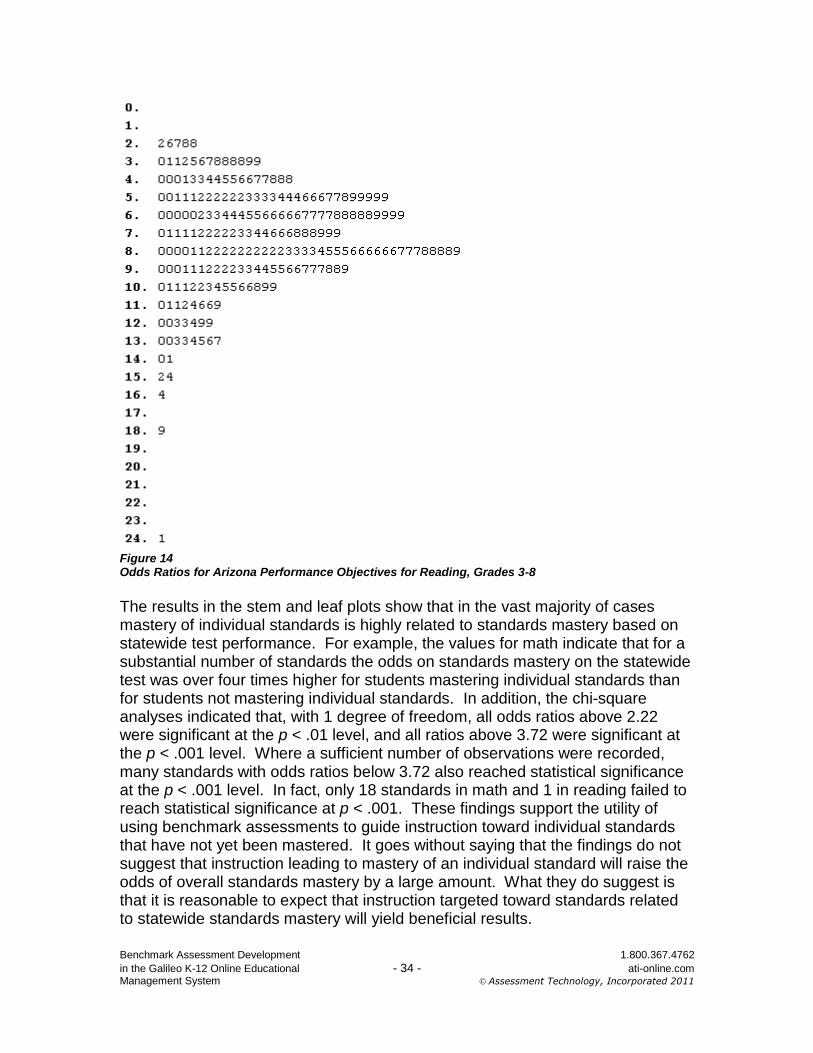
Benchmark Assessment Development 1.800.367.4762
in the Galileo K-12 Online Educational - 34 - ati-online.com Management System © Assessment Technology, Incorporated 2011
Figure 14 Odds Ratios for Arizona Performance Objectives for Reading, Grades 3-8
The results in the stem and leaf plots show that in the vast majority of cases mastery of individual standards is highly related to standards mastery based on statewide test performance. For example, the values for math indicate that for a substantial number of standards the odds on standards mastery on the statewide test was over four times higher for students mastering individual standards than for students not mastering individual standards. In addition, the chi-square analyses indicated that, with 1 degree of freedom, all odds ratios above 2.22 were significant at the p < .01 level, and all ratios above 3.72 were significant at the p < .001 level. Where a sufficient number of observations were recorded, many standards with odds ratios below 3.72 also reached statistical significance at the p < .001 level. In fact, only 18 standards in math and 1 in reading failed to reach statistical significance at p < .001. These findings support the utility of using benchmark assessments to guide instruction toward individual standards that have not yet been mastered. It goes without saying that the findings do not suggest that instruction leading to mastery of an individual standard will raise the odds of overall standards mastery by a large amount. What they do suggest is that it is reasonable to expect that instruction targeted toward standards related to statewide standards mastery will yield beneficial results.

Benchmark Assessment Development 1.800.367.4762
in the Galileo K-12 Online Educational - 35 - ati-online.com Management System © Assessment Technology, Incorporated 2011
The wide variability in the relationship between individual standards and statewide standards mastery is interesting. A number of scholars (e.g. WestEd, 2003) have taken the position that some standards (often called essential standards) are more important than others. For example, the mastery of some standards provides a foundation for subsequent learning. As a result, those standards deserve special emphasis in assessment and instruction. Some standards are of special importance because of their broad applicability to the development of skills in a variety of subject matter areas. These standards may also warrant special emphasis. The findings shown here are consistent with the view that some standards deserve special instructional attention. Additional research is needed to address this issue.
v. Forecasting Standards Mastery on Statewide Tests
One of the most important functions of benchmark tests is to forecast standards mastery reflected in statewide test performance. For example, suppose that a group of students have met the standard on three benchmark math tests. It would be useful to know the likelihood that those students would go on to meet the standard on the statewide test. Forecasts based on benchmark test performance can provide information on the probability of standards mastery on statewide tests. Without forecasting information, school personnel are left to guess whether or not their teaching is likely to lead to successful statewide test performance.
In order for forecasting information to be most useful, it must be based on what is currently being taught. This point can be illustrated by considering cases in which forecasts are not based on assessments of standards currently targeted for instruction. For example, previous statewide test performance could be used to forecast subsequent statewide test performance. However, the value of the forecasting would be limited because the results could not be used to determine what to teach to promote standards mastery on the subsequent statewide test. By contrast, benchmark tests used in forecasting do provide information about what to teach next.
Forecasting information is presented on the Aggregate Multi-Test Report. The Aggregate Multi-Test Report is capable of displaying results from one or more external tests or internal tests such as benchmark tests. When benchmark tests are selected, the report provides a Developmental Level Score for the selected tests. In the case in which two or more tests are equated, progress can be assessed. For example, if the score on the first benchmark test was 1000 and the score on the second was 1150, the user would know that substantial progress occurred from the first benchmark assessment to the second benchmark assessment. If statewide test scores are available from a previously administered statewide test, cut points for standards mastery can be set to correspond to cut points on the statewide test using equipercentile equating. For example, if a given cut point for the statewide test was at the sixtieth percentile, a

Benchmark Assessment Development 1.800.367.4762
in the Galileo K-12 Online Educational - 36 - ati-online.com Management System © Assessment Technology, Incorporated 2011
corresponding cut point could be set at the sixtieth percentile for the benchmark test. When forecasting information is available from a previous year, risk levels can be assigned based on patterns of standards mastery across multiple benchmark tests. For example, students failing to master standards on successive benchmark tests may be classified as highly at risk for failing to master standards assessed through performance on statewide tests. Also available on the report are probability estimates of the likelihood that the group of children on whom the report has been run have mastered the standards covered on the assessments. In the case of students who have been found to be highly at risk of not meeting the standards on state assessments, this information provides guidance that could be used in planning interventions. Classroom teachers and other individuals and groups engaged in interventions to promote student learning can use the Multi-Test Report to design interventions for individual students as well as for groups of students with common instructional needs. In some cases, interventions may occur in the context of regular classroom instruction. In other instances, interventions may require instruction in addition to that occurring in the classroom. In some instances, interventions may involve emersion in instructional content over an extended time span. In other cases, interventions may involve intense exposure to a limited number of objectives during a short time period. The drill down feature in the Multi-Test Report that identifies specific objectives to be targeted for instruction with specific students provides the information necessary to plan individualized intervention programs. For example, if a Multi Test Report indicated that instruction should focus on three objectives for a small group of students, an intervention plan could be customized to address those objectives. When test scores are placed on a common scale, report information on progress can be used to alert teachers early on to the need for interventions involving individual students or small groups of students. For example, if a student falls behind from one benchmark test to the next, an intervention may be warranted. Information on patterns of standards mastery across multiple benchmark tests can be used to identify students who are highly at risk for not meeting standards. For example, if a group of students were to fail three consecutive benchmark tests, they might be classified as highly at risk for not meeting standards. An intensive intervention program could be designed to address the learning needs of these students.
vi. Validity Analysis: Forecasting Mastery on Statewide Assessments
Although benchmark tests should generally be related to the statewide test, it is not expected that they be equated to the statewide test. The purposes of benchmark assessment and statewide assessment are different. Benchmark assessments are administered periodically during the school year to guide

Benchmark Assessment Development 1.800.367.4762
in the Galileo K-12 Online Educational - 37 - ati-online.com Management System © Assessment Technology, Incorporated 2011
instruction. The standards assessed on a benchmark test are typically selected to match standards targeted for instruction during a particular time period. By contrast, statewide tests are summative assessments generally administered toward the end of the school year for accountability purposes. The content of a statewide test is not intended to reflect instructional goals targeted for instruction at a particular time.
ATI routinely investigates the relationship between benchmark test and state test results, primarily by running two types of analyses: correlations and forecasting analyses. In this section we will provide samples of these analyses.
a. Sample and Method
The data used in the correlation and forecasting analyses were drawn from the same sample that was used for the analysis of the reliability of benchmark assessments that was described earlier in this document. The characteristics of the sample were listed in Table 5.
b. Results
Figure 15 shows a stem and leaf plot of the correlations between the sample benchmark assessments administered in Arizona and Massachusetts and scores subsequently achieved on the statewide tests. The stem shows the correlations to two decimal places. The leaves reflect the third decimal place. Correlations from districts in Arizona are indicated in black, and those from districts in Massachusetts are indicated in red.

Benchmark Assessment Development 1.800.367.4762
in the Galileo K-12 Online Educational - 38 - ati-online.com Management System © Assessment Technology, Incorporated 2011
Figure 15 Correlations between 2006-07 Galileo benchmark assessments and spring, 2007 statewide high stakes assessment
The average correlation of 0.76 illustrates that the benchmark assessments are quite highly related to the statewide tests. These results are quite typical of those obtained on an ongoing basis. The accuracy of forecasts derived from benchmark test performance is also routinely investigated. The fundamental question of interest in forecasting statewide test performance is that of identifying a student’s risk of not achieving standards mastery on the statewide test given his or her performance on benchmark assessments. We have repeatedly found that risk forecasting based on benchmark performance is sufficiently accurate to provide useful information for guiding instruction. Accurate forecasts can typically be made after giving a single benchmark early in the year. These forecasts usually become even more accurate as additional benchmarks are given and overall performance is evaluated. The data illustrated below show the forecasting accuracy achieved after administering 3 benchmark tests to a sample of 20 districts in Arizona and Massachusetts. Figure 16 shows the results obtained on the statewide testing for students exceeding the cut point on all three benchmark tests.

Benchmark Assessment Development 1.800.367.4762
in the Galileo K-12 Online Educational - 39 - ati-online.com Management System © Assessment Technology, Incorporated 2011
Figure 16 Stem and leaf plot of percents of students in each district, grade, and subject who exceeded the cut point on three benchmark assessments and who were accurately forecast to exceed the cut point on the high stakes statewide assessment
The figure shows that the benchmark results were almost without exception extremely accurate in forecasting statewide test performance. On average, students who passed all three benchmark tests had a 0.96 probability of meeting

Benchmark Assessment Development 1.800.367.4762
in the Galileo K-12 Online Educational - 40 - ati-online.com Management System © Assessment Technology, Incorporated 2011
the standard on the statewide test. With only a few exceptions, the probability was higher than 90%. Figure 17 shows forecasting accuracy for students who fell below the cut point for all three benchmarks assessments.
Figure 17 Stem and leaf plot of percents of students in each district, grade, and subject who fell below the cut point on three benchmark assessments and who were accurately forecast to fall below the cut point on the high stakes statewide assessment

Benchmark Assessment Development 1.800.367.4762
in the Galileo K-12 Online Educational - 41 - ati-online.com Management System © Assessment Technology, Incorporated 2011
These results show again that the forecasting was quite accurate. On average students who failed to meet the cut point on all three benchmarks had a 0.86 probability of not meeting the standard on the statewide test. It is notable that this distribution is somewhat wider than was the case with the group that passed all three benchmarks. Several districts included in this sample instituted interventions based on the results from benchmark assessments. Students received additional instruction based on having fallen below the cut points on the benchmark assessments. The reduction in forecasting accuracy may well reflect the success of these intervention efforts. Those students who were not on target to meet standards at the time of the benchmark assessments may have been moved to the point where they achieved sufficient mastery of the requisite skills to pass the statewide test. Figure 18 shows the overall accuracy achieved for all students. The plot includes both students who passed or failed all three benchmarks as well as those who exceeded the cut point on one or two of the assessments and fell below on the remainder.

Benchmark Assessment Development 1.800.367.4762
in the Galileo K-12 Online Educational - 42 - ati-online.com Management System © Assessment Technology, Incorporated 2011
Figure 18 Stem and leaf plot of percents of students in each district, grade, and subject demonstrating any pattern of performance on three benchmark assessments and whose performance on the high stakes statewide assessment was accurately forecast
These results again show a high degree of accuracy in the forecasts. On average students had a 0.84 probability of achieving their forecasted result on the statewide test. The somewhat lower average is attributable to the fact that this plot includes students who did not score consistently above or below the cut points on the benchmark assessments.

Benchmark Assessment Development 1.800.367.4762
in the Galileo K-12 Online Educational - 43 - ati-online.com Management System © Assessment Technology, Incorporated 2011
Data on forecasting accuracy are provided to districts every year so that they can evaluate the accuracy with which the tests that they designed were able to forecast standards mastery on statewide tests. This ongoing examination is necessary because the performance of assessments can be expected to change as curricula change. Changes in instructional strategies such as in implementation of interventions as discussed above can also be expected to impact the way the results of this type must be interpreted.
vii. Measuring Progress toward Standards Mastery
Benchmark assessments can play an important role in measuring progress toward standards mastery. Measuring progress can be achieved by placing scores from benchmark assessments administered over time on a common scale. This can be accomplished using scaling procedures based on IRT (see, for example, Williams, Pommerich, & Thissen, 1998). The measurement of progress is useful for assisting districts to determine the amount of progress students are making during the school year. This information is useful in instructional planning.
Progress data may be followed on several reports. In the Aggregate Multi-Test report, IRT based developmental level scores on a common scale are placed on a graph. In addition, users can display data evaluating the risk of not passing the state test. The screenshot below shows a graphical display demonstrating overall progress across three benchmark tests for a classroom.

Benchmark Assessment Development 1.800.367.4762
in the Galileo K-12 Online Educational - 44 - ati-online.com Management System © Assessment Technology, Incorporated 2011
Figure 19 Aggregate Multi-Test Report indicating progress across three benchmark assessments
This report shows increases in developmental level scores for the class from the first to the third benchmark. This result indicates that the overall math ability of the class has made steady progress. Also visible on the graph are the cut points used for forecasting statewide testing. Note that on all three benchmark tests the average score for the class has exceeded the cut point used for forecasting. It is also notable that the cut points increase from the first to the third benchmark. This result reflects learning that must occur throughout the year in order to stay on target to ultimately pass the statewide test.
viii. Validity Analysis: Development Level Scores as a Measure of Progress
The task of evaluating the validity of progress data raises several considerations that should be examined through ongoing research. The first question is whether in fact benchmark assessments placed on a common scale indicate progress when they are expected to do so. One way that this can be examined is by looking at the overall pattern of scores achieved by a sample of districts over the course of the year. Students can be expected to learn as they are exposed to

Benchmark Assessment Development 1.800.367.4762
in the Galileo K-12 Online Educational - 45 - ati-online.com Management System © Assessment Technology, Incorporated 2011
classroom instruction. Given the expectation of student growth, the overall pattern observed across districts should typically show an increase in benchmark scores as the year progresses.
a. Sample and Method
Student development level (DL) scores were recorded for benchmark assessments in math and reading/ELA that were administered in 80 school districts in the 2007-08 school year. The districts were located in Arizona, Massachusetts, and California. Tables 7 and 8 present the number of districts and the number of students contributing data to the analysis for each subject, grade, and benchmark assessment time period (e.g. benchmark 1, benchmark 2, etc.). Mean DL scores were calculated separately for each subject, grade, and time period. For example, for 4th grade math benchmark 1, a mean DL score was calculated from 25,769 individual student scores across 66 districts. As benchmark assessments are customized for each district, the DL scores within a given grade and subject are derived from a variety of different benchmark assessments administered within that time frame. TABLE 7 The number of individual student scores and number of districts contributing to the mean DL score in Math
GradeLevel Students Districts Students Districts Students Districts Students Districts
1st 16,214 35 15,289 40 13,121 31 13,085 14
2nd 21,036 47 23,387 57 21,172 54 15,186 22
3rd 26,072 66 30,958 66 29,496 67 5,935 22
4th 25,769 66 26,369 65 27,040 64 6,241 22
5th 27,075 70 29,670 63 27,811 65 7,111 23
6th 28,892 74 30,234 72 29,152 67 8,256 26
7th 28,896 80 30,677 65 26,896 63 8,457 27
8th 29,038 74 31,143 67 25,663 63 8,583 26
9th 26,452 38 25,173 25 11,492 32 8,649 17
10th 25,317 63 20,975 62 9,147 43 3,717 19
Benchmark #1 Benchmark #2 Benchmark #3 Benchmark #4
TABLE 8 The number of individual student scores and number of districts contributing to the mean DL score in Reading/ELA
GradeLevel Students Districts Students Districts Students Districts Students Districts
1st 17,344 28 16,208 33 13,039 29 12,691 13
2nd 23,168 44 25,462 51 20,425 47 14,863 21
3rd 26,636 58 32,133 60 27,866 56 5,980 22
4th 26,380 63 29,593 59 24,932 55 6,254 21
5th 25,318 64 28,517 54 24,199 53 5,940 20
6th 26,156 64 30,865 62 24,862 59 6,771 22
7th 25,744 62 27,337 53 23,562 52 6,676 22
8th 27,083 66 28,376 54 22,490 52 6,712 22
9th 21,433 42 23,049 36 10,288 29 9,663 14
10th 22,137 39 12,323 36 5,445 25 2,734 12
11th 3,796 16 2,778 16 644 11 147 3
12th 1,851 14 1,218 13 51 9 280 2
Benchmark #1 Benchmark #2 Benchmark #3 Benchmark #4

Benchmark Assessment Development 1.800.367.4762
in the Galileo K-12 Online Educational - 46 - ati-online.com Management System © Assessment Technology, Incorporated 2011
b. Results
Figures 20 and 21 show the mean scores obtained for four benchmark test in math and reading/English Language Arts during the year for the sample of 80 districts. In order to simplify the presentation of this data, all grade level scales were converted to a mean of 1000 with a standard deviation of 100.
Mean DL Scores for 2007-08 Benchmark Assessments in Math
800
850
900
950
1000
1050
1100
1150
1200
1 2 3 4 5 6 7 8 9 10
Grade
Mean
DL Bench. #1
Bench. #2
Bench. #3
Bench. #4
Figure 20 Mean development level scores for benchmarks 1, 2, 3, and 4 in math
Mean DL Scores for 2007-08 Benchmark Assessments in Reading/ELA
800
850
900
950
1000
1050
1100
1150
1200
1 2 3 4 5 6 7 8 9 10 11 12
Grade Level
Mean
DL
Bench. #1
Bench. #2
Bench. #3
Bench. #4
Figure 21 Mean development level scores for benchmarks 1, 2, 3, and 4 in reading or English language arts

Benchmark Assessment Development 1.800.367.4762
in the Galileo K-12 Online Educational - 47 - ati-online.com Management System © Assessment Technology, Incorporated 2011
Overall, the results provide clear support for the view that benchmarks assessments placed on a common scale within each grade will reveal positive changes in performance that are to be expected given that the assessments occurred during the period in which students are receiving instruction. For most grades, the scores show the expected progression with benchmarks later in the year being higher than those at the start of the year. The third grade math results provide a notable example with each average benchmark score being significantly higher than the prior score. Fifth grade math provides another good example. In some cases, the results show a somewhat different pattern. For example, the 8th grade ELA scores show a drop from the first to the second benchmark and from the third to the fourth benchmark. This result indicates that growth may not always be linear, which is a reasonable expectation. The results for 11th and 12th grade reading/ELA should be interpreted with caution due to the small and variable number of student scores at these grade levels.
ix. Path Analysis: Identifying the direct effect of benchmark 1 on performance on the statewide assessment
The benchmark assessments included in the previous two figures are not equated assessments, nor should they be. Benchmark assessments address different curricular emphases occurring at different points in the school year. Since the assessments have been placed on a common scale, they can be used to measure progress. Nonetheless, each benchmark may also play a unique role in providing information to guide instruction toward statewide standards mastery. This possibility can be investigated using simple path analysis techniques to investigate the relationship between the benchmark test results and the statewide test.
a. Sample and Method
In order to illustrate the importance of using information from the first benchmark assessment administered in the school year on guiding instruction and achieving the goal of improving student scores on the end-of-year statewide assessment, several districts were selected at random and path analyses were conducted on their student scores for a randomly selected grade and subjects. Four districts were selected at random: two from Arizona and two from Massachusetts. One or two grade/subject areas were selected from each district, also at random. For each district/grade/subject, student benchmark scores on benchmarks 1 and 2, as well as their scores on the statewide assessments were analyzed. As was indicated earlier in this document, in the case of Arizona school districts, the statewide test was the AIMS assessment, and in the Massachusetts districts it was the MCAS assessment. Table 9 provides a summary of the data used in these analyses.

Benchmark Assessment Development 1.800.367.4762
in the Galileo K-12 Online Educational - 48 - ati-online.com Management System © Assessment Technology, Incorporated 2011
TABLE 9 Descriptive data for samples used in path analyses
District Benchmarks Statewide Assessment Grade Subject N
Arizona District #1 2007-08 Spring, 2008 3 Reading 1685
Arizona District #1 2007-08 Spring, 2008 6 Math 1755
Arizona District #2 2007-08 Spring, 2008 8 Math 1041
Arizona District #2 2007-08 Spring, 2008 8 Reading 1036
Massachusetts District #1 2006-07 Spring, 2007 6 Math 392
Massachusetts District #2 2006-07 Spring, 2007 4 Math 440 The data in each data set were subjected to two path analyses: one including the direct effect of benchmark 1 on the statewide assessment scores, and a second in which that direct effect was removed from the model in order to test the hypothesis that student performance on benchmark 1 has no significant effect on his or her performance on the statewide assessment .
b. Results
The analyses are displayed in pairs of path diagrams. The first diagram in each pair shows the direct effect of an initial benchmark assessment, labeled BM1 on a subsequent benchmark assessment labeled BM2 and the direct effect of BM2 on performance on a statewide test, (i.e. AIMS or MCAS). In addition, the direct effect of BM1 on statewide test performance is displayed. The direct effect of BM1 on BM2 indicates that initial benchmark performance affects subsequent benchmark performance, which is to be expected since the two benchmarks are assumed to be measures of the same ability. The direct effect of BM1 on statewide test performance indicates that BM1 affects statewide test performance directly in addition to the indirect effect that BM1 has through its effect on BM2, which also affects statewide test performance. The model reflected in each of the initial diagrams is just identified. It has zero degrees of freedom and fits the data perfectly.
The second path diagram in each pair eliminates the estimated direct effect of BM1 on statewide test performance. Note that the arrow from BM1 to the statewide test is missing. The model for each of the second diagrams has one degree of freedom. The fit of the model to the data can be tested using the chi squared statistic. Moreover, the chi-squared statistic with one degree of freedom can be viewed as a difference chi-square, making it possible to compare the fit of a model assuming a direct effect of BM1 on statewide test performance to a model that assumes no effect of BM1 on statewide test performance. A weighted least squares chi-square analysis was conducted for each of the models. Chi-square values greater than 3.84 are significant beyond the .05 level of significance.

Benchmark Assessment Development 1.800.367.4762
in the Galileo K-12 Online Educational - 49 - ati-online.com Management System © Assessment Technology, Incorporated 2011
Figure 22 Path analysis for 3
rd grade reading scores for an Arizona district

Benchmark Assessment Development 1.800.367.4762
in the Galileo K-12 Online Educational - 50 - ati-online.com Management System © Assessment Technology, Incorporated 2011
Figure 23 Path analysis for 4th grade math scores for a Massachusetts district

Benchmark Assessment Development 1.800.367.4762
in the Galileo K-12 Online Educational - 51 - ati-online.com Management System © Assessment Technology, Incorporated 2011
Figure 24 Path analysis for 6th grade math scores for an Arizona district

Benchmark Assessment Development 1.800.367.4762
in the Galileo K-12 Online Educational - 52 - ati-online.com Management System © Assessment Technology, Incorporated 2011
Figure 25 Path analysis for 6th grade math scores for a Massachusetts district

Benchmark Assessment Development 1.800.367.4762
in the Galileo K-12 Online Educational - 53 - ati-online.com Management System © Assessment Technology, Incorporated 2011
Figure 26 Path analysis for 8th grade math scores for an Arizona district

Benchmark Assessment Development 1.800.367.4762
in the Galileo K-12 Online Educational - 54 - ati-online.com Management System © Assessment Technology, Incorporated 2011
Figure 27 Path analysis for 8th grade reading scores for an Arizona district
In every case that we examined, the model including a direct effect of BM1 on statewide test performance fit the data significantly better than the model assuming no direct effect of BM1 on statewide test performance. Accordingly,

Benchmark Assessment Development 1.800.367.4762
in the Galileo K-12 Online Educational - 55 - ati-online.com Management System © Assessment Technology, Incorporated 2011
the model assuming a direct effect of BM1 on statewide test performance is preferred over the alternative model to represent the data. This finding has important instructional implications. In particular it indicates that educators using benchmark results to inform instructional decisions cannot rely on measures of progress alone to guide their decisions. Each benchmark may also make a direct contribution to statewide test performance. Thus, each benchmark provides useful information to inform instruction. For example, if students fail to meet the standard on a given benchmark, it may be advisable to implement a re-teaching intervention whether or not they make substantial progress reflected in performance on a subsequent benchmark assessment.
VI. Conclusion
In this manual, we have outlined the system used by ATI to construct and evaluate customized benchmark tests used as interim assessments to guide learning in standards-based education initiatives implemented by local school districts. As we have discussed, the rapidly changing landscape of modern education requires continuous evidence of the utility of benchmark tests with respect to the purpose that they are intended to serve. Specifically, evidence is needed to determine the extent to which benchmark tests are useful in assessing the mastery of particular standards and determining next steps to promote additional learning. Evidence is also required to determine the extent to which benchmarks can accurately forecast the mastery of standards based on statewide test performance. Finally, evidence is needed to determine the utility of benchmark assessments in measuring student progress. As more options are made available in Galileo for using assessment data to guide instruction, it is anticipated that the nature of the evaluation process will also need to evolve. This manual is a beginning attempt to capture the benchmark assessment process and the research foundation for establishing its utility. The approach described and the questions that are addressed will evolve as will the technology for providing evidence of benchmark utility.

Benchmark Assessment Development 1.800.367.4762
in the Galileo K-12 Online Educational - 56 - ati-online.com Management System © Assessment Technology, Incorporated 2011
VII. References
Cizek, G.J. (2001). Setting performance standards: Concepts, methods, and perspectives. Mahwah, NJ: Lawrence Erlbaum Associates.
Haladyna, T.M. (2004). Developing and validating multiple-choice test items (3rd
ed.). Mahwah, N.J.: Lawrence Erlbaum Associates. Lord, F. M. (1980). Applications of Item Response Theory to Practical Testing
Problems. New Jersey: Lawrence Erlbaum. Webb, N.L. (2006). Identifying content for student achievement tests. In
S.M.Downing and T.M.Haladyna (Eds.), Handbook of Test Development (pp. 155-180). Mahwah, NJ: Lawrence Erlbaum Associates.
Thissen, D., Chen, W-H, & Bock, R.D. (2003). Multilog (version 7) [Computer
sottware]. Lincolnwood, IL: Scientific Software International. Thissen, D. & Wainer, H. (Eds) (2001) Test Scoring. Hillsdale, NJ: Lawrence
Erlbaum Associates. WestEd (2003). Building a Local Accountability System with Standards,
Assessments, and Standards-based Instruction. Module 1: Identifying and Using Essential Standards. (Available from WestEd, 730 Harrison Street, San Francisco, CA 94107)
Williams, V.S.L., Pommerich, M., & Thissen, D. (1998). A comparison of
developmental scales based on Thurstone methods and item response theory. Journal of Educational Measurement, 35, 93-107.