ben van beurden - barclays ceo energy-power conference 2016
TRANSCRIPT
Barclays CEO Energy-Power conference Royal Dutch Shell plc
Ben van Beurden Chief Executive Officer September 7, 2016

Ben van Beurden Chief Executive Officer Royal Dutch Shell plc
Royal Dutch Shell September 7, 2016
Definitions & cautionary note
Reserves: Our use of the term “reserves” in this presentation means SEC proved oil and gas reserves. Resources: Our use of the term “resources” in this presentation includes quantities of oil and gas not yet classified as SEC proved oil and gas reserves. Resources are consistent with the Society of Petroleum Engineers (SPE) 2P + 2C definitions. Resources and potential: Our use of the term “resources and potential” are consistent with SPE 2P + 2C + 2U definitions. Organic: Our use of the term Organic includes SEC proved oil and gas reserves excluding changes resulting from acquisitions, divestments and year-average pricing impact. Shales: Our use of the term ‘shales’ refers to tight, shale and coal bed methane oil and gas acreage.
The companies in which Royal Dutch Shell plc directly and indirectly owns investments are separate legal entities. In this release “Shell”, “Shell group” and “Royal Dutch Shell” are sometimes used for convenience where references are made to Royal Dutch Shell plc and its subsidiaries in general. Likewise, the words “we”, “us” and “our” are also used to refer to subsidiaries in general or to those who work for them. These expressions are also used where no useful purpose is served by identifying the particular company or companies. ‘‘Subsidiaries’’, “Shell subsidiaries” and “Shell companies” as used in this release refer to companies over which Royal Dutch Shell plc either directly or indirectly has control. Entities and unincorporated arrangements over which Shell has joint control are generally referred to as “joint ventures” and “joint operations” respectively. Entities over which Shell has significant influence but neither control nor joint control are referred to as “associates”. The term “Shell interest” is used for convenience to indicate the direct and/or indirect ownership interest held by Shell in a venture, partnership or company, after exclusion of all third-party interest. This release contains forward-looking statements concerning the financial condition, results of operations and businesses of Royal Dutch Shell. All statements other than statements of historical fact are, or may be deemed to be, forward-looking statements. Forward-looking statements are statements of future expectations that are based on management’s current expectations and assumptions and involve known and unknown risks and uncertainties that could cause actual results, performance or events to differ materially from those expressed or implied in these statements. Forward-looking statements include, among other things, statements concerning the potential exposure of Royal Dutch Shell to market risks and statements expressing management’s expectations, beliefs, estimates, forecasts, projections and assumptions. These forward-looking statements are identified by their use of terms and phrases such as ‘‘anticipate’’, ‘‘believe’’, ‘‘could’’, ‘‘estimate’’, ‘‘expect’’, ‘‘goals’’, ‘‘intend’’, ‘‘may’’, ‘‘objectives’’, ‘‘outlook’’, ‘‘plan’’, ‘‘probably’’, ‘‘project’’, ‘‘risks’’, “schedule”, ‘‘seek’’, ‘‘should’’, ‘‘target’’, ‘‘will’’ and similar terms and phrases. There are a number of factors that could affect the future operations of Royal Dutch Shell and could cause those results to differ materially from those expressed in the forward-looking statements included in this release, including (without limitation): (a) price fluctuations in crude oil and natural gas; (b) changes in demand for Shell’s products; (c) currency fluctuations; (d) drilling and production results; (e) reserves estimates; (f) loss of market share and industry competition; (g) environmental and physical risks; (h) risks associated with the identification of suitable potential acquisition properties and targets, and successful negotiation and completion of such transactions; (i) the risk of doing business in developing countries and countries subject to international sanctions; (j) legislative, fiscal and regulatory developments including regulatory measures addressing climate change; (k) economic and financial market conditions in various countries and regions; (l) political risks, including the risks of expropriation and renegotiation of the terms of contracts with governmental entities, delays or advancements in the approval of projects and delays in the reimbursement for shared costs; and (m) changes in trading conditions. There can be no assurance that future dividend payments will match or exceed previous dividend payments. All forward-looking statements contained in this release are expressly qualified in their entirety by the cautionary statements contained or referred to in this section. Readers should not place undue reliance on forward-looking statements. Additional risk factors that may affect future results are contained in Royal Dutch Shell’s 20-F for the year ended December 31, 2015 (available at www.shell.com/investor and www.sec.gov ). These risk factors also expressly qualify all forward looking statements contained in this release and should be considered by the reader. Each forward-looking statement speaks only as of the date of this release, September 7, 2016. Neither Royal Dutch Shell plc nor any of its subsidiaries undertake any obligation to publicly update or revise any forward-looking statement as a result of new information, future events or other information. In light of these risks, results could differ materially from those stated, implied or inferred from the forward-looking statements contained in this release. With respect to operating costs synergies indicated, such savings and efficiencies in procurement spend include economies of scale, specification standardisation and operating efficiencies across operating, capital and raw material cost areas.
We may have used certain terms, such as resources, in this release that United States Securities and Exchange Commission (SEC) strictly prohibits us from including in our filings with the SEC. U.S. Investors are urged to consider closely the disclosure in our Form 20-F, File No 1-32575, available on the SEC website www.sec.gov.

Royal Dutch Shell September 7, 2016 4
Strategy “Let’s make the future”
Leader: value + influence
Reducing our carbon intensity
Shared value with society
World-class investment case
STRATEGIC
Focus portfolio on resilient positions
Invest in advantaged projects
Value chain integration
FCF/share + ROCE growth
Conservative financial
management
OPERATIONAL
Reset cost and capital spending
First class execution projects +
operations
Unrelenting focus on HSSE and
licence to operate

Royal Dutch Shell September 7, 2016
Industry context Substantial + long lasting shifts in energy landscape
2005 2010 Q1 2016
2000 2050
$
From 7 to 9 billion by 2050 75% will live in cities
Global energy demand to double between 2000 & 2050
World needs more energy; less CO2
New sources New energy carriers New business models
OPEC, shales, shorter price cycles Requires new value creation models
Global population Growth in oil & gas demand Energy system in transition
Customer choice Continued oil price volatility Changing resources access
5

Royal Dutch Shell September 7, 2016
Re-shape Shell Driving strategy in multiple time horizons
Relentless portfolio high-grading
Strong free cash flow and returns
Cash engines: today Growth priorities: 2016+ Future opportunities: 2020+
Competitive + resilient
Funds dividends + balance sheet
FCF + ROACE pathway
Affordable growth in advantaged positions
Material value + upside
Managed exposure
Path to profitability
Cash engines 2020+
CONVENTIONAL OIL + GAS
CHEMICALS
OIL PRODUCTS
DEEP WATER INTEGRATED GAS
OIL SANDS MINING
SHALES NEW ENERGIES
6

Royal Dutch Shell September 7, 2016 7
Stronger results from smaller portfolio
Earnings on CCS basis, excluding identified items
Cash engines Example: Oil Products
Advantaged feedstock + supply
Asset sales
Products + brand
2007 2015
Global weighted average refining margin (RHS)
Oil products earnings
Million barrels/day $ billion $ per barrel
-20% -30% +25%

Royal Dutch Shell September 7, 2016
0
25
50
2011 2013 2015
8
Cash engines Example: Integrated Gas
IOC leadership position
Global footprint
Value from optionality
Million tonnes per annum
LNG volumes
Capacity at year-end in million tonnes per annum
Liquefaction capacity
2015 Shell LNG liquefaction volumes Shell LNG sales volumes
LNG Peru
QG-4
Atlantic LNG
Oman
Sakhalin
Malaysia
Sabine Pass
Equatorial Guinea
Pluto NWS
Brunei
QCLNG Gorgon
Nigeria
Shell + BG
16H1 extrapolated
Equity capacity Long-term offtake agreement Spot offtake in 2015 Deliveries in 2015
Royal Dutch Shell September 7, 2016 9
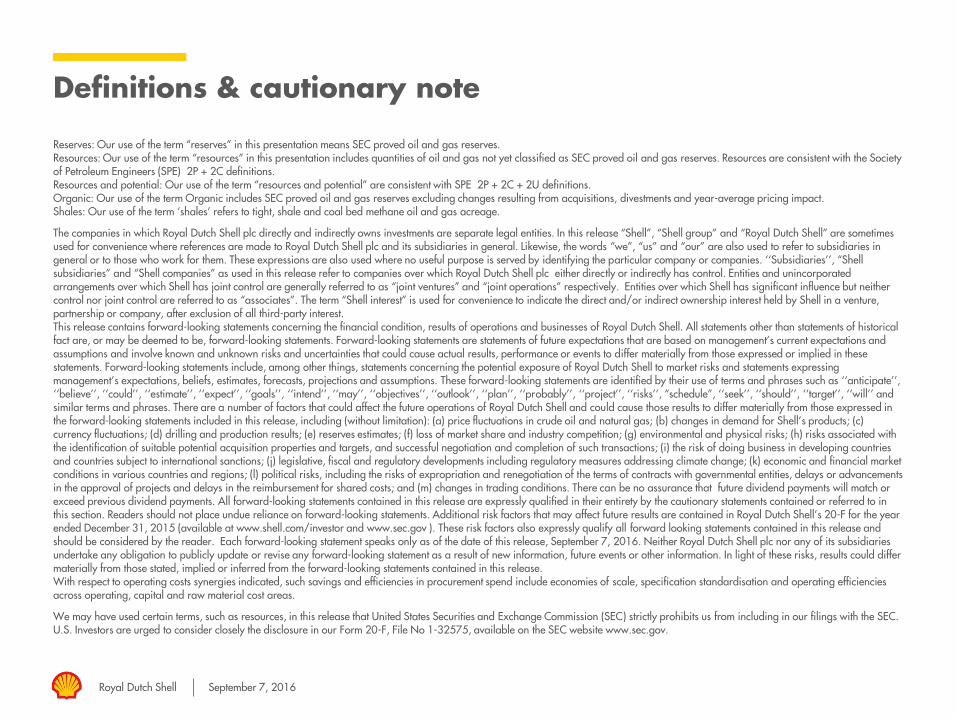
Growth priorities Example: deep water Shell + BG deep water growth
Brazil Gulf of Mexico Other
Lowering capital intensity
$ per boe break-even cost (examples)
Reducing drilling costs
# drilling days
2014 baseline Current
-30%
-40%
Current 2013/14 baseline
Variable spread rate + drilling materials cost
$ thousand
Delivering world class development funnel
Reducing break-even: new projects ~$45/bbl
2009 BC-10
2014 Mars B
Gumusut-Kakap
2010 Perdido
2005 Bonga
2001 Brutus
1999 Ursa
1997 Ram Powell
1996 Mars
1994 Auger
Brazil Pre-salt Coulomb Appo Vito Kaikias
Current estimate - under construction Previous estimate Current estimate - pre-FID
Example Gulf of Mexico
Under construction Malikai
Coulomb Appomattox
Brazil pre-salt
Thousand boe per day
2016 Stones

Royal Dutch Shell September 7, 2016
Production excludes divested assets (2013-14) and BG Haynesville addition (2016H1)
Future opportunities Example: shales
$ million per well
0
4
8
12
2013 2014 2015 2016H1
Average drill and complete costs – LRS wells
$ billion
0
2
4
2013 2014 2015 2016E
Capital investment
~12 billion boe
Resources
Thousand boe per day
0
125
250
2013 2014 2015 2016H1
Production
Material resource + potential ~12 billion boe 25% liquids, 75% gas Reducing costs + improving capital efficiency
Western Canada Gas
Western Canada LRS
Appalachia
Permian Argentina Haynesville
-60% +35%
Liquids Gas
Reserves
Contingent resources - other
Contingent resources - development pending
Prospective resources
-50%
Royal Dutch Shell September 7, 2016
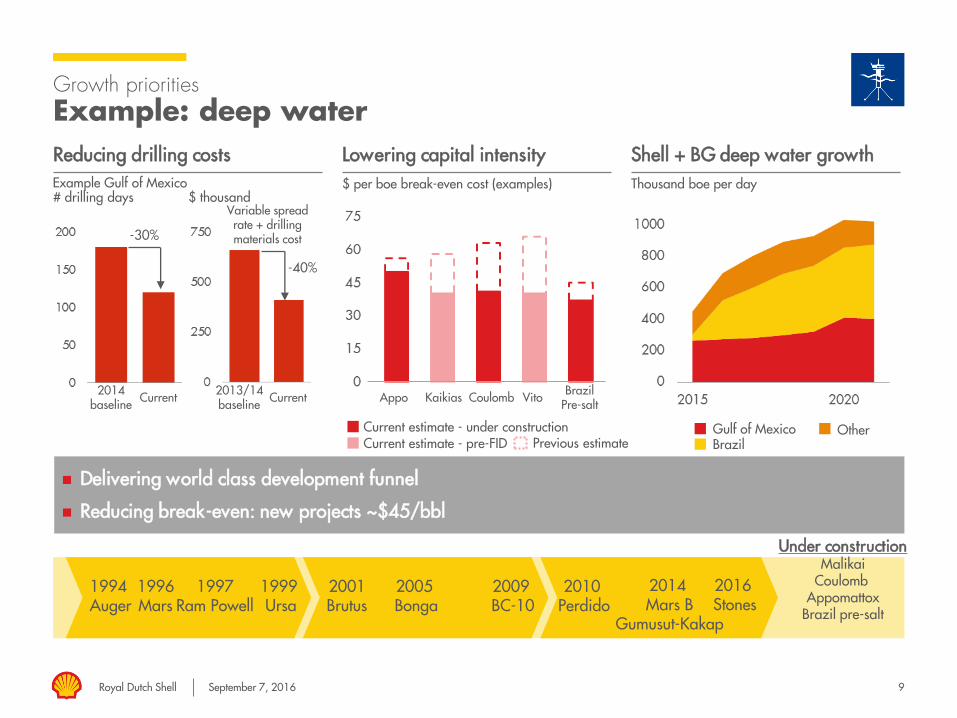
Manage down-cycle Financial performance
$ billion
Earnings + ROACE
$ billion
Dividend, buyback + gearing
$ billion
Cash flow
Priorities for cash: Debt reduction Dividends Buybacks + capital investment
%
-5
0
5
10
15
-10
0
10
20
30
2012 2013 2014 2015 16Q24Q rolling -15
0
15
30
45
-15
0
15
30
45
2012 2013 2014 2015 16Q24Q rolling
0
10
20
30
0
10
20
2012 2013 2014 2015 16Q24Q rolling
CFFO Cash investment Free cash flow (RHS)
Dividend declared Buyback
End period gearing (RHS)
Upstream Integrated gas
Downstream ROACE (RHS) Corporate/Other
% %
Royal Dutch Shell September 7, 2016 12
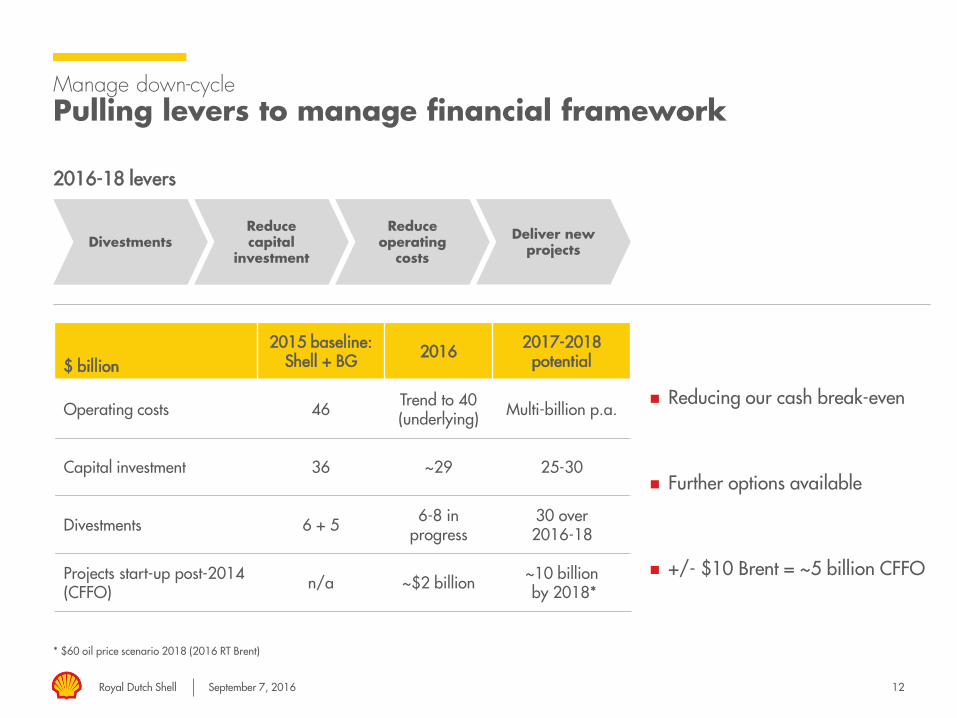
* $60 oil price scenario 2018 (2016 RT Brent)
Manage down-cycle Pulling levers to manage financial framework
2016-18 levers
Divestments Reduce capital
investment
Reduce operating
costs
Deliver new projects
Reducing our cash break-even
Further options available
+/- $10 Brent = ~5 billion CFFO
$ billion 2015 baseline:
Shell + BG 2016 2017-2018 potential
Operating costs 46 Trend to 40 (underlying) Multi-billion p.a.
Capital investment 36 ~29 25-30
Divestments 6 + 5 6-8 in progress
30 over 2016-18
Projects start-up post-2014 (CFFO) n/a ~$2 billion ~10 billion
by 2018*

Royal Dutch Shell September 7, 2016 13
Manage down-cycle Divestments
Integrated gas split out from Upstream from 2011 onwards
$ billion
Divestment program
$30 billion 2016-18 Progressing $6-8 billion 2016 5-10 countries; ~10% of production
0
10
20
30
2007-09 2010-12 2013-15 2016-18
Downstream/Corporate High grading ‘tail’ Infrastructure + mature positions Refocus portfolio
Upstream Integrated Gas
2016-2018 completed + announced $ billion
Completed – MLP 0.8
– Denmark marketing 0.3
– N.Z.: Maui pipeline 0.2
– MGL IPO 0.1
– Others 0.1
Total completed 1.5
Announced – Showa Shell ~1.4
– Brutus/Glider 0.4
– Malaysia refining
~0.2 – Anasuria cluster
– Maclure
Total announced ~2.0
TOTAL ~3.5
In progress – Motiva JV end
– N.Z.: upstream strategic review
– Thailand strategic review
– Selective North Sea strategic review
– Argentina Downstream strategic review
Divestments Reduce capital investment
Reduce operating costs
Deliver new projects

Royal Dutch Shell September 7, 2016
0
20
40
60
2013 2014 15Q24Q rolling
2015 16Q24Q rolling
2016E 2017 - 20 avg0
20
40
60
2013 2014 15Q24Q rolling
2015 16Q24Q rollingShell + BG
2016E 2017 - 20 avg
$25-30 billion
14
2016 excludes BG purchase price
$ billion
Capital investment
Manage down-cycle Lower & more predictable capital investment
Planning for $25-$30 billion range
$30 billion/year ceiling
Trending low in range today
Options to further reduce below $25 billion if warranted
Shell BG
-25%
Divestments Reduce capital investment
Reduce operating costs
Deliver new projects
Shell + BG C.I. on a cash basis
58
47 41
36
53
43 37
33 31 ~29 29 ~26

Royal Dutch Shell September 7, 2016 15
Manage down-cycle Reduce operating cost
Excluding identified items
$ billion
Operating cost
0
10
20
30
40
50
2014 15Q24Q rolling
2015 16Q24Q rollingShell + BG
end-2016run-rate
Shell BG
Divestments Reduce capital investment
Reduce operating costs
Deliver new projects
Substantial reductions delivered
“Lower for ever” mindset + BG synergies
Staff, supply chain + contractors
Divestments, growth, FX impacts
-$4 billion
~40
49 46
44 42

Royal Dutch Shell September 7, 2016
* BG organic growth from 1.1.2016 | LNG volume includes offtake
Significant oil & gas +
Downstream production under
construction
Capex to free cash flow
High margin / price upside
barrels
Manage down-cycle Deliver new projects
Cash operating cost <$15/boe Tax rate ~35%
16
Thousand boe per day*
2016-17 start-ups
2014-15 start-ups
LNG volume (RHS) 2018+ start-ups
Million tonnes per annum
Divestments Reduce capital
investment Reduce operating costs
Deliver new projects

Royal Dutch Shell September 7, 2016
Competitive financial data as published. Free cash flow: cash flow from operations less cash used in investing activities. $/ADR for European companies. ROACE underlying: European companies: CCS basis excluding identified items. US companies: reported earnings excluding special non-operating items. Capital employed on gross debt basis.
Financial dashboard
%
Gearing
%
ROACE
$/share
Free cash flow per share
%
Total shareholder return
0
10
20
30
Q211 Q212 Q213 Q214 Q215 Q216-30
-15
0
-10
0
10
20
30
Q211 Q212 Q213 Q214 Q215 Q216 -10
-5
0
5
10
Q211 Q212 Q213 Q214 Q215 Q216
0
10
203 years to Q2 2016 12 months to Q2 2016
Shell Peer group

Royal Dutch Shell September 7, 2016 18
Transformation
CREATE A WORLD CLASS INVESTMENT CASE
Improved capital efficiency: reduced investment/FCF ratio
Energy transition: CO2 footprint & new energies strategy
Simpler company: Exit ~10% production; 5-10 countries
Less cost + fewer people with BG than Shell stand-alone: 12,500 fewer staff
Capital efficiency: 2013 spending halved & $45 billion mitigated
Improving our metrics: FCF/share; ROCE; net debt
$30bn divestments: Innovative deals like Motiva, Showa and MLP
Portfolio growth: 1 mboe/d adds $10 bln cash flow
2019-2021 average
2013-2015 average
Brent
ROACE
~$60
~10%
~$90
8%
Organic free cash flow $20-25 billion p.a. $5 billion p.a.
$60 oil price scenario (2016 RT Brent

Questions & Answers

Barclays CEO Energy-Power conference Royal Dutch Shell plc
Ben van Beurden Chief Executive Officer September 7, 2016