belize country poverty assessment
TRANSCRIPT
Belize Country Poverty Assessment Executive Summary
Belize Country Poverty Assessment , Final Report ES1
Halcrow Group Limited, August 2010.
Belize Country Poverty Assessment
Executive Summary
1 Objectives and Approach
This study of poverty in Belize is one of a series of Country Poverty Assessments (CPAs) undertaken
throughout the Caribbean since 1995. Its primary objectives are:
To identify the extent, characteristics and causes of poverty in Belize
To evaluate the effectiveness of current policies and programmes in terms of their impact on the poor
and vulnerable groups of the population
To make recommendations for future policies and programmes to contribute to the reduction of
poverty in the country.
The CPA involved four principal components:
1. A review of available reports and statistics
2. A sample household survey (the Living Standards Measurement Survey - LSMS) which collected
information on household expenditure and incomes, general housing and household characteristics,
personal demographic and employment information.
3. A series of Participatory Poverty Assessments (PPAs) targeted at communities across the country and
identified vulnerable groups such as the unemployed, youth, the elderly and single parents.
4. A series of meetings and discussions to identify current programmes related to the reduction of poverty
and the provision of assistance to vulnerable groups (the Institutional Analysis).
The CPA has been a joint undertaking of a National Assessment Team (NAT) including members from
government and non-government organisations, and a Team of Consultants (TOC) appointed by the
Caribbean Development Bank.. NAT/ TOC workshops were held at key junctures of the study to ensure
that methodology, requirements, responsibilities, findings and conclusions represented the views of both
groups. The study started in October 2008; data collection occupied most of the first half of 2009 with the
Draft Final Report being submitted in December. National Consultations were undertaken in January
2010 and a presentation was made to CDB staff in March. Comments made at and after these
consultations have been incorporated into this Executive Summary.
2 Background and Context (Chapters 2 and 6)
2.1 Geographic and Historical Setting
Located on the Caribbean coast of Central America, Belize combines both Caribbean and Latin
characteristics. The country spans over 22,966 sq km and shares borders with Mexico in the North and
Guatemala to the West and South; there is a small direct sea link to Honduras but no land border. The
East is wholly bounded by the Caribbean Sea. About 60% of the country is covered by forest containing

Belize Country Poverty Assessment Executive Summary
Belize Country Poverty Assessment , Final Report ES2
Halcrow Group Limited, August 2010.
an abundance of fauna and flora. Larger scale agriculture, bananas, citrus and sugar cane are concentrated
in the low-lying areas. The Belize Barrier Reef (the second longest barrier reef in the world) is located
offshore.
Belize is located in the hurricane belt and, on occasion, gets badly affected by these. The most serious was
Hurricane Hattie in 1961 which hit Belize City, caused over 400 deaths and left thousands homeless;
almost half the city was destroyed; the devastation wrought led to the establishment of a new
administrative capital at Belmopan. More recently, Hurricane Iris wrought severe damage to Placencia and
other south coastal communities in 2001 while 2007 and 2008 saw hurricanes and tropical storms that
caused some of the severest flooding ever seen in several parts of the country.
For 400 years until the mid-1900s, Belize was dominated by the colonial Spanish and British regimes. The
Spanish first arrived in numbers in the mid-1500s but their rule was never really consolidated due to
continual resistance by the Mayas and incursions by, usually British, pirates. The Spaniard’s last serious
attempt to gain control over Belize ended in 1798. The British formally declared the territory as a colony
under the name of British Honduras in 1862 by which time the main export had shifted from logwood to
mahogany. Investment increased throughout the second half of the century with logging estates in the
south along the Guatemalan border providing the initial impetus for renewed Mayan immigration into
Toledo. The Creoles had been arriving as slaves since the 18th century while the Garifuna arrived as
refugees from colonial repression in St Vincent in the early 1800s. The East Indians arrived later in the
century as indentured labourers. Mestizos started moving into northern Belize from the mid-1800s fleeing
a vicious anti-European uprising by Mayans in Yucatan. As a result, Belize is ethnically and culturally
diverse with Creoles and Mestizos now accounting for around threequarters of the population.
The colonial government began taking over moribund leases in the 1920s and 1930s when the world
recession led to a near collapse of the economy as demand for timber plummeted; widespread poverty
ensued. Partly as a result, and learning from the nascent black consciousness movement led by Marcus
Garvey, this period saw the beginnings of the independence movement through the formation of trade
unions. Constitutional reforms were eventually initiated in 1954 and Belize was granted self-governing
status with a new constitution in 1964. Progress towards full independence was hampered by the border
dispute with Guatemala which continues to this day. Full independence was finally achieved in 1981 since
when the country’s democratic system has led to governments changing with virtually every election cycle.
2.2 Population
Belize’s current population is around 330,000 having increased substantially over the last 20 years due to
immigration from neighbouring countries as a result of civil war and poverty; a fifth of household heads
were born outside Belize. Other trends are decreasing birth rates, a slow drift to urban centres, decreasing
household size, and a declining proportion of Creoles in the population resulting from continued Mestizo
immigration from neighbouring countries. These changes are summarised in Table ES1.
Around 2/3rds of households contain children under the age of 18 years but more than a third of children
do not live with both parents.

Belize Country Poverty Assessment Executive Summary
Belize Country Poverty Assessment , Final Report ES3
Halcrow Group Limited, August 2010.
Table ES1. Demographic Changes
Annual Growth Rates
Characteristic 1980 1991 2000 2009 1980-2000 2000 - 09
Population 145,353 189,392 240,204 330,000 2.7% 3.7%
Crude Birth Rate (per 1000) 39 35 29 22
% <15 years 46% 42% 41% 34%
% Urban* 52% 47% 45% 51%
Average h’hold size na 4.7 4.5 4.0
% Female headed h’holds na na 27%** 30%
% Foreign born 9% 14% 15% 20%
* Affected by changing classification of urban areas. ** 2002.
2.3 The Economy
The economy of Belize is multi-faceted with major sectors being agriculture (citrus, sugar, bananas),
fisheries, petroleum and tourism, as well as the financial and trade infrastructure (tertiary sector). It is
however primarily a service economy with 55% of GDP coming from this sector; the primary sector now
accounts for around 11% of GDP compared with 14% in 2001 while secondary activities have increased
their share from 17% to 20% due to the exploitation of oil resources.
Belize is a small economy so sharp changes in a particular sub-sector (e.g. bananas, citrus or the closure of
the Williamson garments factory) will be reflected in the GDP as will the initiation or completion of a
major infrastructure project and disruptions caused by natural disasters.
The 2007 and 2008 economic indicators show Belize to be growing more slowly than its neighbours,
although its gross national income per capita is in the middle of the range. As noted by the International
Monetary Fund in 2008, “real GDP growth [in Belize] has been boosted by new oil discoveries and inflation remains low.
The debt restructuring of 2007 has eased liquidity pressures on the budget and external reserves”. Nevertheless, in 2008
the country experienced “surging prices for fuel and food… [the latter] up 13.3% mostly due to the rising cost of staples
such as rice, flour, bread, milk, cooking oil, eggs and whole chicken”.
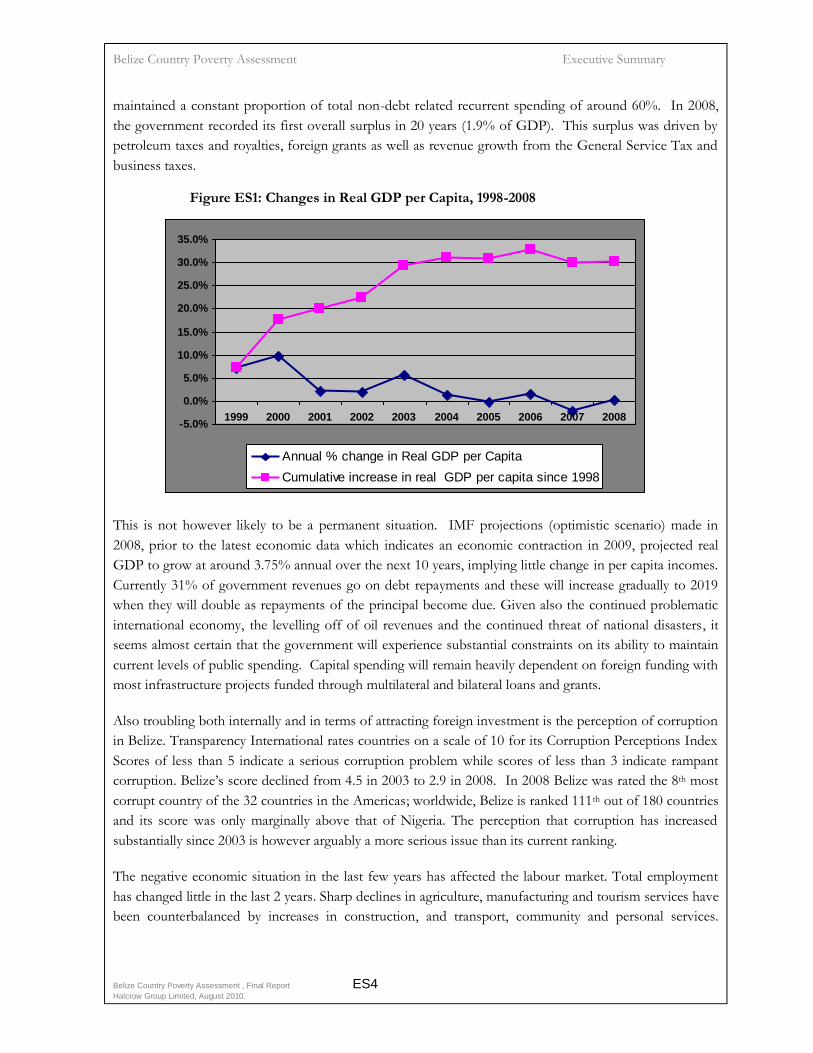
GDP/capita in constant prices over the ten year period 1999-2008 has increased by around 30%. This 10-
year average however masks the overall stagnation that has occurred in the last 5 years. Between 2003 and
2008, real GDP per capita barely increased (Figure ES1). Given that population is increasing by over 3%
annually, the economy will need to increase by at least 3% if real GDP per capita is not to decrease.
In the late 1990s and early 2000s, the Government pursued an expansionary policy involving
privatizations, borrowing and budget deficits. Despite frequent warnings from the IMF, Belize did little to
tackle the debt implications of these policies and at the end of 2006, the total and external debt ratios
stood at 92 and 84 percent respectively. The external debt ratio placed it third out 19 Latin American and
Caribbean countries. A successful debt restructuring exercise was undertaken in 2007 which enabled
Belize’s debts to become fiscally manageable. It also enabled continued growth in non-debt related
government recurrent expenditure which has increased from Bz$180 million in 2001 to Bz$425 million in
2008. As a result, the spending on the main social sectors (health, education and human development)
Belize Country Poverty Assessment Executive Summary
Belize Country Poverty Assessment , Final Report ES4
Halcrow Group Limited, August 2010.
maintained a constant proportion of total non-debt related recurrent spending of around 60%. In 2008,
the government recorded its first overall surplus in 20 years (1.9% of GDP). This surplus was driven by
petroleum taxes and royalties, foreign grants as well as revenue growth from the General Service Tax and
business taxes.
Figure ES1: Changes in Real GDP per Capita, 1998-2008
-5.0%
0.0%
5.0%
10.0%
15.0%
20.0%
25.0%
30.0%
35.0%
1999 2000 2001 2002 2003 2004 2005 2006 2007 2008
Annual % change in Real GDP per Capita
Cumulative increase in real GDP per capita since 1998
This is not however likely to be a permanent situation. IMF projections (optimistic scenario) made in
2008, prior to the latest economic data which indicates an economic contraction in 2009, projected real
GDP to grow at around 3.75% annual over the next 10 years, implying little change in per capita incomes.
Currently 31% of government revenues go on debt repayments and these will increase gradually to 2019
when they will double as repayments of the principal become due. Given also the continued problematic
international economy, the levelling off of oil revenues and the continued threat of national disasters, it
seems almost certain that the government will experience substantial constraints on its ability to maintain
current levels of public spending. Capital spending will remain heavily dependent on foreign funding with
most infrastructure projects funded through multilateral and bilateral loans and grants.
Also troubling both internally and in terms of attracting foreign investment is the perception of corruption
in Belize. Transparency International rates countries on a scale of 10 for its Corruption Perceptions Index
Scores of less than 5 indicate a serious corruption problem while scores of less than 3 indicate rampant
corruption. Belize’s score declined from 4.5 in 2003 to 2.9 in 2008. In 2008 Belize was rated the 8th most
corrupt country of the 32 countries in the Americas; worldwide, Belize is ranked 111th out of 180 countries
and its score was only marginally above that of Nigeria. The perception that corruption has increased
substantially since 2003 is however arguably a more serious issue than its current ranking.
The negative economic situation in the last few years has affected the labour market. Total employment
has changed little in the last 2 years. Sharp declines in agriculture, manufacturing and tourism services have
been counterbalanced by increases in construction, and transport, community and personal services.
Belize Country Poverty Assessment Executive Summary
Belize Country Poverty Assessment , Final Report ES5
Halcrow Group Limited, August 2010.
Unemployment has increased from 8% to 14% with much higher rates for females and those under 25
years.
2.4 Education, Health and Housing
Table ES2 summarises key indicators of education in Belize. Primary enrolment is high but secondary
school enrolment (which is not compulsory) is little over 50%. Under a quarter of secondary school
students come from rural areas compared with over half the population in this age group. Many students
at both primary and secondary levels also fail to complete their schooling in the allotted time. Over a third
of students taking the Primary School Education exam (PSE) in 2007 achieved a mark of under 50%; this
proportion is substantially higher in rural (41%) than in urban (29%) areas. A similar pattern occurs with
the regional CSEC examinations at secondary level. However enrolment rates for boys and girls are
broadly similar except at high school where girls outnumber boys by a ratio of 138:100.
Table ES2. Key Education Indicators, 2001-2007
Indicators 2001/02 2002/03 2003/04 2004/05 2005/06 2006/07 2007/08
Gross Enrolment Ratio (Preschool) 26.8 25.1 24.5 27.8 29.7 31.0 35.7
Gross Enrolment Ratio (Primary) 109.8 104.5 103.7 102.7 101.1 98.9 97.0
Gross Enrolment Ratio (Secondary) 60.6 58.2 59.2 57.3 60.4 55.1 53.5
Transition rate (primary - secondary) 87.4 90.3 84.2 87.7 84.6 85.3 86.2
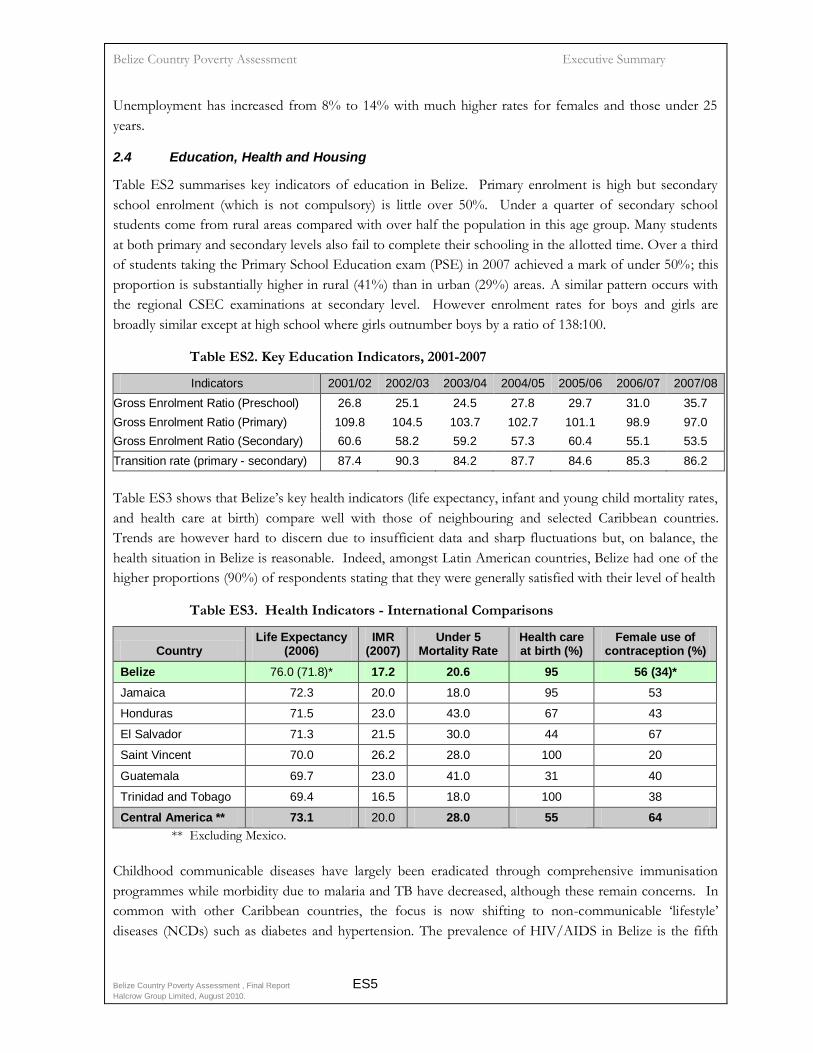
Table ES3 shows that Belize’s key health indicators (life expectancy, infant and young child mortality rates,
and health care at birth) compare well with those of neighbouring and selected Caribbean countries.
Trends are however hard to discern due to insufficient data and sharp fluctuations but, on balance, the
health situation in Belize is reasonable. Indeed, amongst Latin American countries, Belize had one of the
higher proportions (90%) of respondents stating that they were generally satisfied with their level of health
Table ES3. Health Indicators - International Comparisons
Country Life Expectancy
(2006) IMR
(2007) Under 5
Mortality Rate Health care at birth (%)
Female use of contraception (%)
Belize 76.0 (71.8)* 17.2 20.6 95 56 (34)*
Jamaica 72.3 20.0 18.0 95 53
Honduras 71.5 23.0 43.0 67 43
El Salvador 71.3 21.5 30.0 44 67
Saint Vincent 70.0 26.2 28.0 100 20
Guatemala 69.7 23.0 41.0 31 40
Trinidad and Tobago 69.4 16.5 18.0 100 38
Central America ** 73.1 20.0 28.0 55 64
** Excluding Mexico.
Childhood communicable diseases have largely been eradicated through comprehensive immunisation
programmes while morbidity due to malaria and TB have decreased, although these remain concerns. In
common with other Caribbean countries, the focus is now shifting to non-communicable ‘lifestyle’
diseases (NCDs) such as diabetes and hypertension. The prevalence of HIV/AIDS in Belize is the fifth

Belize Country Poverty Assessment Executive Summary
Belize Country Poverty Assessment , Final Report ES6
Halcrow Group Limited, August 2010.
highest amongst all Latin American Caribbean (LAC) countries and at 2.2% is over four times the LAC
average.
Cancers and heart diseases account for just under a quarter of all deaths while the main NCDs account for
another 14%. Together with infant deaths from causes other than ARIs, these afflictions account for just
under half of all deaths. Deaths from HIV/AIDS account for another 6% of all deaths while non-medical
causes (accidental/ non-accidental and transport related) account for 13%; these represented the major
cause of death amongst the main working age population (20-59 years).
The quality of Belize’s housing stock has improved in the last 10 years with increased provision of
electricity, safe water and concrete walls while overcrowding has decreased. Ownership of durable goods
has also increased, sometimes substantially as in the case of DVDs players and computers (Table ES4).
Table ES4. Housing Conditions and Ownership of Durables
Housing Indicator (% with) 2002 2009 Ratio 2002-09
Electricity for Lighting 87 93 1.07
Dwelling Unit Owned 66 67 1.02
Drinking Water Piped into dwelling/Purified water 50 71 1.42
Exclusive Use of Water Closet 45 69 1.53
Concrete Outer Walls 42 50 1.19
Overcrowding (<3 persons/ bedroom) 78 87 1.12
Ownership of Durable Goods
Gas or Electric Stove 90 87 0.97
TV 74 81 1.09
Refrigerators 65 75 1.15
Washing machine 57 71 1.25
Motor Vehicle 32 35 1.09
Computer 12 27 2.25
3 Poverty in Belize (Chapters 3 and 4)
3.1 The Definition of Poverty
Poverty is most often defined on the basis of indigence (or severe poverty) based on minimum food
requirements, and poverty lines (minimum food requirements plus an element of non-food expenditure)
derived according the CDB’s methodology. In 2009, the annual indigence line is around Bz$2,000
(US$1,000) per adult male while the poverty line is around Bz$3,400 (US$1,700)1.
Current definitions of poverty are more wide-ranging than those based on income alone. They include
consideration of, inter alia, living conditions, access to health and education, and less easily defined notions
1 These are the national average values; in practice, poverty and indigence lines were derived for each district.
Belize Country Poverty Assessment Executive Summary
Belize Country Poverty Assessment , Final Report ES7
Halcrow Group Limited, August 2010.
such as vulnerability, voicelessness, powerlessness, and lack of opportunity. The general concept of ‘well-
being’ has been used in this study to bracket these non-income aspects of poverty – this is an important
theme of this CPA.
In general, there is a high correlation between lack of income and lack of well-being. However this is not
always the case – some people and households living below the poverty line may not feel insecure or
threatened. Conversely, others may experience lack of well-being resulting from factors such as family
disruption, teenage pregnancy, crime, drug abuse even though their income puts them above the poverty
line.
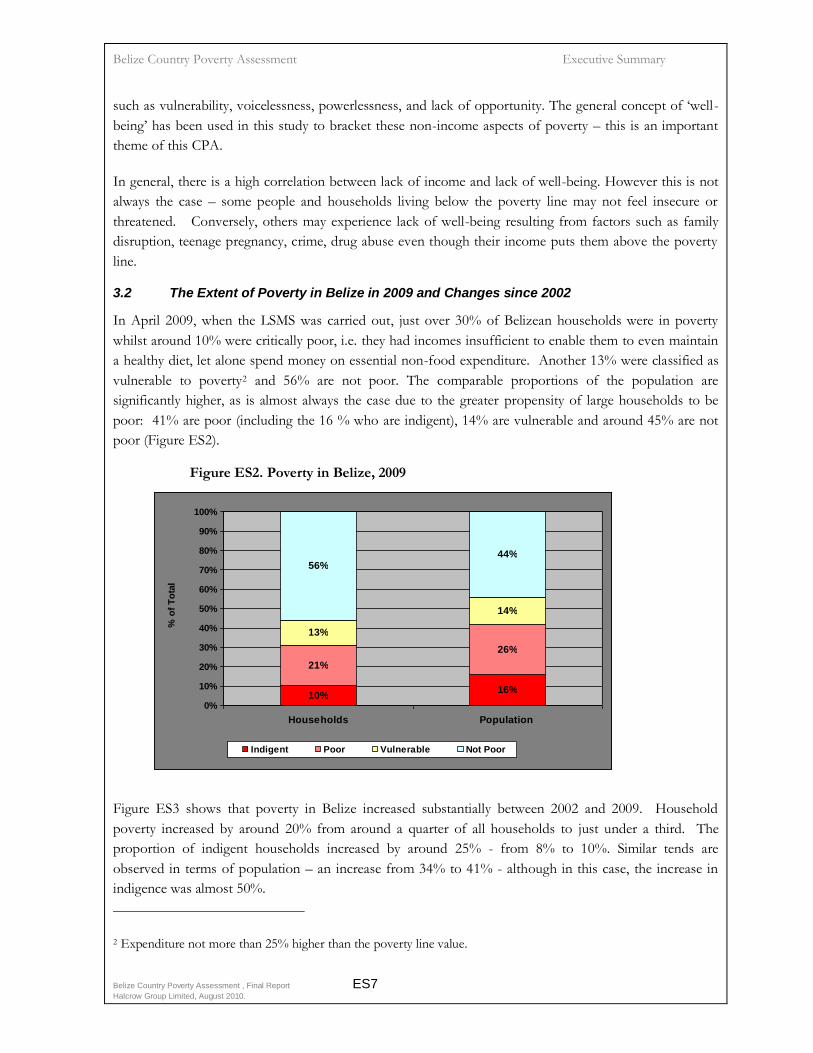
3.2 The Extent of Poverty in Belize in 2009 and Changes since 2002
In April 2009, when the LSMS was carried out, just over 30% of Belizean households were in poverty
whilst around 10% were critically poor, i.e. they had incomes insufficient to enable them to even maintain
a healthy diet, let alone spend money on essential non-food expenditure. Another 13% were classified as
vulnerable to poverty2 and 56% are not poor. The comparable proportions of the population are
significantly higher, as is almost always the case due to the greater propensity of large households to be
poor: 41% are poor (including the 16 % who are indigent), 14% are vulnerable and around 45% are not
poor (Figure ES2).
Figure ES2. Poverty in Belize, 2009
10%16%
21%
26%
13%
14%
56%44%
0%
10%
20%
30%
40%
50%
60%
70%
80%
90%
100%
Households Population
% o
f T
ota
l
Indigent Poor Vulnerable Not Poor
Figure ES3 shows that poverty in Belize increased substantially between 2002 and 2009. Household
poverty increased by around 20% from around a quarter of all households to just under a third. The
proportion of indigent households increased by around 25% - from 8% to 10%. Similar tends are
observed in terms of population – an increase from 34% to 41% - although in this case, the increase in
indigence was almost 50%.
2 Expenditure not more than 25% higher than the poverty line value.

Belize Country Poverty Assessment Executive Summary
Belize Country Poverty Assessment , Final Report ES8
Halcrow Group Limited, August 2010.
Figure ES3. Poverty in Belize, 2002 and 2009
8% 10% 11%16%
17%21% 23%
26%
76%69% 67%
59%
0%
10%
20%
30%
40%
50%
60%
70%
80%
90%
100%
Hholds 2002 Hholds 2009 Population 2002 Population 2009
Indigent Poor Not Poor
These data represent high levels of poverty and significant levels of indigence. These are compared to
those of neighbouring and other Caribbean countries in Table ES5.
Table ES5. International Comparisons of Poverty
Country Year
% Pop
indigent
% pop
poor*
Gini
coeff.
Food as % of
Poverty Line
Belize 2009 16 41 0.42 58%
Antigua 2005/6 4 19 0.48 39%
Dominica 2002 15 39 0.35 59%
St. Lucia 2005 2 29 0.42 31%
Trinidad & Tobago 2005 1 16 0.39 38%
Guatemala 2000 16 56 0.48 44%
Honduras 2006 24 51 0.46 51%
Mexico 2006 14 43 0.55 na
NB. Comparisons must be treated with caution due to timing of surveys and some methodologival differences. * Including indigents.
Belize has the highest incidence of population and household poverty of the Caribbean countries shown.
It is however on a par with Mexico and has significantly lower levels of indigence and poverty than both
Guatemala and Honduras. The food share percentage of the poverty line is a good indicator of relative
poverty levels as the food share proportion traditionally tends to decrease with affluence. Belize at 58% is
generally similar to neighbouring countries and Dominica but is much higher than Antigua, St Lucia and
Trinidad and Tobago. Belize does however have a lower Gini coefficient which indicates that it has a
more equal income distribution than most of the other countries shown.
Belize Country Poverty Assessment Executive Summary
Belize Country Poverty Assessment , Final Report ES9
Halcrow Group Limited, August 2010.
Reasons why poverty has increased so sharply are largely related to the economic situation which was
stagnating, especially in GDP per capita terms, even before the recession hit. Employment decreased
between 2007 and 2009 while unemployment jumped to 14%. Previous mainstays in the economy,
bananas and sugar cane (which particularly impacted Corozal and Orange Walk), have experienced
setbacks as did the papaya industry; activity in the Corozal Free Zone also decreased in 2009.
Furthermore, growth areas during this period such as San Pedro, Placencia and the oil sector, have not
generated significant multiplier (or trickle down) effects across the wider economy, although they will have
increased government revenues. Finally, several areas of the country, notably Corozal, Orange Walk and
Cayo were badly hit by severe flooding in 2007 and 2008. While the above changes largely affect the rural
areas, where just under half of the population reside, they will have a knock on effect on the economy of
market towns such as Corozal and Orange Walk. The sharp increase in poverty shown by the 2009 LSMS
should not therefore be seen as completely unexpected. It should also be noted that despite this increase in
poverty levels, the majority of the Belizean households (69%) and population (59%) are not poor. There
is also little evidence that more than a small minority of the population is going hungry.
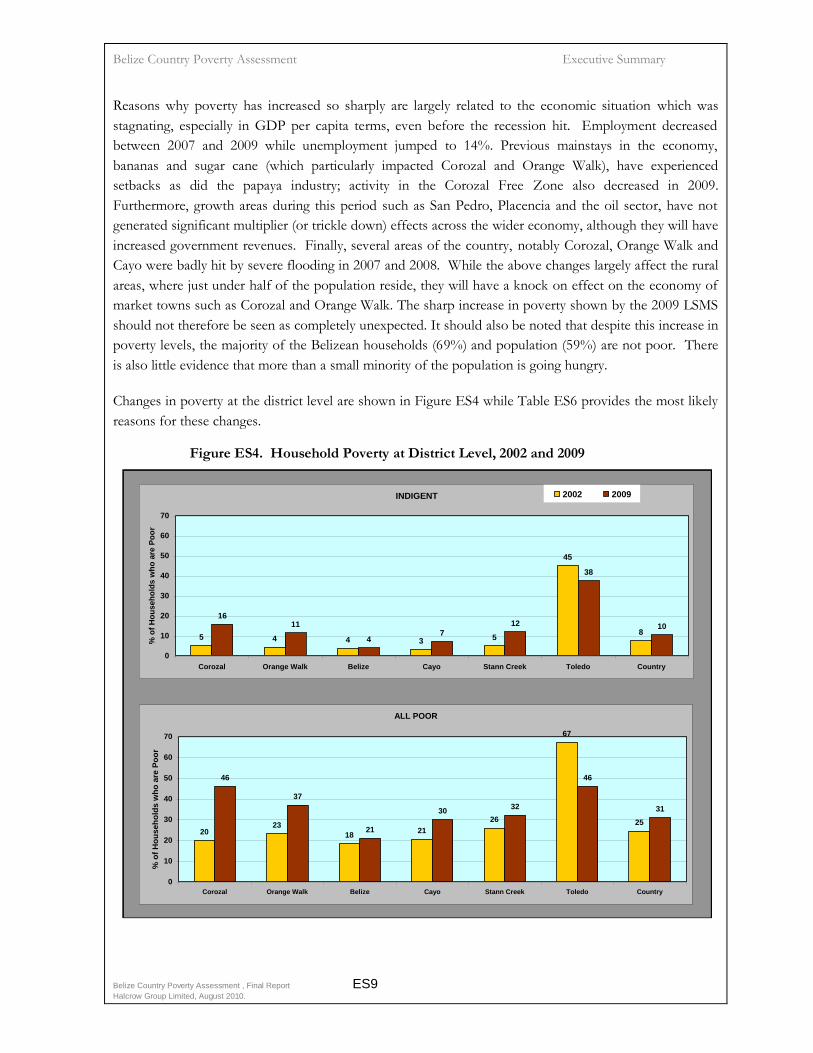
Changes in poverty at the district level are shown in Figure ES4 while Table ES6 provides the most likely
reasons for these changes.
Figure ES4. Household Poverty at District Level, 2002 and 2009
INDIGENT
5 4 4 3 5
45
8
1611
47
12
38
10
0
10
20
30
40
50
60
70
Corozal Orange Walk Belize Cayo Stann Creek Toledo Country
% o
f H
ou
seh
old
s w
ho
are
Po
or
2002 2009
ALL POOR
2023
1821
26
67
25
46
37
21
3032
46
31
0
10
20
30
40
50
60
70
Corozal Orange Walk Belize Cayo Stann Creek Toledo Country
% o
f H
ou
seh
old
s w
ho
are
Po
or

Belize Country Poverty Assessment Executive Summary
Belize Country Poverty Assessment , Final Report ES10
Halcrow Group Limited, August 2010.
Poverty and indigence have increased in all districts except Toledo where there has been a decrease,
although it still remains the poorest district in the country with by far the highest level of indigence. The
sharpest increase has been in Corozal which now has a similar level of overall poverty to Toledo.
Table ES6. District Level Changes in Household Poverty, 2002-2009
District Change,
2002-2009 Indigent All Poor Comment Likely Reason(s)
Corozal
(rank in 2002: 2, rank in 2009:
5) ***
Absolute* 10.7 26.2
Major increase in poverty;
poverty now almost as high as Toledo although indigence much lower.
Decline in sugar cane sector
and some areas very badly affected by 2008 floods as well as hurricane Dean in 2007
which caused an estimated $115 million of damages. Relative** 213% 132%
Orange Walk (4,4)
Absolute 7.1 13.5 Sharp increase in
indigence, 60% increase in poverty.
As for Corozal but to a lesser
extent. Relative 165% 60%
Belize
(1,1)
Absolute 0.2 2.5
Little change in indigence
but 14% increase in overall poverty; remains least poor district.
Sluggish economy whose
impact was partly offset by construction boom in San Pedro. Some villages badly
affected by flooding. Less affected by problems in agriculture. Relative 5% 14%
Cayo
(3,2)
Absolute 4.0 9.3 Sharp increase in indigence, 45% increase in poverty.
Badly affected by 2008 floods.
Relative 128% 45%
Stann Creek (5,3)
Absolute 7.0 5.8 Sharp increase in indigence but second
lowest increase in overall poverty.
Decline of banana industry counterbalanced by growth in
citrus and expansion in Placencia as tourist / condo centre. Relative 143% 22%
Toledo
(6,6)
Absolute -7.5 -20.9
Substantial reduction in poverty but indigence remains almost four times
the national average. Remains poorest district but only just.
Less affected by economic downturn due to remoteness, increase in cocoa production,
govt. programmes reduce social isolation increasing search for employment in
towns. 2002 poverty partly due to devastating hurricane in 2001, not so affected by 2008
floods. Relative -17% -31%
* Poverty 2009 – Poverty 2002 (percentage points) ** (Poverty 2009- Poverty 2002)/ Poverty 2002 (percentage change). *** 1 denotes least poor district and 6 the poorest.
Overall poverty and, especially, indigence are more evenly distributed across the country than they were in
2002 (Figure ES5). Thus Toledo now has under a third of indigent households compared to half in 2002
while its share of all poor households has decreased from a quarter to just over a tenth. Belize district
continues to account for the greatest proportion of the country’s poor households (28%).

Belize Country Poverty Assessment Executive Summary
Belize Country Poverty Assessment , Final Report ES11
Halcrow Group Limited, August 2010.
Figure ES5. Changes in the Geographical Distribution of Household Poverty
INDIGENT Households
8% 8%
18%
8%6%
51%
16% 16%
12%15% 14%
27%
0%
10%
20%
30%
40%
50%
60%
Corozal Orange
Walk
Belize Cayo Stann
Creek
Toledo
Dis
tric
t %
of
IND
IGE
NT
Hh
old
sALL POOR Households
9%
14%
28%
17%
9%
24%
16%17%
22%21%
12%11%
0%
5%
10%
15%
20%
25%
30%
Corozal Orange
Walk
Belize Cayo Stann
Creek
Toledo
Dis
tric
t %
of
AL
L P
OO
R H
ho
lds
NB. In each chart, the LEFT column is for 2002 and the RIGHT column is for 2009.
3.3 Characteristics of Poverty in Belize, 2002 and 2009
Poverty has increased for virtually every household or population sub-group (Table ES7). The Table also
shows how poverty rates vary between different groups of households and population. The results are
essentially as one would expect. Groups with a higher predisposition to poverty are rural households, large
(5+ persons) households, those with children, those headed by persons who have not completed primary
school or who are unemployed. In contrast, groups where poverty is lower include 1-3 person
households, female headed households and the elderly. The relationship between poverty and household
size merits highlighting: almost 90% of the indigent population and 80% of the poor population live in
households with 5 or more persons; and households with 6 or more persons have an indigence rate of
around 28%, over 2.5 times the national average.
The influence of household size is all pervasive and leads to the somewhat counterintuitive result that
nuclear households are more likely to be poor than those with single parents and young children (although
the difference is not that large). Similarly poverty rates are highest for households with 3 or more earners
due to the higher number of dependents. There is also little relationship between poverty and whether or
not a child is living with both or only one parent. Conversely, households where women work are far less
likely to be poor than those where they do not implying that providing income generation activities to
women in poorer households would help alleviate poverty – assuming that the increased burden of work
does not adversely impact the upbringing of children.
Irrespective of whether sub-groups show a lower or higher prevalence of poverty than the average,
policies and programmes will be needed to address the needs of poor people and poor households within
these sub-groups – just because female headed households are less prone to poverty does not mean that
they are not a potentially vulnerable group.

Belize Country Poverty Assessment Executive Summary
Belize Country Poverty Assessment , Final Report ES12
Halcrow Group Limited, August 2010.
Table ES7. Poverty Rates for Sub-Groups, 2002 and 2009
2002 2009 Ratio: 2009/2002 Comments
ALL Households 25% 31% 1.24
Urban / Rural
Urban 17% 21% 1.23 Rural poverty is substantially greater
than urban poverty. Rural 34% 43% 1.26
Household size (persons)
1 13% Well below average
2-3 na 15% Well below average
4 26%
5 40% High
6 & over 59% Very high
Sex of Head of Household
Male 26% 32% 1.23
30% of h’holds are female headed Female 22% 29% 1.32
Place of Birth
Belize born 30% 20% of households; poverty in 2002 was also higher amongst foreign born population. Foreign-born na 35% na
Education of HoH
None/ incomplete primary 50% High poverty rate but only 12% of
households
Complete primary 36%
Secondary School na 18% na Low
Tertiary 7% Very low
ALL Population 34% 41% 1.21
Age
<15 years 40% 50% 1.25 Around 30% of h’holds with children
have only 1 parent present.
15-24 years 34% 43% 1.26
25-64 years na 33% na
65+ years 27% 34% 1.26 7% of the population are elderly.
Ethnicity
Mestizo 30% 42% 1.40 Above average increase
Creole 27% 32% 1.19
Maya 77% 68% 0.80 Very high poverty but only account for
10% of population
Earners in household Little variation overall
0 30% 12% of households
1 na 33% na 46% of households
2 27% 30% of households
3+ 34% 12% of households
The housing conditions of the poor are significantly worse than those who households who are not poor,
except for home ownership which is higher as more not poor will rent. Overcrowding is much more
prevalent with 24% of poor households having more than 2 persons per room as against only 4% for the
not poor. Similarly, non-permanent walls, absence of toilets, piped water, electricity, toilets and indoor
kitchens are all much more likely to occur in poor households. The inferior construction of houses of

Belize Country Poverty Assessment Executive Summary
Belize Country Poverty Assessment , Final Report ES13
Halcrow Group Limited, August 2010.
poor households means that inevitably they will be worse affected if they are hit by hurricanes (although as
some informants pointed out they will be easier to rebuild). Conversely, the great majority of poor
households have indoor kitchens, electricity and piped water.
3.4 Difficulties encountered by the Poor
The PPAs provided information on the difficulties encountered by the poor. The greatest importance is
given to economic issues, high prices, low wages, lack of employment opportunities, agricultural and land
issues, all of which directly impact household livelihoods: 35% of all responses related to these aspects.
The ‘primacy’ of economic issues also came out strongly from the Village Surveys. Responses relating to
the quality, cost and access to education, health (quality, cost and access) and social problems (mostly
family and youth related issues and the lack of community cohesiveness) constituted around a fifth of all
mentions whilst problems related to infrastructure (primarily lack or cost of good quality water) account
for about a sixth of all response.
Also referred to very frequently was the negative impact of politics on development in general, specific
projects, land allocation and social cohesiveness resulting from perceived favouritism, unfulfilled promises
made during election campaigns, bias against previous government’s initiatives, unwillingness to deal with
councils run by the opposing political party and general ineffectiveness. Around two thirds of all focus
group discussions, community meetings and key informant interviews mentioned these issues, easily the
highest proportion of any issue mentioned. This issue received little mention in the 2002 CPA but was
prominent in both the 2005 and 2009 NPESAP consultations.
Poor households generally experience a higher degree of financial difficulties although many not poor
households also face difficulties, in particular those related to loans and debts, school fees and other/
entertainment expenditure - a likely reflection of the tightening of the economic situation. Amongst the
poor the most serious issues are a high level of indebtedness (75% have difficulties with debts and loans)
while substantial proportions of poor households have difficulties with utility and school costs – for
almost 30% of poor households, these costs represent over 20% of their total expenditure. Food bills are
less frequently mentioned indicating both that most poor families either have enough finance for their
food expenditure or, equally important, they manage to grow their own.
By and large these difficulties and problems encountered by poor households are little different than those
identified in previous studies. The main differences would therefore be a matter of degree rather than any
significant shift in the nature of the problems.
3.5 Coping Strategies
The strategies that the poor adopt to deal with the difficulties that they face consist of seeking assistance
from friends and families (around 40% of poor families receive financial assistance from friends or family
whether inside or outside Belize however in only a quarter of these cases does this assistance amount to
more than half their total expenditure), reducing expenditure, using savings, borrowing from creditors,
developing small income generating activities. These can be considered legitimate strategies. A minority
adopt illegal strategies (hustling and criminal behaviour, prostitution, illegal hunting, logging or trade with
Guatemala). However when asked what was the main strategy adopted, over a quarter said that they would
seek assistance from politicians. This reveals: (i) a high perception that politicians can resolve a
Belize Country Poverty Assessment Executive Summary
Belize Country Poverty Assessment , Final Report ES14
Halcrow Group Limited, August 2010.
household’s problems; (ii) that they are able to do this; (iii) that conventional approaches, i.e. through
government programmes or through implementing agencies, are inadequate and/or likely to fail; and (iv) a
dependency on politicians which erodes the ability to solve their own problems or seek assistance from
(and provide assistance to) family, friends, neighbours and communities.
3.6 The Causes of Poverty in Belize
The underlying causes of poverty in Belize can best be understood by splitting these into economic and
non-economic factors with the former largely applying to those who are able to work (whether or not they
are actually working) whilst the latter mostly apply to those who cannot work due to reasons of family
duties, age, disability or illness. For the latter groups, the required support is most frequently provided by
family and friends, with government and other organisations stepping in to assist those who are alone or
whose families are unable or unwilling to support them. Direct assistance from government is however
limited meaning that the majority of this group have to rely on family and friends or by resorting to the
coping strategies previously mentioned. This belies the notion that a welfarist culture has taken root in
Belize - the majority of the poor are self-reliant as they have to be.
However in most cases, the causes of poverty are primarily economic. This bears out recent research
undertaken by the World Bank3 which shows that economic issues were the reasons that two thirds of
households fell into poverty, as well as the perceptions of PPA participants which emphasised lack of
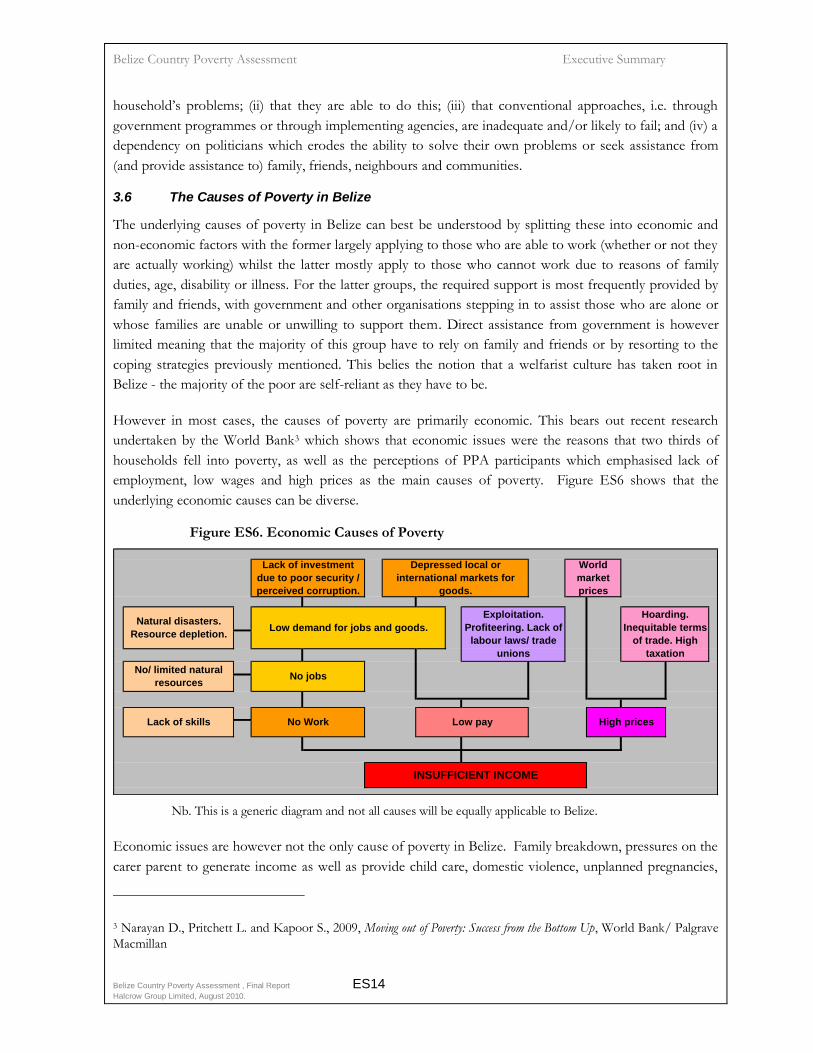
employment, low wages and high prices as the main causes of poverty. Figure ES6 shows that the
underlying economic causes can be diverse.
Figure ES6. Economic Causes of Poverty
Low pay High prices
Natural disasters.
Resource depletion.
No WorkLack of skills
No/ limited natural
resourcesNo jobs
INSUFFICIENT INCOME
Exploitation.
Profiteering. Lack of
labour laws/ trade
unions
Hoarding.
Inequitable terms
of trade. High
taxation
Lack of investment
due to poor security /
perceived corruption.
Depressed local or
international markets for
goods.
Low demand for jobs and goods.
World
market
prices
Nb. This is a generic diagram and not all causes will be equally applicable to Belize.
Economic issues are however not the only cause of poverty in Belize. Family breakdown, pressures on the
carer parent to generate income as well as provide child care, domestic violence, unplanned pregnancies,
3 Narayan D., Pritchett L. and Kapoor S., 2009, Moving out of Poverty: Success from the Bottom Up, World Bank/ Palgrave
Macmillan

Belize Country Poverty Assessment Executive Summary
Belize Country Poverty Assessment , Final Report ES15
Halcrow Group Limited, August 2010.
school non-attendance and dropping out, drug and alcohol use, all play their part – and can lead to a cycle
of continuing and inter-generational poverty from which it is very difficult for either parents or their
children to escape. Figure ES7 provides a diagrammatic representation of this cycle.
Figure ES7. Risk Factors and Outcomes related to Youth Behaviour
Risk Factors
Macro-environment
Economy/ employment
Politics & governance
Law Enforcement
Negative adult outcomes
Poverty/ inequality Risky youth behaviour
Negative youth
outcomes Unemployment
Cultural/ historical attitudes → Early sexual
initiation → Un- or under-employment →
Poverty / low earnings
Micro-environment Unsafe sex Poor physical/ mental health Uninvolved parent
Peers/ Role Models/ Social Networks → School non-
attendance → Teenage pregnancy → Unhealthy
relationships with partner, children
and others Family Crime & violence Teenage
prostitution
Poverty; low parental education →
Substance abuse/ dealing →
Social exclusion → Adult prostitution
Parental absence Homelessness/ vagrancy Incarceration
Sexual / physical abuse
Parental substance/ physical/ sexual abuse
Death → Substance abuse
Individual Criminal behaviour
Physical/ mental/ learning disability, Incarceration
Aggressive / antisocial behaviour Death
↑
←
← ← ↓
‘Protective’ factors which enable children to avoid the risk factors shown in the Figure include adequate
family resources (e.g. time, money, housing), family cohesion, more egalitarian gender roles and decision-
making, a caring parent, an authoritative parenting style (but without physical disciplining), presence of
two biological parents, and smaller family size (which, as our analysis has noted, reduces the risk of income
poverty). Other ‘protective’ factors relate to the individual (connectedness to parents and schools; social
skills, intelligence and faith) and to the local environment (presence of schools, churches, recreational
facilities, strong social and community networks, trustworthy law enforcement officers, a clean and safe
physical environment) levels. It nevertheless appears incontrovertible that without a secure family
environment, the presence of these other factors will be at best a palliative and at worst, as in the case
where drug trafficking and gangs operate, an avenue for antisocial and criminal behaviour.
Belize Country Poverty Assessment Executive Summary
Belize Country Poverty Assessment , Final Report ES16
Halcrow Group Limited, August 2010.
The analysis of LSMS data identified little in the relationship between family structure and poverty which
cannot be explained by family size. However, and it is big ‘however’, this analysis only relates to income
poverty. It does not, and cannot, reveal the extent to which the poor families are coping with the double
challenge of generating income and providing quality child care, or conversely how not poor households
are struggling to cope with single parenthood or an unstable family environment where neglect and/or
violence occurs. The same point can be made for older persons: the elderly living on their own have a
below average poverty rate (22%) but are more likely to suffer from loneliness and exclusion; conversely,
the poverty rate amongst the those living with other family members is above average (40%) but the
majority of these elderly are likely to feel more secure and included than those living on their own. In
short, the correlation between income poverty and household wellbeing is far from perfect. The crucial
implication is that these issues need to be addressed if this cycle of inter-generational poverty, which
imposes substantial economic and non-economic costs on society, is not to become embedded.
There is a widespread perception that government is a major cause of poverty in Belize. Whilst this is not
justified as most of the factors affecting the economic situation are outside the government’s control, it is
clear that political interference in the development process is having a negative impact on the
implementation of government policies and programmes. As the NPES, 2007-2011 comments:
“Across the country, participants expressed high levels of frustration, mistrust, apathy, cynicism and public
antipathy towards the political process due to perceived corruption …. [which] was seen as deeply imbedded in
Belize’s political culture and practiced in institutions across the country, including the public sector, statutory
bodies and within NGOs…. Lack of confidence in the political system and the commitment of government to
deal with poverty reduction was a common theme echoed at all the participatory events”.
The PPAs revealed that this statement is just as true now, if not more so, as it was then.
4 The Institutional Analysis (IA) (Chapters 5 and 6)
The objectives of the IA were to: (i) to identify the principal policies, programmes and activities relevant to
poverty reduction; (ii) to assess the scope and effectiveness of these interventions; and hence (iii) to
identify potential recommendations as to how existing activities and can be improved and new
interventions introduced. The IA was undertaken through interviews and round table discussions with
numerous government, non-government and private sector organizations as well as the review of annual
documents and other relevant material. The IA covered economic (agriculture, tourism and finance/
credit), infrastructure and social sectors. The general conclusions that emerged from the IA are
summarized below.
4.1 Economic Sectors
The most important findings of the IA for the economic sectors are:
There are no obvious opportunities for a rapid expansion of Belize’s main economic sectors, nor do
any new sectors with substantial job creation opportunities suggest themselves.
Improvements will thus have to come through incremental measures designed to improve training
(technical, financial and managerial), greater access to credit (tailored to different segments of the

Belize Country Poverty Assessment Executive Summary
Belize Country Poverty Assessment , Final Report ES17
Halcrow Group Limited, August 2010.
market, e.g. poor individuals, small enterprises and larger concerns), improved access to markets, and
better market information. Some banks are undertaking initiatives to improve credit to farmers. They
would also be willing to provide courses in basic financial education and responsibility to
schoolchildren.
The BRDP and NGO programmes relating to income-generation are seen as successful but their
overall coverage is low. There is thus a need for greater co-ordination between NGOs operating similar
programmes to share experience so that successful programmes can be scaled up.
Land allocation procedures should be simplified and made more transparent.
Efforts should be made to enable tourists to consume more local produce and buy more locally made
souvenirs. There was clear interest by the private sector in developing these linkages.
The Corozal Free Zone could be assisted in its attempt to expand its area and improve its
infrastructure, especially water supply, health facilities and fire services, the standard of which is being
questioned by both the operators and the Mexican authorities.
The effectiveness of Village Councils needs to be improved through wide ranging training and a
clearer definition of responsibilities if they are to become effective agents of local development.
4.2 Land, Housing and Small Scale Infrastructure
The principal implications arising from the discussions on these sectors are summarised in Table ES8.
Table ES8. Implications: Land Housing and Small Scale Infrastructure
Land Housing / Land use planning Community/ Small scale infrastructure
- Continue, and accelerate, land registration and transaction operations by LSD.
- Increase the transparency of land allocation procedures with a much reduced role for elected representatives.
- Inventorise crown lands and major private land holdings outside compulsory registration areas.
- Better co-ordination with other ministries on land policy and location of developments.
- Need for a policy for squatters in rural areas.
- Introduce simple eligibility criteria and monitoring mechanisms for housing improvement grant programme.
- Monitor and review house lots for the poor programme.
- Consider using NGOs to deliver housing programmes.
- Increase availability of land and housing for low income urban households.
- Ensure availability of O and M funds and training of local residents to carry it out.
- Improve community participation in all aspects of project design and execution
- Improve community ‘buy-in’ by insisting on some community contributions (in cash or kind)

Belize Country Poverty Assessment Executive Summary
Belize Country Poverty Assessment , Final Report ES18
Halcrow Group Limited, August 2010.
4.3 Social Sectors (Health, Education and Social Services)
Table ES9 summarises the generic conclusions that emerged from the IA for the social sectors.
Table ES9. Social Sectors IA – Generic Conclusions
The Positives The Negatives
- A very wide range of basic programme health,
education and social sector programmes
operated by government and NGOs.
- There are programmes targeted at families and
children at risk, educational support
programmes, parenting and life skills training,
nascent efforts to providing mentoring for boys
and ‘men promoting fatherhood’, HIV/AIDs
prevention and support, almost universal
immunisation programmes and continuous
progress in Mother and Child Health. There are
few obvious gaps implying that the need for
completely new programmes is limited.
- A generally favourable public perception of
social sector programmes. Those targeted at
the poor achieve good targeting ratios.
- Total social spending has been little impacted
by the economic recession and the country’s
large debt burden.
- A large number of very hard working and
dedicated professionals working in the
education, social and health sectors
complemented by active NGOs and teams of
volunteers.
- An increased perception that buy-in by
potential beneficiaries and their participation
throughout the programme implementation
process is crucial to success.
- A police force actively involved in community
policing and outreach activities designed to
preventing criminal behaviour and reducing its
likelihood in the future.
- Significant inter-agency co-ordination and
networking.
- A lack of resources, often chronic, afflicts most
agencies – MHDST’s annual budget at Bz$.5 million is
almost 30 times lower than that for education. This not
only means understaffing but also grossly inadequate
funds for administration, operations and maintenance.
As a result, valuable staff time is spent not on providing
services but on preparing project proposals to obtain
funds. As one MHDST informant commented: ‘I have
had to become a beggar to get what I need to do my
job’.
- Difficulties in providing trained and committed staff to
rural areas, i.e. just where high calibre teachers and
nurses/ doctors are needed.
- Inadequate management procedures to deal with
staff concerns, replace departing staff, address
administrative, operational and maintenance issues.
- Several key education indicators are static or in
decline and, even if this is not the case, they are not
improving. As one education informant stated: ‘We are
running hard to stand still’.
- The low coverage of most social service programmes,
whether providing direct assistance, counselling or pro-
active support, means that only a few of those in need
receive assistance.
- Duplication of activities with different agencies
involved in similar activities allied to a lack of inter-
agency co-ordination in the design and execution of
cross-cutting social sector programmes.
- Insufficient monitoring and evaluation.
- Political interference in the identification of
beneficiaries for targeted programmes. This issue came
up in virtually every discussion.
- Social spending is likely to come under increasing
pressure as debt repayments increase and government
revenues suffer from the economic downturn.
5 Special Studies (Chapter 7)
Throughout the study, Belize South Side and Toledo kept emerging as being concentrations of poverty
and other social and developmental issues: Belize South Side because of its poor housing conditions and
concentration of social issues, particularly violent crime; and Toledo because of the very high incidence of

Belize Country Poverty Assessment Executive Summary
Belize Country Poverty Assessment , Final Report ES19
Halcrow Group Limited, August 2010.
poverty, its isolated location in the south of the country, and its population dominated by the indigenous
Maya. It was also considered desirable to examine more closely how the interplay of economic issues,
social problems, government and NGO programmes, and political considerations ‘played out’ in the field.
Accordingly, the study undertook some additional research in both these areas.
5.1 Belize South Side
The Southside of Belize City covers an area of about 15 square kilometres with about 5,300 households
and 24,000 people. It is an older less developed area adjacent to wetlands with poor drainage, inferior
infrastructure and inadequate public services. Land is not clearly demarcated, there are no zoning plans,
and the area has witnessed a surge of lower income settlers due both to its proximity to the city centre, the
absence of defined land ownership for what are essentially swamps, and the lack of alternative locations
for those seeking to establish their own houses. Residential structures tend to be randomly located and
poorly constructed and many lack basic sanitary services.
Unemployment is high, estimated to be well above the national average of 14 percent, and what
employment there is characterised by informality, low wages and casual labour. A small sample of one of
the worst areas revealed two thirds of households to be headed by single parents and over 50% of heads
of household to be unemployed. The poverty of the area is also illustrated by the unwillingness of many
residents to connect to the electricity and water networks. The area is particularly prone to the social
issues described above, namely family breakdown, child neglect, drug trafficking that lead to a vicious cycle
of anti-social behaviour, crime, stigmatisation and social exclusion. Violent crime in the area is a major
feature: it is estimated that around 40% of the country’s murders occur in Southside which has under 10%
of the nation’s population4. And the problem appears to be getting worse: nationally murders increased by
45% between 2003 and 2007 with further increases in 2009; perpetrators appear to be getting younger and
younger while the local secondary school, Saint Martins, is being used as a ‘dumping ground’ for difficult
and excluded students from elsewhere in the city. The PPAs reveal little social cohesion and substantial
levels of apathy and insecurity amongst families. Focus Groups with youths also demonstrated the
pernicious social problems they face: absent fathers, over-stressed and impoverished mothers, lack of
money to go to school (although the schools are often willing to waive fees), leading to gang participation
as a way of providing security and fellowship and illegal behaviour as a means of generating income for
themselves and their families.
There is general agreement that urgent action is needed to improve living and economic conditions in
Southside and the area is specifically mentioned in the NPESAP. At present, aside from the schools, the
there are three important government initiatives that specifically target Southside:
The Southside Poverty Alleviation Action Project (SPAP).
The Yabra Police Station and Community Centre.
The National Health Insurance Scheme (NHIS).
4 Using the average number of murders over the last 7 years, this gives a murder rate per 100,000 of 135 which would
make it one of the most violent and dangerous non-conflict zones in the world.

Belize Country Poverty Assessment Executive Summary
Belize Country Poverty Assessment , Final Report ES20
Halcrow Group Limited, August 2010.
All of these can claim some success. SPAP has improved conditions in some of the worst housing areas
through the installation of drains (which enable residents to get to work and school during floods), roads,
water supply and house reconstruction (with priority given to small local builders for contracts); funding is
now being sought for a second phase. The NHIS, which provides a basic package of health services
available at local doctors and pharmacies as well as government facilities, has been fully established; 97%
of beneficiaries considered it had helped them. The Yabra Center was established in 2005 at the request of
residents dismayed by rising crime and violence in order to provide a permanent presence in Southside. It
is the flagship of the BPD’s community policing strategy. In addition to liaison activities with the local
community and schools and acting as the base for Zone Liaison Beat Officers, the centre provides a drop
in computer centre and library, a lunchtime feeding programme for 100 ‘at risk’ and needy children from
the local school, and summer lectures / courses in health, parenting, drugs, and crime.
The research also showed negligible activity by credit unions and NGOs for existing small businesses, little
in the way of CBOs, parental apathy to their childrens’ schooling (one school had been unable to arrange
any PTA meetings), an absence of training programmes for teenagers and young adults, a lack of
concerted inter-agency co-ordination to tackle social problems, and overlapping programmes.
The issues in Southside are different more in degree than in character from those described for the
country as a whole. Its urban situation however exacerbates the situation by eliminating the safety nets
provided in rural areas by access to land and longer established and more cohesive communities. An
important and positive conclusion is the opinion of the young that with more care and attention from their
parents, and increased training and job opportunities, far fewer would become in crime and other risky
behaviour.
The area appears ripe for an integrated, inter-agency approach which builds on the lessons learned from
existing programmes. Components could include: social workers operating out the Yabra centre, teachers
and health workers acting to identify children and adults at risk from violence and neglect, the
establishment of day care, drop in and after schools activities and the creation of cohesive training
programmes for youths and young adults (although scholarships / stipends would probably be needed to
secure attendance).
Even if such a programme was successfully introduced along with continued improvements to
infrastructure, the most critical issue of all will remain, namely the lack of jobs. This is an issue which
affects the whole country, but is largely outside the government’s control. However unless the social
issues which currently restrict the employability of Southside residents are reduced, it is difficult to see
how the area could benefit even if the availability of jobs suddenly increased across the country. And there
is every incentive to reduce the high crime rate in the area which is ruining the lives of many residents and,
if unchecked, will do so to the next generation.
5.2 Toledo
Toledo is the southernmost administrative district of Belize; Guatemala lies to the south and the west and
the Caribbean Sea to the east. Its current population is around 31,000, just under 10% of Belize’s
population. The population is ethnically diverse: approximately 2/3rds are Mayan, with the remainder
split between Mestizos, Garifuna, Creole and East Indian. While the latter are concentrated on Punta

Belize Country Poverty Assessment Executive Summary
Belize Country Poverty Assessment , Final Report ES21
Halcrow Group Limited, August 2010.
Gorda and other coastal settlements, the Maya dominate the hinterland. Its rural population is very
dispersed being spread over a wide area in over 50 villages (more than 25% of the total). Toledo’s
population is exceptionally young with 43% being under the age of 15 compared with 34% nationally
while the average household size is much higher, 4.9 persons, is much higher than the national average of
4 persons.
Agriculture remains the predominant economic driver of the district, followed by a small mining sector
and an emerging tourism sector. Agriculture accounts for over 42% of the employed population compared
with 16% nationally. Cultivation is predominantly small scale based on the milpa system, a system of
rotation agriculture which the Mayans have developed over the centuries. The main crops are black beans,
rice and corn most of which are grown for subsistence; cacao production developed in the early 2000s but
declined sharply between 2006 and 2007 due to disease. Livelihoods are supplemented by small scale
trading and off-farm work; there is a small urban rural drift to Punta Gorda and a nascent eco-tourism
industry.
The combination of restricted markets due to its peripheral location (despite the opening of the Southern
Highway in 2002), dispersed population and low agricultural productivity, compounded by an absence of
local market towns to buy and sell goods, have entrained a low level of socio-economic development.
Together these have resulted in a very high level of poverty as well as housing and health conditions
substantially below the national average. Despite a reduction in poverty since 2002, Toledo remains the
poorest district in the country with by far the highest level of indigence (38% of households and 46% of
its population).
Successive governments (pre- and post-independence) have been concerned with the development of
Toledo. Since the late 1970s, several major rural development projects (with a total investment of around
US$30 million) have been implemented. When these were reviewed in 2004, the overall conclusion was
one of failure due to four principal factors: (i) the peripheral location and dispersed population; (ii) the
complex Mayan social and cultural context; (iii) inadequate project design which failed to take into account
these complexities, especially in relation to land; and (iv) a lack of effective participatory processes.
Currently the BRDP appears to have learnt from these failures. Greater attention is being paid to
beneficiary participation, a range of sub-projects are being implemented, and services are being delivered
through a network of NGO service providers, sub-project criteria are being revised as the project
progresses, and targeting appears to be effective. Nevertheless, coverage is small (no more than a few
hundred beneficiaries) and it is also debatable that the small grants or credits sometimes provided (under
Bz$1000) can ever have a significant impact on household incomes. There are also numerous NGO
income generation and social development programmes that are achieving some success; however these
two have limited coverage. The Toledo Development Corporation that was set up to co-ordinate
development in the district has also failed through the lack of a formal mandate, inadequate finance and
corruption. The overall impact of these programmes is therefore small. Comments from the IA interviews
and PPAs identify much the same problems as described above: lack of inter-agency co-ordination, failure
to appreciate the complexities of Mayan society (and the divisions within it), over-estimation of the
absorptive capacity of beneficiaries, funding constraints, lack of markets for products, land issues and
political interference.

Belize Country Poverty Assessment Executive Summary
Belize Country Poverty Assessment , Final Report ES22
Halcrow Group Limited, August 2010.
Where progress has been made, through government rather than the NGOs, is in providing infrastructure,
water supply, electricity, roads, schools and health centres, many of which have been built in the last few
years, the vast majority by SIF. Direct government spending has been concentrated on running the health
and education services which are expanding; primary school enrolment is similar to national levels, while
secondary school enrolment is only slightly lower. A subsidy to all new secondary school students has just
been introduced. Most of these improvements are appreciated, although, as occurs throughout the
country, there are concerns about the quality of the services provided, health costs (the expansion of the
NHI is proving problematic) and the poor maintenance of infrastructure and buildings. The NGO
implemented Tumul K’in education centre is also pioneering a more radical and relevant educational
curriculum.
In a sense, the situation is not that dissimilar from Southside in that the majority of interventions, and
certainly those that have the widest coverage, are not related to the key issues of employment and income,
hence the widespread concern over land issues. There is thus a mismatch between the rhetoric of poverty
reduction policies and the actuality which, allied to political interference and the unrealistic promises of
politicians, have led to a pervading feeling of apathy and mistrust of the overall governance system. Yet as
seen there have been successes: poverty has reduced, infrastructure has improved as have education and
health indicators; current programmes are better designed and better implemented. None of these are
however likely to have a substantial impact on poverty reduction without major scaling up or the
identification of new economic drivers – the very priorities of most village leaders surveyed during the
study.
In short the priority has to be programmes that increase income generation, agricultural productivity and
job creation. This means more and better agricultural support, greater availability of credit, identifying and
developing markets, more emphasis on linking relevant skills training to market opportunities. Unless a
major new economic driver emerges, ways in which the situation can be improved would consist of
avoiding programme duplication, exchanging lessons learned between implementers, recognising that
project design and implementation will be time-consuming and resource-hungry, ensuring that
beneficiaries are willing to participate and have the requisite technical capacity, giving greater emphasis to
assisting operators of existing enterprises, trying to resolve the land issue, and concentrating development
activities in selected locations in order to create a critical mass.
6 Poverty Reduction and the MDGs (Chapter 8)
A concurrent situation report on the status of the MDGs generally reflects the CPA findings, namely that
poor economic performance, particularly the decline in the investment rate, over the last few years is the
root cause for the increase in poverty. The report also finds that: (i) achievement of the MDGs relating to
primary school enrolment is in danger of not being met; (ii) although gender parity has been achieved at
primary level, boys are in danger of falling behind in secondary and tertiary education (particularly at high
school); (iii) there has been progress for the health-related MDGs (4-6) but further investment is required
if they are to be achieved; (iv) under MDG8, the debt situation has yet to be fully resolved and youth
unemployment is high but coverage of telecommunications and internet has increased dramatically. The
report’s overall conclusion is that the outlook for achieving the requisite increases in investment and

Belize Country Poverty Assessment Executive Summary
Belize Country Poverty Assessment , Final Report ES23
Halcrow Group Limited, August 2010.
government capital spending5 ‘is not very bright’ and ‘represents a tough challenge’ which will necessitate the
involvement of Belize’s international partners.
This general conclusion is consistent with the CPA’s findings that economic prospects are generally
unfavourable and that this will both restrict investment, employment opportunities and hence government
spending which will, in turn, curtail the ability of the government to increase social spending to the level
necessary to achieve the MDGs.
The MDGs should not however be seen as the over-arching objective of development policy. Firstly, they
do not capture all the poverty related issues which have been identified in this (and other CPA) reports.
Examples are the pernicious effects of political malfeasance and corruption, educational quality and
relevance, secondary school enrolment (a much greater problem than primary school enrolment), the need
for care and support for the older population, and social issues such as crime, drug use, and family
breakup. While these may not relate directly to income poverty, they most certainly do to non-income
poverty and wellbeing. Secondly, notwithstanding the emphasis to increasing domestic investment in the
MDG report, the MDG’s pay insufficient attention to the need to establish a climate conducive to
economic growth, investment (domestic and foreign) and job creation. The MDG’s should not therefore
be seen as providing a comprehensive framework for tackling poverty in Belize.
7 Key Issues and Lessons Learned (Chapter 9)
7.1 NPESAP, 2007-2011: Has it Failed?
The NPESAP 2007-20116 is GoB’s primary policy document on national development. Prepared
following the completion of the 2002 CPA and an extensive series of public consultations, the NPESAP
was designed to overcome the perceived shortcomings of its predecessor. The NPESAP, which was
produced during another period of “severe economic and social constraints”, is a comprehensive document that
contains strategies, sub-strategies and initiatives. It covers virtually every one of the problems identified in
this report ranging from the need to increase the role of the private sector involvement, improving
governance, poverty-related social issues, enhancing human resources, and addressing the needs of key
vulnerable groups.
Since NPESAP’s adoption, a number of new initiatives have been introduced while other pre-existing
programmes have been continued. Programmes which have continued are essentially those related to the
expansion of local infrastructure, health (including the NHI) and education services. Major new
interventions include the Southside Poverty Alleviation Project, Belize Rural Development Project, the
provision of free text books to schools, the introduction of the Non-Contributory Pension, and a
comprehensive HIV/AIDS reduction strategy. These major programmes have been accompanied by a
wide variety of smaller, often innovative, government and NGO programmes covering micro-credit,
5 The report says little about the need for government recurrent spending which is arguably at least as crucial in
relation to improving the standard of education, health and social service provision.
6 NPESAP = National Poverty Eradication and Action Plan. A new NPESAP, 2009-2013 has just been prepared but
shows few changes from the current version.

Belize Country Poverty Assessment Executive Summary
Belize Country Poverty Assessment , Final Report ES24
Halcrow Group Limited, August 2010.
income generation, community and women’s empowerment, life skills and parenting, youth employment
and rehabilitation, assistance to vulnerable groups and basic social services, and increased police
involvement in community policing and social issues. In most cases, they are considered favourably by
recipients.
Yet given that poverty has increased since 2002, NPESAP (and its predecessor) has failed; but could this
have been avoided?
NPESAP’s strategy was essentially based on high social spending within a stable macro-economic
framework allied to improved governance. Yet the primary causes of poverty in Belize, as in most
countries, relate to economic issues, such as the absence of the necessary investment or resources to
provide jobs with adequate wages for the active population. Governments can exert some influence on
local and foreign investment by providing incentives and a conducive investment environment (e.g. a
stable macro-economy, adequate infrastructure, a good security situation, a skilled workforce) – which is
what NPESAP’s policies in this regard sought to achieve. However all the evidence is that it is the private
sector and not governments that create jobs. Furthermore, worldwide experience is that, in an
unfavourable economic situation such as Belize was experiencing even before the recession, governments
have a very limited ability to increase jobs and bring about significant reductions poverty reduction in this
way7.
It is also important to understand the limitations on poverty reduction arising from infrastructure and
social spending. Infrastructure is a necessary condition for economic growth but it is not a sufficient one.
New roads, power generation and telecommunications can encourage economic growth but if there are
neither the productive resources nor the markets, their short term impact will be marginal. Education
spending cannot by definition have an impact for 10 to 15 years while health spending will only have a
marginal direct impact by reducing individuals’ susceptibility to disease and income loss arising serious
illness or injuries. This is not to say that spending on infrastructure and social sectors is ineffectual in the
short term. Quite the reverse; this spending directly addresses the non-income aspects of poverty by
improving basic needs, reducing the insecurity resulting from fear of ill health; it also answers directly to
parent’s aspirations to provide education for their children while also providing the future labour force
with the skills to make them employable. Similarly, expenditure on social services, community
development, empowerment, public awareness can both improve wellbeing directly and increase the
likelihood of families and individuals avoiding the types of unsustainable and anti-social behaviour which
can lead to the destructive cycle of inter-generational poverty described above.
Whilst one could argue that the NPESAP paid insufficient attention to measures to boost the economy
and over-estimated the short-term poverty reduction impact of social spending (which was maintained
following the debt restructuring), there appears to be a limited amount that GoB could have done to
substantially reduce the negative impacts of adverse economic conditions and natural disasters in the last
few years. Thus the reason that poverty has risen in Belize since 2002 is not that NPESAP failed but that,
7 It is also salutary to note that, outside China and South East Asia, poverty worldwide increased by 16% between
1993 and 2002.
Belize Country Poverty Assessment Executive Summary
Belize Country Poverty Assessment , Final Report ES25
Halcrow Group Limited, August 2010.
given the prevailing economic situation, it could not have succeeded. GoB has to get this message across
to the population if expectations are not to be unrealistically raised.
7.2 But Could the Government have done Better?
Here the answer is a categorical ‘yes’. This report has identified a number of areas, most of which were
identified in the NPESAP and the background documents leading to its preparation, where government
(politicians and public servants) could have taken actions to improve the effectiveness of its poverty
reduction activities. The most important of these are considered to be:
Reduced political interference in the implementation of development programmes and made
stronger efforts to curtail corruption (which would have increased funds available for
interventions).
Made greater attempts to work with the private sector in order to boost the economy.
Insisted on improving inter-departmental co-ordination and mechanisms to evaluate the successes
and weaknesses of existing programmes as well as establishing transparent eligibility criteria for
relevant programmes.
Given increased importance to infrastructure maintenance issues - “the maintenance and sustainability
of the infrastructure, and therefore of the longer term benefits continue to be a major challenge” (CPA 2002).
Established human resource management processes to address staff concerns and improve
standards of service delivery.
Heeded the advice of the previous CPA by focussing on a limited set of achievables versus a
broad array of measures that are neither prioritised nor ranked.
It is not suggested that taking action on these issues would have significantly reduced the increase in
poverty but it would have improved the effectiveness of current programmes, provided greater
encouragement and assistance to the private sector, achieved a reduction in the antipathy currently felt by
much of the population against politicians, increased the availability of funds, and enhanced the quality of
programmes.
7.3 Lessons Learned
The key lessons learned from the CPA’s research are:
The existence of a comprehensive poverty reduction strategy is no guarantee that poverty can, or
will be, reduced. Poverty reduction also results from successful implementation not strategies or
action plans. The effectiveness of the NPESAP can therefore best be improved by addressing
implementation issues rather than by revising its content.
Poverty reduction is primarily dependent on the performance of the economy, which is largely
outside the control of the government. Every effort should therefore be made to encourage the
private sector.
Social and infrastructure spending (whether by government or NGOs) will lead to improved living
conditions and enhance general wellbeing but will have a vey limited impact on reducing income
Belize Country Poverty Assessment Executive Summary
Belize Country Poverty Assessment , Final Report ES26
Halcrow Group Limited, August 2010.
poverty in the short term (unless coverage of direct assistance social welfare programmes can be
drastically increased). Social and infrastructure spending will also facilitate future economic growth
and reduce the potential for poverty to occur in the future.
In the absence of major social protection programmes such as exist in developed countries, there
are limits to the extent that income poverty can be reduced by directly targeting the poor through
income generating programmes (e.g. micro-credit).
Belize has a wide range of ongoing, innovative, programmes which address virtually all the major
priorities, managed by dedicated personnel. Their effectiveness is however constrained by low
coverage, a lack of resources to scale up, an absence of inter-agency co-ordination which prevents
the successes and failures of particular programmes being used to refine other existing
programme.
8 The Programme of Action (POA) (Chapter 10)
8.1 The PoA in the Context of the NPESAP
The NPESAP has just been revised. There is thus little sense in the CPA preparing its own Poverty
Reduction Strategy, especially as the key determinant of poverty reduction is the implementation of
policies rather than the policies themselves. The crucial question is therefore how the CPA’s Programme
of Action (POA) can complement and reinforce the current NPESAP. This question was discussed at
various junctures during the course of the study, as a result of which the following general principles have
been adopted:
The POA should not attempt to replicate the comprehensive coverage of the NPESAP.
The POA should concentrate on those issues which have formed the basis of the CPA’s research.
The POA should concentrate on specific interventions (projects and programmes) rather than
more general and all-embracing strategic policies (many of which also exist in ministerial and
departmental strategy documents).
The POA should also identify any policy areas which have either not been addressed in the
NPESAP.
Within this context, the CPAs recommendations address the generic objectives of any poverty reduction
strategy: (i) establishing a business- and investment-friendly environment to encourage private sector
investment and hence job creation; (ii) improve the provision of social and physical infrastructure needed
to satisfy the basic needs of the population; (iii) improve conditions for those currently in poverty and for
whom employment is not a realistic option, e.g. single parents, older persons and the disabled; and (iv)
address issues that threaten to increase poverty in the future, e.g. the social issues related to risky and
antisocial behaviour.
Furthermore, the POA should identify actions which are deemed to merit the highest priority because: (i)
they are most urgently needed; and/or (ii) they can be achieved at relatively low cost; and/or (iii) they are
implementable within a relatively short time frame. Identifying priorities will also facilitate discussions
with donor agencies as to future loans and grants.

Belize Country Poverty Assessment Executive Summary
Belize Country Poverty Assessment , Final Report ES27
Halcrow Group Limited, August 2010.
Priority Sectors
The CPA’s research concentrated on the following sectors and priority areas, and these are the ones for
which specific recommendations have been made: (i) governance and institutions; (ii) productive sectors -
agriculture, tourism and finance/ credit; (iii) health; (iv) education; (v) social services; (vi) housing, land and
infrastructure; (vii) Belize South Side; and (ix) Toledo. These sectors were also those most frequently cited
as priority concerns in the PPAs and the interviews carried out as part of the Institutional Analysis. All are
considered to offer good potential for reducing poverty and enhancing national social and economic
development in the short and medium terms.
The emphasis on the above sectors should not be construed as invalidating or indicating lack of support
for other NPESAP policies and proposals which are not explicitly referred to in this document. Nor
should it detract from the crucial importance of maintaining and enhancing the basic health and education
services now provided by the government.
8.2. The Priorities
All recommendations made by the Study Team are considered to be important. It is nevertheless apparent
that neither financing nor institutional capacities will be available to enable all to be implemented ‘in one
go’. It is therefore necessary to identify some priority recommendations. These priorities, which are based
on the Study Team’s deliberations as well as comments received during the National Consultations, are
those that are considered to be both the most urgently needed and those that are likely to bring substantial
short- and medium-term benefits. Given likely constraints on government finances in coming years, a key
consideration in the selection of priorities was that they would not have large financial implications.
Table ES10 contains the generic institutional priorities; few of these are likely to have significant financial
implications and they could thus be introduced irrespective of the budgetary situation. They are deemed to
merit the highest priority as without them, it is difficult to see how the issues which have dogged the
implementation of previous GoB poverty reduction activities will not persist. And if these are not
eliminated, interventions, however well-designed, will fail.
Table ES11 presents the sector and issue-specific priorities. These recommendations are more likely to
have financial implications and the table provides an indicative order of magnitude for these; few however
are considered to have ‘high’ financial implications. While the recommendations are presented sectorally,
many will require inter-agency co-ordination as some critical issues, e.g. families, gender and youth, are
cross-cutting.

Belize Country Poverty Assessment Executive Summary
Belize Country Poverty Assessment , Final Report ES28
Halcrow Group Limited, August 2010.
Table ES10. The Institutional Priorities
No. The Institutional Priorities
1 Publicise the message that the government has only a limited ability to directly affect the
economic situation, create jobs and finance infrastructure and social sector programmes.
2 Issue a clear statement with bi-partisan support and from the the highest level of
government, with bi-partisan support, that party political considerations must not form part
of deliberations concerning the allocation of development and poverty reduction
resources.
3 Develop targeting and eligibility criteria for all discretionary programmes, and publicise
them. Emphasise that political considerations are not part of the decision making process.
4 Issue a clear directive that departments should work together in the design and
implementation of programmes dealing with cross-cutting issues.
5 Institute regular forums between organisations (government and NGOs) working in the
same field so as to identify strengths and weaknesses of current initiatives, identify good
practice, discuss potential solutions and prepare joint funding proposals.
6 Improve the management of staff (especially those directly providing services and working
in rural areas) to address their concerns, monitor their work, ensure staff discipline and
provide technical feedback to policy makers. Without this action, programmes and
services will not be as effective as they could be.
7 Address operational inefficiencies through greater budget flexibility, improved supply chain
management, streamlined appointment procedures and increased budgets for O and M*.
8 Donors and lenders should consider giving greater priority to programme, as opposed to
project, aid, in order to ensure that their investment is more sustainable and reflects the
increased need to ‘soft’ as opposed to ‘hard’ programmes.
Table ES11. Sectoral and Issue-Specific Priorities
Sector
Project Main Target Group(s)
Summary Components Financial Implications
Eco
no
mic
Secto
rs
Government revenues and taxation
The poor, farmers and SMEs
Review taxation system to assess feasibility of reducing costs of basic foodstuffs and agricultural inputs, e.g. by enhancing other sources of government revenues such as land and property taxes.
Low
Land for cultivation
Farmers Land suitability study to identify potentially cultivable areas as basis for national land use policy.
Low
Agricultural Support
Farmers Farmers Field Schools
Key Farmer Program
Review of Extension services
Establish guidelines for water storage and drainage practices.
Needs assessment for post-harvest crop storage facilities.
Medium/ High
Access to credit
Existing and potential SMEs
Develop varied and innovative approaches to credit for households, existing businesses and start-ups in urban and rural areas.
Low/ medium

Belize Country Poverty Assessment Executive Summary
Belize Country Poverty Assessment , Final Report ES29
Halcrow Group Limited, August 2010.
Sector
Project Main Target Group(s)
Summary Components Financial Implications
Agri-tourism linkage
Farmers/ hotel operators
Develop links with hotel operators to increase purchase of local produce. Low
Corozal Free Zone (CFZ) Institute negotiations with land owners to provide land for expansion of Corozal Free Zone. Low
Healt
h
Health in rural areas
Rural population
Extend and expand mobile and outreach clinics. Medium
Nutrition Women and children
Options for supplementing nutritional value of traditional diets and meal preparation based on MFB.
School feeding programs.
Low
Safe sex and family planning
Women and youth
Review and strengthen planned parenthood and family planning programmes services with increased targeting to men.
Low
Road safety Drivers and pedestrians
Education programmes for drivers and school children.
Identification of blackspots and accident causes.
Awareness campaigns related to seat belts, speed and drowsiness.
Sleeping policemen in residential streets.
Road signage and layout (white-lining).
Low
Ed
ucati
on
/ S
ocia
l
Education services
Children Strengthened basic reading/ writing/ speaking skills programmes in early primary school.
Life skills classes
Pilot parental support units.
Targeted vocational classes
Evaluate adapation of school times to enable children to assist their parents at home and in the field.
Medium
Apprenticeship programme
Non-school attenders (15+) and young adults
Provision of cash stipends.
Vocational, basic academic and life skills training.
Work experience with firms/ self employed and mentors (e.g. building trades, child care, community enhancement).
Medium
Rural secondary schooling
Secondary school non- attenders
Introduce junior secondary classes in rural primary schools and combine small primary schools. Medium
So
cia
l S
erv
ices Yabra
Community Centre – Belize Southside
Families and children at risk in Belize Southside
Develop Yabra centre into one stop centre for policing, social services, non-school based education (formal and life skills), day care (elderly and pre-school) and victim support.
Develop procedures for identifying children and women at risk from abuse and neglect by doctors, nurses, teachers and social workers.
Medium/ high
Old
er
pers
on
s Health care Elderly Improve health care for the elderly/ disabled by (i)
training nurses and doctors in geriatrics, and (ii) extending home visits.
Medium
NCP Poor elderly Review financing and eligibility criteria for NCP. Medium
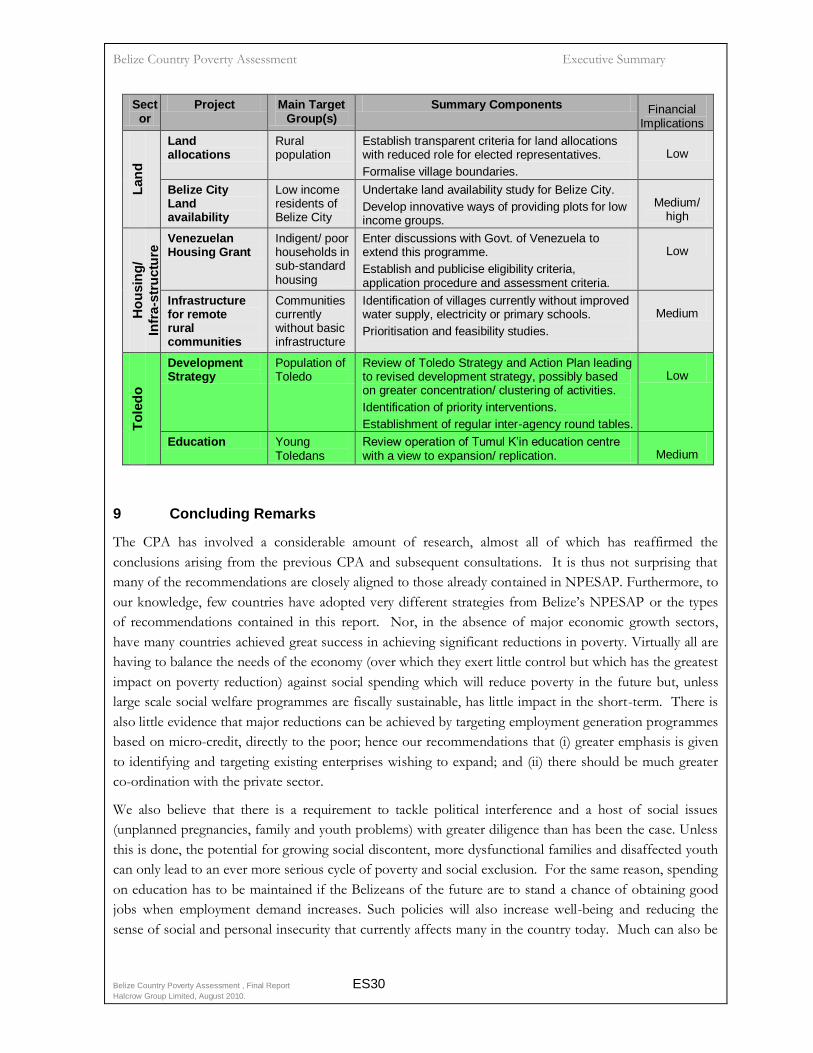
Belize Country Poverty Assessment Executive Summary
Belize Country Poverty Assessment , Final Report ES30
Halcrow Group Limited, August 2010.
Sector
Project Main Target Group(s)
Summary Components Financial Implications
Lan
d
Land allocations
Rural population
Establish transparent criteria for land allocations with reduced role for elected representatives.
Formalise village boundaries.
Low
Belize City Land availability
Low income residents of Belize City
Undertake land availability study for Belize City.
Develop innovative ways of providing plots for low income groups.
Medium/ high
Ho
usin
g/
Infr
a-s
tru
ctu
re Venezuelan
Housing Grant Indigent/ poor households in sub-standard housing
Enter discussions with Govt. of Venezuela to extend this programme.
Establish and publicise eligibility criteria, application procedure and assessment criteria.
Low
Infrastructure for remote rural communities
Communities currently without basic infrastructure
Identification of villages currently without improved water supply, electricity or primary schools.
Prioritisation and feasibility studies.
Medium
To
led
o
Development Strategy
Population of Toledo
Review of Toledo Strategy and Action Plan leading to revised development strategy, possibly based on greater concentration/ clustering of activities.
Identification of priority interventions.
Establishment of regular inter-agency round tables.
Low
Education Young Toledans
Review operation of Tumul K’in education centre with a view to expansion/ replication. Medium
9 Concluding Remarks
The CPA has involved a considerable amount of research, almost all of which has reaffirmed the
conclusions arising from the previous CPA and subsequent consultations. It is thus not surprising that
many of the recommendations are closely aligned to those already contained in NPESAP. Furthermore, to
our knowledge, few countries have adopted very different strategies from Belize’s NPESAP or the types
of recommendations contained in this report. Nor, in the absence of major economic growth sectors,
have many countries achieved great success in achieving significant reductions in poverty. Virtually all are
having to balance the needs of the economy (over which they exert little control but which has the greatest
impact on poverty reduction) against social spending which will reduce poverty in the future but, unless
large scale social welfare programmes are fiscally sustainable, has little impact in the short-term. There is
also little evidence that major reductions can be achieved by targeting employment generation programmes
based on micro-credit, directly to the poor; hence our recommendations that (i) greater emphasis is given
to identifying and targeting existing enterprises wishing to expand; and (ii) there should be much greater
co-ordination with the private sector.
We also believe that there is a requirement to tackle political interference and a host of social issues
(unplanned pregnancies, family and youth problems) with greater diligence than has been the case. Unless
this is done, the potential for growing social discontent, more dysfunctional families and disaffected youth
can only lead to an ever more serious cycle of poverty and social exclusion. For the same reason, spending
on education has to be maintained if the Belizeans of the future are to stand a chance of obtaining good
jobs when employment demand increases. Such policies will also increase well-being and reducing the
sense of social and personal insecurity that currently affects many in the country today. Much can also be
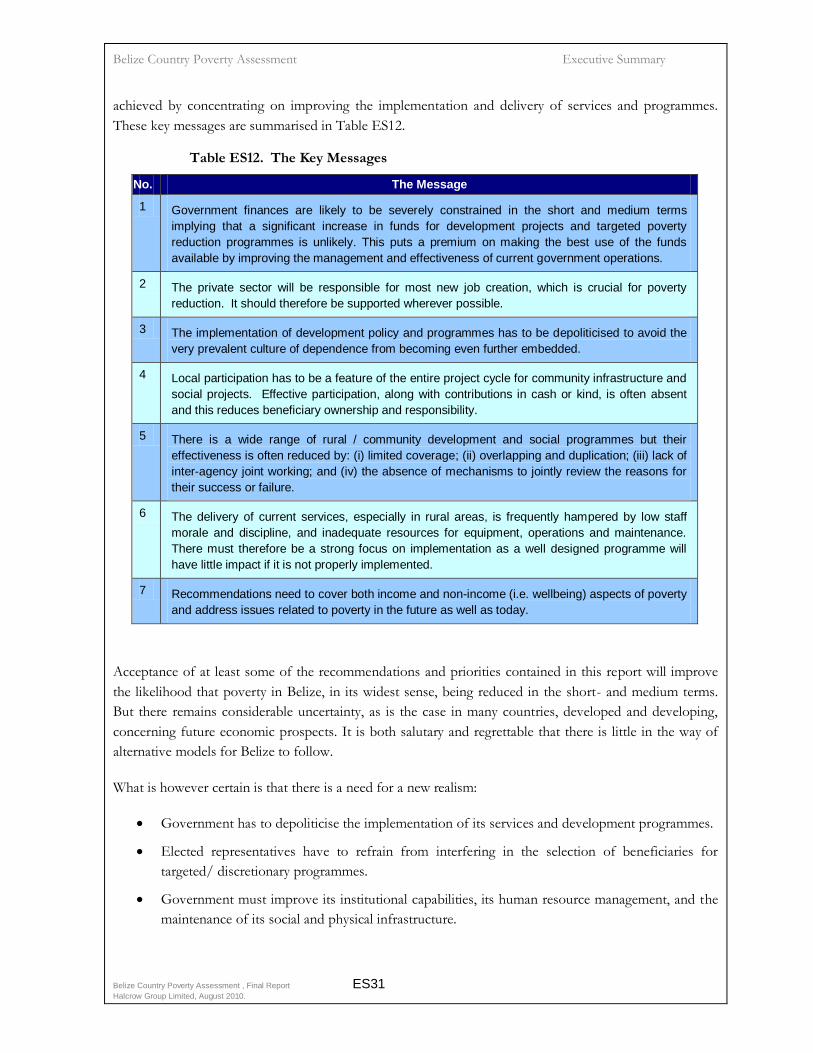
Belize Country Poverty Assessment Executive Summary
Belize Country Poverty Assessment , Final Report ES31
Halcrow Group Limited, August 2010.
achieved by concentrating on improving the implementation and delivery of services and programmes.
These key messages are summarised in Table ES12.
Table ES12. The Key Messages
No. The Message
1 Government finances are likely to be severely constrained in the short and medium terms
implying that a significant increase in funds for development projects and targeted poverty
reduction programmes is unlikely. This puts a premium on making the best use of the funds
available by improving the management and effectiveness of current government operations.
2 The private sector will be responsible for most new job creation, which is crucial for poverty
reduction. It should therefore be supported wherever possible.
3 The implementation of development policy and programmes has to be depoliticised to avoid the
very prevalent culture of dependence from becoming even further embedded.
4 Local participation has to be a feature of the entire project cycle for community infrastructure and
social projects. Effective participation, along with contributions in cash or kind, is often absent
and this reduces beneficiary ownership and responsibility.
5 There is a wide range of rural / community development and social programmes but their
effectiveness is often reduced by: (i) limited coverage; (ii) overlapping and duplication; (iii) lack of
inter-agency joint working; and (iv) the absence of mechanisms to jointly review the reasons for
their success or failure.
6 The delivery of current services, especially in rural areas, is frequently hampered by low staff
morale and discipline, and inadequate resources for equipment, operations and maintenance.
There must therefore be a strong focus on implementation as a well designed programme will
have little impact if it is not properly implemented.
7 Recommendations need to cover both income and non-income (i.e. wellbeing) aspects of poverty
and address issues related to poverty in the future as well as today.
Acceptance of at least some of the recommendations and priorities contained in this report will improve
the likelihood that poverty in Belize, in its widest sense, being reduced in the short- and medium terms.
But there remains considerable uncertainty, as is the case in many countries, developed and developing,
concerning future economic prospects. It is both salutary and regrettable that there is little in the way of
alternative models for Belize to follow.
What is however certain is that there is a need for a new realism:
Government has to depoliticise the implementation of its services and development programmes.
Elected representatives have to refrain from interfering in the selection of beneficiaries for
targeted/ discretionary programmes.
Government must improve its institutional capabilities, its human resource management, and the
maintenance of its social and physical infrastructure.
Belize Country Poverty Assessment Executive Summary
Belize Country Poverty Assessment , Final Report ES32
Halcrow Group Limited, August 2010.
Government departments should give greater emphasis to improving existing programmes rather
than developing new ones.
Government employees, as many do, must welcome and respect the fact that they are public
servants.
The public has to realise that government, irrespective of its political persuasion, cannot provide
all their needs. They must reject the tendency towards dependency and welfarism that is becoming
increasingly prevalent. Instead they should look more towards themselves, their neighbours and
their communities to identify ways in which they can contribute to the successful implementation
of government and NGO programmes. Politicians should contribute to this by refraining from
making promises that are over-ambitious and thus raise the population’s expectations to an
unrealistic level.
If these conclusions are accepted, the likelihood of Belize emerging from this troubled period and
emerging a stronger, richer and more inclusive society will be greatly enhanced.