belgian prime news - nbb.be · belgian prime news no. 74 january 2017 3 j special topic: belgian...
TRANSCRIPT

Bel
gian
Pri
me
New
s
No.
74
Jan
uary
201
7
1www.nbb.be
QUARTERLY PUBLICATION No. 74 January 2017
Belgian Prime News
Last update : 4 January 2017 Next issue: March 2017
Participating Primary and Recognised Dealers: Barclays, Belfius Bank, BNP Paribas Fortis, Citigroup, Commerzbank, ING, KBC Bank, Morgan Stanley, Nomura Internationa Plc., Société Générale Corporate & Investment Banking
• In 2016, economic growth in Belgium remained robust although muted, in a context of large uncertainty.
• On average, the participating institutions expect real GDP growth in Belgium to level out at 1.3 % in 2017 asin2016.HICPannualinflationisestimatedat1.8%in2016,partlyagainstthebackdropofincreasesin indirect taxation and regulated prices, and is projected at 1.9 % in 2017 (see Macroeconomic Developments).
J Consensus: Average of participants’ forecasts
2015 2016
For 2016
Real GDP growth HICP inflation
I II III IV I II III IV0
1
2
3
For 2017
Source: Belgian Prime News.
I II III IV I II III IV0
1
2
3
2015 2016
SUCCESSIVE FORECASTS FOR BELGIUM
• Belgianlabourmarketandwageformationreformstobeimplementedatthebeginningof2017tomake thelabourmarketmoreflexibleandtomakethewage-bargainingframeworkmoreresilient(seeSpecial Topic).
• The Belgian Debt Agency completed its 2016 programme smoothly. It has now published its Funding Plan for 2017. The funding strategy remains in line with previous years, while the gross borrowing requirement is slightly lower (see Treasury Highlights).
2015 2016 p 2017 p
Belgium Euro area Belgium Euro area Belgium Euro area
Real GDP(1) 1.5 2.0 1.3 (1.4) 1.6 (1.6) 1.3 (1.3) 1.4 (1.3)
Inflation(HICP)(1) 0.6 0.0 1.8 (1.8) 0.2 (0.3) 1.9 (1.9) 1.3 (1.3)
General government balance(2) -2.5 -2.1 -2.9 (-2.6) -1.8 (-1.9) -2.2 (-2.2) -1.7 (-1.8)
Public debt(2) 105.8 92.6 106.6 (106.2) 90.6 (90.7) 106.1 (105.7) 89.9 (90.1)
NumbersinparenthesesrefertothepreviousconsensusforecastofSeptember2016.(1) Percentage changes.(2) EDPdefinition;percentagesofGDP.
Belgian Prim
e New
s
N
o. 74
January 2017
2www.nbb.be
JMacroeconomic Developments
-2
-1
0
1
2
3
4
-40
-30
-20
-10
0
10
2012 2013 2014 2015
Smoothed data
Grossdata
p.c. points
Business confidence indicator (right-hand scale)
Year-on-year real GDP(percentage changes, left-hand scale):
Euro area Belgium
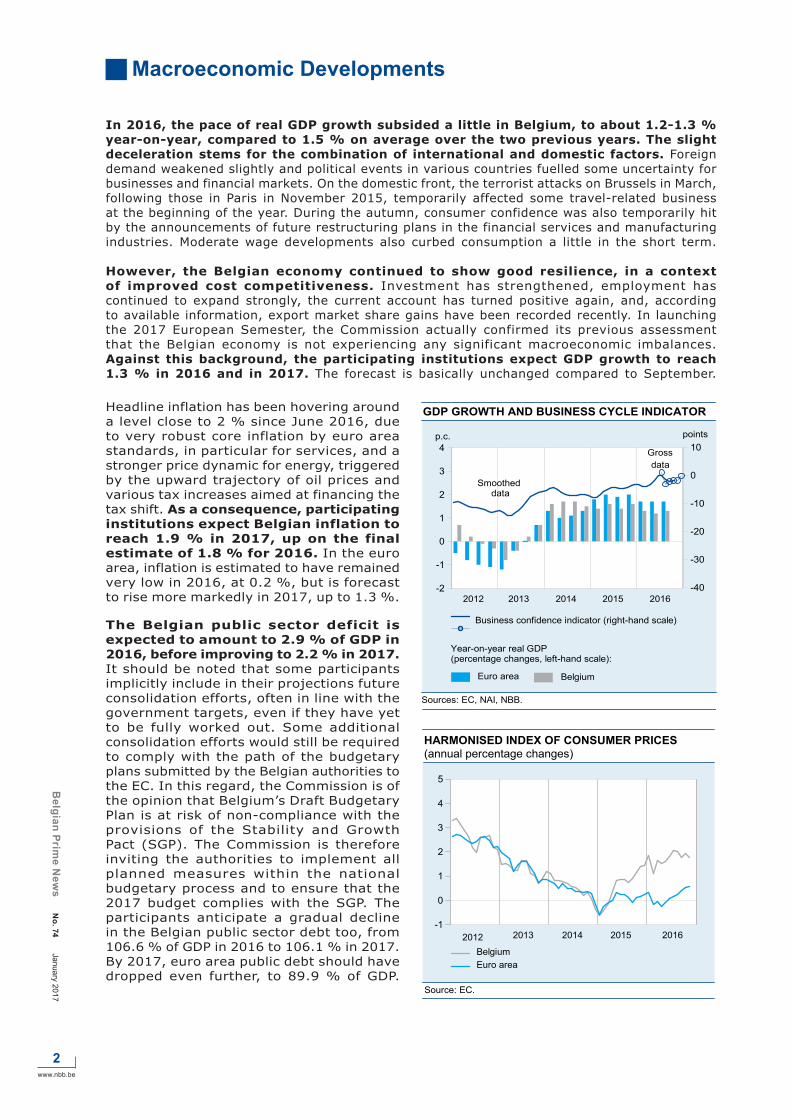
GDP GROWTH AND BUSINESS CYCLE INDICATOR
Sources: EC, NAI, NBB.
2016
2012 2013 2014 2015
Euro areaBelgium
HARMONISED INDEX OF CONSUMER PRICES(annual percentage changes)
Source: EC.
-1
0
1
2
3
4
5
2016
In 2016, the pace of real GDP growth subsided a little in Belgium, to about 1.2-1.3 % year-on-year, compared to 1.5 % on average over the two previous years. The slight deceleration stems for the combination of international and domestic factors. Foreign demandweakenedslightlyandpoliticaleventsinvariouscountriesfuelledsomeuncertaintyforbusinessesandfinancialmarkets.Onthedomesticfront,theterroristattacksonBrusselsinMarch,following those inParis inNovember2015, temporarilyaffectedsome travel-relatedbusinessat the beginning of the year. During the autumn, consumer confidence was also temporarily hit by the announcements of future restructuring plans in the financial services and manufacturing industries. Moderate wage developments also curbed consumption a little in the short term.
However, the Belgian economy continued to show good resilience, in a context of improved cost competitiveness. Investment has strengthened, employment has continued to expand strongly, the current account has turned positive again, and, according toavailableinformation,exportmarketsharegainshavebeenrecordedrecently.Inlaunchingthe2017EuropeanSemester, theCommission actually confirmed its previous assessmentthat the Belgian economy is not experiencing any significant macroeconomic imbalances. Against this background, the participating institutions expect GDP growth to reach 1.3 % in 2016 and in 2017. The forecast isbasicallyunchangedcompared toSeptember.
Headline inflation has been hovering around a level close to 2 % since June 2016, due to very robust core inflation by euro area standards, in particular for services, and a stronger price dynamic for energy, triggered by the upward trajectory of oil prices and various tax increases aimed at financing the tax shift. As a consequence, participating institutions expect Belgian inflation to reach 1.9 % in 2017, up on the final estimate of 1.8 % for 2016. In the euro area, inflation is estimated to have remained very low in 2016, at 0.2 %, but is forecast torisemoremarkedlyin2017,upto1.3%.
The Belgian public sector deficit is expected to amount to 2.9 % of GDP in 2016, before improving to 2.2 % in 2017. It should be noted that some participants implicitly include in their projections future consolidation efforts, often in line with the government targets, even if they have yet tobe fullyworkedout.Someadditionalconsolidation efforts would still be required to comply with the path of the budgetary plans submitted by the Belgian authorities to the EC. In this regard, the Commission is of the opinion that Belgium’s Draft Budgetary Planisatriskofnon-compliancewiththeprovisions of the Stability andGrowthPact (SGP).TheCommission is thereforeinviting the authorities to implement all planned measures within the national budgetary process and to ensure that the 2017budget complieswith theSGP.Theparticipants anticipate a gradual decline in the Belgian public sector debt too, from 106.6 % of GDP in 2016 to 106.1 % in 2017. By 2017, euro area public debt should have droppedeven further, to89.9%ofGDP.
Bel
gian
Pri
me
New
s
No.
74
Jan
uary
201
7
3www.nbb.be
J Special Topic: Belgian labour market and wage formation reforms to be implemented at the beginning of 2017
In addition to the pension reform and structural reforms decreed over the last two years to step up actiontogetolderworkersandunemployedpeoplebackintoemployment,anewpackageoflabourmarketmeasureswillbeimplementedatthebeginningof2017.Ithasatwo-prongedobjective:ontheonehand,tomakethelabourmarketmoreflexibleandontheotherhand,tomakethewage-bargainingframeworkmoreresilienttounexpectedshocks.
BothdraftLawsareatthefinalstageinthelegislativeprocess.Theyhavebeensubmittedtotherelevant advisory councils, and will now be discussed and approved by the Parliament in early 2017.
“Feasible and manageable work” TheaimoftheLawon“travailfaisableetmaniable”–“werkbaarenwendbaarwerk”istoinjectmoreflexibilityintothelabourmarket.Itproposesavarietyofmeasuresapplicabletoallenterprises, and an optional list of proposals for sectors, which may opt in or out on a voluntary basis, according to their needs. The social partners will have the choice of applying it (or not) at sectoralandfirmlevels.
Thedraftlegislationcontainsapackageofmeasures, - Workingtimearrangements:possibilitytoannualisethecalculationofthedurationofwork viasocialdialogueatsectoralorindividualfirmlevel;sectorsfacinginternationalcompetition canmakearrangementstocalculatetheworkingweekof38hoursonaverageoverseveralyears (6maximum);possibility,fortheworker,towork100hoursovertimeonavoluntarybasis(only iftheemployerallowsthis);
- Workregimes:introductionoftemporaryworkforanundeterminedduration;possibilityforsmall firmstojointlyhireanemployee;
- Training:anewtargetofatleast5daysonaverageperfull-timeequivalent;
- Workingconditionsforemployees:alegalframeworkforoccasionaltelework;theintroductionofa “careeraccount”,making itpossible tosavedaysoff; theextensionofmotivatedcareer breaks/timecreditforcareof immediatefamilyandleaveforpalliativecare;thepossibilityfor workerstofixtheirownworkinghoursunderaflexibleworkingtimescheme(withsomelimitations); thepossibilityofdonatingdaysoff(holidayentitlement)forcolleagueshavingsickchildren.
Revision of the Law of 1996 setting the framework for wage negotiation Abillisinthefinalstageofpreparationtorevisethecurrent1996LawonthePromotionofEmploymentandthePreventiveSafeguardingofCompetitiveness,whichunderpinswagebargainingin Belgium.
Despiteanegotiationframeworkdesignedtokeepinlinewithwagegrowthinthethreemainneighbouringcountries,wagegrowthinBelgiumhaddivergedsignificantlyfromtheaverageevolutioninGermany,theNetherlandsandFranceoverarelativelylongperiodoftime.So,thegovernmenthadtostepin,bytakinganumberofwage-moderationmeasurestopreservecostcompetitivenessinBelgium.Toavoid any such derailment in the future, a number of automatic correction mechanisms are introduced by the draft Law.
The principle of a maximum nominal wage norm, based upon expected trends among the three main trade partners will be retained, as well as automatic wage indexation. However, the new Law wouldsignificantlyadaptthecalculationofthewagenorm,includingbymakingautomaticcorrectionmechanisms more effective if Belgium’s wage trend moves out of step with the three main neighbouring countries and by introducing a safety margin to cope with projection bias in the main variables. Also, theso-called“historicalgap”,i.e.thewagegapaccumulatedbefore1996,willbetakenintoaccountwhen implementing additional cuts in social contributions.

Belgian Prim
e New
s
N
o. 74
January 2017
4www.nbb.be
Lower gross borrowing requirements in 2017
TheBelgianDebtAgencyexpectsits2017grossborrowingrequirementstocometo€38.98billion.This is a drop of € 4.55 billion compared to the € 43.53 billion borrowing requirements expected for 2016.Inestablishingthisestimate,theDebtAgencyassumedthatthe2017netfinancingrequirementswouldamountto€6.52billion,against€12.62billionin2016.Thisreflectsanexpected1.17%-of-GDPreductioninthefederalgovernmentdeficitin2017(1.28%forthewholegovernmentsector).
Redemptionsofmedium-andlong-termdebtareprojectedtoreach€28.58billion.
TheBelgianDebtAgencyalsoplanstobuybackbondsmaturingin2018andlaterforanamountof€ 3.63 billion.
J Treasury HighlightsDuring the fourth quarter of 2016, the Treasury held two auctions resulting in the issuance of €4.746billionworthofOLOs.Thefollowingtablehighlightstheresultsoftheseauctions:
2017 BORROWING REQUIREMENTS AND FUNDING PLAN(billions of euro)
2016 2017
I. Gross financing requirements 43.53 38.981. Net financing requirements 12.62 6.522. Debt maturing during the year 25.88 28.583. Planned pre-funding (bonds maturing in subsequent years) 5.04 3.634. Other financing requirements(1) 0.00 0.25
II. Funding resources (Medium and long-term) 42.33 39.251. Long and medium-term funding 40.60 39.25 OLOs 37.63 35.00 Euro Medium Term Notes/Schuldscheine 2.93 4.00 Securities for retail investors 0.04 0.25 Other(2) 0.00 0.002. Treasury bonds - Silver Fund 1.73 0.00III. Net change in short term foreign currency debt -0.02 0.00
IV. Change in Treasury Certificates stock(3) 1.15 0.00
V. Net change in other short-term debt and financial assets(4) 0.08 -0.27 Source: Belgian Debt Agency.(1) Including buy backs of long term debt issued in foreign currencies, “put” options exercised on state notes and net redemptions of the Treasury bonds representing Belgian participation in international organisations.(2) Including net issues of Treasury bonds representing Belgian participation in international organisations.(3) Outstanding stock of Treasury Certificates on 01/01/2017: € 26.4 billion.(4) This section includes residual financing instruments complementing the reference instruments mentioned in the previous section, including collateral margin changes. A positive figure represents an increase in the stock of residual financing and/or a reduction in financial assets.
Auction date OLO Nr Issued (€ billion)
Non-competetive tour
(€ billion)
Total Yield Bid-to- cover
24/10/2015 OLO1.00%22/06/2026 OLO 77 0.490 0.000 0.490 0.192% 3.42
OLO1.00%22/06/2031 OLO 75 0.676 0.000 0.676 0.567% 2.21
OLO3.75%22/06/2045 OLO 71 0.642 0.000 0.642 1.003% 1.78
Total 1.808 0.000 1.808
21/11/2016 OLO1.00%22/06/2026 OLO 77 1.155 0.249 1.404 0.669% 1.84
OLO1.00%22/06/2031 OLO 75 0.905 0.245 1.150 1.065% 1.52
OLO1.60%22/06/2047 OLO78 0.240 0.144 0.384 1.596% 3.25
Total 2.300 0.638 2.938
No further EMTNs or Schuldscheinewereissued.Takingintoaccountthe€19.0millionofStateNotesissuedinDecember,thetotallong-termfundingfor2016amountedto€40.60billion,equivalentto101.36 % of the revised target of € 40.05 billion.
Theoverall2016fundingcostfornewlong-termissuancesreachedahistoriclowof0.818%,andtheTreasury also set a new record in terms of average maturity (17.51 years).
On 6 December, the Treasury published its 2017 borrowing requirements and Funding Plan

Belgian Prim
e New
s
N
o. 74
January 2017
5www.nbb.be
OLOs remain the main funding instrument: three new fixed-rate benchmarks set to be issued, backed up by the EMTN programme and other alternative instruments
The Belgian Debt Agency plans to issue € 35 billion worth of OLOs, which is € 2.63 billion lower than the€37.63billionissuedin2016.ItexpectstolaunchthreenewOLOfixed-ratebenchmarks.AnewOLOFloating-RateNotecouldalsobeissued.
The Debt Agency also expects to issue € 4.00 billion via its EMTN programme or other alternative funding instruments such as Schuldscheine.
Againstthebackdropofthelowinterestrateenvironment,StateNoteissuancefortheprivateinvestorsis again expected to result in limited € 0.25 billion of funding.
Asforshort-termfunding,netshort-termdebtisplannedtodeclineby€0.27billionin2017.ThevolumeofTreasuryCertificates,whichisexpectedtostandat€26.46billionattheendof2016,shouldremain stable over the year 2017.
Inthecourseof2016,the20%maximumlimitsetforboththe12-monthrefinancingandthe12-monthrefixingriskhasnotbeenbreached.The12-monthrefinancingriskamountedto17.67%inDecember2016.The12-monthrefixingriskisexpectedtocometo18.73%byyear-end.
Turningtomedium-termrisks,boththe60-monthrefinancingriskandthe60-monthrefixingriskremainedwellbelowtheirmaximumlevelof50%.Theywereexpectedtoworkoutat42.62%and43.03 % in December 2016.
In2017,themedium-termrefinancingandrefixingrisklimitswillbelowered: •The60-monthrefinancingriskwillcomedownby2.50%to47.50%; •The60-monthrefixingriskwillcomedownby2.50%to47.50%; •The12-monthrefinancingandrefixingriskwillremainunchangedat20.00%.
Theaveragelifeofthedebtportfolioreached8.65yearsasof31December2016andthedurationworkedout at 7.96 years. The implicit cost of the portfolio had nevertheless dropped further to 2.60 % by that date.
In2017,theaveragelifeofthedebtportfolioisrequiredtobehigherthan8.50years,i.e.0.50yearhigher than the minimum prevailing during the second half of 2016.
Funding strategy: predictability and flexibility
The main feature of the 2017 issuance strategy continues to be the combination of predictability and flexibilityinordertorespondadequatelytochangingmarketenvironments.Thissubtlecombinationcan be obtained by enhanced communication.
The Treasury will remain predictable with regard to the number of OLO syndications and auctions for itsmainfinancinginstruments,bothOLOsandTCs.Predictabilitywillalsoprevailastothesizeofthefinancingprogrammeandthesizeofissuanceinvariousinstruments.
Flexibilitywillenablethesize,instrumentsandmaturitiestobeadaptedtoprevailingmarketdemandat the moment of issuance.
In this context, the forecast issuance strategy for 2017 will be as follows.
Withregardtolongterm-financing: • Itisexpectedthatnewbenchmarkswillbelaunchedthroughsyndicatedissuesandexpanded through auctions. • TheTreasuryexpectstolaunchthreenewfixed-rateOLObenchmarks. • Ifthereissufficientdemand,off-the-runscanbereopenedinregularauctions. • ThenumberofOLOauctionsremainsat10.TherewillbenoauctioninAugustorinDecember, and an auction might be cancelled and replaced by a syndicated issue. • TheTreasurymayusethepossibilityofSyndicatedTapsonlonger-termOLObenchmarks. • TheOLOissuancewillbesupplementedbyalternativefinancinginstruments.Theycaninclude: anOLOfloater,hedgedforeigncurrencyissuanceand/orstructuredproductsissuedunder theEMTNprogramme,possiblyincludinginflation-linkednotes,orotherfundinginstruments,in particular Schuldscheine.
Withregardtoshort-termfinancing: • ATreasuryCertificateissuanceprogrammeconsistingoftwoauctionspermonthatwhichtwo fixedlineswillbeoffered.Exceptionally,theTreasurywillofferasupplementaryline. • TheregularTreasuryCertificateprogrammewillbesupplementedbyissuanceundertheupdated ECPprogrammeofferingwiderpossibilitiestoissueinforeigncurrency.Thisenableson-tap issuance in various currencies but swapped into euro.
The details of the 2017 Funding Plan and the issuance calendar are available on the Belgian Debt Agency’s website www.debtagency.fgov.be

Belgian Prim
e New
s
N
o. 74
January 2017
6www.nbb.be
2015
Treasury bills OLOs
PRIMARY MARKET(billions of euros)
Net issues
2014 2015
Gross issues
D J F M A M J J A S O N D J F M A M J J A S O N-14-12-10-8-6-4-202468
1012
D J F M A M J J A S O N D J F M A M J J A S O N-14-12-10-8-6-4-202468
1012
20142016 2016
J Government Securities Market
Inthelastquarterof2016,long-termsovereignbondyieldsrosebothintheUnitedStatesandintheeuroarea.TheincreasewasmorepronouncedintheUS,whereten-yearsovereignyieldsrosebyasmuchas86bp.to 2.49% inDecember.Thishike followedtheUSpresidentialelectionsandmainlyoccurredonthebackofgrowingmarketexpectationsofhigherinflationassociatedwithpossiblefiscalstimulusandprotectionism. It was furthermore supported by (anticipations of) a higher target range for the federal fundsrateannouncedbytheFOMCon14December.HigherbondyieldsintheUStriggeredsomeincreases in other countries. Across euro area countries, ten-year sovereign bond yields rose bybetween 35 bp and 62 bp (with the exception of Greece where sovereign yields declined). More specifically,theten-yearsovereignbondyieldinGermanyincreasedby35bpto0.26%(Decemberaverage), and it also rose by 43 bp in Belgium, to 0.61 %. These developments were essentially drivenbyhigherinflationexpectations.Despitethegeneralincreaserecordedoverthereviewperiod,sovereignyields in theeuroareadropped slightly after theECBGoverningCouncilmeetingon8December.
Overtheperiodunderreview,euroareasovereignspreadsvis-à-visGermanywidenedingeneral,except in Greece where spreads narrowed by about 175 bp. They widened the most in Italy, by 27 bp to163bp,againstabackgroundofpoliticaluncertaintystemmingfromthecountry’sconstitutionalreferendumheldon4Decemberandfromproblemsfacedbysomefinancialinstitutions.Toalesserextent,spreadsalsoincreasedinBelgium,theNetherlandsandSpain(bylessthan10bp)andstandrespectivelyat35bp,18bpand120bp.Overall,financialmarketvolatilityremainedbroadlystableinthelastquarterof2016,inspiteofapeaktriggeredbytheUSelections.
2012 2013 2014
Euro interest rate swaps
Euro area government bonds
DEBE
-1
0
1
2
3
4
5
US
Government bonds
0
1
2
3
4
5
6
2012 2013 2014 2015
Spreads vis-à-vis German Bund
BEIT ES NL FR
2015 2016 2016
10-YEAR INTEREST RATES(percentage points, monthly averages)
Sources: BIS, Datastream.
Bel
gian
Pri
me
New
s
No.
74
Jan
uary
201
7
7www.nbb.be
Annual turnover ratio (left-hand scale)
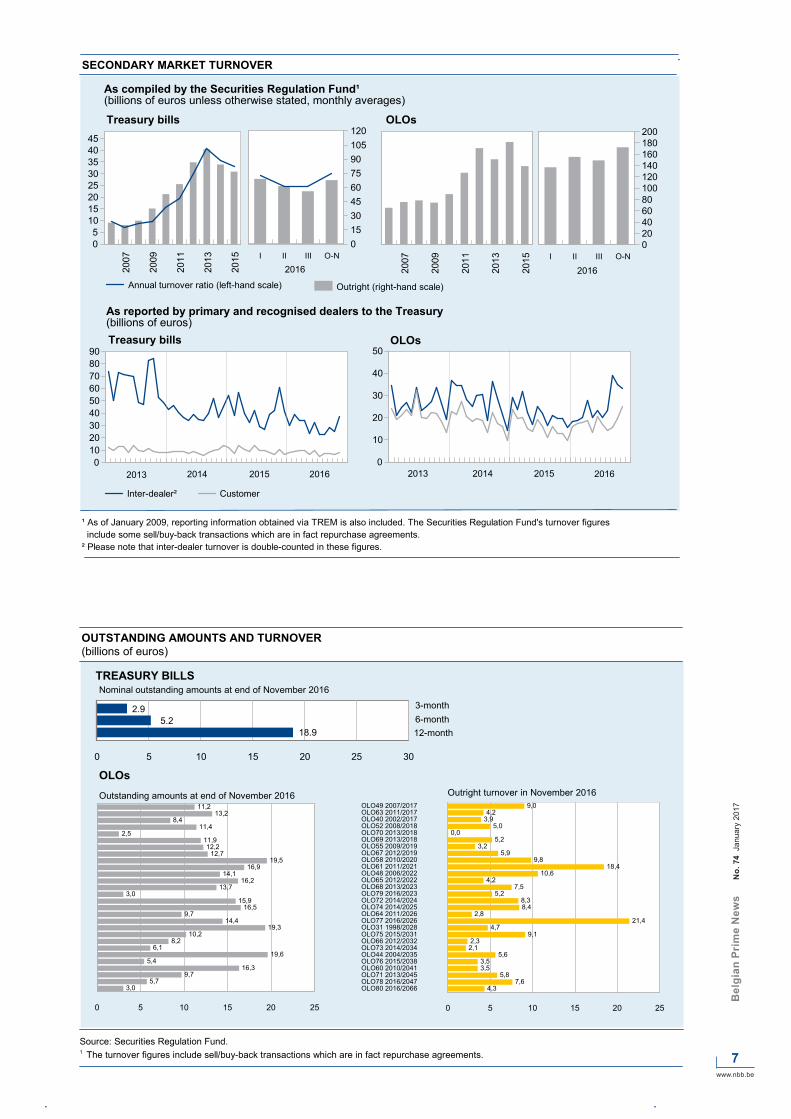
SECONDARY MARKET TURNOVER
Treasury bills OLOs
Outright (right-hand scale)
I II III O-N0153045607590105120
As compiled by the Securities Regulation Fund¹(billions of euros unless otherwise stated, monthly averages)
2007
2009
2011
2013
2015
0102030405060708090
20142013 20162015
Treasury bills OLOs
Inter-dealer² Customer
0
10
20
30
40
50
2013 20152014
As reported by primary and recognised dealers to the Treasury(billions of euros)
¹ As of January 2009, reporting information obtained via TREM is also included. The Securities Regulation Fund's turnover figures include some sell/buy-back transactions which are in fact repurchase agreements.² Please note that inter-dealer turnover is double-counted in these figures.
2016
I II III O-N020406080100120140160180200
2007
2009
2011
2013
2015
05
1015202530354045
2016 2016
Nominal outstanding amounts at end of November 2016
3-month
OUTSTANDING AMOUNTS AND TURNOVER(billions of euros)
TREASURY BILLS
0 5 10 15 20 25 30
6-month12-month
0 5 10 15 20 25
11,213,2
8,411,4
2,511,912,2
12,719,5
16,914,1
16,213,7
3,015,9
16,59,7
14,419,3
10,28,2
6,119,6
5,416,3
9,75,7
3,0
Outstanding amounts at end of November 2016
OLOsOutright turnover in November 2016
OLO80 2016/2066OLO78 2016/2047OLO71 2013/2045OLO60 2010/2041OLO76 2015/2038OLO44 2004/2035OLO73 2014/2034OLO66 2012/2032OLO75 2015/2031OLO31 1998/2028OLO77 2016/2026OLO64 2011/2026OLO74 2014/2025OLO72 2014/2024OLO79 2016/2023OLO68 2013/2023OLO65 2012/2022OLO48 2006/2022OLO61 2011/2021OLO58 2010/2020OLO67 2012/2019OLO55 2009/2019OLO69 2013/2018OLO70 2013/2018OLO52 2008/2018OLO40 2002/2017OLO63 2011/2017OLO49 2007/2017
0 5 10 15 20 25
9,04,2
3,95,0
0,05,2
3,25,9
9,818,4
10,64,2
7,55,2
8,38,4
2,821,4
4,79,1
2,32,1
5,63,53,5
5,87,6
4,3
Source: Securities Regulation Fund.1 The turnover figures include sell/buy-back transactions which are in fact repurchase agreements.
2.95.2
18.9
Belgian Prim
e New
s
N
o. 74
January 2017
8www.nbb.be
Published by : National Bank of Belgium (NBB).
Sources: NBB, unless otherwise stated.
This publication is also available on the internet site www.nbb.be.Information on the Belgian government debt can be found on the Treasury website : www.debtagency.be.General information on the Belgian government’s action can be found on the website www.belgium.be.
J List of contact persons
PARTICIPATING INSTITUTIONS TECHNICAL EDITORS TELEPHONE E-MAILFederalPublicServiceFinance MrJeanDeboutte +3225747279 [email protected] Barclays MrFrançoisCabau +442031343592 [email protected] BelfiusBank MrGeertGielens +3222227084 [email protected] MrPhilippeGijsels +3225651637 [email protected] MrArneMaes +3223121210 [email protected] MrPhilipBrown +442079868950 [email protected] MrGuillaumeMenuet +442079863281 [email protected] Commerzbank MrRainerGuntermann +496913687506 [email protected] ING MrPeterVandenHoute +3225478009 [email protected] MrPhilippeLedent +3225473161 [email protected] KBC MrPietLammens +3224175941 [email protected] MrJanVanHove +3224295950 [email protected] MorganStanley MrOlivierBizimana +442074256290 [email protected]. MsAnnaTitareva +442071028959 [email protected] SociétéGénéraleCorp.&Inv.Banking MrMichelMartinez +33142133421 [email protected]
GENERAL INFORMATION NationalBankofBelgium MrLucDresse +3222212039 [email protected]
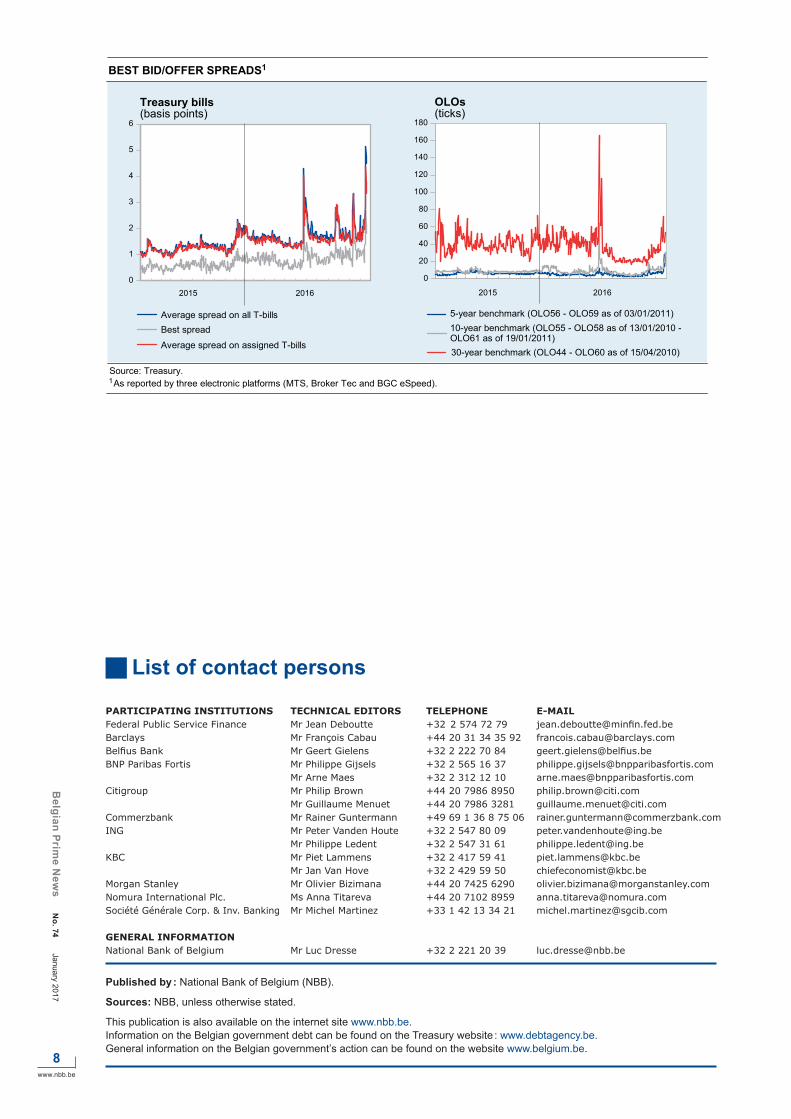
BEST BID/OFFER SPREADS1
Treasury bills(basis points)
As reported by three electronic platforms (MTS, Broker Tec and BGC eSpeed).
OLOs(ticks)
Average spread on all T-billsBest spread
Average spread on assigned T-bills
5-year benchmark (OLO56 - OLO59 as of 03/01/2011)10-year benchmark (OLO55 - OLO58 as of 13/01/2010 -OLO61 as of 19/01/2011)30-year benchmark (OLO44 - OLO60 as of 15/04/2010)
Source: Treasury.1
0
1
2
3
4
5
6
2015 2016
0
20
40
60
80
100
120
140
160
180
2015 2016