belgian contribution to the validation of the precipitation
TRANSCRIPT

BELGIAN CONTRIBUTION TO THE VALIDATION OF THE PRECIPITATION PRODUCTS OF THE HYDROLOGY-SAF:
METHODOLOGY DEVELOPED AND PRELIMINARY RESULTS
Hans Van de Vyver, Emmanuel Roulin
Royal Meteorological Institute of Belgium, Ringlaan 3 Avenue Circulaire, Brussels, Belgium
Abstract The Royal Meteorological Institute of Belgium (RMI) contributes to the Satellite Application Facility on Support to Operational Hydrology and Water Management (H-SAF) in several product validation activities. Precipitation products validation comprises first a program common to a number of countries that represent the variety of European climates; this program consists in computing scores, contingency tables and probability distributions for the various products and based on the comparison with rain gauge data and weather radar data. Second, specific activities include the analysis of case studies and an investigation on the use of the Scale Recursive Estimation (SRE) methodology to merge in an efficient and optimal way data at different spatial resolution. Finally, in the so-called hydrological validation, cumulated precipitation products are evaluated through their use as forcing data of a water balance model. This paper focuses on the methodology used for the instantaneous precipitation products derived from microwave cross-track scanners (PR-OBS-2) and gives an overview of the other topics.
H-SAF PRECIPITATION PRODUCTS The processing chain of these products has been developed by the Institute of Atmospheric Sciences and Climate of the National Research Council of Italy (ISAC-CNR), see Mugnai et al. (2006). A number of products are currently in a pre-operational status and are being validated. These are the PR-OBS-1 (Precipitation rate at ground by MW conical scanners), PR-OBS-2 (Precipitation rate at ground by MW cross-track scanners), PR-OBS-3 (Precipitation rate at ground by GEO/IR supported by LEO/MW), and PR-OBS-5 (Accumulated precipitation at ground by blended MW and IR). There is also PR-OBS-6 corresponding to instantaneous and accumulated precipitation at ground computed by a NWP model. RMI is currently validating the first four mentioned products. This paper is dealing mostly with the methodology developed to validate PR-OBS-2. The PR-OBS-2 products were based on microwave cross-track scanners and in particular, on AMSU-A and AMSU-B instruments. The processing comprises first AMSU-A spatial resolution enhancement to the resolution of AMSU-B, then a geometric correction for the variable viewing angle, and finally the precipitation rate retrieval using an approach based on Artificial Neural Network (ANN) trained using the results of a mesoscale numerical weather prediction model. The product is available in the AMSU-B projection.
UPSCALING THE WEATHER RADAR DATA To validate the precipitation products we use the weather data as reference. Here we briefly describe the validation procedure of PR-OBS-2. The sizes of the AMSU-B footprints are varying since they depend on the scan angle. The elliptic fields of view (FOV) correspond to the full width at half maximum (FWHM). The FOVs are denoted by Fxn and Fyn, with x the direction of flight, y the scan direction and n the scan position (n = 1,...,90). Weather radars provide many measurements within a single AMSU-B pixel. Those measurements should be averaged following the AMSU-B antenna pattern. This is described by a Gaussian surface:

byy
axxyxG cc
22
exp, ,
where (xc, yc) are the Lambert coordinates of the center of the FOV, and the parameters a and b can be determined from the FWHM:
2ln22xnFa ,
2ln22ynF
b .
Figure 1 (left) shows the Gaussian pattern for scan position n = 1 (scan edge). High resolution radar data (RRhigh) is up-scaled to the lower product resolution (RRlow) by:
x y
x y highlow yxG
RRyxGRR
,
,,
where (x,y) are Lambert coordinates of the center of the radar nodes where the response is not less than 1% of the maximum. This filtering procedure is organized as follows (Figure 1, right). First, a part of the radar image is selected (grey in Figure 1). Then, the radar data (0.6 km resolution are re-sampled onto a tilted grid (2 km resolution) where the Gaussian filter is 1% of maximum (dark grey). Tilting depends on the scan position and on the satellite overpass mode – this is explained in more details in a subsequent section. Finally the Gaussian filter is applied. On the Figure 1, the black ellipse corresponds to half power.
Figure 1 Left: Gaussian filter; right: sketch of the up-scaling procedure. The circle corresponds to the range of the weather radar. The square in the middle is a common area such that it is entirely included in the selected PR-OBS-2 files. The grey rectangle, the tilted dark grey rectangle and the black ellipse are explained in the text. SCORES AND PROBABILITY DISTRIBUTION FUNCTION PR-OBS-2 images including a common area centered on the weather radar have been selected in order to compute a set of scores, contingency tables and probability density functions. These results are prepared on a monthly basis. Different European teams are preparing similar results (e.g. see Lábó et al., 2008). On Figure 2, two scores, the bias and RMSE are presented for 13 months data. The scores for PR_OBS-1 and PR-OBS-3 are also shown. A seasonal effect is obvious.
Probability density functions (PDF) corresponding to two months of PR-OBS-2 products give more insight (Figure 3). Despite that the monthly bias and RMSE were of the same order (Figure 2), it can be seen that PDF was well reproduced in summer (July 2007), whereas it was significantly underestimated during winter (December 2007).
The selection of images covering the same area allows that scores may be computed for each image. For instance, the equitable threat score (ETS) at the threshold of 1 mm h-1 is presented on Figure 4 for all the selected images. The number of images with skilled PR-OBS-2 is lower in December 2007 than in July 2007, which is consistent with PDFs.
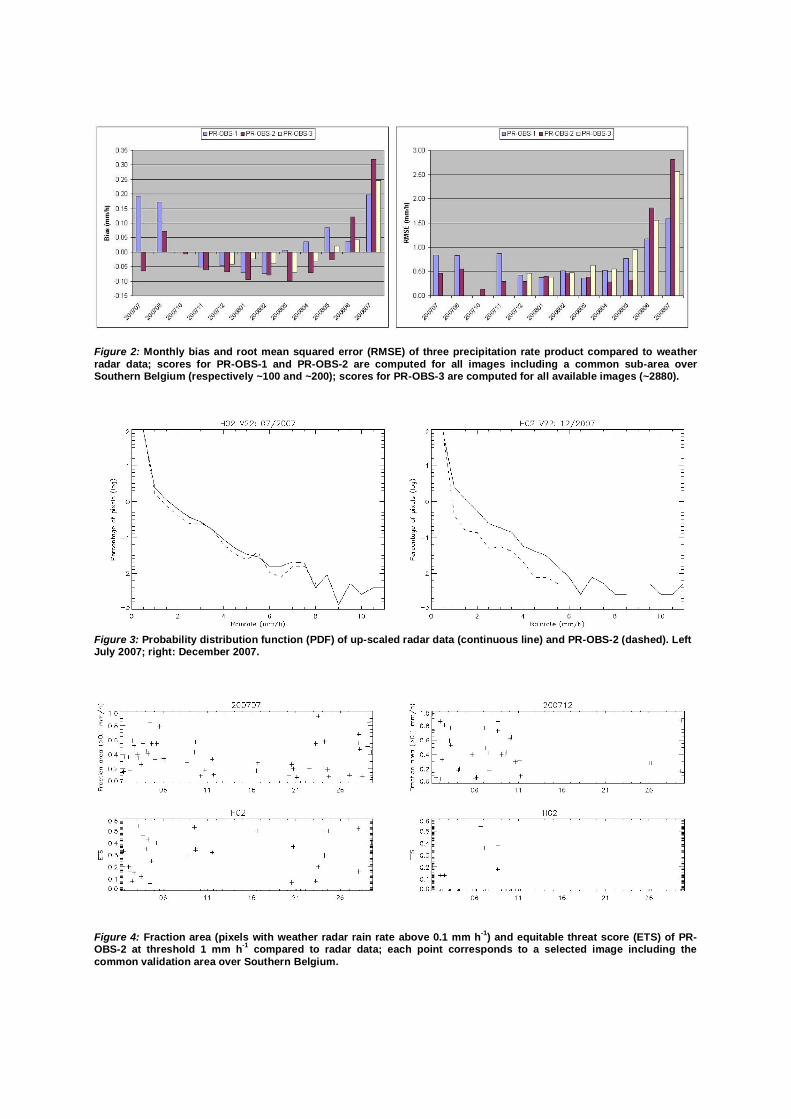
Figure 2: Monthly bias and root mean squared error (RMSE) of three precipitation rate product compared to weather radar data; scores for PR-OBS-1 and PR-OBS-2 are computed for all images including a common sub-area over Southern Belgium (respectively ~100 and ~200); scores for PR-OBS-3 are computed for all available images (~2880).
Figure 3: Probability distribution function (PDF) of up-scaled radar data (continuous line) and PR-OBS-2 (dashed). Left July 2007; right: December 2007.
Figure 4: Fraction area (pixels with weather radar rain rate above 0.1 mm h-1) and equitable threat score (ETS) of PR-OBS-2 at threshold 1 mm h-1 compared to radar data; each point corresponds to a selected image including the common validation area over Southern Belgium.

CASE STUDIES Case studies allow a closer inspection to the products under specific weather conditions. The Figures 5 and 6 show examples taken from the studies of summer and winter cases, respectively. The summer case corresponds to 29-30 August 2006. The synoptic situation was characterized by a surface through associated to upper cold air in a northwesterly flow. The structure of the precipitation field is well captured by PR-OBS-2 and PR-OBS-3. The winter case corresponds to 17-18 January 2008. The synoptic situation is characterized by a frontal depression associated to a rapid upper-air cyclonic flow. In this case, the structure of PR-OBS-3 follows that of high clouds.
Figure 5: Precipitation fields on August 29th at 13 UTC by PR-OBS-2 (upper left), PR-OBS-3 (upper right), and radar up-scaled to the SEVIRI resolution (lower left) and SAF-NWC cloud types (lower right); high clouds are in light green.
Figure 6: Precipitation fields on January 18th at 6 UTC by PR-OBS-2 (upper left), PR-OBS-3 (upper right), and radar up-scaled to the AMSU resolution (lower left) and SAF-NWC cloud types (lower right); high and very high clouds are in light green and light blue, respectively; blue is for high semi thick clouds.

SCALE RECURSIVE ESTIMATION As specific development, we have investigated an application of scale recursive estimation (SRE) to assimilate rainfall rates during a storm estimated from the data of two remote sensing devices. These are ground based weather radar and space-born microwave cross-track scanner (H-SAF product PR-OBS-2). Our approach operates directly on the data and does not require a pre-specified multi-scale model structure. We introduce a simple and computational efficient procedure to model the variability of the rain rate process in scales. The measurement noise of the radar is estimated by comparing a large number of datasets with rain gauge data. The noise in the microwave measurements is roughly estimated by using up-scaled radar data as reference. Special emphasis is placed on the specification of the multi-scale structure of precipitation under sparse or noisy data. The new methodology is compared with the latest SRE method for data fusion of multi-sensor precipitation estimates. Applications to the Belgian region show the relevance of the new methodology (Van de Vyver and Roulin, 2008).
Figure 7: Estimated precipitation fields (mm h-1) of October 29th, 2007 at 13:26 UTC over Southern Belgium at resolution 33 km2, 66 km2, 1212 km2, and 2424 km2.
HYDROLOGICAL VALIDATION Besides the characterization of the error structure of the H-SAF products, an ultimate assessment of their value is aimed in the framework of the hydrological validation program. Within this program, the products are tested in experiments based on a variety of hydrological models and on a number of test catchments representing the European hydrological situations. As far as precipitation products is concerned, the contribution of RMI to this program consists in using the 24 h cumulated precipitation product (PR-OBS-5) in the SCHEME water balance model (e.g. Roulin and Vannitsem, 2005) for two test catchments representing contrasted hydrological conditions in Belgium. So far, in the preliminary experiments, the precipitation product PR-OBS-5 has been up-scaled to the grid of the hydrological model (7 km 7 km) and used as forcing data in place of conventional input data (rain-gauge or

weather radar data); the simulated streamflow has been compared with measured streamflow as well as with the values obtained using rain-gauge data. For most of the events during the limited winter validation period, the streamflow is reflecting the underestimation of the precipitation amount of this product. The validation has been extended to the beginning of the summer. Precipitation was overestimated for some events and the streamflow was overestimated accordingly. Table 1 summarizes the validation of the 24 h cumulated precipitation of PR-OBS-5 against interpolated rain-gauge data. Winter (Dec 2007 – Mar 2008) Summer (Apr 2008 – Jun 2008) Catchment Demer Ourthe Demer Ourthe Pobs 2.3 3.8 2.6 2.5 Bias -1.2 -2.8 -0.8 0.5 RMSE 3.3 5.9 4.1 6.6 Table 1: Validation results for PR-OBS-5, 24 cumulated precipitation and integrated over the catchments (~2000 km2) in mm day-1; Pobs is the mean observed. MORE ABOUT THE SLOPE OF AMSU-B FOOTPRINTS In the following, the slope of the footprints with a parallel at the target location is derived. A spherical Earth is assumed. The position of the cross-track scanner and the ascending or descending mode of the sun-synchronous satellite are taken into account.
Figure 8: Scanning geometry: O, centre of the Earth; N, North; S, satellite; P, sub-satellite point; D, descending node; F, centre of footprint; , inclination angle; , scan angle; P, latitude of P; solid lines correspond to the meridians in P and F and the equator; dashed dotted lines sustain the projection of the satellite’s orbit (P-D) and the cross-track (P-F). The geometry of problem is presented on Figure1. The situation corresponds to a descending mode and at the beginning of the scanning. The situation is frozen at the instant when the satellite is above a point P with coordinates (P,P), and viewing a target F (F,F) under an angle . The angle between the meridian and the projection of the orbit of the satellite depends on the inclination angle, , between the equatorial plane and the orbit plane. This angle is determined in the spherical triangle (P,L,D):
P
coscosarcsin
At the equator, its value is equal to the complement of the inclination angle. The projection of the trajectory is perpendicular to the meridian at the point nearest to the pole i.e. for a latitude equal to the inclination angle. . Between these two values, a plot of this angle versus latitude is presented in Figure 2. Note that is not exactly the same as the angle between the meridian and the ground-track since the effect of the Earth rotation should be taken into account.

Figure 9: Angle between the meridian and the projection of the satellite’s orbit in function of the latitude of the sub-satellite point. The angle between the longitude line at F and the cross-track line will be derived by first considering the scanning plan (containing O, P, S and F), then the spherical triangle N-F-P (Figure 3). The angle between the Earth radius and the direction to the satellite, , is obtained with the sinus law; because >/2, this writes:
R
ZR sinarcsin ,
where R is the Earth’s radius and Z is the orbit altitude. The arc angle is given by: a .
Figure 10: Left: sketch of the scanning plane; right: spherical triangle defined by the North, the sub-satellite point and the target. In the spherical triangle N-P-F, the arc angle b is the co-latitude of P ( Pb 2 ) and the angle
is the complement of ( 2 ). The arc angle c is derived with the cosine law:
cossinsincoscosarccos babac .
The same law in b permits to calculate the angle between the longitude in F and the scan line:
ca
cabsinsin
coscoscosarccos
Finally, the results will be presented as the slope, , between the parallel in F and the scan direction: 2 . Negative slopes correspond to footprints appearing tilted downward to the right (East)
and positive otherwise (Figure 4). For the beam looking to the left compared to the satellite movement

(scan position from 46 to 90), is given by: 2 , and the slope: 2 . For the ascending mode, the slope is of opposite sign to that of the descending mode.
In descending mode, the footprints appears less tilted if they are situated westward from the ground-track than eastward; the slope is equal to the angle (and not ) only at the nadir of the satellite.
Figure 11: Slope between the scan direction and a parallel in F; in this case, the sub-satellite point is at 50° N. The Earth is better represented as an ellipsoid than a sphere. The exact orientation of the footprints on the radar image is too complex to be simulated for all pixels and for this reason, a pragmatic (and approximate) approach has been adopted which relies on the position of a pixel and the positions of the neighboring pixels as given in the product files.
CONCLUSIONS Methods have been developed for the validation of the H-SAF precipitation products. These methods are mainly based on the use of weather radar data for the rain rate products. Rain-gauge data are used to validate cumulated precipitation products. Preliminary results and case studies have been given as example. Specific research on the use of scale recursive estimation for the fusion of data from different sensors, and activities for the hydrological validation are also outlined. ACKNOWLEDGMENT This research was funded by EUMETSAT, the Belgian Federal Scientific Policy Office, and ESA PRODEX Programme. Stefano Dietrich and Francesco Di Paola from CNR-ISAC, Nicolas Clerbaux, Laurent Delobbe and Jean Neméghaire from the Royal Meteorological Institute of Belgium are thanked for their help. REFERENCES Lábó, E., J. Kerényi, and S. Puca, (2008). Methods used for the validation of the satellite-derived
precipitation products, part of the Hydrology SAF in Hungary. Proc. The 2008 EUMETSAT Meteorological Satellite Conference, Darmstadt, Germany, .8 – 12 September 2008
Mugnai, A., B. Bizzarri, F. Di Paola, S. Dietrich, V. Levizzani, and F. Torricella, (2006). Unified framework for precipitation retrieval and analysis by means of multisensor satellite observations and cloud model simulations: Application to H-SAF. Proc. The 2006 EUMETSAT Meteorological Satellite Conference, Helsinki, Finland, 12 – 16 June 2006.
Roulin, E. and S. Vannitsem, (2005). Skill of medium-range hydrological ensemble predictions. J. Hydrometeor., 6, 729-744.
Van de Vyver, H., and E. Roulin, (2008). Scale recursive estimation for merging precipitation data from radar and microwave cross-track scanners. Submitted to J. Geophys. Res.