behavioral adaptation of young and older drivers to an intersection crossing advisory, aap, 74,...
TRANSCRIPT

Accident Analysis and Prevention 74 (2014) 24–32
Behavioral adaptation of young and older drivers to an intersectioncrossing advisory system
Mandy Dotzauer a,*, Dick de Waard b, Simone R. Caljouwc, Gloria Pöhler d,Wiebo H. Brouwer a,b
aUMCG, Department of Neurology, Neuropsychology Unit, Hanzeplein 1, AB 60, 9700 RB Groningen, the NetherlandsbUniversity of Groningen, Department of Clinical and Developmental Neuropsychology, Grote Kruisstraat 2/1, 9712 TS Groningen, the NetherlandscUMCG, Faculty of Medical Sciences, University of Groningen, Center for Human Movement Sciences, Antonius Deusinglaan 1, Room 329 (3215), 9713 AVGroningen, the NetherlandsdKarlsruhe Institute of Technology, IFAB, Engler-Bunte-Ring 4, Building 40.29, Room 107, 76131 Karlsruhe, Germany
A R T I C L E I N F O
Article history:Received 27 September 2013Received in revised form 4 July 2014Accepted 29 September 2014Available online xxx
Keywords:Intersection assistanceolder driversBehavioral adaptationSafetyADAS
A B S T R A C T
An advanced driver assistance system (ADAS) provided information about the right of way regulation andsafety to cross an upcoming intersection. Effects were studied in a longer-term study involving 18 healthyolder drivers between the ages of 65 and 82 years and 18 healthy young drivers between the ages of20 and 25 years. Participants repeatedly drove 25 km city routes in eight sessions on separate days over aperiod of two months in a driving simulator. In each age group, participants were randomly assigned tothe control (no ADAS) and treatment (ADAS) group. The control group completed the whole experimentwithout the ADAS. The treatment group drove two sessions without (sessions 1 and 7) and six times withADAS. Results indicate effects of ADAS on driving safety for young and older drivers, as intersection timeand percentage of stops decreased, speed and critical intersection crossings increased, the number ofcrashes was lower for treatment groups than for control groups. The implications of results are discussedin terms of behavioral adaptation and safety.
ã 2014 Elsevier Ltd. All rights reserved.
Contents lists available at ScienceDirect
Accident Analysis and Prevention
journa l homepage: www.e l sev ier .com/ locate /aap
1. Introduction
According to recent European crash statistics, more youngdrivers (18–24 years) and older drivers (65 years and older) arekilled in car crashes than drivers in any other age group (Euro Stat,2011). Over the last few decades, efforts have been put intodesigning support systems with the intention to make drivingsafer. Advanced Driver assistance systems (ADAS) which supportdrivers have been developed. For example, ADAS help with thelongitudinal (adaptive cruise control and collision warning) andlateral control (lane departure warning) of the vehicle, or preventlosing control in a curve (electronic stability control). Other onessuch as intersection assistance systems are being researched. In arecent driving simulator study, an intersection assistant designedto give tailored support to older drivers taking into accountage-related limitations in processing speed and divided attention,
* Corresponding author. Tel.: +49 531 295 3519.E-mail addresses: [email protected] (M. Dotzauer), [email protected]
(D. de Waard), [email protected] (S.R. Caljouw), [email protected](G. Pöhler), [email protected] (W.H. Brouwer).
http://dx.doi.org/10.1016/j.aap.2014.09.0300001-4575/ã 2014 Elsevier Ltd. All rights reserved.
was studied (Dotzauer et al., 2013). Even though it is often assumedthat support given to older drivers will be beneficial for youngdrivers as well, considering the underlying causations for crashinvolvement, the assumption can be questioned. Crash situationsand determinants are quite different for these two age groups(Mayhew et al., 2003; McKnight and McKnight, 2003) andinterventions needed to reduce the occurrence of crashes alsomight be quite different. So, young drivers might not profit from orrespond to an assistance system that is tailored to fit the needs ofolder drivers. For example, in an early study on a speed feedbacksystem, De Waard et al. (1999) found that older drivers’ response tofeedback messages was different than for younger drivers; youngdrivers looked upon the system as an enforcement device whileolder drivers welcomed the system as a support system.
Across the lifespan, a shift in crash contributing factors but also ashift in crash characteristics is noticeable. As young drivers startdriving, they lack experience and maturity (Deery, 1999; Mayhewet al., 2003; Borowskyet al., 2009; Trick et al., 2009; Curryet al., 2011;Vlakveld, 2011; Mueller and Trick, 2012), relatively more frequently,they do not maintain attention (Simons-Morton et al., 2004; Jaccardet al., 2005; Beede and Kass, 2006; Kass et al., 2007), searchinappropriately (Pradhan et al., 2009; Vidotto et al., 2011), fail to

M. Dotzauer et al. / Accident Analysis and Prevention 74 (2014) 24–32 25
recognize hazards (Borowsky et al., 2009; Trick et al., 2009; De Craenet al., 2011; Vlakveld, 2011; Mueller and Trick, 2012), and make poordecisions with regard to speed choice and time headway (THW)(Simons-Morton et al., 2005), reflecting a lack of driving skills(McKnight and McKnight, 2003; Curry et al., 2011) which results inpoorer driving performance. But young inexperienced drivers evolveinto experienced drivers who estimate their driving skills morerealistically, learn to search the environment better, identify andassess critical traffic situations more realistically and react in anappropriate manner to changes in road and traffic situations. Resultsfrom Graduated Driver Licensing systems also support this; thehighest rate of crash involvement is during the first months of solodriving with relatively higher crash involvement for younger driversand males (e.g., Mayhew, 2007; Lewis-Evans, 2010). Crash statisticsof middle-aged drivers further reflect those changes; this age group’sfatal crash involvement is the lowest. Over the years, the number offatal crashes and the risk of being involved in fatal crashes decreases,up until 65 years of age. Approximately from that age, risks of beinginvolved in and causing a crash as well as being seriously injuredincreases (EuroStat, 2011). Unlike young drivers, older drivers do notlack driving skills, but many of them struggle with age-relateddeclines that affect driving performance (McGwin and Brown,1999)and because of their physical vulnerability injuries are more severe(Evans, 2004). The most typical crashes that older drivers areinvolved in are at-fault crashes at an intersection (McGwin andBrown, 1999; Davidse, 2007) struggling most with decision makingunder time pressure and divided/selective attention (Brouwer andPonds,1994; De Waard et al., 2009; Musselwhite and Haddad, 2010).
According to older drivers’ specific crash characteristic, theADAS used in the previous study (Dotzauer et al., 2013) wasdesigned. It gave tailored support to older drivers providingrelevant traffic information in advance countering difficulties withdecision making under time pressure and divided/selectiveattention. Considering that young drivers’ difficulties may mainlybe based on inexperience and immaturity often resulting ininadequate speed choices and inaccurate anticipation of hazards,the question that rises is whether providing information aboutpriority regulation and gap sizes in intersections (see Dotzaueret al., 2013) in advance might also be suitable for young drivers.Predominantly, young drivers are involved in single-vehiclecrashes on rural roads rather than multiple-vehicle crashes inintersections. Nonetheless, crossing an intersection might be ahazardous task for young drivers as well; especially, when the viewof the crossing road is obstructed. Crossing requires dividedattention among several pieces of information, perceiving andprocessing changes in the traffic situation, perceiving andprocessing signals and traffic signs, determining and executing acourse of action (Braitman et al., 2008), decision making undertime pressure (Brouwer and Ponds, 1994), and anticipatinghazards. Intersection crossings might be a dangerous undertakingfor young and older drivers even though the underlying causationsare different. Older drivers are more likely to struggle withintersection crossing due to their limited attentional resources.Young drivers might struggle with appropriately assessing thetraffic situation and therefore might engage in risky crossingbehavior. Providing relevant traffic information (e.g., gap sizes)about the upcoming intersection in advance might support driversof both age groups on the tactical level of the driving task.
Based on Michon’s hierarchical task analysis (Michon, 1985),the driving task is divided into three levels. The strategic level(navigation) is the highest level. On this level, decisions withregard to route, navigation, and time of driving are made. Decisionsare usually made before the trip has begun, but also, occasionally,during the trip, for example when deciding to take an alternativeroute because of a traffic jam. On the tactical level, while driving,safety margins are set and adjusted for the trip. This includes
deciding on speed, time-headway, and lane position, but alsoinvolves considering various maneuvers such as overtaking,passing, and crossing. On the operational level (control), driversperform second to second lateral and longitudinal control tasks toavoid acute danger and to stay within the margins set on thetactical level. The difference between tactical and operational leveldecisions and actions is that the latter are reactive and the formerare proactive (anticipatory), not a reaction to immediate dangerbut a setting of safety margins in the case that actual danger (e.g.,vehicle on collision course) manifesting itself in the near future.
Therefore, receiving information in advance may serve twopurposes for older drivers. It may take away uncertainty and maycounter difficulties with divided attention, for example, whenreceiving information about gap size to crossing traffic. Knowingthat the gap size is either large enough or too small to crosssupports drivers when deciding on going or stopping. Therefore,decision making under time pressure might be countered. Youngdrivers might benefit from the information, but differently becausetheir weakness is not limited attentional resources but ratheridentifying hazards and acting appropriately. For example,providing information about gap size might teach young driversto assess crossable gap sizes more accurately. This augmentedinformation also implies the presence of other vehicles at theintersection even though they might be hidden behind bushes;therefore, young inexperienced drivers might become moresensitive to potential hazards.
In a recent driving simulator study, an intersection assistancesystem which provided relevant information about gap sizes tocrossing traffic in advance (Dotzauer et al., 2013) was proposed. Asresearch of ADAS effects on driving performance over longer timeperiods is lacking, the study was conceptualized to investigatechanges in performance over a period of two months including14 repeated measures. In order to assess the effects of theintersection assistant, safety-critical situations were created.Bushes were placed along intersections that needed to be crossed,blocking the view into the intersection. The system was tested withhealthy older drivers (65–82 years) in order to investigate effects ofADAS use on performance over time, and to scrutinize the need fortailored support (Dotzauer et al., 2013). Older drivers’ performancedata used for the present paper was obtained during the firstexperiment. The aim of the present study was to examine theperformance of older drivers in relation to the performance ofyoung less experienced drivers. The main focus laid on theinvestigation and evaluation of the intersection assistant. Youngdrivers completed the same drive as older drivers and followed thesame protocol as older participants, but instead of completing14 sessions, they only completed the first eight sessions of theexperiment. The number of sessions was limited to eight becauseof time constraints but also to minimize the drop-out rate in thegroup of young inexperienced drivers.
We expect an age effect in all driver performance parameters.Dependent measures such as intersection time, maximum speed inintersections, number of stops before crossing, minimum averagetime-to-collision to crossing traffic, and number of critical crossingswill differ between groups. Moreover, we assume that over time,drivers supported by ADAS will show changes in performance.
2. Method
2.1. Participants
In a recent study (Dotzauer et al., 2013), 25 older drivers wererecruited of which 40% dropped out because of simulator sickness.Data of 18 older drivers between the ages of 65 years and 82 years(M = 71.4, SD = 4.8),15 male and three female drivers were collected.In addition, after a 20% drop-out rate among the young drivers,

26 M. Dotzauer et al. / Accident Analysis and Prevention 74 (2014) 24–32
18 drivers between the ages of 20 years and 25 years (M = 22.3,SD = 1.74), nine male and nine female, participated in the study. Onaverage, older drivers reported a total driving experience of965,000 km, with an average of 17,900 km driven the past year;whereas, young drivers averaged 22.900 km experience with ayearly average of 5800 km. Participants were assigned to the controland treatment group by means of controlled randomization.
2.2. Apparatus
A validated (e.g., De Waard and Brookhuis, 1997) fixed-baseddriving simulator located at the University Medical CenterGroningen was used for the study. The simulator consisted of anopen cabin-mock-up containing an adjustable force-feedbacksteering wheel, gas pedal, brake pedal, and audio sound simulateddriving sound. Three screens (4.5 m diameter) resulting in180 degrees horizontal and 45 degrees vertical projection wereplaced in front of the open cabin mock-up. Front and side windowsas well as a rear view mirror and side mirrors were projected ontothe screen. The computer system consisted of four PCs: two PCswere used for graphical rendering, one for the traffic simulationand one for system control with a user interface for the simulatoroperator. The graphical interface was designed by means ofStRoadDesign, a program provided by StSoftware. The scenario wasprogrammed by means of StScenario, a scripting language alsodeveloped by StSoftware.
2.3. ADAS
The ADAS consisted of four functions: (1) in-vehicle trafficsign display, (2) speed warning, (3) collision warning, and(4) intersection assistance. All information was presented bymeans of a head up display (HUD). This paper will focus on theintersection assistant. The assistant provided information aboutapproaching traffic at the upcoming intersection and indicatedwhether it was safe to cross the intersection. The information waspresented in form of a bar in front of the driver. It was a three-stagesystem that dynamically changed from green to amber to red andvice versa as the traffic situation changed. The priority regulation(whether drivers had right-of-way or to yield to crossing traffic) atthe intersection and the travelling direction (as indicated by theactivation/deactivation of the indicator) of the driver were takeninto account by the assistant system. Based on trial and error,values for gap acceptance were determined. When the gapbetween the driver and the crossing cars was greater than fiveseconds, a green light lit up indicating that it was safe to cross.Gaps between 2.5 and 5 sec were classified as marginal indicatedby an amber flag, and gap sizes smaller than 2.5 sec were unsafe asconveyed by the red flag. In order to calculate gaps and give adviceon whether to proceed through the intersection, the driver’stime-to-intersection (TTI) and time-to-collision (TTC) with othercars approaching the intersection were taken into account. TTIand TTC values are based on course, speed, and distance.
2.4. Design
The driving simulator study is a mixed study design with 13 or14 repeated measurements (older drivers) or eight repeatedmeasures (young drivers). Data of older participants were collectedduring an earlier study (Dotzauer et al., 2013) and analyses will belimited to sessions 1–8 for the present study. Data of young driverswere collected during a follow-up experiment. Younger driverscompleted eight sessions. The experiment had been approved bythe Medical Ethical Committee (METc) of the University MedicalCenter Groningen. Participants were assigned to the control andtreatment group by means of controlled randomization. Selected
sessions for the control group were all without the intersectionassistant; the treatment group drove two times without assistance(namely, session 1 and 7) and six times with ADAS. The virtualdriving environment was comprised of a 25 km city drive. Routeinstructions on when to turn left and right were given visually andauditory through a navigation system. In order to avoid learningeffects, four different routes comparable in length and events wereused. The order of the routes was counterbalanced. Driversencountered various driving tasks such as changes in priorityregulation, variations in speed limits, and slower moving vehicle infront of them. All participants completed the first session withoutthe system. The treatment group completed sessions 2–6 withADAS, session 7 without ADAS, and session 8 with ADAS again.
Young drivers were also randomly assigned to the control andtreatment group. The control group completed the experimentwithout ADAS and the treatment group with ADAS, except forsessions 1 and 7.
During each session, participants crossed 130 intersections. Outof these intersections, based on the priority regulation (see below),16 intersections per session were selected to assess the effects ofADAS use on driving performance and driving behavior. Half ofthose intersections had bushes placed along the crossing road inorder to obstruct the view into the intersection forcing the driver toslow down before crossing the intersection. The other eightintersections had no view obstructions. All selected intersectionshad a speed limit of 30 km/h and the priority was regulated byyield-to-the-right.
2.5. Procedure
Persons interested in participation received an informationpackage via regular mail or email including a detailed descriptionof the study and an informed consent form. After completing theinformed consent, participants were invited, completed otherquestionnaires and completed four rides (each of approximatelyfive to seven minutes) in the driving simulator to get acquainted tothe simulator and to test for simulator sickness. Participants whoexperienced simulator sickness (40% of older drivers and 20% ofyoung drivers) during the training were excluded from the study.
Participants returned for the experimental sessions. They read ashort description of the experiment and took a seat in the simulator.The seat and steering wheel were adjusted to accommodateparticipants’ preferences. Participants were instructed to drive asthey would normally do. After the first session, the treatment groupwas introduced to the ADAS. The functions and functioning of theADAS wasexplained to participants with the help of a user manual. Inaddition, participants completed a five minute ride during which allfunctions were demonstrated in particular traffic situations. Theyalso took home a user manual and were asked to read it thoroughly.Older participants returned to the driving simulator three times perweek for four weeks and after the retention interval of four weeksreturned for a final assessment. Control group drivers came back forone final assessment and drivers of the treatment group for twoassessments. Younger participants returned three times for the firsttwo weeks and two more times during the third week of theexperiment. All participants were financially compensated for theirparticipation.
2.6. Data analyses and dependent measures
For the present study, sessions 1 through 8 were selected forfurther analysis. For treatment groups, sessions 1 and 7 werewithout ADAS; sessions 2 through 6, and session 8 were with ADAS(see Fig. 1). Control groups completed all sessions without ADAS.Per session, eight intersections with obstructed view and eightintersections without obstructed view were chosen for further
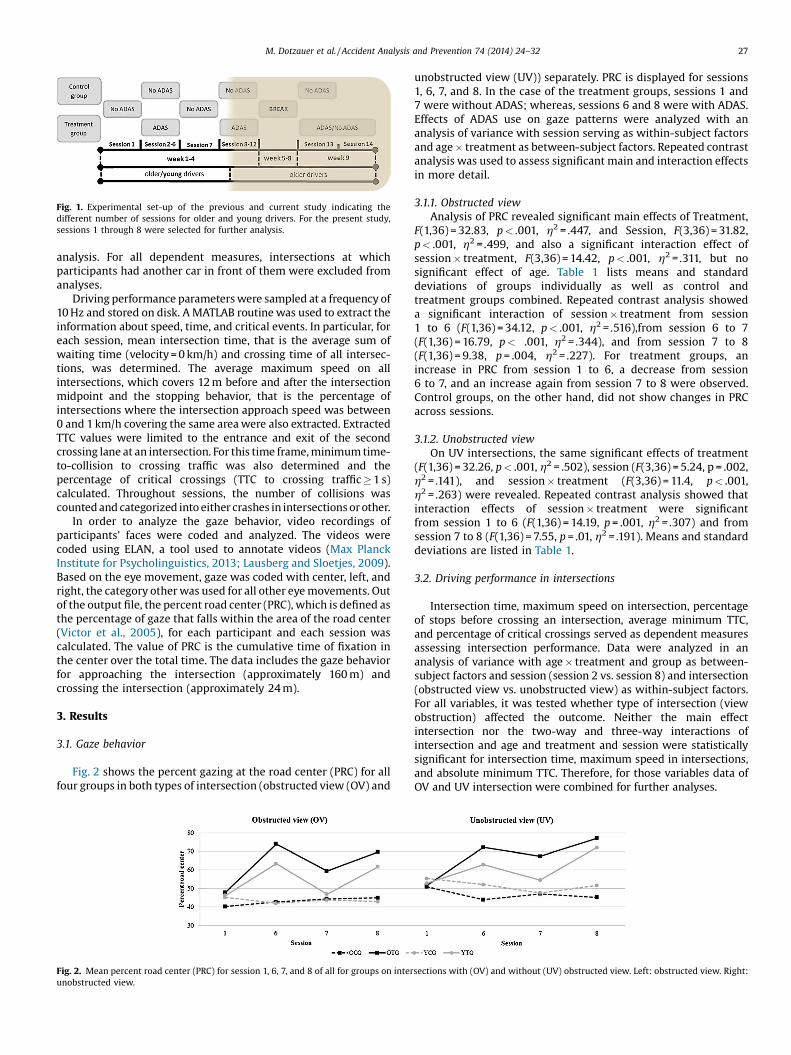
Fig. 1. Experimental set-up of the previous and current study indicating thedifferent number of sessions for older and young drivers. For the present study,sessions 1 through 8 were selected for further analysis.
M. Dotzauer et al. / Accident Analysis and Prevention 74 (2014) 24–32 27
analysis. For all dependent measures, intersections at whichparticipants had another car in front of them were excluded fromanalyses.
Driving performance parameters were sampled at a frequency of10 Hz and stored on disk. A MATLAB routine was used to extract theinformation about speed, time, and critical events. In particular, foreach session, mean intersection time, that is the average sum ofwaiting time (velocity = 0 km/h) and crossing time of all intersec-tions, was determined. The average maximum speed on allintersections, which covers 12 m before and after the intersectionmidpoint and the stopping behavior, that is the percentage ofintersections where the intersection approach speed was between0 and 1 km/h covering the same area were also extracted. ExtractedTTC values were limited to the entrance and exit of the secondcrossing lane at an intersection. For this time frame, minimum time-to-collision to crossing traffic was also determined and thepercentage of critical crossings (TTC to crossing traffic � 1 s)calculated. Throughout sessions, the number of collisions wascounted and categorized into either crashes in intersections or other.
In order to analyze the gaze behavior, video recordings ofparticipants’ faces were coded and analyzed. The videos werecoded using ELAN, a tool used to annotate videos (Max PlanckInstitute for Psycholinguistics, 2013; Lausberg and Sloetjes, 2009).Based on the eye movement, gaze was coded with center, left, andright, the category other was used for all other eye movements. Outof the output file, the percent road center (PRC), which is defined asthe percentage of gaze that falls within the area of the road center(Victor et al., 2005), for each participant and each session wascalculated. The value of PRC is the cumulative time of fixation inthe center over the total time. The data includes the gaze behaviorfor approaching the intersection (approximately 160 m) andcrossing the intersection (approximately 24 m).
3. Results
3.1. Gaze behavior
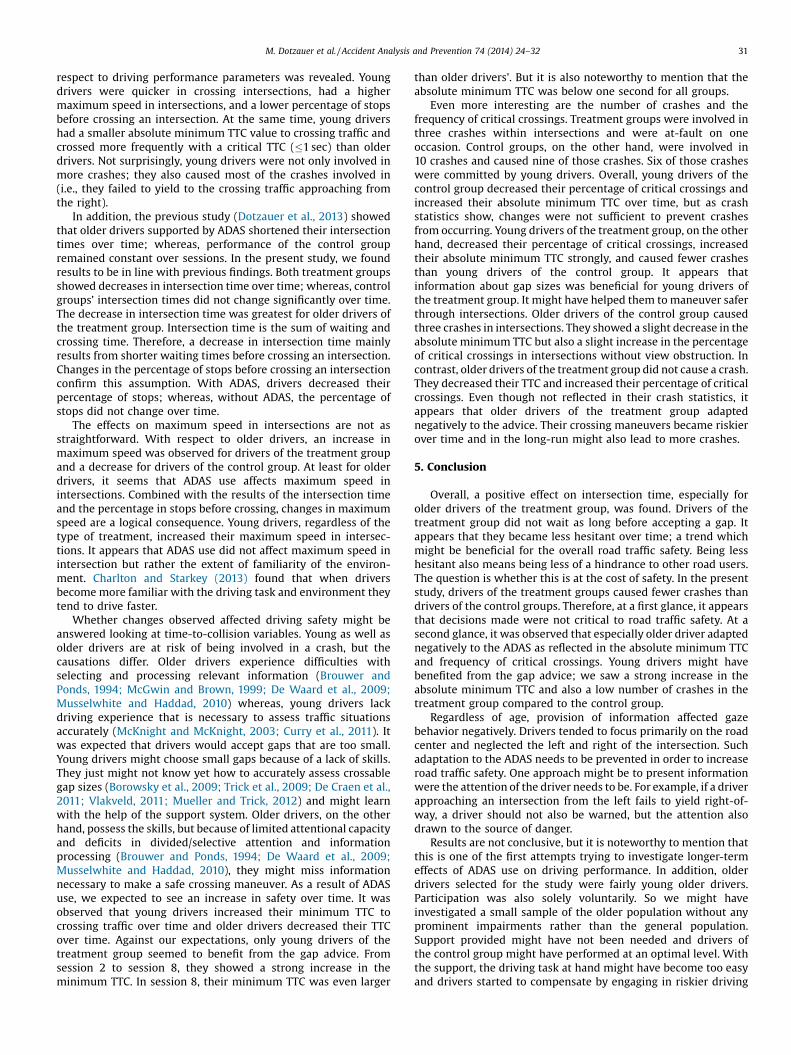
Fig. 2 shows the percent gazing at the road center (PRC) for allfour groups in both types of intersection (obstructed view (OV) and
Fig. 2. Mean percent road center (PRC) for session 1, 6, 7, and 8 of all for groups on interunobstructed view.
unobstructed view (UV)) separately. PRC is displayed for sessions1, 6, 7, and 8. In the case of the treatment groups, sessions 1 and7 were without ADAS; whereas, sessions 6 and 8 were with ADAS.Effects of ADAS use on gaze patterns were analyzed with ananalysis of variance with session serving as within-subject factorsand age � treatment as between-subject factors. Repeated contrastanalysis was used to assess significant main and interaction effectsin more detail.
3.1.1. Obstructed viewAnalysis of PRC revealed significant main effects of Treatment,
F(1,36) = 32.83, p < .001, h2 = .447, and Session, F(3,36) = 31.82,p < .001, h2 = .499, and also a significant interaction effect ofsession � treatment, F(3,36) = 14.42, p < .001, h2 = .311, but nosignificant effect of age. Table 1 lists means and standarddeviations of groups individually as well as control andtreatment groups combined. Repeated contrast analysis showeda significant interaction of session � treatment from session1 to 6 (F(1,36) = 34.12, p < .001, h2 = .516),from session 6 to 7(F(1,36) = 16.79, p < .001, h2 = .344), and from session 7 to 8(F(1,36) = 9.38, p = .004, h2= .227). For treatment groups, anincrease in PRC from session 1 to 6, a decrease from session6 to 7, and an increase again from session 7 to 8 were observed.Control groups, on the other hand, did not show changes in PRCacross sessions.
3.1.2. Unobstructed viewOn UV intersections, the same significant effects of treatment
(F(1,36) = 32.26, p < .001, h2 = .502), session (F(3,36) = 5.24, p = .002,h2 = .141), and session � treatment (F(3,36) = 11.4, p < .001,h2 = .263) were revealed. Repeated contrast analysis showed thatinteraction effects of session � treatment were significantfrom session 1 to 6 (F(1,36) = 14.19, p = .001, h2 = .307) and fromsession 7 to 8 (F(1,36) = 7.55, p = .01, h2 = .191). Means and standarddeviations are listed in Table 1.
3.2. Driving performance in intersections
Intersection time, maximum speed on intersection, percentageof stops before crossing an intersection, average minimum TTC,and percentage of critical crossings served as dependent measuresassessing intersection performance. Data were analyzed in ananalysis of variance with age � treatment and group as between-subject factors and session (session 2 vs. session 8) and intersection(obstructed view vs. unobstructed view) as within-subject factors.For all variables, it was tested whether type of intersection (viewobstruction) affected the outcome. Neither the main effectintersection nor the two-way and three-way interactions ofintersection and age and treatment and session were statisticallysignificant for intersection time, maximum speed in intersections,and absolute minimum TTC. Therefore, for those variables data ofOV and UV intersection were combined for further analyses.
sections with (OV) and without (UV) obstructed view. Left: obstructed view. Right:

Table 1Summary of means and standard deviations of PRC for intersections with view obstruction and without view obstruction of control groups (YCG and OCG) and treatmentgroups (YTG and OTG).
Obstructed view Unobstructed view
1 6 7 8 1 6 6 8
M SD M SD M SD M SD M SD M SD M SD M SD
YCG 45.1 12.6 41.9 8.9 43.7 6.8 42.9 9.2 55.4 12.9 52.1 9.9 47.6 12.9 51.5 12.4OCG 40.3 11.2 42.6 14.9 44.3 10.2 44.9 10.9 50.9 8.4 43.9 10.2 47.1 14.8 45.2 12.1Control group 42.7 11.8 42.3 11.9 44 8.4 43.9 9.84 53.2 10.8 47.9 10.6 47.4 13.5 48.4 12.3
YTG 46.2 9.2 63.3 13.9 46.9 11.8 61.7 18.1 52.7 12.9 62.8 13.1 54.5 12.9 72.1 14.1OTG 47.9 11.8 74.1 10.2 59.4 9.3 69.7 10.6 51.2 6.7 72.2 13.1 67.4 12.3 77.2 5.3Treatment group 47.1 11.8 68.7 13.1 53.1 12.1 56.7 14.9 52.2 10.0 67.5 13.6 60.9 13.9 74.6 10.7
28 M. Dotzauer et al. / Accident Analysis and Prevention 74 (2014) 24–32
3.2.1. Intersection timeIntersection times for each group over the eight sessions are
displayed in Fig. 3. Overall, main effects of age (F(1,36) = 6.23,p = .02, h2 = .163) and session (F(1,36) = 7.24, p = .01, h2 = .185) and asignificant interaction effect of session � treatment (F(1,36) = 4.93,p = .03, h2 = .134) were observed. Post-hoc analysis revealedsignificant differences in intersection time for treatmentgroups (older driver treatment group (OTG) and young drivertreatment group (YTG)), F(1,18) = 9.34, p = .008, h2 = .369. Onaverage, intersection time decreased from 5.95 s (SD = 6.02) insession 2 to 2.24 s (SD = 1.54) in session 8. Control groups’ (olderdriver control group (OCG) and young driver control group(YCG)) changes in intersection time (M2 = 6.3, SD2 = 6.39 vs.M8 = 5.94, SD8 = 7.51) were not significant, F(1,18) < 1, ns.
Significant differences in intersection time for individualgroups (F(2,36) = 3.69, p = .04, h2 = .188) were also found. Therefore,testing for changes over time for each group, a large effect(after adjusting the a-level) was found for OTG, F(1,9) = 6.41,p = .04, h2 = .445. OTG decreased their intersection time from7.50 s (SD = 6.26) to 3.07 s (SD = 1.72). Even though YTG decreasedintersection time from session 2 (M = 4.41, SD = 5.69) to session 8(M = 1.41, SD = .75), changes were not significant, F(1,9) = 3.15,p = .1, h2 = .283. OCG showed a non-significant (F(1,9) < 1, ns)decrease in intersection time from 9.69 s (SD = 7.61) to 8.51(SD = 9.81) and YCG increased intersectiontime (M2 = 2.91,SD2 = 1.75 vs. M8 = 3.39, SD8 = 2.94) non-significantly, F(1,9) < 1, ns.
3.2.2. Maximum speedFig. 4 shows changes of maximum speed in intersections for
all four groups. Analyses of maximum speed in intersectionsrevealed that young drivers had a significantly higher maximum
Fig. 3. Means of intersection times in seconds for sessions 2 and 8 for OCG, OTG,YCG, and YTG.
speed in intersections compared to older drivers, F(1,36) = 8.19,p = .007, h2 = .204.
Even though the analysis did not reveal a significant maineffect of session (session 2 vs. session 8) or a significant interactioneffect of session � treatment, it is noteworthy to mention thatregardless of treatment, it was observed that young drivers of thecontrol group (M2 = 34.02, SD2 = 4.07 vs. M8 = 37.25, SD8 = 10.33)and of the treatment group (M2 = 36.29, SD2 = 4.85 vs. M8 = 38.43,SD8 = 7.17) increased speed in intersections. On the other hand, itwas observed that older drivers of the control group decreasedspeed (M2 = 33.29, SD2 = 3.09 vs. M8 = 31.55, SD8 = 2.56); whereas,drivers of the treatment group increased speed in intersections(M2 = 33.26, SD2 = 3.51 vs. M8 = 34.35, SD8 = 3.82). This trend ofolder drivers is also reflected in the interaction effect ofsession � treatment, F(1,18) = 3.45, p = .08, h2 = .177.
3.2.3. Percentage of stopsFig. 5 shows the number of stops in percentage separately
for intersections with (OV) and without (UV) obstructed view.The percentage of stops of young and older drivers differedsignificantly, F(1,36) = 34.98, p < .001, h2 = .516. Overall, youngdrivers stopped less frequently beforecrossing an intersectionthan older drivers (Myoung = 19%, Molder = 47%).
Moreover, ANOVA with repeated measures revealed asignificant main effect of session, F(1,36) = 9.87, p = .004, h2= .236and a significant interaction of session � treatment, F(1,36) = 7.46,p = .01, h2 = .189. Analysis of treatment groups’ (OTG and YTG)percentage of stops showed significant differences over time,F(1,18) = 19.53, p < .001, h2 = .550. The percentage of stopsdecreased from about 40% in session 2 to about 23% in session8. Control groups’ (OCG and YCG) percentage of stops did not
Fig. 4. Means of maximum speed for sessions 2 and 8 of OCG, OTG, YCG, and YTG.

Fig. 5. Mean number of stops in percent before crossing intersections for sessions 2 and 8 of CG, OTG, YCG, and YTG. Left: obstructed view. Right: unobstructed view.
Fig. 6. Total number of crashes during 288 sessions displayed for all four groupsindicating whether the crash occurred at an intersection and also indicatingwhether the driver was at-fault.
M. Dotzauer et al. / Accident Analysis and Prevention 74 (2014) 24–32 29
change significantly over time, F(1,18) < 1, ns. The percentage ofstops amounted to about 35% in both sessions.
Type of intersection also resulted in a significant main effect,F(1,36) = 64.48, p < .001, h2 = .668. The percentage of stops in OVwas greater than the percentage of stops in UV. The interactioneffect of intersection � age F(1,36) = 6.59, p = .01, h2 = .171, was alsosignificant. Post-hoc analyses showed a significant effect ofintersection on young, F(1,18) = 15.24, p = .001, h2 = .488, and onolder drivers, F(1,18) = 54.95, p < .001, h2 = .774. Young driversstopped at around 28% of the intersections with view obstructionand on 12% of the intersections without obstructed view. Onaverage, older drivers stopped 64% of the time at OV and 32% of thetime at UV before crossing the intersection.
The three-way interaction session � intersection � treatmentwas close to being significant, F(1,36) = 3.89, p = .06, h2 = .108.Post-hoc analyses showed that treatment groups' changes inpercentage of stops were significant on OV intersections,F(1,18) = 12.54, p = .003, h2 = .440, as well as on UV intersections,F(1,18) = 11.48, p = .004, h2 = .418. On both types of intersections thepercentage of stops decreased from session 2 to session 8. Resultsfor control groups did not reveal significant difference for OVintersections, F(1,18) = 2.53, ns, or UV intersections, F(1,18) = 1.81,ns. In more detail, OTG’s decrease in stops resulted in large effectsfor OV (M2 = 73%, M8 = 55%), F(1,9) = 7.51, p = .03, h2 = .484, as well asfor UV (M2 = 47%, M8 = 14%), F(1,9) = 9.18, p = .02, h2 = .535. Results ofOV intersections for YTG also yielded a large effect, F(1,9) = 5.24,p = .05, h2 = .396. The percentage decreased from 33% to 16%. On UVintersections, no significant changes were observed, F(1,9) = 3.02,ns, even though the percentage decreased from 10% to 4%.
3.2.4. Collisions and absolute minimum time-to-collision (TTC)Fig. 6 shows detailed information of the crashes which occurred
during a total of 288 sessions. With respect to crashes inintersections, crashes were classified as at-fault when driversfailed to yield to crossing traffic. Drivers were not at-fault whenother drivers failed to yield to them. Crashes that occurred at one ofthe 16 selected intersections were not included in the analysis ofthe absolute minimum (time-to-collision) TTC. The absoluteminimum TTC is lowest TTC value of all 16 intersection crossingsaveraged for each group per session. Scores per group per sessionare shown in Fig. 7.
Testing for differences in absolute minimum TTC, significantdifferences between young and older drivers, F(1,36) = 5.41,p = .027, h2 = .145, were found. Young drivers’ absolute minimumTTC (M = .38, SD = .41) was smaller than older drivers’ TTC (M = .7,SD = .56). Testing for within-subject effects, a significant interac-tion of session � age, F(1,36) = 6.86, p = .01, h2 = .177, was revealed.Older drivers’ TTC slightly decreased across sessions; whereas,young drivers’ TTC increased from session 2 to 8.
In addition, a significant main effect of Group, F(2,36) = 7.46,p = .002, h2 = .318, and a trend for the interaction of session � group,F(2,36) = 2.6, p = .09, h2 = .140, was found. Therefore, an analysis of
changes over time in the absolute minimum TTC from session 2 to8 was done for groups individually. Post-hoc analysis revealed nosignificant changes in TTC for OCG, OTG, and YCG from session 2 to8. For YTG, on the other hand, a large effect (F(1,9) = 7.51, p = .02,h2 = .484) was found for the increase in absolute minimum TTCfrom .15 (SD = .25) in session 2 to .76 (SD = .59) in session 8.
3.2.5. Critical intersection crossingsThe absolute minimum TTC only gave information about the
lowest TTC on one occasion, meaning one out of the 16 intersectioncrossings. As Fig. 7 shows, that one TTC is below 1 sec for all driversin sessions 2 and 8. One critical crossing can already result in acrash; frequently crossing intersections with low TTC heightensthat risk. Six of the 12 crashes that occurred at intersectionshappened at the selected intersections.
Young drivers’ percentage of critical crossing differed signifi-cantly from older drivers’ percentage, F(1,36) = 8.77, p = .006,h2 = .215 (see Fig. 8). On average, young drivers crossed 28% ofthe time with a TTC smaller than 1 sec, whereas older driverscrossed 14% of the time with a critical TTC value.
Testing for within-subject effects, a significant interaction ofsession � age, F(1,36) = 4.73, p = .037, h2 = .129, was found. Olderdrivers crossed less frequently with a critical TTC during session 2(12%) compared with session 8 (19%). Young drivers, on the other

Fig. 7. Mean of absolute minimum TTC for sessions 2 and 8 of OCG, OTG, YCG, and YTG.
30 M. Dotzauer et al. / Accident Analysis and Prevention 74 (2014) 24–32
hand, decreased the percentage of critical crossings across sessionsfrom 34% to 24%.
The three-way interaction of intersection � age � treatment,F(1,36) = 4.73, p = .037, h2 = .129, was also significant. Post-hocanalysis of intersections with obstructed view (OV) revealed asignificant main effect of group (F(2,36) = 5.08, p = .01, h2 = .241.OCG crossed about 13% of the intersections with a critical TTC insession 2 as well as session 8. OTG increased the percentage ofcritical crossing from 8% to 12%. Young drivers showed a decreasein the percentage of critical crossings. YCG decreased from 29% to23% and YTG from 34% to 29%.
Analysis of data of intersections without obstructed view (UV)revealed a significant interaction of session � group (F(2,36) = 4.71,p = .01, h2 = .227. The percentage of critical crossings increased from12% to 20% for OCG, but the change did not reach significance,F(1,9) = 1.65, ns. A large effect was found for OTG in intersectionswithout obstructed view, F(1,19) = 4.50, p = .07, h2 = .360. Thepercentage increased from about 15% to 30%. Young drivers ofthe control group showed a decrease in the percentage of criticalcrossings (M2 = 40%, M8 = 26%), but the change was not significant,F(1,9) = 1.7, ns. YTG also decreased from 31% to 18%, but the changewas also not significant, F(1,9) = 2.47, ns.
4. Discussion
This study was a follow-up on a previous study of us (Dotzaueret al., 2013), focusing on comparing intersection performance ofolder and young drivers and testing for longer-term effects onperformance due to ADAS use. Over a period of three weeks, theeffects of an advice system (indicating whether it was safe to crossan intersection on performance) were investigated. Up to thispoint, investigation of ADAS effects on driving performance andbehavior over longer time periods is lacking. A longer-term study,during which drivers returned for eight consecutive sessions
Fig. 8. Mean number of critical crossings in percent
within a period of three week, was administered, in order toacquaint drivers with the assistance system and examine changesin driving performance and behavior over time. In terms of theintersection assistant, we depicted eight intersections classified assafety critical because bushes placed along the road preventeddrivers from having a good view into the intersection and forcedthem to slow down, to look to the left and right before being able tomake a sound decision on crossing. Another eight intersections ofthe same make-up, but without view obstruction, were also addedfor further analysis.
An analysis of gaze revealed a significant treatment effect. Beingequipped with the ADAS and having the information projected bymeans of a head up display (HUD) resulted in greater percent roadcenter (PRC) during ADAS sessions compared to the non-ADASsessions. In contrast with Dukic and Broberg (2012) and Romoseret al. (2013), no age effect was found. Gaze behavior of drivers wasnot affected by age but rather by the type of treatment. Whenequipped with ADAS, drivers appear to retrieve relevant trafficinformation from the HUD and spent less time looking to the left orright in order to comprise a picture of the current traffic situation.Per se, this behavior poses a safety risk. Relying on informationpresented without confirming the accuracy of the informationmight result in detrimental consequences in the case of a systemfailure. Moreover, visual inspection of changes in PRC over timetentatively suggests a negative carry-over effect in attentionallocation in the older driver treatment group. When ADAS wasdeactivated in session 7, older drivers of the treatment group stillspent less time looking to the left or right than young drivers of thetreatment groups. It appears that older drivers adapted their gazebehavior and did not reverse the adaptation effect when drivingwithout the assistance.
The analysis of the driving performance parameters providesmore information on the effects of ADAS use on intersectionperformance. In line with our expectations, an age effect with
for sessions 2 and 8 of OCG, OTG, YCG, and YTG.
M. Dotzauer et al. / Accident Analysis and Prevention 74 (2014) 24–32 31
respect to driving performance parameters was revealed. Youngdrivers were quicker in crossing intersections, had a highermaximum speed in intersections, and a lower percentage of stopsbefore crossing an intersection. At the same time, young drivershad a smaller absolute minimum TTC value to crossing traffic andcrossed more frequently with a critical TTC (�1 sec) than olderdrivers. Not surprisingly, young drivers were not only involved inmore crashes; they also caused most of the crashes involved in(i.e., they failed to yield to the crossing traffic approaching fromthe right).
In addition, the previous study (Dotzauer et al., 2013) showedthat older drivers supported by ADAS shortened their intersectiontimes over time; whereas, performance of the control groupremained constant over sessions. In the present study, we foundresults to be in line with previous findings. Both treatment groupsshowed decreases in intersection time over time; whereas, controlgroups’ intersection times did not change significantly over time.The decrease in intersection time was greatest for older drivers ofthe treatment group. Intersection time is the sum of waiting andcrossing time. Therefore, a decrease in intersection time mainlyresults from shorter waiting times before crossing an intersection.Changes in the percentage of stops before crossing an intersectionconfirm this assumption. With ADAS, drivers decreased theirpercentage of stops; whereas, without ADAS, the percentage ofstops did not change over time.
The effects on maximum speed in intersections are not asstraightforward. With respect to older drivers, an increase inmaximum speed was observed for drivers of the treatment groupand a decrease for drivers of the control group. At least for olderdrivers, it seems that ADAS use affects maximum speed inintersections. Combined with the results of the intersection timeand the percentage in stops before crossing, changes in maximumspeed are a logical consequence. Young drivers, regardless of thetype of treatment, increased their maximum speed in intersec-tions. It appears that ADAS use did not affect maximum speed inintersection but rather the extent of familiarity of the environ-ment. Charlton and Starkey (2013) found that when driversbecome more familiar with the driving task and environment theytend to drive faster.
Whether changes observed affected driving safety might beanswered looking at time-to-collision variables. Young as well asolder drivers are at risk of being involved in a crash, but thecausations differ. Older drivers experience difficulties withselecting and processing relevant information (Brouwer andPonds, 1994; McGwin and Brown, 1999; De Waard et al., 2009;Musselwhite and Haddad, 2010) whereas, young drivers lackdriving experience that is necessary to assess traffic situationsaccurately (McKnight and McKnight, 2003; Curry et al., 2011). Itwas expected that drivers would accept gaps that are too small.Young drivers might choose small gaps because of a lack of skills.They just might not know yet how to accurately assess crossablegap sizes (Borowsky et al., 2009; Trick et al., 2009; De Craen et al.,2011; Vlakveld, 2011; Mueller and Trick, 2012) and might learnwith the help of the support system. Older drivers, on the otherhand, possess the skills, but because of limited attentional capacityand deficits in divided/selective attention and informationprocessing (Brouwer and Ponds, 1994; De Waard et al., 2009;Musselwhite and Haddad, 2010), they might miss informationnecessary to make a safe crossing maneuver. As a result of ADASuse, we expected to see an increase in safety over time. It wasobserved that young drivers increased their minimum TTC tocrossing traffic over time and older drivers decreased their TTCover time. Against our expectations, only young drivers of thetreatment group seemed to benefit from the gap advice. Fromsession 2 to session 8, they showed a strong increase in theminimum TTC. In session 8, their minimum TTC was even larger
than older drivers'. But it is also noteworthy to mention that theabsolute minimum TTC was below one second for all groups.
Even more interesting are the number of crashes and thefrequency of critical crossings. Treatment groups were involved inthree crashes within intersections and were at-fault on oneoccasion. Control groups, on the other hand, were involved in10 crashes and caused nine of those crashes. Six of those crasheswere committed by young drivers. Overall, young drivers of thecontrol group decreased their percentage of critical crossings andincreased their absolute minimum TTC over time, but as crashstatistics show, changes were not sufficient to prevent crashesfrom occurring. Young drivers of the treatment group, on the otherhand, decreased their percentage of critical crossings, increasedtheir absolute minimum TTC strongly, and caused fewer crashesthan young drivers of the control group. It appears thatinformation about gap sizes was beneficial for young drivers ofthe treatment group. It might have helped them to maneuver saferthrough intersections. Older drivers of the control group causedthree crashes in intersections. They showed a slight decrease in theabsolute minimum TTC but also a slight increase in the percentageof critical crossings in intersections without view obstruction. Incontrast, older drivers of the treatment group did not cause a crash.They decreased their TTC and increased their percentage of criticalcrossings. Even though not reflected in their crash statistics, itappears that older drivers of the treatment group adaptednegatively to the advice. Their crossing maneuvers became riskierover time and in the long-run might also lead to more crashes.
5. Conclusion
Overall, a positive effect on intersection time, especially forolder drivers of the treatment group, was found. Drivers of thetreatment group did not wait as long before accepting a gap. Itappears that they became less hesitant over time; a trend whichmight be beneficial for the overall road traffic safety. Being lesshesitant also means being less of a hindrance to other road users.The question is whether this is at the cost of safety. In the presentstudy, drivers of the treatment groups caused fewer crashes thandrivers of the control groups. Therefore, at a first glance, it appearsthat decisions made were not critical to road traffic safety. At asecond glance, it was observed that especially older driver adaptednegatively to the ADAS as reflected in the absolute minimum TTCand frequency of critical crossings. Young drivers might havebenefited from the gap advice; we saw a strong increase in theabsolute minimum TTC and also a low number of crashes in thetreatment group compared to the control group.
Regardless of age, provision of information affected gazebehavior negatively. Drivers tended to focus primarily on the roadcenter and neglected the left and right of the intersection. Suchadaptation to the ADAS needs to be prevented in order to increaseroad traffic safety. One approach might be to present informationwere the attention of the driver needs to be. For example, if a driverapproaching an intersection from the left fails to yield right-of-way, a driver should not also be warned, but the attention alsodrawn to the source of danger.
Results are not conclusive, but it is noteworthy to mention thatthis is one of the first attempts trying to investigate longer-termeffects of ADAS use on driving performance. In addition, olderdrivers selected for the study were fairly young older drivers.Participation was also solely voluntarily. So we might haveinvestigated a small sample of the older population without anyprominent impairments rather than the general population.Support provided might have not been needed and drivers ofthe control group might have performed at an optimal level. Withthe support, the driving task at hand might have become too easyand drivers started to compensate by engaging in riskier driving

32 M. Dotzauer et al. / Accident Analysis and Prevention 74 (2014) 24–32
maneuvers. In the future, a group of older drivers with impairmentsshould be included in order to test the effectiveness of theinformation provided. Results also suggest that young drivers mightbenefit from ADAS. Receiving information about safe gap sizes mightteach young drivers to make more sound crossing maneuvers. Buttaking into account different information processing speed andreaction time, thresholds should be set accordingly.
Acknowledgements
The research leading to these results has received funding fromthe European Community’s Seventh Framework Programme (FP7/2007-2013) under grant agreement no. 238833/ADAPTATIONproject, www.adaptation-itn.eu. We also like to thank YvonneAkkerman for her involvement in recruitment and data acquisitionand Rebecca Wiczorek for her advice on statistical analyses.
References
Beede, K.E., Kass, S.J., 2006. Engrossed in conversation: the impact of cell phoneson simulated driving performance. Accid. Anal. Prev. 38 (2), 415–421. doi:http://dx.doi.org/10.1016/j.aap.2005.10.015.
Borowsky, A., Oron-Gilad, T., Parmet, Y., 2009. Age and skill differences in classifyinghazardous traffic scenes. Transp. Res. Part F: Traffic Psychol. Behav. 12 (4),277–287. doi:http://dx.doi.org/10.1016/j.trf.2009.02.001.
Braitman, K.A., Kirley, B.B., McCartt, A.T., Chaudhary, N.K., 2008. Crashes of noviceteenage drivers: characteristics and contributing factors. J. Saf. Res. 39 (1),47–54. doi:http://dx.doi.org/10.1016/j.jsr.2007.12.002.
Brouwer, W.H., Ponds, R.W.H.M.,1994. Driving competence in older persons. Disabil.Rehabil. 16 (3), 149–161. doi:http://dx.doi.org/10.3109/09638289409166291.
Charlton, S.G., Starkey, N.J., 2013. Driving on familiar roads: automaticity andinattention blindness. Transp. Res. Part F: Traffic Psychol. Behav. 19 (0), 121–133.doi:http://dx.doi.org/10.1016/j.trf.2013.03.008.
Curry, A.E., Hafetz, J., Kallan, M.J., Winston, F.K., Durbin, D.R., 2011. Prevalence of teendriver errors leading to serious motor vehicle crashes. Accid. Anal. Prev. 43 (4),1285–1290. doi:http://dx.doi.org/10.1016/j.aap.2010.10.019.
Davidse, R., 2007. Assisting the Older Driver. Doctoral Dissertation. University ofGroningen. http://irs.ub.rug.nl/ppn/30535423X.
De Waard, D., Brookhuis, K.A., 1997. Behavioural adaptation of drivers to warningand tutoring messages: results from an on-the-road and simulator test. HeavyVehicle Sys. Int. J. Vehicle Des. 4 (2–4), 222–234. doi:http://dx.doi.org/10.1504/IJHVS.1997.054588.
De Waard, D., Van Der Hulst, M., Brookhuis, K.A., 1999. Elderly and young drivers’reaction to an in-car enforcement and tutoring system. Appl. Ergon. 30,147–157.doi:http://dx.doi.org/10.1016/S000-6870(98)2-73.
De Craen, S., Twisk, D.A.M., Hagenzieker, M.P., Elffers, H., Brookhuis, K.A., 2011. Doyoung novice drivers overestimate their driving skills more than experienceddrivers? Different methods lead to different conclusions. Accid. Anal. Prev. 43(5), 1660–1665. doi:http://dx.doi.org/10.1016/j.aap.2011.03.024.
Deery, H.A., 1999. Hazard and risk perception among young novice drivers. J. Saf.Res. 30 (4), 225–236. doi:http://dx.doi.org/10.1016/S002-4375(99)18-32.
Dotzauer, M., Caljouw, S.R., de Waard, D., Brouwer, W.H., 2013. Intersectionassistance: a safe solution for older drivers? Accid. Anal. Prev. 59, 522–528. doi:http://dx.doi.org/10.1016/j.aap.2013.07.024.
Dukic, T., Broberg, T., 2012. Older drivers’ visual search behaviour at intersections.Transp. Res. Part F: Traffic Psychol. Behav. 15 (4), 462–470. doi:http://dx.doi.org/10.1016/j.trf.2011.10.001.
EuroStat-European Commission/DG Employment and Social Affairs Unit/D. 4-UnitF.1, 2011. Demography Report 2010. Older, More Numerous and DiverseEuropeans. Publications Office of the European Union, Luxembourg doi:http://dx.doi.org/10.2767/79004.
Traffic Safety. In: Evans, L. (Ed.), Science Serving Society, Bloomfield Hills, MI.Jaccard, J., Blanton, H., Dodge, T., 2005. Peer influences on risk behavior: an analysis
of the effects of a close friend. Dev. Psychol. 41 (1), 135–147. doi:http://dx.doi.org/10.1037/0012-1649.41.1.135.
Kass, S.J., Cole, K.S., Stanny, C.J., 2007. Effects of distraction and experience onsituation awareness and simulated driving. Transp. Res. Part F: Traffic Psychol.Behav. 10 (4), 321–329. doi:http://dx.doi.org/10.1016/j.trf.2006.12.002.
Lausberg, H., Sloetjes, H., 2009. Coding gestural behavior with the NEUROGES-ELANsystem. Behav. Res. Methods Instrum. Comput. 41 (3), 841–849. doi:http://dx.doi.org/10.3758/BRM.41.3.591.
Lewis-Evans, B., 2010. Crash involvement during the different phases of the NewZealand graduated driver licensing system (GDLS). J. Saf. Res. 41 (4), 359–365.doi:http://dx.doi.org/10.1016/j.jsr.2010.03.006.
Mayhew, D.R., 2007. Driver education and graduated licensing in North America:past, present, and future. J. Saf. Res. 38 (2), 229–235. doi:http://dx.doi.org/10.1016/j.jsr.2007.03.001.
Mayhew, D.R., Simpson, H.M., Pak, A., 2003. Changes in collision rates among novicedrivers during the first months of driving. Accid. Anal. Prev. 35 (5), 683–691. doi:http://dx.doi.org/10.1016/S0001-4575(02)47-7.
Max Planck Institute for Psycholinguistics, (2013). The Language Archive. Nijmegen,The Netherlands, http://tla.mpi.nl/tools/tla-tools/elan/.
McGwin Jr., G., Brown, D.B., 1999. Characteristics of traffic crashes among young,middle-aged, and older drivers. Accid. Anal. Prev. 31 (3), 181–198. doi:http://dx.doi.org/10.1016/S0001-4575(98)61-X.
McKnight, A.J., McKnight, A.S., 2003. Young novice drivers: careless or clueless?Accid. Anal. Prev. 35 (6), 921–925. doi:http://dx.doi.org/10.1016/S0001-4575(02)100-8.
Michon, J.A.,1985. A critical view of driver behavior models: what do we know, whatshould we do? In: Evans, L., Schwing, R.C. (Eds.), Human Behavior and TrafficSafety. Plenum Press, New York, NY, pp. 485–520.
Musselwhite, C., Haddad, H., 2010. Exploring older drivers’ perceptions of driving.Eur. J. Ageing 7 (3), 181–188. doi:http://dx.doi.org/10.1007/s10433-010-0147-3.
Mueller, A.S., Trick, L.M., 2012. Driving in fog: the effects of driving experience andvisibility on speed compensation and hazard avoidance. Accid. Anal. Prev. 48(0), 472–479. doi:http://dx.doi.org/10.1016/j.aap.2012.03.003.
Pradhan, A.K., Pollatsek, A., Knodler, M., Fisher, D.L., 2009. Can younger drivers betrained to scan for information that will reduce their risk in roadway trafficscenarios that are hard to identify as hazardous? Ergonomics 52 (6), 657–673.doi:http://dx.doi.org/10.1080/00140130802550232.
Romoser, M.R.E., Pollatsek, A., Fisher, D.L., Williams, C.C., 2013. Comparing theglance patterns of older versus younger experienced drivers: scanning forhazards while approaching and entering the intersection. Transp. Res. Part F:Traffic Psychol. Behav. 16 (0), 104–116. doi:http://dx.doi.org/10.1016/j.trf.2012.08.004.
Simons-Morton, B., Chen, R., Abroms, L., Haynie, D.L., 2004. Latent growth curveanalyses of peer and parent influences on smoking progression among earlyadolescents. Health Psychol. 23 (6), 612–621. doi:http://dx.doi.org/10.1037/0278–6133.23.6.612.
Simons-Morton, B., Lerner, N., Singer, J., 2005. The observed effects of teenagepassengers on the risky driving behavior of teenage drivers. Accid. Anal. Prev. 37(6), 973–982. doi:http://dx.doi.org/10.1016/j.aap.2005.04.014.
Trick, L.M., Lochner, M., Toxopeus, R., 2009. Manipulating drive characteristics tostudy the effects of mental load on older and younger drivers. Proceedings of the5th International Driving Symposium on Human Factors in Driver Assessmentand Design, Big Sky MT. 363–369 .
Victor, T.W., Harbluk, J.L., Engström, J., 2005. Sensitivity of eye-movement measuresto in-vehicle task difficulty. Transp. Res. Part F: Traffic Psychol. Behav. 8 (2),167–190.
Vidotto, G., Bastianelli, A., Spoto, A., Sergeys, F., 2011. Enhancing hazard avoidance inteen-novice riders. Accid. Anal. Prev. 43 (1), 247–252. doi:http://dx.doi.org/10.1016/j.aap.2010.08.017.
Vlakveld, W., 2011. Hazard Anticipation of Young Novice Drivers: Assessingand Enhancing the Capabilities of Young Novice Drivers to Anticipate LatentHazards in Road and Traffic Situations. University of Groningen, StichtingWetenschappelijk Onderzoek Verkeersveiligheid SWOV, Leidschendam,Netherlands.