behavior study of permanent magnet synchronous machines
TRANSCRIPT
IEEE TRANSACTIONS ON INDUSTRIAL ELECTRONICS, VOL. 66, NO. 10, OCTOBER 2019 7539
Behavior Study of Permanent MagnetSynchronous Machines Basedon a New Normalized Model
Hao Ge , Member, IEEE, James Weisheng Jiang , Member, IEEE, Jin Ye , Senior Member, IEEE,and Ali Emadi , Fellow, IEEE
Abstract—Permanent magnet synchronous machines(PMSMs) are widely used in many applications. The per-formance of the PMSM is highly dependent on the motorparameters. Many research studies have been done to eval-uate the PMSM performances in terms of maximum torquecapability, power capability, and field-weakening capability.This paper proposes a new normalized PMSM model anduses two parameters, characteristic current and saliencyratio, to uniquely define the motor characteristic. Based onthis normalized model, the full map motor behaviors, in-cluding torque capability, power capability, torque/power–speed characteristics, and power factor behaviors, are stud-ied parametrically. A new unitless metric, i.e., copper lossfactor, is introduced to evaluate the copper loss variation ofPMSMs. The saturation effect on the motor behavior is stud-ied based on the 2004 Prius traction motor, which confirmsthat the field-weakening characteristic can be well predictedusing the linearized model. A new design flow for tractionPMSMs, which requires wide-speed operation, is proposedbased on the full map motor behavior study, and a proto-type machine is designed accordingly. The behavior studyand the effectiveness of the traction motor design flow arevalidated experimentally by the prototype.
Index Terms—Field weakening, modeling, permanentmagnet (PM) machines, power factor (PF).
I. INTRODUCTION
P ERMANENT magnet synchronous machines (PMSMs)are widely used in many applications [1], [2]. The per-
manent magnet (PM) in the rotor continually delivers magneticflux into the air gap, which enables PMSMs to achieve smallmass and volume, low rotor inertia, and high efficiency [3].
Manuscript received March 20, 2018; revised July 16, 2018 andSeptember 12, 2018; accepted October 1, 2018. Date of publicationNovember 20, 2018; date of current version May 31, 2019. (Correspond-ing author: Hao Ge.)
H. Ge and J. W. Jiang are with the McMaster Automotive ResourceCentre, McMaster University, Hamilton, ON L8S 4L8, Canada (e-mail:,[email protected]; [email protected]).
J. Ye is with the University of Georgia, Athens, GA 30602 USA (e-mail:,[email protected]).
A. Emadi is with the Department of Electrical and Computer Engi-neering, McMaster University, Hamilton, ON L8S 4L8, Canada (e-mail:,[email protected]).
Color versions of one or more of the figures in this paper are availableonline at http://ieeexplore.ieee.org.
Digital Object Identifier 10.1109/TIE.2018.2877117
The rotor topology of PMSMs can be designed in infinite ways.Different shapes/layers of flux barriers, different locations ofmagnets, and different PM materials can be employed to reg-ulate the PM flux linkage and the saliency ratio [4], [5]; thus,a different ratio of the PM torque and the reluctance torque isachieved [6].
Along with the growth of electric vehicle (EV) market, theneed of analysis and design of PMSM traction motors is grow-ing rapidly. The drive-cycle-dependent machine design requiresgood understanding and illustration of machine behaviors overthe entire operating range under different combinations of motorparameters.
Maximum torque is a very important metric of the motor per-formance. A normalized model is employed in [7] to study theoptimal PM flux linkage to maximize the motor torque capa-bility. In this model, the PM flux linkage is normalized to therated flux linkage corresponding to the maximum torque, whichis achieved on the maximum torque per ampere (MTPA) trajec-tory at the rated current level. However, the rated flux linkage isdependent on the PM flux linkage and current; thus, the valueof the normalized PM flux linkage is difficult to digest, and thismethod is difficult to apply in the motor design.
Field-weakening performance is another important aspect ofthe PMSM performance. Wide constant power speed range(CPSR) is greatly appreciated in traction application [8], [9].In [10]–[12], the field-weakening capability is evaluated usingthe same normalized PM flux linkage model, in which the speedrange is normalized to the base speed. The normalized torqueand power capabilities in a full speed range are derived un-der different combinations of the normalized PM flux linkageand the saliency ratio. However, the motor is usually highlysaturated at a rated operating point, and the saturation level issignificantly reduced in the field-weakening range. Hence, themaximum-torque-dependent method cannot be applied in theevaluation of the field-weakening behavior when the motor ishighly saturated.
In an EV traction application, most of the times, the tractionmotors are partially loaded. In order to optimize the system ef-ficiency, the understanding of the motor behavior under partialloading is as important as peak loading performance. The nor-malization of the PM flux linkage is dependent on the operatingcurrent levels. At different current levels, the base values of the
0278-0046 © 2018 IEEE. Personal use is permitted, but republication/redistribution requires IEEE permission.See http://www.ieee.org/publications standards/publications/rights/index.html for more information.

7540 IEEE TRANSACTIONS ON INDUSTRIAL ELECTRONICS, VOL. 66, NO. 10, OCTOBER 2019
Fig. 1. Operation area on the d- and q-axis current plane.
flux linkage are different. It becomes inconvenient to evaluatethe full map behavior using the normalized PM flux linkagemethod.
The design of rare-earth-magnet-less/free PMSMs also re-quires comprehensive understanding of the motor behavior vari-ation with parameter changes. Substantial efforts have beenmade to develop rare-earth-free or rare-earth-less PMSMs [3].For example, a ferrite magnet PMSM is introduced into thesecond generation of Chevrolet Volt powertrain [13]. Reducingrare-earth material or using alternative material usually meansa significant change in the PM flux linkage and/or the saliencyratio. The reluctance nature of PMSMs must be fully exploredand taken advantage of. However, to the best of authors’ knowl-edge, most of the published works are based on case studies[14]–[16] instead of comprehensive analysis.
The well-known “three cases of interior permanent magnet(IPM) machine capability curves” [17] employ the characteris-tic current as the criterion to determine the motor power–speedcurves. Following this idea, in this paper, a comprehensive anal-ysis of normalized motor behaviors versus parameter variationis conducted based on the normalized characteristic current andthe saliency ratio. Therefore, the issues caused by the changeof the saturation level from the rated operating point to thefield weakening area are avoided. In addition, the characteristiccurrent can be easily scaled to different current levels to eval-uate the motor behavior under partial loading. The normalizedtorque/power–speed characteristic and the power factor (PF) inthe entire operating area are investigated parametrically versusa wide range of normalized characteristic current and saliencyratio. To describe the full map copper loss behavior, a new unit-less metric, i.e., copper loss factor, is introduced, and its fullmap behavior is also evaluated parametrically.
The rest of this paper is organized as follows. Section IIexplains the new normalized PMSM model based on the nor-malized characteristic current and the saliency ratio. Section IIIderives the motor torque/power–speed characteristics parametri-cally versus different parameter combinations. The peak torqueand power capabilities are also studied over a wide range ofparameters. In Section IV, the full map motor behavior is eval-uated using two unitless factors: PF and copper loss factor. InSection V, the saturation effect on the normalized motor be-havior is studied based on the Prius 2004 motor. In Section VI,
the motor design flow considering full range operation is intro-duced based on the motor behavior study. A prototype motoris designed, fabricated, and tested. Section VII summarizes thispaper.
II. LINEAR MODEL OF THE PMSM
The commonly known PMSM model under a synchronousrotating dq frame is represented as follows:
ud = Rsid + dψd/dt− ψqω
uq = Rsiq + dψq/dt+ ψdω (1)
ψd = Ldid + ψf
ψq = Lq iq (2)
Te = 3/2 · P (ψdiq − ψq id) (3)
where ud , uq , id , iq , and ψd , ψq are the d- and q-axis voltage,current, and flux linkage, respectively, Ld and Lq are the d- andq-axis inductances, respectively, ψf is the PM flux linkage, Rs
is the winding resistance, Te is the electromagnetic torque, ω isthe electrical speed, and P is the number of pole pairs.
A. Optimal Current Trajectory
From the above PMSM model, when the winding resistanceRs is neglected, the motor characteristics are determined bythree parameters: Ld , Lq , and ψf . To obtain the torque–speedcharacteristic, the constraints of maximum current ilim and volt-age ulim are enforced, as follows:
i2d + i2q ≤ i2lim (4)
u2d + u2
q ≤ u2lim . (5)
Under a steady state, the voltage constraint is reformulatedas (6) by substituting (1) into (5). At high speed, the resistancevoltage drop is negligible compared to back EMF and armaturereaction; hence, (6) is simplified to (7). Therefore, the operatingarea on the dq-axis current plane is derived and shown in Fig. 1
(−Lq iqω +Rsid)2 + (ψf ω + Ldidω +Rsiq )2 ≤ u2lim (6)
(Lq iq )2 + (ψf + Ldid)2 ≤ u2lim
ω2 . (7)
In Fig. 1, 0A is the MTPA trajectory, and BC is the maximumtorque per flux (MTPF) trajectory. At point A, the maximumtorque is achieved, and the corresponding d- and q-axis currentsare solved as follows:
Idr =−Ich +
√I2ch + 8(1 − ρ)2I2
lim
4(1 − ρ), Iqr =
√I2lim − I2
dr
(8)where Ich is the characteristic current, Ich = ψf /Ld , and ρ isthe saliency ratio, ρ = Lq/Ld .
B. Normalized Model of the PMSM
In this paper, a new normalized model is derived to generalizethe analysis of the PMSM behavior. Same as [10]–[12], the flux

GE et al.: BEHAVIOR STUDY OF PERMANENT MAGNET SYNCHRONOUS MACHINES BASED ON A NEW NORMALIZED MODEL 7541
TABLE IBASE VALUE DEFINITIONS OF THE PMSM
linkage at the rated operation point, i.e., point A in Fig. 1, isdefined as the base value of the flux linkage; hence, the ratedspeed is always 1. The base values of other variables are derivedaccordingly and are listed in Table I.
The normalized voltage equation, the flux linkage equation,and the torque equation are derived as (9)–(11), respectively:
u∗d = dψ∗d/dt
∗ − ψ∗qω
∗ +R∗si
∗d
u∗q = dψ∗q /dt
∗ + ψ∗dω
∗ +R∗si
∗q (9)
ψ∗d = L∗
di∗d + ψ∗
f
ψ∗q = L∗
q i∗q (10)
T ∗e = ψ∗
di∗q − ψ∗
q i∗d = ψ∗
f i∗q + (L∗
d − L∗q )i
∗di
∗q (11)
where the superscript “∗” indicates the normalized variables.In Fig. 1, the normalized values of d- and q-axis rated currents
at point A are derived as (12). At this point, the flux linkage is1, as shown by (13)
I∗dr =−I∗ch +
√I∗ch
2 + 8(1 − ρ)2
4(1 − ρ), I∗qr =
√1 − I∗dr
2
(12)
(ρL∗dI
∗qr )
2 + (L∗dI
∗ch + L∗
dI∗dr )
2 = 12 (13)
where I∗ch = Ich/Ibase = ψ∗f /L
∗d and ρ = L∗
q /L∗d .
Substituting (12) into (13), it is obvious that L∗d , I∗ch , and
ρ are dependent, and only two of them are required to fullydescribe the motor characteristics. In this paper, I∗ch and ρ areselected as the independent parameters because they are easy tocomprehend and apply in the motor design. Their ranges can bedefined easily regardless of the actual motor speed, torque, andpower. Hence, the motor model is generalized, and the behav-ior study can be performed parametrically. The correspondingnormalized d-axis inductance is derived as
L∗d =
1√(I∗ch + I∗dr )
2 + ρ2(1 − I∗dr2). (14)
Under the steady state, the torque–speed characteristic isderived by calculating the speed at each point on the currenttrajectory A–B–C in Fig. 1. At each point, the normalized speed
Fig. 2. Maximum torque and power capability in different speed ranges.
is calculated as follows:
ω∗ =ω
ωbase=
u/ψ
Ubase/ψbase=u/Ubase
ψ/ψbase=u∗
ψ∗ . (15)
For example, when I∗ch = 0.87 and ρ = 3, the normalizedtorque and power in the speed range of 0–10 is calculated andshown in Fig. 2.
In the range of AB in Fig. 2, the maximum voltage and currentare applied. Therefore, the normalized power also correspondsto the PF. When the speed is less than 1 (ω∗ < 1), the PFis equivalent to that at the knee point (ω∗ = 1). Hence, thenormalized maximum torque also corresponds to the PF.
III. TORQUE–SPEED PROFILE OF THE PMSM
A. Torque/Power Characteristic Plane
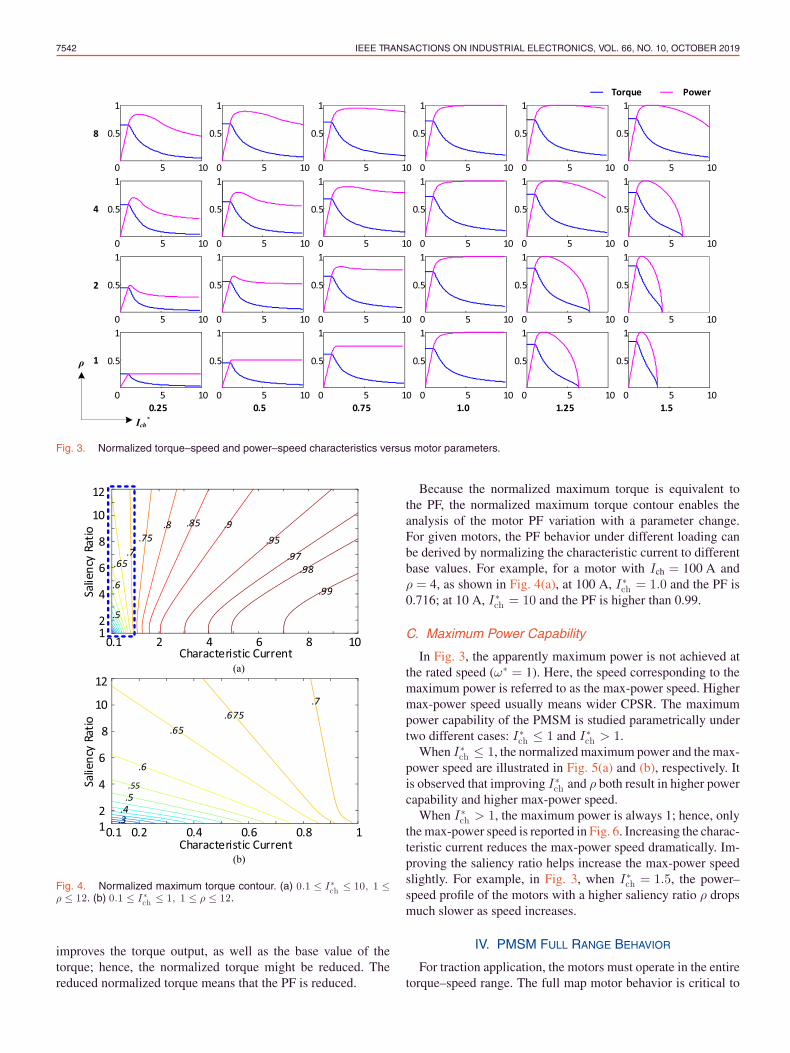
To investigate the dependence of the torque/power–speedcharacteristic on motor parameters, a comprehensive perfor-mance plane of the PMSM is employed here, which was firstintroduced in [10]. For normal saliency machines, i.e., ρ� 1, thetorque/power–speed characteristic plane is illustrated in Fig. 3,where the x-axis represents the normalized characteristic currentand the y-axis represents the saliency ratio. The blue and ma-genta curves represent torque–speed and power–speed profiles,respectively.
All of the normalized power–speed profiles in Fig. 3 fallinto “three cases of the IPM machine capability curve” [17].The normalized characteristic current is the exclusive criterionof whether infinite speed can be achieved. Nevertheless, thesaliency ratio also influences the speed range significantly. It isinteresting to find that the normalized power converges to I∗ch atinfinite speed when I∗ch ≤ 1 (see the Appendix)
limω ∗→∞P
∗ = limψ ∗→0
ψ∗r
ψ∗ (ψ∗di
∗q − ψ∗
q i∗d) = I∗ch . (16)
B. Maximum Torque Capability
The normalized maximum torque over a wide range of I∗ch(0.1–10) and ρ (1–12) is studied and illustrated in Fig. 4(a), andthe normalized maximum torque in the range of I∗ch (0.1–1) ishighlighted in Fig. 4(b). When I∗ch ≤ 1, both I∗ch and ρ have apositive influence on the normalized maximum torque. WhenI∗ch > 1, ρ has a negative influence on the normalized maximumtorque. However, lower normalized torque does not necessarilymean lower absolute torque. For a motor with given PM fluxlinkage and d-axis inductance, increasing the saliency ratio ρ
7542 IEEE TRANSACTIONS ON INDUSTRIAL ELECTRONICS, VOL. 66, NO. 10, OCTOBER 2019
Fig. 3. Normalized torque–speed and power–speed characteristics versus motor parameters.
Fig. 4. Normalized maximum torque contour. (a) 0.1 ≤ I∗ch ≤ 10, 1 ≤ρ ≤ 12. (b) 0.1 ≤ I∗ch ≤ 1, 1 ≤ ρ ≤ 12.
improves the torque output, as well as the base value of thetorque; hence, the normalized torque might be reduced. Thereduced normalized torque means that the PF is reduced.
Because the normalized maximum torque is equivalent tothe PF, the normalized maximum torque contour enables theanalysis of the motor PF variation with a parameter change.For given motors, the PF behavior under different loading canbe derived by normalizing the characteristic current to differentbase values. For example, for a motor with Ich = 100 A andρ = 4, as shown in Fig. 4(a), at 100 A, I∗ch = 1.0 and the PF is0.716; at 10 A, I∗ch = 10 and the PF is higher than 0.99.
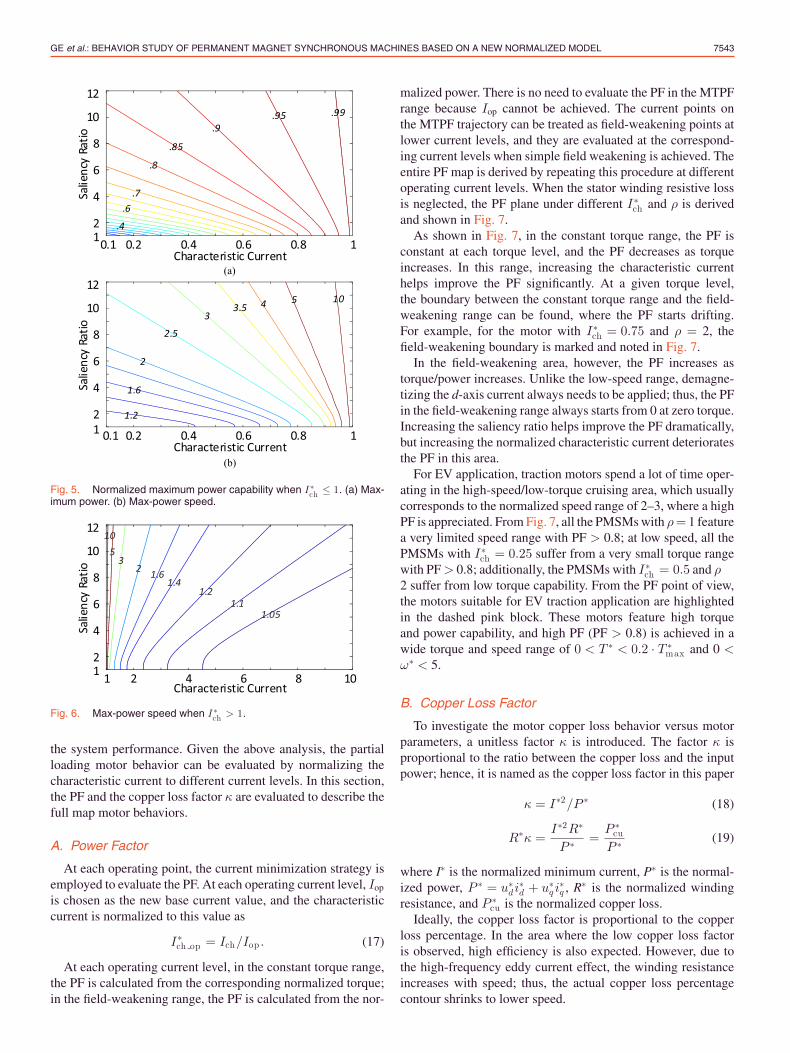
C. Maximum Power Capability
In Fig. 3, the apparently maximum power is not achieved atthe rated speed (ω∗ = 1). Here, the speed corresponding to themaximum power is referred to as the max-power speed. Highermax-power speed usually means wider CPSR. The maximumpower capability of the PMSM is studied parametrically undertwo different cases: I∗ch ≤ 1 and I∗ch > 1.
When I∗ch ≤ 1, the normalized maximum power and the max-power speed are illustrated in Fig. 5(a) and (b), respectively. Itis observed that improving I∗ch and ρ both result in higher powercapability and higher max-power speed.
When I∗ch > 1, the maximum power is always 1; hence, onlythe max-power speed is reported in Fig. 6. Increasing the charac-teristic current reduces the max-power speed dramatically. Im-proving the saliency ratio helps increase the max-power speedslightly. For example, in Fig. 3, when I∗ch = 1.5, the power–speed profile of the motors with a higher saliency ratio ρ dropsmuch slower as speed increases.
IV. PMSM FULL RANGE BEHAVIOR
For traction application, the motors must operate in the entiretorque–speed range. The full map motor behavior is critical to
GE et al.: BEHAVIOR STUDY OF PERMANENT MAGNET SYNCHRONOUS MACHINES BASED ON A NEW NORMALIZED MODEL 7543
Fig. 5. Normalized maximum power capability when I∗ch ≤ 1. (a) Max-imum power. (b) Max-power speed.
Fig. 6. Max-power speed when I∗ch > 1.
the system performance. Given the above analysis, the partialloading motor behavior can be evaluated by normalizing thecharacteristic current to different current levels. In this section,the PF and the copper loss factor κ are evaluated to describe thefull map motor behaviors.
A. Power Factor
At each operating point, the current minimization strategy isemployed to evaluate the PF. At each operating current level, Iop
is chosen as the new base current value, and the characteristiccurrent is normalized to this value as
I∗ch op = Ich/Iop . (17)
At each operating current level, in the constant torque range,the PF is calculated from the corresponding normalized torque;in the field-weakening range, the PF is calculated from the nor-
malized power. There is no need to evaluate the PF in the MTPFrange because Iop cannot be achieved. The current points onthe MTPF trajectory can be treated as field-weakening points atlower current levels, and they are evaluated at the correspond-ing current levels when simple field weakening is achieved. Theentire PF map is derived by repeating this procedure at differentoperating current levels. When the stator winding resistive lossis neglected, the PF plane under different I∗ch and ρ is derivedand shown in Fig. 7.
As shown in Fig. 7, in the constant torque range, the PF isconstant at each torque level, and the PF decreases as torqueincreases. In this range, increasing the characteristic currenthelps improve the PF significantly. At a given torque level,the boundary between the constant torque range and the field-weakening range can be found, where the PF starts drifting.For example, for the motor with I∗ch = 0.75 and ρ = 2, thefield-weakening boundary is marked and noted in Fig. 7.
In the field-weakening area, however, the PF increases astorque/power increases. Unlike the low-speed range, demagne-tizing the d-axis current always needs to be applied; thus, the PFin the field-weakening range always starts from 0 at zero torque.Increasing the saliency ratio helps improve the PF dramatically,but increasing the normalized characteristic current deterioratesthe PF in this area.
For EV application, traction motors spend a lot of time oper-ating in the high-speed/low-torque cruising area, which usuallycorresponds to the normalized speed range of 2–3, where a highPF is appreciated. From Fig. 7, all the PMSMs with ρ= 1 featurea very limited speed range with PF > 0.8; at low speed, all thePMSMs with I∗ch = 0.25 suffer from a very small torque rangewith PF> 0.8; additionally, the PMSMs with I∗ch = 0.5 and ρ�2 suffer from low torque capability. From the PF point of view,the motors suitable for EV traction application are highlightedin the dashed pink block. These motors feature high torqueand power capability, and high PF (PF > 0.8) is achieved in awide torque and speed range of 0 < T ∗ < 0.2 · T ∗
max and 0 <ω∗ < 5.
B. Copper Loss Factor
To investigate the motor copper loss behavior versus motorparameters, a unitless factor κ is introduced. The factor κ isproportional to the ratio between the copper loss and the inputpower; hence, it is named as the copper loss factor in this paper
κ = I∗2/P ∗ (18)
R∗κ =I∗2R∗
P ∗ =P ∗
cu
P ∗ (19)
where I∗ is the normalized minimum current, P∗ is the normal-ized power, P ∗ = u∗di
∗d + u∗q i
∗q , R∗ is the normalized winding
resistance, and P ∗cu is the normalized copper loss.
Ideally, the copper loss factor is proportional to the copperloss percentage. In the area where the low copper loss factoris observed, high efficiency is also expected. However, due tothe high-frequency eddy current effect, the winding resistanceincreases with speed; thus, the actual copper loss percentagecontour shrinks to lower speed.

7544 IEEE TRANSACTIONS ON INDUSTRIAL ELECTRONICS, VOL. 66, NO. 10, OCTOBER 2019
Fig. 7. PF versus motor parameters.
Fig. 8. Copper loss factor versus motor parameters.
For motors with different parameters, the full map copperloss factor κ is computed and illustrated in Fig. 8. It is observedthat I∗ch and ρ have different impacts on κ. For a given copperloss factor κ, improving ρ stretches the contour to wider speedrange; improving I∗ch helps enhance the torque range, but thespeed range shrinks to lower speed.
According to the copper loss factor contour plane in Fig. 8, forEV traction application, the favorable parameter combinationof I∗ch and ρ are also highlighted, where low copper loss factorcontour κ = 0.25 covers the speed range of 0 < ω∗ < 5.
Traditionally, it is believed that higher saliency ratio is alwaysbetter for traction application [18]–[20]. However, this may notnecessarily be true. For example, when I∗ch = 0.75, if ρ in-creases from 4 to 8, the maximum torque with PF = 0.9 reducesby about 50%. The copper loss factor contour κ = 0.25 alsoshrinks to lower torque range, which results in higher copperloss. In Figs. 7 and 8, for EV traction applications, the motorswith I∗ch = 0.5, I∗ch = 0.75, and ρ = 4 are favored compared toall the other listed motors due to their wide range of high PFand low copper loss factor. The other motors highlighted in the

GE et al.: BEHAVIOR STUDY OF PERMANENT MAGNET SYNCHRONOUS MACHINES BASED ON A NEW NORMALIZED MODEL 7545
Fig. 9. 2004 Prius motor flux linkage characteristic.
Fig. 10. Characteristic current of the 2004 Prius motor at differentq-axis currents.
pink blocks in both Figs. 7 and 8 are also favorable in termsof performance. However, when I∗ch ≥ 1.0, the steady-stateshort-circuit current is higher than the maximum current ca-pability. Also, the saliency ratio ρ = 8 is difficult to achievepractically even with a multilayer flux barrier design.
V. SATURATION EFFECT ON THE MOTOR BEHAVIOR
In Sections II–IV, the relationship between the motor be-havior and parameters is established based on the linear motormodel. In practice, traction motors are usually highly saturatedin a high torque range. In this section, the nonlinearity effectson normalized motor behaviors are evaluated based on the 2004Toyota Prius motor. The detailed configuration of this motor isreported in [21] and [22]. The d- and q-axis flux linkages aresimulated and displayed in Fig. 9. It is observed that both d- andq-axis flux linkages are nonlinear functions of current. At a highcurrent level, the q-axis is significantly affected by saturation.
In saturated PMSMs, the q-axis current has a strong impacton the characteristic current, and the characteristic current canbe defined in multiple ways [23]. In this paper, for a given q-axiscurrent, the linearized characteristic current is defined as
�
I ch = Id(ψd = 0). (20)
At different q-axis currents, the characteristic current of the2004 Toyota Prius motor is illustrated in Fig. 10.
In order to represent the nonlinear motor behavior usinglinear parameters, a linearized motor model is studied here.
The linearized characteristic current�
I ch , linearized induc-
tances�
Ld,q , and PM flux linkage�
ψf are defined as (21)–(23),
Fig. 11. Trajectories of the 2004 Prius motor within current constraints:MTPA, constant torque, and characteristic current trajectory.
respectively:
�
I ch = Id(ψd = 0, Iq = 0) (21)�
Ld,q = Ld,q (ψd = 0, Iq = 0) (22)�
ψf =�
Ld�
I ch . (23)
The constant torque trajectories, characteristic current tra-jectory, and MTPA trajectory are illustrated in Fig. 11. TheMTPA trajectory using the linearized inductance and the PMflux linkage is also derived and reported for comparison. For thelinear motor model, the maximum reluctance torque is alwaysachieved when d- and q-axis currents are equivalent; thus, theMTPA angle is always less than 135°. However, when the mo-tor is highly saturated, increasing the q-axis current increasesthe saturation level, but increasing the negative d-axis currenthelps reduce saturation, and thus, increasing the d-axis currentis more effective for reluctance torque production. Hence, theMTPA trajectory tilts toward the negative d-axis, and the MTPAangle can be well above 135° at a high current level. This reducesthe base flux linkage and increases the base speed.
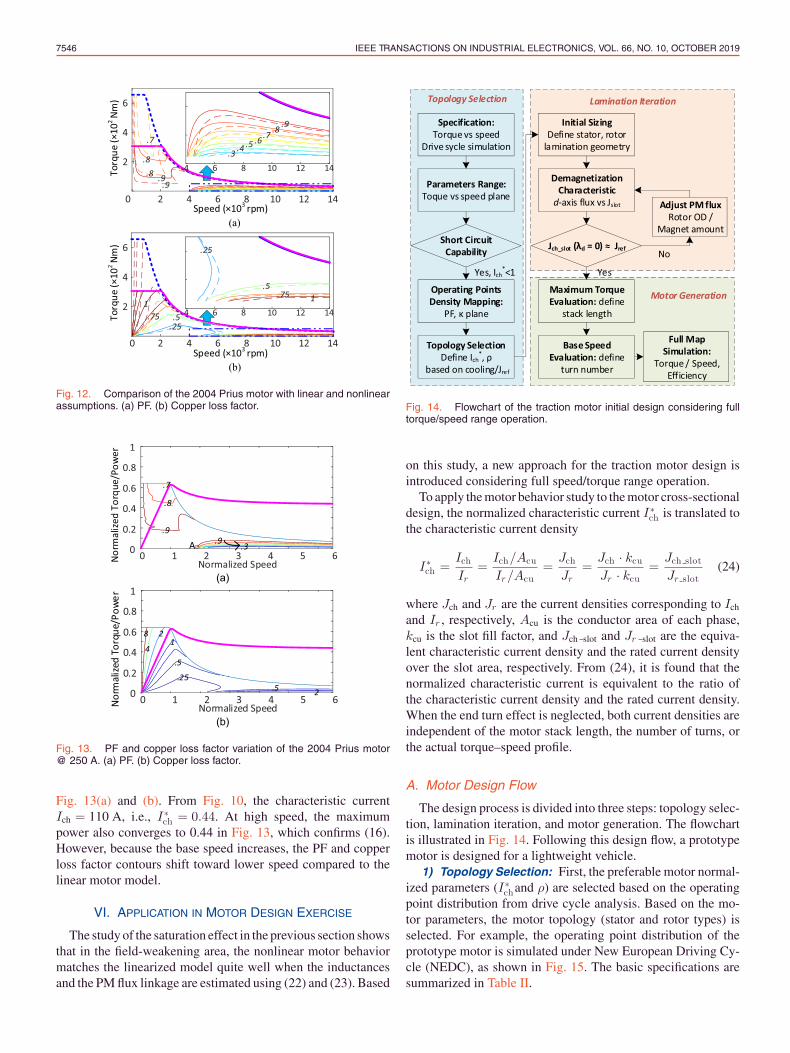
The current minimization method for nonlinear motors [24]is employed to study the full map performance. Direct compar-isons of the torque–speed characteristic, the PF, and the copperloss factor κ between the nonlinear motor and the linearizedmodel are performed in the speed range of up to 14 000 r/min.The comparisons of the PF and the copper loss factor are il-lustrated in Fig. 12(a) and (b), respectively. In each figure, thenonlinear motor is illustrated by solid lines, and the linearizedmodel is represented by dashed lines. The behaviors in the field-weakening range are highlighted in each figure.
From Fig. 12, it is observed that the torque capability isreduced by more than 50% due to saturation. In the constanttorque range, the PF and the copper loss factor κ of the nonlinearmotor differ from the linear model significantly. However, in thefield-weakening range, the nonlinear motor behavior convergesto the linearized motor model.
The normalized torque/power–speed profiles along withthe PF and copper loss factor contours are given in
7546 IEEE TRANSACTIONS ON INDUSTRIAL ELECTRONICS, VOL. 66, NO. 10, OCTOBER 2019
Fig. 12. Comparison of the 2004 Prius motor with linear and nonlinearassumptions. (a) PF. (b) Copper loss factor.
Fig. 13. PF and copper loss factor variation of the 2004 Prius motor@ 250 A. (a) PF. (b) Copper loss factor.
Fig. 13(a) and (b). From Fig. 10, the characteristic currentIch = 110 A, i.e., I∗ch = 0.44. At high speed, the maximumpower also converges to 0.44 in Fig. 13, which confirms (16).However, because the base speed increases, the PF and copperloss factor contours shift toward lower speed compared to thelinear motor model.
VI. APPLICATION IN MOTOR DESIGN EXERCISE
The study of the saturation effect in the previous section showsthat in the field-weakening area, the nonlinear motor behaviormatches the linearized model quite well when the inductancesand the PM flux linkage are estimated using (22) and (23). Based
Fig. 14. Flowchart of the traction motor initial design considering fulltorque/speed range operation.
on this study, a new approach for the traction motor design isintroduced considering full speed/torque range operation.
To apply the motor behavior study to the motor cross-sectionaldesign, the normalized characteristic current I∗ch is translated tothe characteristic current density
I∗ch =IchIr
=Ich/Acu
Ir/Acu=Jch
Jr=Jch · kcu
Jr · kcu=Jch slot
Jr slot(24)
where Jch and Jr are the current densities corresponding to Ich
and Ir , respectively, Acu is the conductor area of each phase,kcu is the slot fill factor, and Jch slot and Jr slot are the equiva-lent characteristic current density and the rated current densityover the slot area, respectively. From (24), it is found that thenormalized characteristic current is equivalent to the ratio ofthe characteristic current density and the rated current density.When the end turn effect is neglected, both current densities areindependent of the motor stack length, the number of turns, orthe actual torque–speed profile.
A. Motor Design Flow
The design process is divided into three steps: topology selec-tion, lamination iteration, and motor generation. The flowchartis illustrated in Fig. 14. Following this design flow, a prototypemotor is designed for a lightweight vehicle.
1) Topology Selection: First, the preferable motor normal-ized parameters (I∗chand ρ) are selected based on the operatingpoint distribution from drive cycle analysis. Based on the mo-tor parameters, the motor topology (stator and rotor types) isselected. For example, the operating point distribution of theprototype motor is simulated under New European Driving Cy-cle (NEDC), as shown in Fig. 15. The basic specifications aresummarized in Table II.

GE et al.: BEHAVIOR STUDY OF PERMANENT MAGNET SYNCHRONOUS MACHINES BASED ON A NEW NORMALIZED MODEL 7547
Fig. 15. Drive cycle (NEDC) simulation of a lightweight vehicle.
TABLE IIBASIC SPECS OF THE LIGHTWEIGHT VEHICLE TRACTION MOTOR
Fig. 16. Prototype FSCW PMSM for a lightweight vehicle.
In this case, constant power is desired in the normalized speedrange of 1–2.33. In addition, to ensure the steady-state shortcircuit current lower than the rated current, the characteristiccurrent must be less than 1. According to Fig. 7, in order toachieve high PF on/above the road load, it is desirable to haveI∗chin the range of 0.75–1. For the desired characteristic current I∗ch ,the reference value for the characteristic current density, whichis referred to as Jref , is derived as
Jref = I∗ch · Jr slot (25)
where the rated slot current density Jr slot is estimated fromgiven cooling technology and slot fill factor kcu.
The rated slot current density Jr slot is estimated as 4.5 A/mm2
(assuming copper fill factor 35%) due to the cooling technol-ogy constraint. According to (25), the reference characteristiccurrent density Jref is 3.4–4.5 A/mm2. To obtain such a lowcharacteristic current density, a very high d-axis inductance hasto be achieved. Because of its excessive leakage inductancecomponent, fractional slot concentrated winding (FSCW) typeis selected to enhance the d-axis inductance. A V-shaped mag-net rotor with a thin yoke bridge is selected to enforce a shortflux path, which helps improve the saliency ratio and reduce thesubharmonic core loss. This feature is highlighted in Fig. 16.
2) Lamination Iteration: With the selected motor topology,the initial motor lamination is designed and then morphed it-eratively until the desired normalized characteristic current isachieved. Therefore, the field-weakening characteristic can bewell predicted using the linearized normalized characteristiccurrent and the saliency ratio.
Fig. 17. Flux linkage characteristic of the prototype PMSM.
The iteration is performed on the lamination level such thatthe computational effort can be significantly reduced. The de-magnetization characteristic with respect to the current densityis derived by applying the pure d-axis current density and as-suming that the turn number of each winding layer is 1. Thecharacteristic current density Jch slot is obtained by enforcingthe flux linkage to be 0. If Jch slot > Jref, it means PM flux link-age is too high or the stator slot area is too small; ifJch slot < Jref,it means PM flux linkage is too low or the stator slot area is toobig. The rotor outer diameter, stator yoke thickness, and/or theamount of magnet are adjusted accordingly. The demagnetizingcharacteristic is evaluated iteratively until Jch slot is within therange of Jref . The prototype machine is shown in Fig. 16.
3) Motor Generation: With the given lamination design, inorder to achieve the actual torque and speed specification, thestack lengthLeff and the number of turns N have to be configured.The saturation impact, which significantly influences the peaktorque performance, has to be taken into consideration.
The maximum torque per millimeter Tmax_mm at rated slotcurrent density Jr slot is simulated by applying Jr slot with dif-ferent current angles. The corresponding flux linkage per turnper millimeter ψmaxT_mm is derived simultaneously. By im-posing the maximum torque constraint, the stack length Leff isderived as (26). By enforcing the dc-link voltage constraint atrated speed, the number of turns N is calculated by (27):
Leff = Tmax/Tmax mm (26)
N = (Vdc/√
3)/(2πfrLeffψmaxT mm) (27)
where Tmax is the maximum torque and fr is the electricalfrequency corresponding to the rated speed.
B. Experimental Validation
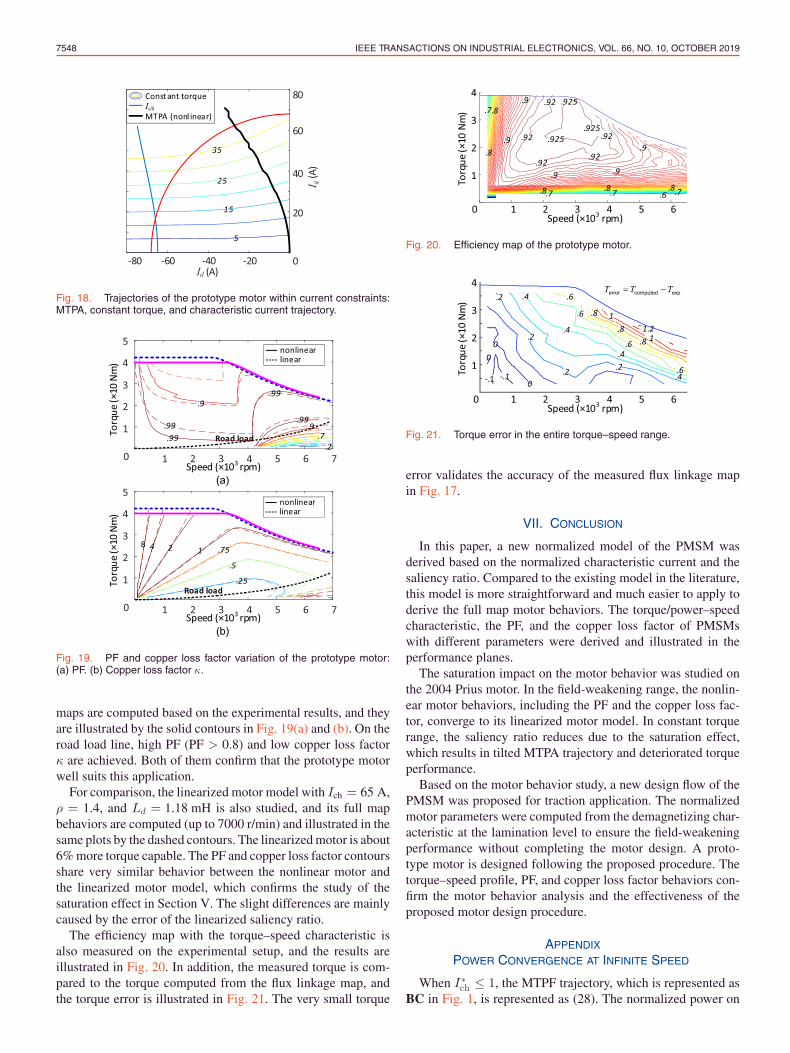
The prototype motor is fabricated and tested experimentally.The details of the setup and measurement methods to character-ize the motor are explained in [25]. The measured d- and q-axisflux linkages are illustrated in Fig. 17. The constant torquetrajectories, MTPA trajectories, and the characteristic currenttrajectory are illustrated in Fig. 18. The linearized no-load char-acteristic current is 65 A, corresponding to I∗ch = 0.92. Thelinearized d-axis inductance Ld = 1.18 mH, and the saliencyratio ρ = 1.4.
The full map motor behaviors of the prototype motor aremeasured up to 6500 r/min. The PF and the copper loss factor κ
7548 IEEE TRANSACTIONS ON INDUSTRIAL ELECTRONICS, VOL. 66, NO. 10, OCTOBER 2019
Fig. 18. Trajectories of the prototype motor within current constraints:MTPA, constant torque, and characteristic current trajectory.
Fig. 19. PF and copper loss factor variation of the prototype motor:(a) PF. (b) Copper loss factor κ.
maps are computed based on the experimental results, and theyare illustrated by the solid contours in Fig. 19(a) and (b). On theroad load line, high PF (PF > 0.8) and low copper loss factorκ are achieved. Both of them confirm that the prototype motorwell suits this application.
For comparison, the linearized motor model with Ich = 65 A,ρ = 1.4, and Ld = 1.18 mH is also studied, and its full mapbehaviors are computed (up to 7000 r/min) and illustrated in thesame plots by the dashed contours. The linearized motor is about6% more torque capable. The PF and copper loss factor contoursshare very similar behavior between the nonlinear motor andthe linearized motor model, which confirms the study of thesaturation effect in Section V. The slight differences are mainlycaused by the error of the linearized saliency ratio.
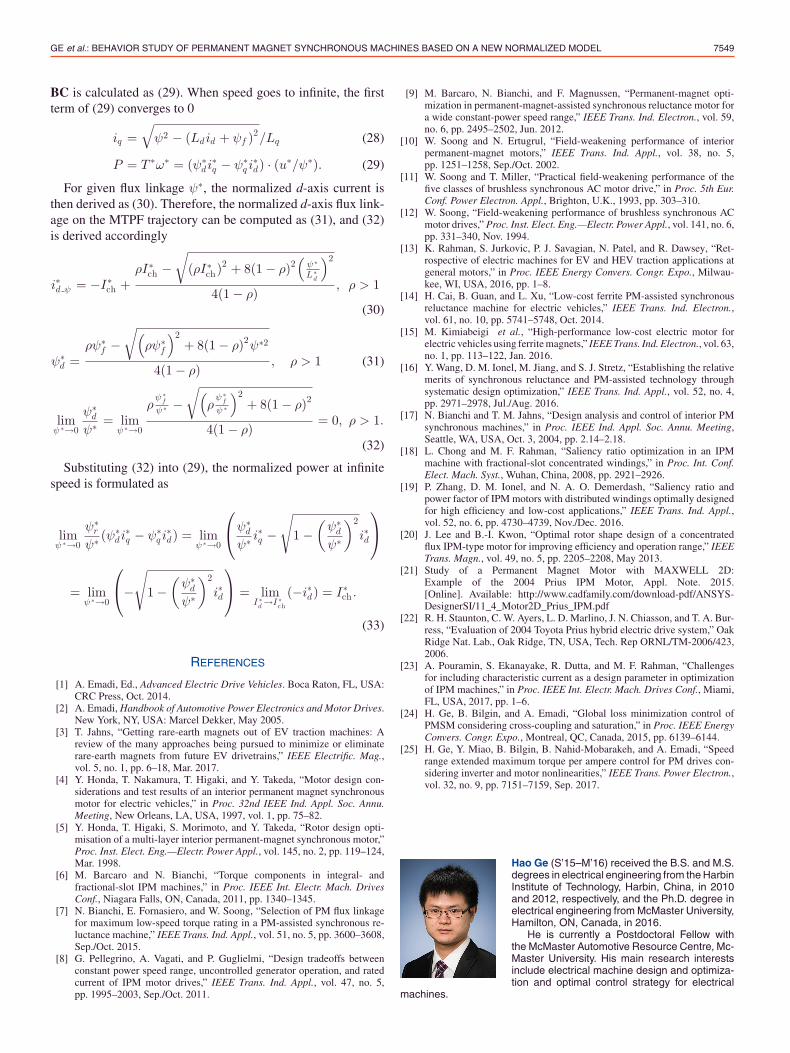
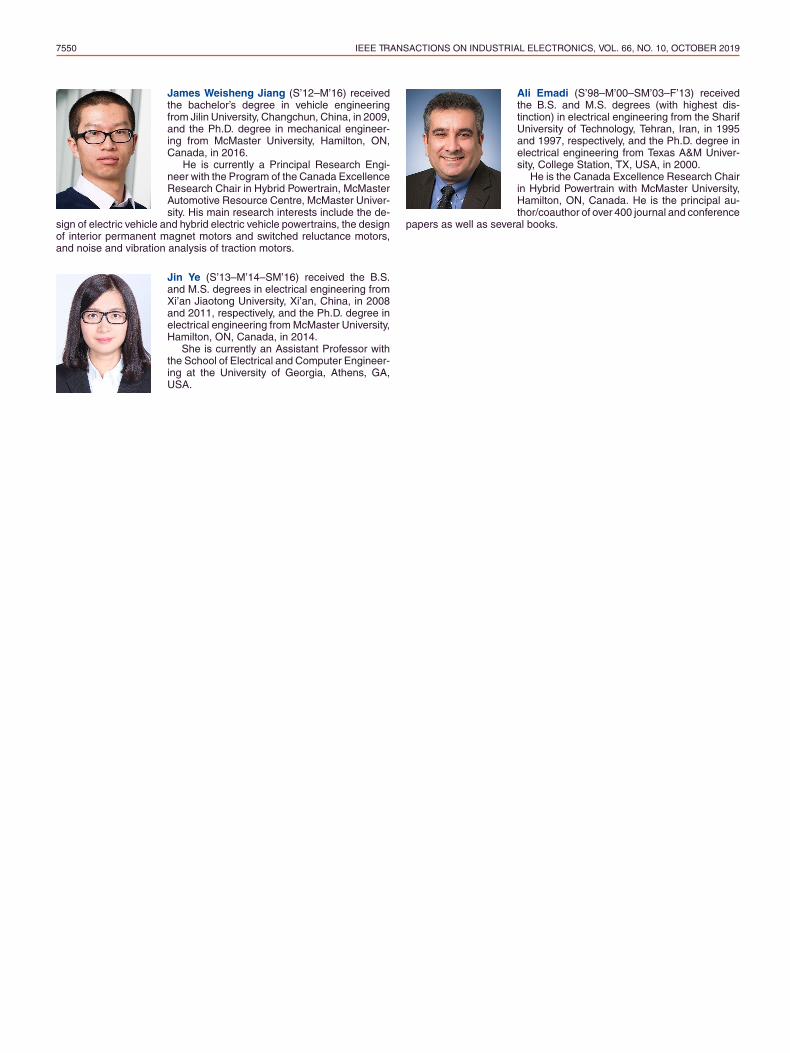
The efficiency map with the torque–speed characteristic isalso measured on the experimental setup, and the results areillustrated in Fig. 20. In addition, the measured torque is com-pared to the torque computed from the flux linkage map, andthe torque error is illustrated in Fig. 21. The very small torque
Fig. 20. Efficiency map of the prototype motor.
Fig. 21. Torque error in the entire torque–speed range.
error validates the accuracy of the measured flux linkage mapin Fig. 17.
VII. CONCLUSION
In this paper, a new normalized model of the PMSM wasderived based on the normalized characteristic current and thesaliency ratio. Compared to the existing model in the literature,this model is more straightforward and much easier to apply toderive the full map motor behaviors. The torque/power–speedcharacteristic, the PF, and the copper loss factor of PMSMswith different parameters were derived and illustrated in theperformance planes.
The saturation impact on the motor behavior was studied onthe 2004 Prius motor. In the field-weakening range, the nonlin-ear motor behaviors, including the PF and the copper loss fac-tor, converge to its linearized motor model. In constant torquerange, the saliency ratio reduces due to the saturation effect,which results in tilted MTPA trajectory and deteriorated torqueperformance.
Based on the motor behavior study, a new design flow of thePMSM was proposed for traction application. The normalizedmotor parameters were computed from the demagnetizing char-acteristic at the lamination level to ensure the field-weakeningperformance without completing the motor design. A proto-type motor is designed following the proposed procedure. Thetorque–speed profile, PF, and copper loss factor behaviors con-firm the motor behavior analysis and the effectiveness of theproposed motor design procedure.
APPENDIX
POWER CONVERGENCE AT INFINITE SPEED
When I∗ch ≤ 1, the MTPF trajectory, which is represented asBC in Fig. 1, is represented as (28). The normalized power on
GE et al.: BEHAVIOR STUDY OF PERMANENT MAGNET SYNCHRONOUS MACHINES BASED ON A NEW NORMALIZED MODEL 7549
BC is calculated as (29). When speed goes to infinite, the firstterm of (29) converges to 0
iq =√ψ2 − (Ldid + ψf )
2/Lq (28)
P = T ∗ω∗ = (ψ∗di
∗q − ψ∗
q i∗d) · (u∗/ψ∗). (29)
For given flux linkage ψ∗, the normalized d-axis current isthen derived as (30). Therefore, the normalized d-axis flux link-age on the MTPF trajectory can be computed as (31), and (32)is derived accordingly
i∗d ψ = −I∗ch +ρI∗ch −
√(ρI∗ch)2 + 8(1 − ρ)2
(ψ ∗L∗d
)2
4(1 − ρ), ρ > 1
(30)
ψ∗d =
ρψ∗f −
√(ρψ∗
f
)2+ 8(1 − ρ)2ψ∗2
4(1 − ρ), ρ > 1 (31)
limψ ∗→0
ψ∗d
ψ∗ = limψ ∗→0
ρψ ∗f
ψ ∗ −√(
ρψ ∗f
ψ ∗
)2+ 8(1 − ρ)2
4(1 − ρ)= 0, ρ > 1.
(32)
Substituting (32) into (29), the normalized power at infinitespeed is formulated as
limψ ∗→0
ψ∗r
ψ∗ (ψ∗di
∗q − ψ∗
q i∗d) = lim
ψ ∗→0
⎛⎝ψ∗
d
ψ∗ i∗q −
√1 −
(ψ∗d
ψ∗
)2
i∗d
⎞⎠
= limψ ∗→0
⎛⎝−
√1 −
(ψ∗d
ψ∗
)2
i∗d
⎞⎠ = lim
I ∗d→I ∗ch
(−i∗d) = I∗ch .
(33)
REFERENCES
[1] A. Emadi, Ed., Advanced Electric Drive Vehicles. Boca Raton, FL, USA:CRC Press, Oct. 2014.
[2] A. Emadi, Handbook of Automotive Power Electronics and Motor Drives.New York, NY, USA: Marcel Dekker, May 2005.
[3] T. Jahns, “Getting rare-earth magnets out of EV traction machines: Areview of the many approaches being pursued to minimize or eliminaterare-earth magnets from future EV drivetrains,” IEEE Electrific. Mag.,vol. 5, no. 1, pp. 6–18, Mar. 2017.
[4] Y. Honda, T. Nakamura, T. Higaki, and Y. Takeda, “Motor design con-siderations and test results of an interior permanent magnet synchronousmotor for electric vehicles,” in Proc. 32nd IEEE Ind. Appl. Soc. Annu.Meeting, New Orleans, LA, USA, 1997, vol. 1, pp. 75–82.
[5] Y. Honda, T. Higaki, S. Morimoto, and Y. Takeda, “Rotor design opti-misation of a multi-layer interior permanent-magnet synchronous motor,”Proc. Inst. Elect. Eng.—Electr. Power Appl., vol. 145, no. 2, pp. 119–124,Mar. 1998.
[6] M. Barcaro and N. Bianchi, “Torque components in integral- andfractional-slot IPM machines,” in Proc. IEEE Int. Electr. Mach. DrivesConf., Niagara Falls, ON, Canada, 2011, pp. 1340–1345.
[7] N. Bianchi, E. Fornasiero, and W. Soong, “Selection of PM flux linkagefor maximum low-speed torque rating in a PM-assisted synchronous re-luctance machine,” IEEE Trans. Ind. Appl., vol. 51, no. 5, pp. 3600–3608,Sep./Oct. 2015.
[8] G. Pellegrino, A. Vagati, and P. Guglielmi, “Design tradeoffs betweenconstant power speed range, uncontrolled generator operation, and ratedcurrent of IPM motor drives,” IEEE Trans. Ind. Appl., vol. 47, no. 5,pp. 1995–2003, Sep./Oct. 2011.
[9] M. Barcaro, N. Bianchi, and F. Magnussen, “Permanent-magnet opti-mization in permanent-magnet-assisted synchronous reluctance motor fora wide constant-power speed range,” IEEE Trans. Ind. Electron., vol. 59,no. 6, pp. 2495–2502, Jun. 2012.
[10] W. Soong and N. Ertugrul, “Field-weakening performance of interiorpermanent-magnet motors,” IEEE Trans. Ind. Appl., vol. 38, no. 5,pp. 1251–1258, Sep./Oct. 2002.
[11] W. Soong and T. Miller, “Practical field-weakening performance of thefive classes of brushless synchronous AC motor drive,” in Proc. 5th Eur.Conf. Power Electron. Appl., Brighton, U.K., 1993, pp. 303–310.
[12] W. Soong, “Field-weakening performance of brushless synchronous ACmotor drives,” Proc. Inst. Elect. Eng.—Electr. Power Appl., vol. 141, no. 6,pp. 331–340, Nov. 1994.
[13] K. Rahman, S. Jurkovic, P. J. Savagian, N. Patel, and R. Dawsey, “Ret-rospective of electric machines for EV and HEV traction applications atgeneral motors,” in Proc. IEEE Energy Convers. Congr. Expo., Milwau-kee, WI, USA, 2016, pp. 1–8.
[14] H. Cai, B. Guan, and L. Xu, “Low-cost ferrite PM-assisted synchronousreluctance machine for electric vehicles,” IEEE Trans. Ind. Electron.,vol. 61, no. 10, pp. 5741–5748, Oct. 2014.
[15] M. Kimiabeigi et al., “High-performance low-cost electric motor forelectric vehicles using ferrite magnets,” IEEE Trans. Ind. Electron., vol. 63,no. 1, pp. 113–122, Jan. 2016.
[16] Y. Wang, D. M. Ionel, M. Jiang, and S. J. Stretz, “Establishing the relativemerits of synchronous reluctance and PM-assisted technology throughsystematic design optimization,” IEEE Trans. Ind. Appl., vol. 52, no. 4,pp. 2971–2978, Jul./Aug. 2016.
[17] N. Bianchi and T. M. Jahns, “Design analysis and control of interior PMsynchronous machines,” in Proc. IEEE Ind. Appl. Soc. Annu. Meeting,Seattle, WA, USA, Oct. 3, 2004, pp. 2.14–2.18.
[18] L. Chong and M. F. Rahman, “Saliency ratio optimization in an IPMmachine with fractional-slot concentrated windings,” in Proc. Int. Conf.Elect. Mach. Syst., Wuhan, China, 2008, pp. 2921–2926.
[19] P. Zhang, D. M. Ionel, and N. A. O. Demerdash, “Saliency ratio andpower factor of IPM motors with distributed windings optimally designedfor high efficiency and low-cost applications,” IEEE Trans. Ind. Appl.,vol. 52, no. 6, pp. 4730–4739, Nov./Dec. 2016.
[20] J. Lee and B.-I. Kwon, “Optimal rotor shape design of a concentratedflux IPM-type motor for improving efficiency and operation range,” IEEETrans. Magn., vol. 49, no. 5, pp. 2205–2208, May 2013.
[21] Study of a Permanent Magnet Motor with MAXWELL 2D:Example of the 2004 Prius IPM Motor, Appl. Note. 2015.[Online]. Available: http://www.cadfamily.com/download-pdf/ANSYS-DesignerSI/11_4_Motor2D_Prius_IPM.pdf
[22] R. H. Staunton, C. W. Ayers, L. D. Marlino, J. N. Chiasson, and T. A. Bur-ress, “Evaluation of 2004 Toyota Prius hybrid electric drive system,” OakRidge Nat. Lab., Oak Ridge, TN, USA, Tech. Rep ORNL/TM-2006/423,2006.
[23] A. Pouramin, S. Ekanayake, R. Dutta, and M. F. Rahman, “Challengesfor including characteristic current as a design parameter in optimizationof IPM machines,” in Proc. IEEE Int. Electr. Mach. Drives Conf., Miami,FL, USA, 2017, pp. 1–6.
[24] H. Ge, B. Bilgin, and A. Emadi, “Global loss minimization control ofPMSM considering cross-coupling and saturation,” in Proc. IEEE EnergyConvers. Congr. Expo., Montreal, QC, Canada, 2015, pp. 6139–6144.
[25] H. Ge, Y. Miao, B. Bilgin, B. Nahid-Mobarakeh, and A. Emadi, “Speedrange extended maximum torque per ampere control for PM drives con-sidering inverter and motor nonlinearities,” IEEE Trans. Power Electron.,vol. 32, no. 9, pp. 7151–7159, Sep. 2017.
Hao Ge (S’15–M’16) received the B.S. and M.S.degrees in electrical engineering from the HarbinInstitute of Technology, Harbin, China, in 2010and 2012, respectively, and the Ph.D. degree inelectrical engineering from McMaster University,Hamilton, ON, Canada, in 2016.
He is currently a Postdoctoral Fellow withthe McMaster Automotive Resource Centre, Mc-Master University. His main research interestsinclude electrical machine design and optimiza-tion and optimal control strategy for electrical
machines.
7550 IEEE TRANSACTIONS ON INDUSTRIAL ELECTRONICS, VOL. 66, NO. 10, OCTOBER 2019
James Weisheng Jiang (S’12–M’16) receivedthe bachelor’s degree in vehicle engineeringfrom Jilin University, Changchun, China, in 2009,and the Ph.D. degree in mechanical engineer-ing from McMaster University, Hamilton, ON,Canada, in 2016.
He is currently a Principal Research Engi-neer with the Program of the Canada ExcellenceResearch Chair in Hybrid Powertrain, McMasterAutomotive Resource Centre, McMaster Univer-sity. His main research interests include the de-
sign of electric vehicle and hybrid electric vehicle powertrains, the designof interior permanent magnet motors and switched reluctance motors,and noise and vibration analysis of traction motors.
Jin Ye (S’13–M’14–SM’16) received the B.S.and M.S. degrees in electrical engineering fromXi’an Jiaotong University, Xi’an, China, in 2008and 2011, respectively, and the Ph.D. degree inelectrical engineering from McMaster University,Hamilton, ON, Canada, in 2014.
She is currently an Assistant Professor withthe School of Electrical and Computer Engineer-ing at the University of Georgia, Athens, GA,USA.
Ali Emadi (S’98–M’00–SM’03–F’13) receivedthe B.S. and M.S. degrees (with highest dis-tinction) in electrical engineering from the SharifUniversity of Technology, Tehran, Iran, in 1995and 1997, respectively, and the Ph.D. degree inelectrical engineering from Texas A&M Univer-sity, College Station, TX, USA, in 2000.
He is the Canada Excellence Research Chairin Hybrid Powertrain with McMaster University,Hamilton, ON, Canada. He is the principal au-thor/coauthor of over 400 journal and conference
papers as well as several books.