behavior of bromotrifluoropropene i n te technical … summary this technical note presents the...
TRANSCRIPT

Behavior of Bromotrifluoropropene and Pentafluoroethane When Subjected to a Simulated Aerosol Can Explosion John W. Reinhardt May 2004 DOT/FAA/AR-TN04/4 This document is available to the public through the National Technical Information Service (NTIS), Springfield, Virginia 22161.
U.S. Department of Transportation Federal Aviation Administration
ote
tech
nica
l not
e te
chni
caot
e te
chni
cal n
ote
tech
nica

NOTICE
This document is disseminated under the sponsorship of the U.S. Department of Transportation in the interest of information exchange. The United States Government assumes no liability for the contents or use thereof. The United States Government does not endorse products or manufacturers. Trade or manufacturer's names appear herein solely because they are considered essential to the objective of this report. This document does not constitute FAA certification policy. Consult your local FAA aircraft certification office as to its use. This report is available at the Federal Aviation Administration William J. Hughes Technical Center’s Full-Text Technical Reports page: actlibrary.tc.faa.gov in Adobe Acrobat portable document format (PDF).

Technical Report Documentation Page
1. Report No.
DOT/FAA/AR-TN04/4
2. Government Accession No.
3. Recipient's Catalog No.
4. Title and Subtitle
BEHAVIOR OF BROMOTRIFLUOROPROPENE AND PENTAFLUOROETHANE
5. Report Date
May 2004 WHEN SUBJECTED TO A SIMULATED AEROSOL CAN EXPLOSION 6. Performing Organization Code
7. Author(s)
John W. Reinhardt
8. Performing Organization Report No.
9. Performing Organization Name and Address Federal Aviation Administration William J. Hughes Technical Center Airport and Aircraft Safety
10. Work Unit No. (TRAIS)
Research and Development Division Fire Safety Research and Development Branch Atlantic City International Airport, NJ 08405
11. Contract or Grant No.
12. Sponsoring Agency Name and Address U.S. Department of Transportation Federal Aviation Administration
13. Type of Report and Period Covered
Technical Note Office of Aviation Research Washington, DC 20591
14. Sponsoring Agency Code
ANM-100 15. Supplementary Notes
16. Abstract
This technical note presents the data from simulated aerosol can explosion tests while using bromotrifluoropropene (BTP) and pentafluoroethane (HFC-125) as fire suppression agents for aircraft cargo compartments. These explosion tests were conducted at below inert volumetric concentrations to determine the agent’s explosion attenuation performance. The tests were conducted inside a 402-ft3 pressure vessel. The collected data showed that BTP and HFC-125, at these below inert concentrations, enhanced the explosion (acted as fuel) instead of mitigating it.
17. Key Words
Simulated aerosol can explosion; MPS; Bromotrifluoropropene, BTP; Pentafluoroethane, HFC-125; Propane explosion
18. Distribution Statement
This document is available to the public through the National Technical Information Service (NTIS), Springfield, Virginia 22161.
19. Security Classif. (of this report)
Unclassified
20. Security Classif. (of this page)
Unclassified
21. No. of Pages
26
22. Price
Form DOT F1700.7 (8-72) Reproduction of completed page authorized

TABLE OF CONTENTS Page EXECUTIVE SUMMARY v INTRODUCTION 1
Agent 1 Environmental 1 Toxicology 1 Technical Approach 1
Pressure Vessel 1 Instrumentation 2 Test Procedure 2
RESULTS 3
CONCLUDING REMARKS 5
LIST OF FIGURES
Figure Page 1 Plan View of Pressure Vessel Setup 6
2 Comparison of Agent Explosion Suppression Capability at Below Inert Concentrations 6
3 Gas and Temperature Traces for Test 2 7
4 The BTP Pressure Pulse at 2.5% (Test 2) 7
5 Gas and Temperature Traces for Test 3 8
6 No Agent Pressure Pulse (Test 3) 8
7 Gas and Temperature Traces for Test 4 9
8 No Agent Pressure Pulse (Test 4) 9
9 Gas and Temperature Traces for Test 5 10
10 The BTP Pressure Pulse at 3.0% (Test 5) 10
iii

11 Gas and Temperature Traces for Test 6 11
12 The BTP Pressure Pulse at 4.0% (Test 6) 11
13 Gas and Temperature Traces for Test 9 12
14 The BTP Pressure Pulse at 5.0% (Test 9) 12
15 Gas and Temperature Traces for Test 13 13
16 The BTP Pressure Pulse at 6.0% (Test 13) 13
17 Gas and Temperature Traces for Test 16 14
18 The Halon 1301 Pressure Pulse at 2.5% (Test 16) 14
19 Gas and Temperature Traces for Test 17 15
20 The HFC-125 Pressure Pulse at 8.9% (Test 17) 15
21 Gas and Temperature Traces for Test 19 16
22 The HFC-125 Pressure Pulse at 11.0% (Test 19) 16
23 Gas and Temperature Traces for Test 23 17
24 The HFC-125 Pressure Pulse at 6.2% (Test 23) 17
25 Gas and Temperature Traces for Test 25 18
26 The HFC-125 (Po=15 psig) Pressure Pulse at 11.3% (Test 25) 18
LIST OF TABLES Table Page 1 Summary of Test Results 19
iv iv

EXECUTIVE SUMMARY This technical note presents the results of simulated aerosol can explosion tests conducted to evaluate the explosion suppression performance of bromotrifluoropropene (BTP) and pentafluoroethane (HFC-125). BTP was selected by members of the International Aircraft Systems Fire Protection Working Group as a possible candidate to replace Halon 1301 as the suppression agent used in an aircraft cargo compartment. Since HFC-125 is an acceptable halon replacement agent for some applications, the explosion suppression performance of this agent was also investigated. The simulated aerosol can explosion test is one of four fire test scenarios required by the Federal Aviation Administration (FAA’s) Minimum Performance Standard for Aircraft Cargo Compartment Halon Replacement Fire Suppression Systems (DOT/FAA/AR-TN03/6). Before running this particular minimum performance standard (MPS) test with BTP in the required 2000 ft3 aircraft cargo compartment, a preliminary test series was conducted at the FAA William J. Hughes Technical Center Pressure Fire Modeling Facility. The objective of this test series was to determine if BTP had any unusual behavior before proceeding to conduct the required MPS tests inside the FAA’s 2000 ft3 aircraft cargo compartment. Baseline tests were conducted to establish a comparison benchmark. These baseline tests were conducted by letting the simulated aerosol can explode without the presence of a suppression agent. The results showed overpressures between 23 and 25 psig. A second benchmark test was conducted using 2.5% volumetric concentration Halon 1301, which is below its inerting concentration. At this volumetric concentration, a subdued explosion event occurred, resulting in an overpressure of 4 psig. The reported inert concentration of BTP, when evaluated against propane, is 8.5% volumetric concentration. It was decided by the testing team that the initial agent volumetric concentrations should be below this reported number to determine if BTP would be as effective as Halon 1301 in this particular test scenario. Testing at the FAA Technical Center has shown that Halon 1301 is capable of suppressing this particular propane explosion with as little as 3.1% volumetric concentration (The published inert concentration value for Halon 1301 is 6.7% at stoichiometric fuel (propane) to air ratio). The initial volumetric concentration selected for the first explosion test was 2.5% BTP. This first explosion test resulted in an estimated overpressure of 49.3 psig (pressure transducer was saturated). After replacing the pressure transducer, other tests were conducted that included 3%, 4%, 5%, and 6% volumetric concentrations. Their associated overpressures were 63, 63, 100, 93 psig, respectively. Thus, BTP enhanced the explosion event (as much as 4 times greater pressures than the unsuppressed event and 23 times greater than the Halon 1301 benchmark concentration). After experiencing the BTP explosion events, HFC-125 was evaluated to determine if it would behave in the same fashion. HFC-125 also enhanced the explosion event when it was below its inert concentration (15.6%). The agent produced explosion overpressures of 53 psig, at 9% and 11%, respectively. When the pressure vessel was pressurized with air to 15 psig and sustained a volumetric concentration of 11.3% HFC-125, a reduced explosion event of 6 psig occurred. Prior to activating the simulated aerosol can, the arc-producing electrodes were energized to
v v

determine if an explosive mixture was present at this particular vessel pressure and HFC-125 concentration. The results were negative. This type of test was repeated at an internal vessel pressure of 20 psig and a volumetric concentration of 6.3%; once again, the results were negative (no event). Another test was conducted with 13.5% of HFC-125 at ambient pressure, but there was no explosion event after the simulated aerosol can was activated. Thus, HFC-125 prevented the blast at 13.5%, even though its reported inert concentration for a propane explosion is 15.6% (at a stoichiometric fuel-to-air ratio). In summary, at concentrations below the inerting level, both BTP and HFC-125 enhanced explosions by creating higher overpressures than measured in air alone. In contrast, Halon 1301, the currently used aircraft cargo compartment fire suppression agent, mitigated the explosion, even though it was below its inert concentration. It reduced the overpressure of the event. Since aircraft cargo compartment suppression agents may be present at subinerting design concentrations, because of stratification or larger than normal leakage, it is important that replacement agents be selected that do not increase the overpressure caused by an exploding aerosol can at concentrations below the inerting value. Aircraft cargo compartment fire suppression agents may be present at subinerting concentrations due to leakage of agent from the bottle or delivery tubing, or stratification, or larger than normal air leakage in the compartment. Therefore, it is important that replacement agents be selected that do not increase the overpressure caused by an exploding aerosol can at concentrations below the inerting value. Unless a means can be found to avoid the problem of subinerting concentrations of extinguishing agent, BTP and HFC-125 would not be suitable candidates for halon replacement extinguishing agents in the cargo compartment.
vi vi

INTRODUCTION
The objective of this project was to determine the explosion suppression performance of bromotrifluoropropene (BTP) and pentafluoroethane (HFC-125) at concentrations below the inerting level when challenged against the simulated aerosol can explosion test. AGENT. The agents used during the tests were BTP and HFC-125. According to the BTP Material Safety Data Sheet (MSDS), this chemically acting agent is a colorless volatile liquid that has a slight ether-like odor. It has a boiling point of 93°F, a liquid density of 99.9 lb/ft3 (1.60 kg/l) at 77°F, and a molecular weight of 174.95. The HFC-125 MSDS describes this agent as clear, colorless, having a boiling point of -55°F, a liquid density of 77.9 lbm/ft3 (1.248 g/cc) at 68°F, and a molecular weight of 120. ENVIRONMENTAL. At the time of this testing, bromotrifluoropropene (CH2CBrCF3) was not on the Environmental Protection Agency (EPA), Clean Air Act, Significant New Alternatives Policy (SNAP) program, or other international governmental-approving program list as a Halon 1301 replacement. However, laboratory work has been conducted to determine the primary environmental characteristics of this new agent. For example, it was determine that the agent has an ozone depletion potential (ODP) of 0.0028, no global warming potential (GWP) reported yet, and has an atmospheric lifetime (ALT) of 0.008 year, or 2.9 days. As a reference, the values for Halon 1301 (CF3Br) are 16 ODP, 5800 GWP, and 100 years ALT. On the other hand, HFC-125 (CF3CHF2) is on the EPA SNAP list. It has an ODP of 0, a GWP of 3800, and an ALT of 32.6 years. TOXICOLOGY. The only toxicology data reported in the BTP MSDS was its lethal concentration or LC50. The LC50 is determined by exposing (inhalation) rats to the agent for 4 hours. The LC50 reported, for a 4-hour exposure, was estimated to be within the range of 5.1% to 9.7% volume. The fire suppression concentration of BTP is also within that range. For HFC-125, the MSDS indicates the LC50 as 709,000 ppm for 4 hours. The lowest observed adverse effect level (LOAEL) reported was 100,000 ppm, and the no observed adverse effect level (NOAEL) was 50,000 ppm. TECHNICAL APPROACH. PRESSURE VESSEL. The tests were conducted with an exploding aerosol can simulator that was developed by the Federal Aviation Administration (FAA) to simulate the worst-case effects of an exploding aerosol can in a repeatable manner. The simulator was housed in a pressure vessel located in the Pressure Fire Modeling Facility at the FAA William J. Hughes Technical Center. The pressure vessel has a volume of 402 ft3 and a maximum working pressure rating of 600 psig (see figure 1). The pressure vessel was instrumented with thermocouples, pressure transducers, gas analyzers, and a video camera. Since the pressure vessel is air tight, the
1

overpressure associated with the explosive reaction is captured and retained until the pressure vessel cools. INSTRUMENTATION. Multiple sensors were installed inside the pressure vessel during the evaluation, which included thermocouples, gas sampling probes, pressure transducers, and a video camera (see figure 1). Temperature was measured with two Type K chromel/alumel 22-gauge thermocouples near the arcing electrodes and on the surface of the simulator. Two gas analyzers, with a continuous real-time display, were used to measure the volumetric concentrations of the extinguishing agent (BTP or HFC-125) and oxygen (O2). A comparative test between the signal output (concentration reading) of the NDIR and Statham analyzers were conducted prior to testing to determine their correlation. The results were excellent; their readings match almost exactly (±0.1%). • A Rosemount 880A (NDIR) analyzer was used to determine the volumetric concentration
of BTP and HFC-125. • The oxygen concentration was detected with a Rosemount OM11EA gas analyzer. The gas-sampling probe was installed 24 inches laterally to the arcing electrode and 36 inches forward of the simulator. The sampling probe simultaneously disconnected just before striking the arc to protect the analyzing equipment from the overpressures. The data-sampling rate for all the temperature measurements and the gas concentrations was 1 Hz. An Omega PX951-200G5V pressure transducer was used to record the overpressure pulses during the explosions. The pressure transducer’s frequency response was 3000 Hz, and it provided a pressure range of 0 to 200 psig. The pressure transducer was mounted on the aft wall of the pressure vessel. The pressure data was collected at a sampling rate of 1000 data points per second. TEST PROCEDURE. The following procedures were used during the simulated aerosol can explosion test. 1. Prior to commencing the test, the analyzers were calibrated against a calibration gas, the
instrumentation was checked for functionality and accuracy, and the support equipment was activated to check for normal operation.
2. To identify the test, a test sign, with the test identification number, was displayed in front of the video camera and recorded.
3. The data acquisition systems were configured and readied.
2 2

4. The fire bottle was filled with the required amount of agent, and the aerosol can simulator was charged with propane, water, and alcohol.
5. The pressure vessel door was shut after plumbing the fire bottle to the pressure vessel’s discharge lines, after cleaning the discharge nozzles, and after mounting the aerosol can simulator inside the vessel.
6. All the valves on the pressure vessel were closed to seal it, with the gas-sampling probe creating the only temporary leak. At this point, the setup was ready for testing.
7. Before the countdown, the fan inside the pressure vessel was turned on.
8. After the countdown, the test was initiated by starting the 1-Hz data acquisition system and discharging the agent. The agent was introduced, either at a low or high rate of discharge, in the pressure vessel until the desired volumetric concentration was reached.
9. Once the desired concentration was reached, the aerosol can simulator was heated to increase its pressure to 240 psig, which is the design failure pressure of a DOT-2P aerosol can.
10. When the required pressure was achieved, a second countdown was initiated to activate the aerosol can simulator. During the second countdown, the video camera was started, the high-speed data acquisition was tripped, the fan was turned off, the arcing electrodes were energized, and the aerosol can simulator pneumatic valve was opened.
11. After the test, the data was saved, all the equipment was turned off (with the exception of video camera), and the pressure vessel ventilated and monitored.
Two tests were conducted to determine if a reaction would occur with the agents under pressure. In these tests, the pressure vessel was pressurized to 15 and 20 psig. The pressurization step was performed after the agent was discharged. To pressurize the vessel, the air service valve was opened until the required pressure was achieved. After that, the same steps were followed as described above.
RESULTS
Table 1 presents a summary of the test results and figure 2 shows a comparison of representative data of each agent’s explosion suppression capabilities. A total of 25 tests were conducted in the pressure vessel. Out of the 25 tests, 21 were conducted successfully and 4 tests had to be aborted due to equipment failure (tests 7, 11, 12, and 18). The explosion event stressed the equipment and sometimes destroyed it. Test 1 was a pre-explosion test that compared the output of the NDIR and Statham gas analyzers, when measuring BTP, using two different methods of creating calibration gas. The agreement between the outputs of these two gas-measuring devices and the two calibration gas production methods were excellent. Since one of the methods used to produce the calibration gas is proprietary information, they are not discussed in this report.
3 3

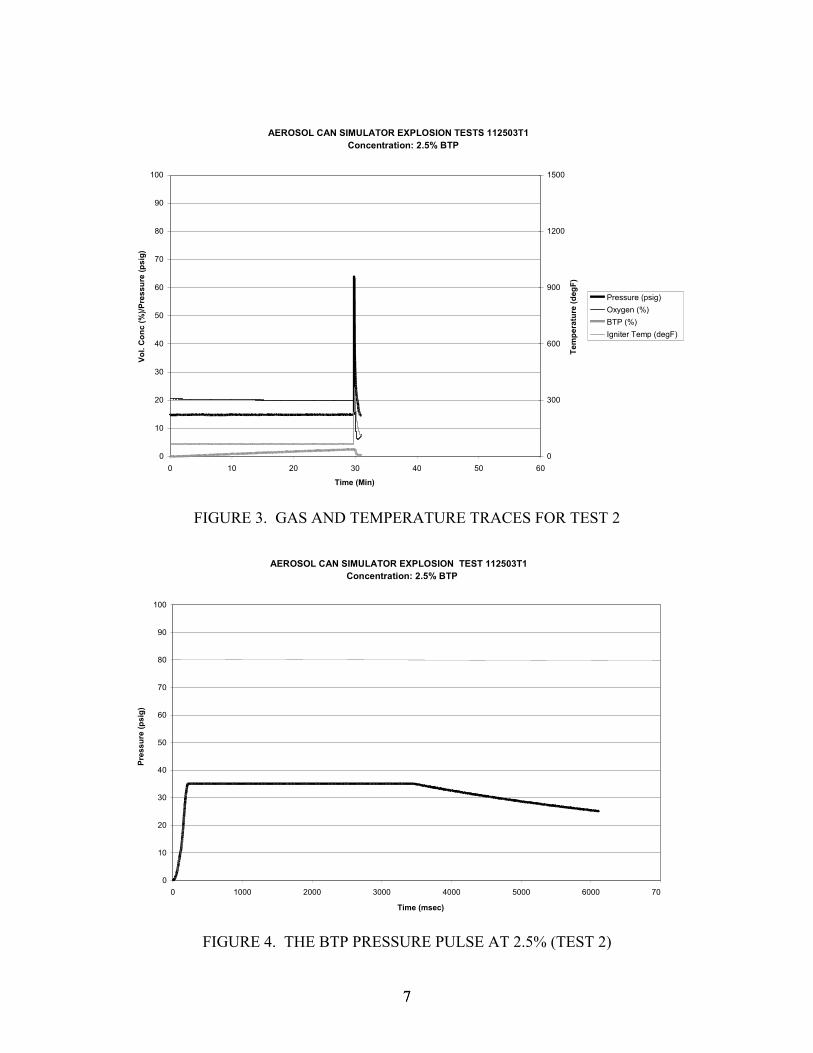
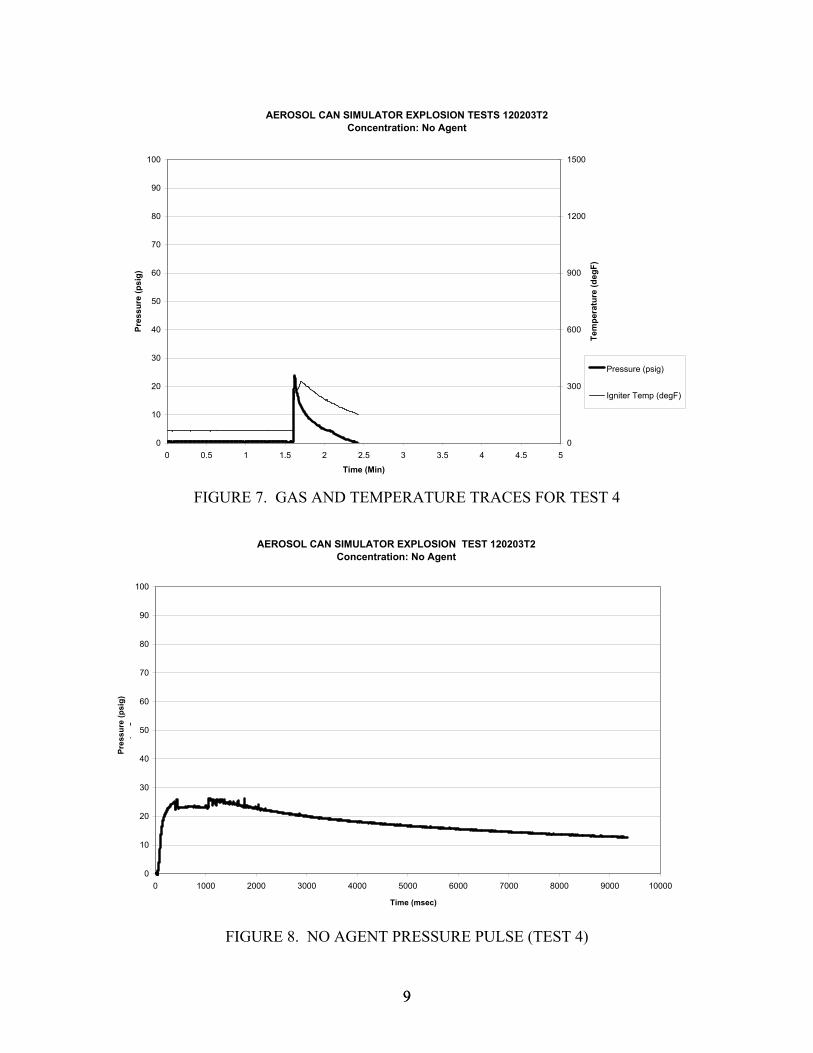
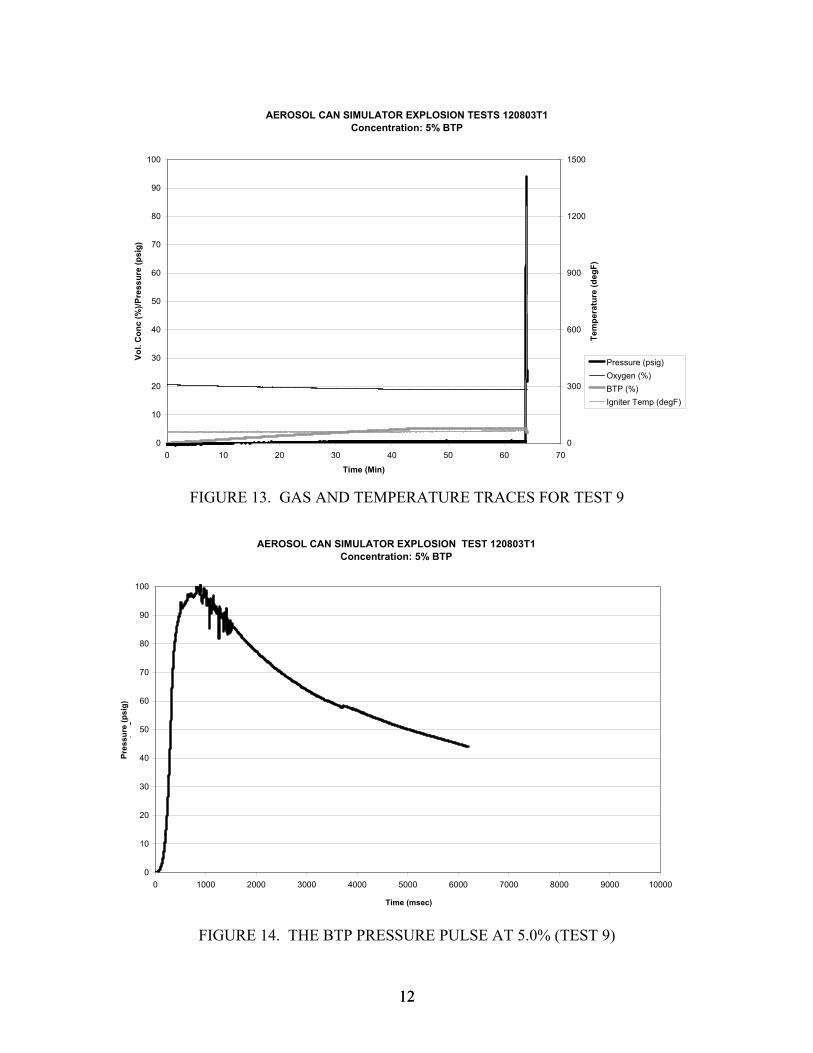
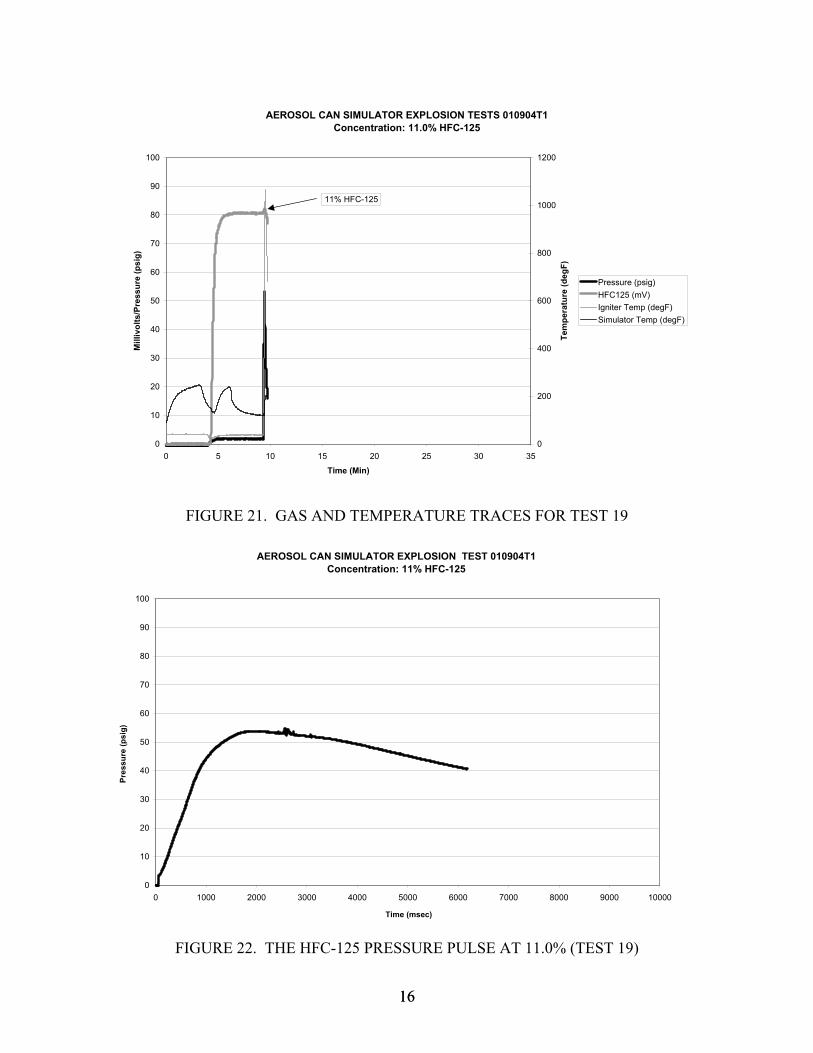
Test 2 was the first simulated aerosol can explosion test, using a concentration of 2.5% BTP in the pressure vessel. An explosion event occurred and produced a peak temperature of 368°F (figure 3) and an overpressure in excess of 49.3 psig (figure 4). Since the pressure transducer was saturated, it was replaced with one rated for higher pressures (200 psig). Tests 3 and 4 were baseline explosion tests without any extinguishing agent present. Test 3 was an explosion event with a peak temperature of 387°F (figure 5) and an overpressure of 25.4 psig (figure 6). The explosion of test 4 gave a peak temperatures of 328°F (figure 7) and an overpressure of 23.4 psig (figure 8). Tests 5 through 13 were simulated aerosol can explosion tests using BTP volumetric concentrations of 3%, 4%, 5%, and 6%. At these concentrations, the resulting peak pressures were 63, 63, 100, and 93 psig, respectively. As observed at 2.5% BTP concentration, the overpressures were significantly higher than the overpressure measured in air without the presence of an extinguishing agent (23-25 psig). The associated peak temperatures were 1056°, 1095°, 1251°, and 1467°F, respectively (see figures 9 through 16). Test 12 experienced a partial explosion event at 6% BTP. There were some flames near the ceiling area, but no significant trace of elevated pressure or temperature. During this test, the arc-producing electrodes were placed 2 inches below their required normal position. Tests 14 and 15 were studies conducted to determine if the heat gun, used to heat up the aerosol can simulator, was influencing the volumetric concentration of the BTP. The heat gun was replaced for tests conducted after test 8. On previous tests, it was noticed that when the heat gun was turned on to increase the pressure in the aerosol can simulator, the concentration of BTP dropped. These tests showed that the heat gun did not affect the concentration of the agent after running it for 10 and 30 minutes. Nevertheless, it was replaced with heat tape. Test 16 used Halon 1301 as the extinguishing agent with a volumetric concentration of 2.5%. This low concentration demonstrated that even though the agent was below its inert concentration (6.7%), the agent was still able to attenuate the explosion pulse. The pressure transducer recorded an overpressure of 4 psig with a temperature of 65°F (see figures 17 and 18). Thus, unlike BTP, Halon 1301 reduces the overpressure caused by an exploding aerosol can at concentrations below the inerting level. Tests 17 through 25 were conducted with HFC-125. In tests 21, 22, 23, and 25, the internal pressure of the pressure vessel was increased to determine if the agent was explosive without the activation of the aerosol can simulator. The internal pressure of the pressure vessel was increased by injecting compressed air. The concentrations tested at ambient pressure were 6.2%, 8.9%, 11%, and 13.5%. When the internal pressure of the pressure vessel was increased, the concentrations were 6.1%, 6.3%, and 11.3%. The internal pressure of the pressure vessel was increased to 15 and 20 psig. The explosion event peak pressures recorded, when the pressure vessel was at ambient pressure, were 52, 53, 52, and 0 psig, respectively, with associated temperatures of 1026°, 1227°, 1067°, and 50°F. Thus, concentrations of HFC-125 below the inerting level (6.2%, 8.9%, and 11%) also produced overpressures greater than in air alone. No explosion occurred when the concentration was 13.5%. During test 24, the internal pressure of the pressure vessel was increased to 15 psig. When the concentration of HFC-125 was 11.3%,
4 4

the arcing electrodes were energized without the activation of the aerosol can simulator. At this time, there was no explosion event, but when the aerosol can simulator was activated, a minor explosion event occurred with the pressure increase of only 6 psig. The peak temperature during this event was 32°F (up from 24°F). When the internal pressure of the pressure vessel was increased to 20 psig and the HFC-125 concentrations (6.1%) was below the cup burner concentrations (8.8%), energizing the arc-producing electrodes produced no explosions. (Refer to the charts in figures 19 through 26.)
CONCLUDING REMARKS
The following conclusions can be inferred from the results presented in this report. 1. The overpressure pulse of the explosion event is enhanced significantly when
bromotrifluoropropene (BTP) is used at a subinerting concentration of 6% or below. 2. The overpressure pulse of the explosion event is enhanced significantly when
pentafluoroethane (HFC-125) is used at a subinerting concentration of 11% or below. 3. Halon 1301 mitigated the pressure pulse of an aerosol explosion at a concentration of
2.5% which is below its inert value. 4. Unless a means can be found to avoid the problem of introducing subinerting
concentrations of extinguishing agent in the cargo compartment, BTP and HFC-125 would not be suitable candidates for halon replacement extinguishing agents for this application in airplanes.
5. When the internal pressure of the pressure vessel is increased to 15 and 20 psig and HFC-
125 is present in concentrations of 6.1% and 11.3%, the environment is not explosive when an electrical arc is introduced.
6. The agreement between the gas-sampling readout of the NDIR and Statham gas analyzers
and between the two methods used to produce calibration gas were excellent.
5 5

PressureTransducer
VideoCamera(Top View)(Top View)
11.4 m Pressure Vessel
3Fan
Aerosol CanSimulator
ArcingElectrodes
Agent DischargePort
Gas AnalyzerProbe
Igniter Thermocouple
Heat Gun
Aerosol Can SimulatorThermocouple
FIGURE 1. PLAN VIEW OF PRESSURE VESSEL SETUP
0
20
40
60
80
100
120
140
0 2000 4000 6000 8000 10000 12000 14000 16000
Time (msec)
Pres
sure
(psi
g) BTP (5%)
No Agent
Halon 1301 (2.5%)
HFC-125 (8.9%)
FIGURE 2. COMPARISON OF AGENT EXPLOSION SUPPRESSION CAPABILITY AT BELOW INERT CONCENTRATIONS
6 6
AEROSOL CAN SIMULATOR EXPLOSION TESTS 112503T1Concentration: 2.5% BTP
0
10
20
30
40
50
60
70
80
90
100
0 10 20 30 40 50 60
Time (Min)
Vol.
Con
c (%
)/Pre
ssur
e (p
sig)
0
300
600
900
1200
1500
Tem
pera
ture
(deg
F)
Pressure (psig)Oxygen (%) BTP (%) Igniter Temp (degF)
FIGURE 3. GAS AND TEMPERATURE TRACES FOR TEST 2
AEROSOL CAN SIMULATOR EXPLOSION TEST 112503T1Concentration: 2.5% BTP
0
10
20
30
40
50
60
70
80
90
100
0 1000 2000 3000 4000 5000 6000 700
Pres
sure
(psi
g)
Time (msec)
FIGURE 4. THE BTP PRESSURE PULSE AT 2.5% (TEST 2)
7 7

AEROSOL CAN SIMULATOR EXPLOSION TESTS 120203T1Concentration: No Agent
0
10
20
30
40
50
60
70
80
90
100
0 0.5 1 1.5 2 2.5 3 3.5 4 4.5 5
Time (Min)
Pres
sure
(psi
g)
0
300
600
900
1200
1500
Tem
pera
ture
(deg
F)
Pressure (psig)
Igniter Temp (degF)
FIGURE 5. GAS AND TEMPERATURE TRACES FOR TEST 3
AEROSOL CAN SIMULATOR EXPLOSION TEST 120203T1
Concentration: No Agent
0
10
20
30
40
50
60
70
80
90
100
0 1000 2000 3000 4000 5000 6000 7000 8000 9000 10000
pg
Pres
sure
(psi
g)
Time (msec)
FIGURE 6. NO AGENT PRESSURE PULSE (TEST 3)
8 8
AEROSOL CAN SIMULATOR EXPLOSION TESTS 120203T2Concentration: No Agent
0
10
20
30
40
50
60
70
80
90
100
0 0.5 1 1.5 2 2.5 3 3.5 4 4.5 5
Time (Min)
Pres
sure
(psi
g)
0
300
600
900
1200
1500
Tem
pera
ture
(deg
F)
Pressure (psig)
Igniter Temp (degF)
FIGURE 7. GAS AND TEMPERATURE TRACES FOR TEST 4
AEROSOL CAN SIMULATOR EXPLOSION TEST 120203T2Concentration: No Agent
0
10
20
30
40
50
60
70
80
90
100
0 1000 2000 3000 4000 5000 6000 7000 8000 9000 10000
pg
Pres
sure
(psi
g)
Time (msec)
FIGURE 8. NO AGENT PRESSURE PULSE (TEST 4)
9 9

AEROSOL CAN SIMULATOR EXPLOSION TESTS 120203T3Concentration: 3% BTP
0
10
20
30
40
50
60
70
80
90
100
0 10 20 30 40 50 60
Time (Min)
Vol.
Con
c (%
)/Pre
ssur
e (p
sig)
0
300
600
900
1200
1500
Tem
pera
ture
(deg
F)
Pressure (psig)Oxygen (%)BTP (%)Igniter Temp (degF)
FIGURE 9. GAS AND TEMPERATURE TRACES FOR TEST 5
AEROSOL CAN SIMULATOR EXPLOSION TEST 120203T3Concentration: 3% BTP
0
10
20
30
40
50
60
70
80
90
100
0 1000 2000 3000 4000 5000 6000 7000 8000 9000 10000
pg
Pres
sure
(psi
g)
Time (msec)
FIGURE 10. THE BTP PRESSURE PULSE AT 3.0% (TEST 5)
10 10

AEROSOL CAN SIMULATOR EXPLOSION TESTS 120303T1Concentration: 4% BTP
0
10
20
30
40
50
60
70
80
90
100
0 10 20 30 40 50 60
Time (Min)
Vol.
Con
c (%
)/Pre
ssur
e (p
sig)
0
300
600
900
1200
1500
Tem
pera
ture
(deg
F)
Pressure (psig)Oxygen (%)BTP (%)Igniter Temp (degF)
FIGURE 11. GAS AND TEMPERATURE TRACES FOR TEST 6
AEROSOL CAN SIMULATOR EXPLOSION TEST 120303T1Concentration: 4% BTP
0
10
20
30
40
50
60
70
80
90
100
0 1000 2000 3000 4000 5000 6000 7000 8000 9000 10000
pg
Pres
sure
(psi
g)
Time (msec)
FIGURE 12. THE BTP PRESSURE PULSE AT 4.0% (TEST 6)
11 11
AEROSOL CAN SIMULATOR EXPLOSION TESTS 120803T1Concentration: 5% BTP
0
10
20
30
40
50
60
70
80
90
100
0 10 20 30 40 50 60 70
Time (Min)
Vol.
Con
c (%
)/Pre
ssur
e (p
sig)
0
300
600
900
1200
1500
Tem
pera
ture
(deg
F)
Pressure (psig)Oxygen (%)BTP (%)Igniter Temp (degF)
FIGURE 13. GAS AND TEMPERATURE TRACES FOR TEST 9
AEROSOL CAN SIMULATOR EXPLOSION TEST 120803T1Concentration: 5% BTP
0
10
20
30
40
50
60
70
80
90
100
0 1000 2000 3000 4000 5000 6000 7000 8000 9000 10000
pg
Pres
sure
(psi
g)
Time (msec)
FIGURE 14. THE BTP PRESSURE PULSE AT 5.0% (TEST 9)
12 12

AEROSOL CAN SIMULATOR EXPLOSION TESTS 121103T1Concentration: 6% BTP
0
10
20
30
40
50
60
70
80
90
100
0 10 20 30 40 50 60
Time (Min)
Vol.
Con
c (%
)/Pre
ssur
e (p
sig)
0
300
600
900
1200
1500
Tem
pera
ture
(deg
F)
Pressure (psig)Oxygen (%)BTP (%)Igniter Temp (degF)
FIGURE 15. GAS AND TEMPERATURE TRACES FOR TEST 13
AEROSOL CAN SIMULATOR EXPLOSION TEST 121103T1Concentration: 6% BTP
0
10
20
30
40
50
60
70
80
90
100
0 1000 2000 3000 4000 5000 6000 7000 8000 9000 10000
pg
Pres
sure
(psi
g)
Time (msec)
FIGURE 16. THE BTP PRESSURE PULSE AT 6.0% (TEST 13)
13 13

AEROSOL CAN SIMULATOR EXPLOSION TESTS 121603T1Concentration: 2.5% HALON 1301
0
10
20
30
40
50
60
70
80
90
100
0 10 20 30 40 50 60
Time (Min)
Vol.
Con
c (%
)/Pre
ssur
e (p
sig)
0
300
600
900
1200
1500
Tem
pera
ture
s (d
egF)
Pressure (psig)Oxygen (%)Halon 1301 (%)Igniter Temp (degF)
FIGURE 17. GAS AND TEMPERATURE TRACES FOR TEST 16
AEROSOL CAN SIMULATOR EXPLOSION TEST 121603T1Concentration: 2.5% Halon 1301
0
10
20
30
40
50
60
70
80
90
100
0 1000 2000 3000 4000 5000 6000 7000 8000 9000 10000
pg
Pres
sure
(psi
g)
Time (msec)
FIGURE 18. THE HALON 1301 PRESSURE PULSE AT 2.5% (TEST 16)
14 14

AEROSOL CAN SIMULATOR EXPLOSION TESTS 010704T1Concentration: 8.9% HFC-125
0
10
20
30
40
50
60
70
80
90
100
0 5 10 15 20 25 30 35
Time (Min)
Mill
ivol
ts/P
ress
ure
(psi
g)
0
300
600
900
1200
1500
Tem
pera
ture
(deg
F)
Pressure (psig)HFC125 (mV)Igniter Temp (degF)Simulator Temp (degF)
8.9% HFC-125
FIGURE 19. GAS AND TEMPERATURE TRACES FOR TEST 17
AEROSOL CAN SIMULATOR EXPLOSION TEST 010704T1Concentration: 8.9% HFC-125
0
10
20
30
40
50
60
70
80
90
100
0 1000 2000 3000 4000 5000 6000 7000 8000 9000 10000
pg
Pres
sure
(psi
g)
Time (msec)
FIGURE 20. THE HFC-125 PRESSURE PULSE AT 8.9% (TEST 17)
15 15
AEROSOL CAN SIMULATOR EXPLOSION TESTS 010904T1Concentration: 11.0% HFC-125
0
10
20
30
40
50
60
70
80
90
100
0 5 10 15 20 25 30 35
Time (Min)
Mill
ivol
ts/P
ress
ure
(psi
g)
0
200
400
600
800
1000
1200
Tem
pera
ture
(deg
F)
Pressure (psig)HFC125 (mV)Igniter Temp (degF)Simulator Temp (degF)
11% HFC-125
FIGURE 21. GAS AND TEMPERATURE TRACES FOR TEST 19
AEROSOL CAN SIMULATOR EXPLOSION TEST 010904T1Concentration: 11% HFC-125
0
10
20
30
40
50
60
70
80
90
100
0 1000 2000 3000 4000 5000 6000 7000 8000 9000 10000
pg
Pres
sure
(psi
g)
Time (msec)
FIGURE 22. THE HFC-125 PRESSURE PULSE AT 11.0% (TEST 19)
16 16

AEROSOL CAN SIMULATOR EXPLOSION TESTS 011304T2Concentration: 6.2% HFC-125
0
10
20
30
40
50
60
70
80
90
100
0 5 10 15 20 25 30 35
Time (Min)
Mill
ivol
ts/P
ress
ure
(psi
g)
0
300
600
900
1200
1500
Tem
pera
ture
(deg
F)
Pressure (psig)HFC-125 (mV)Igniter Temp (degF)Simulator Temp (degF)
11.8% HFC-125
6.2% HFC-125
FIGURE 23. GAS AND TEMPERATURE TRACES FOR TEST 23
AEROSOL CAN SIMULATOR EXPLOSION TEST 011304T2Concentration: 6.2% HFC-125
0
10
20
30
40
50
60
70
80
90
100
0 1000 2000 3000 4000 5000 6000 7000 8000 9000 10000
pg
Pres
sure
(psi
g)
Time (msec)
FIGURE 24. THE HFC-125 PRESSURE PULSE AT 6.2% (TEST 23)
17 17

AEROSOL CAN SIMULATOR EXPLOSION TESTS 011404T1Concentration: 11.3% HFC-125 (Pressure Vessel at 15 psig)
0
10
20
30
40
50
60
70
80
90
100
0 5 10 15 20 25 30 35
Time (Min)
Mill
ivol
ts/P
ress
ure
(psi
g)
0
300
600
900
1200
1500
Tem
pera
ture
(deg
F)
Pressure (psig)HFC-125 (mV)Igniter Temp (degF)Simulator Temp (degF)
11.3% HFC-125
17.3% HFC-125
FIGURE 25. GAS AND TEMPERATURE TRACES FOR TEST 25
AEROSOL CAN SIMULATOR EXPLOSION TEST 011404T1
Concentration: 11.3% HFC-125 at Po=15 psig
0
10
20
30
40
50
60
70
80
90
100
0 1000 2000 3000 4000 5000 6000 7000 8000 9000 10000
Pres
sure
(psi
g)
Time (msec)
FIGURE 26. THE HFC-125 (Po=15 psig) PRESSURE PULSE AT 11.3% (TEST 25)
18 18

TA
BLE
1.
SUM
MA
RY O
F TE
ST R
ESU
LTS
19/20