before the department of commerce national
TRANSCRIPT

1
Before the Department of Commerce
National Telecommunications and Information Administration
Washington, D.C.
In the Matter of )
)
Request for Comments on ) Docket No. 200521-0144
The National Strategy to Secure 5G ) RIN 0660-XC047
Implementation Plan )
)
COMMENTS OF GSMA
David Walsh
General Counsel
GSMA
The Walbrook Building, 25 Walbrook
London, EC4N 8AF, UK
Tel: +44 (0)207 356 0600
Fax: +44 (0)207 356 0601

2
June 25, 2020
Submitted electronically via [email protected]
Re: Comments of the GSMA Association on NTIA’s Request for Public Comments on The
National Strategy to Secure 5G Implementation Plan, Docket No. 200521-0144, RIN 0660-XC047
Introduction and Executive Summary:
GSM Association (GSMA) appreciates the opportunity to comment on the Department of
Commerce’s National Telecommunications and Information Administration’s (NTIA)
Implementation Plan for the Administration’s “National Strategy to Secure 5G” (Strategy)1
released in accordance with the “Secure 5G and Beyond Act of 2020” (Act) by President Trump
on March 23, 2020. GSMA represents the interests of the worldwide mobile ecosystem uniting
more than 750 operators with almost 400 companies in the mobile ecosystem, including handset
and device makers, software companies, equipment providers and internet companies, and
organizations in adjacent sectors. GSMA promotes regulatory frameworks that support
competition, innovation, investment, and the long-term growth of the sector, with the goal of
creating benefits for consumers and communities.
GSMA has been pleased to engage with the Department of Commerce’s NTIA and
Bureau of Industry and Security (BIS) to advance secure, interoperable wireless communications
systems and infrastructure around the world including fifth generation wireless technologies
(5G)2. GSMA and its members appreciate the Administration’s commitment to ensure the
security and reliability of wireless infrastructure while maintaining the United States’ position of
1 U.S. Department of Commerce, National Telecommunications and Information Administration, Request for Public
Comments on The National Telecommunications and Information Administration, Notice, request for public
comments, 85 Fed. Reg. 32016 (May. 28, 2020). 2 See Letter from J. Shane and M. Brown, Counsel to GSMA, to K. Nies-Vogel, BIS, re: Request for Extension of
Temporary General License to Permit Transactions with Huawei that Are Necessary for the Operation of
Telecommunications Networks and Provision of Critical Updates and Repairs for Consumers (Aug. 6, 2019).

3
leadership in commercial development and deployment of advanced wireless services. In these
comments we provide our perspectives to the questions in the NPRM and highlight areas for
consideration.
We appreciate the balancing act that the administration and U.S. companies must do to
address the security concerns today while looking to correct market inefficiencies in the long
term. Short-term fixes should keep security and global interoperability top of mind, allowing for
sufficient stakeholder review and study to determine technical challenges and potential fixes. In
the long term, a global effort to diversify the supply chain will require time and capital.
As we highlighted in our January 2020 filings to the Department of Commerce3, the
global information and communications technology and services (ICTS) market relies on
interoperability not just to support customers internationally but also U.S. companies
participating in the global economy. International peering arrangements, roaming, backhaul, and
interconnection underpin global communications and business. Clarity around the rules will
allow operators to plan and predict their business cycles better and further innovation.
As stated in our March 2020 comments to BIS4, the U.S. Government’s actions to date
have shifted the market for equipment and managed services, but have not yet led to the creation
of a new viable competitive vendor. As U.S. operators continue to deploy their 5G networks,
vendor diversity remains a priority. As we note below, open networking and virtualization
represents a critical path forward, recognizing that it may not produce short-term solutions on its
own.
3 See GSMA Comments to the U.S. Department of Commerce, re: In the Matter of Securing the Information and
Communications Technology and Services Supply Chain, Docket No. 191119-0084, RIN 0605-AA51, (January 10,
2020). 4 See Comments from the GSM Association, BIS, re: Request for Comments on Future Extensions of Temporary
General License (TGL), Notification of Inquiry, Docket No. BIS 2020-0001, RIN 0694-ZA02, (March 25, 2020).

4
We experience wireless services as connecting us instantaneously, but they depend upon
networks deployed through a dynamic and meticulous process of planning, development and
sourcing. In an ecosystem that hinges on interoperability, a lack of clarity may thwart major
investments and basic operations, from security patches to interconnection to cloud-based
innovation. Steps made today will have a tremendous effect on global operations for years to
come.
What areas of research and development should the U.S. Government prioritize to achieve
and maintain U.S. leadership in 5G? How can the US Government create an environment
that encourages private sector investment in 5G technologies and beyond?
In September 2019, the GSMA conducted a survey focused on understanding the
decisions and strategies global mobile operators are considering for network transformation and
next generation wireless services. The anonymized survey features 100 operators from around
the world, comprised of 25 operators in the Americas, 39 in Asia Pacific, 18 in Europe and 18 in
the Middle East and Africa. This group of operators represents 72% of global mobile
connections as well as 84% of global mobile CapEx5.
Overall, operators are aligning their network transformation strategies against the
backdrop of the evolving mobile ecosystem dynamics. 26% of operators ranked infrastructure
costs as their number one barrier to increased 5G spend, more than any other barrier. Operators
indicated network security upgrades as a top area of investment for operator 5G core and service
networks, followed by Virtualization and Service-Based Architecture. Linked to network
security are operator concerns around supply-chain diversity with 51% saying it is important to
bring new vendors into their network.
5 See P. Jarich, GSMA Intelligence, Network Transformation 2020: How Operators are Planning for the Network of
Tomorrow, (November 2019), available at https://data.gsmaintelligence.com/research/research/research-
2019/network-transformation-2020

DATE
Network Transformation 2020
How operators are planning for the network of tomorrow
Operator Insights
November 2019 Peter Jarich. Head of GSMA Intelligence
Jason Reed, Lead Analyst

The GSMA represents the interests of mobile operators
worldwide, uniting more than 750 operators with nearly 400
companies in the broader mobile ecosystem, including
handset and device makers, software companies, equipment
providers and internet companies, as well as organisations in
adjacent industry sectors. The GSMA also produces the
industry-leading MWC events held annually in Barcelona, Los
Angeles and Shanghai, as well as the Mobile 360 Series of
regional conferences.
For more information, please visit the GSMA corporate
website at www.gsma.com
Follow the GSMA on Twitter: @GSMA
GSMA Intelligence is the definitive source of global mobile
operator data, analysis and forecasts, and publisher of
authoritative industry reports and research. Our data covers
every operator group, network and MVNO in every country
worldwide – from Afghanistan to Zimbabwe. It is the most
accurate and complete set of industry metrics available,
comprising tens of millions of individual data points, updated
daily.
GSMA Intelligence is relied on by leading operators, vendors,
regulators, financial institutions and third-party industry players,
to support strategic decision-making and long-term investment
planning. The data is used as an industry reference point and is
frequently cited by the media and by the industry itself.
Our team of analysts and experts produce regular thought-
leading research reports across a range of industry topics.
www.gsmaintelligence.com

1 Executive summary
2 Network transformation priorities and spending
3 Network transformation technologies
4 Network solution and vendor strategies
5 5G network strategies and concerns
Contents

Answering the key questions on
mobile networks
92%
With 5G networks and services going live and mobile broadband usage skyrocketing, two key questions
surround operator network transformation strategies: how will operator spending evolve and what will drive
that spending?
64% 61%
The vast majority of operators
expect network investment
spend to remain the same or
grow over the next 12 months.
Some 40% expect spend to be
up to 10% higher.
New revenue generation
(direct or otherwise) is the
primary goal of network
transformation for two thirds of
operators, helping justify
additional network investment
spend.
61% of operators are investing
in private wireless networks,
indicating enterprise as a
target for new revenues. This
is supported by 70% planning
standalone 5G deployment
within three years.

How operator networks are evolving
to meet future opportunities
78%
Whether or not operators are investing in their networks is an important question. But just as important is
how they will be investing: where they will be putting their investment funds and what strategies will be
guiding their decisions.
25% 26%
The overriding theme for
network transformation is use
of IT technologies. The top-
ranked priority (nearly 80%
deemed it important). It was
also top among opex saving
technologies; 55% ranked it in
the top three.
Only a quarter of operators
claim to be commercially
deploying open networking
technologies, held back by
internal expertise gaps.
However, very few (18%) think
that doing so is unimportant
going forward.
IT transformation allows
operators to host assets on
the public cloud – and cloud
players to compete with them.
Few operators (26%),
however, see defending
against public cloud providers
as a top priority.

Today’s news is reflected in operator
network strategies
47%
In the midst of planning for 5G launches, new IoT business models, and the integration of foundational
technologies such as AI and blockchain, operators must align their network transformation strategies with
ever-evolving mobile ecosystem dynamics.
89% 51%
As the critical nature of mobile
networks escalates, operators
and regulators have highlighted
network vulnerabilities, with
around half of operators seeing
security as an “extremely
important” priority.
Whether or not operators see the
public cloud as a competitive
threat, they do see it as a tool to
leverage; 20% claim to be
deploying network functions on it,
while 89% plan OSS/BSS
deployments on it.
Linked to network security
concerns are supply-chain
diversity worries – reliance on too
few suppliers. Around half of
operators think it is important to
bring new vendors into their
network.

Crossing the 5G horizon
85%
5G represents the greatest network transformation opportunity (and challenge) for
operators in the last decade. Beyond the new services it will enable, there will be
implications in terms of vendors engaged and technology priorities.
41% 68%
While likely optimistic, an
overwhelming majority of
operators plan to have non-
standalone 5G launched within
three years, with standalone close
behind. Both, however, will
co-exist.
If 5G is a tool for enabling new
enterprise services, new coverage
models will be required; in-
building 5G is the most important
5G RAN investment area,
highlighted by more than 40% of
operators.
Spectrum is the lifeblood of
mobile services; almost 70% of
operators see limited spectrum
access as a barrier to greater 5G
investment.

Survey detailsDistribution and timing
In September 2019, GSMA Intelligence surveyed 100 network infrastructure decision makers from
operators around the world to understand their network transformation strategies, priorities and obstacles.
All responses were confidential and only reported on in the aggregate.
72% of global mobile
connections represented
by operators surveyed.
88% share of converged
(offering fixed and mobile)
operators surveyed.
84% of global mobile
capex represented by
operators surveyed.
39%
18% 18%
25%
Asia Pacific Europe Middle East and Africa Americas
Please specify the region where you are located?(n=100)

Survey detailsSample sizes
Segment Sample size
Total 100
Region
Asia Pacific 39
Europe 18
Middle East and Africa 18
Americas 25
Organisation size (by connections)
Fewer than 10 million 18
10 million to 49.9 million 43
50 million to 99.9 million 24
Over 100 million 15

Survey detailsSurvey questions
Network transformation
priorities and spending
Network transformation
technologies
Network solution and vendor
strategies
5G network strategies and
concerns
What is the primary goal driving your
network transformation strategy?
How important are the following priorities
as a part of your network transformation
strategy?
When do you expect to complete the
phase-out of your 2G and 3G operations?
In the next 12 months, what share of your
network spend do you expect to support
the following?
How do you expect that network spend to
be split between opex and capex?
Compared to last year, how much do you
expect to spend on your network
investments in the next 12 months?
How likely are you to invest in private
wireless networks for enterprise
customers?
Which verticals are the top candidates for
private network investment?
Which technologies hold the most
promise of driving opex savings in your
network and service operations?
Where are you in the process of adopting
the following technologies?
How likely are you to migrate support for
network segments to public cloud
resources?
Rank the following technologies in terms
of their return on investment (RoI)?
What is the greatest obstacle to deploying
the following technologies?
Rank the following use cases for the
application of artificial intelligence and
automation in your network.
What degree of opex savings do you
expect network automation to generate
when fully deployed?
What are the most important factors in
purchasing a given network product or
solution?
How important is it for you to introduce
new product or technology vendors into
your network?
How important is it for you to integrate
open source and open networking
technologies into your network?
In engaging new network vendors, which
types of vendors are you most likely to
engage with?
In engaging new network vendors, which
types of products are you most likely to
procure?
What are the primary obstacles to
introducing new vendors into your
network
What are the primary obstacles to
introducing open source / open
networking technologies in your network?
Considering your 5G radio access
network, which areas of investment are
most important?
Considering your 5G core and service
network, which areas of investment are
most important?
Considering your 5G network assets and
strategy, when do you plan standalone
versus non-standalone 5G?
Rank the following benefits of deploying
standalone 5G in your network.
How likely are you to use 5G to introduce
new vendors into your network?
What is the greatest barrier to increasing
your planned network investment in 5G?

In numbers: network transformation
priorities and spending
64%
Two-thirds of operators prioritise
top-line concerns (generating
revenues) over bottom-line
concerns in network transformation
strategies.
78%
More than any other priority, IT
transformation is deemed very or
extremely important – nearly 80%
of operators highlight it as such.
50%
While 3G networks will be phased
out over many years, half of
operators plan to phase out their
2G networks by the end of 2020.
8%
With 5G builds on the horizon, only a
small minority of operators expect
network investment spend to decline
in 2019.
39%
Most operators plan to invest in
private wireless networks for
verticals; less than 40% have no
plans.
17%
Smart cities dominate private
wireless investment interest; 17% of
operators plan to invest in them
alongside the enterprise customer.

In numbers: network transformation
technologies
55%
Opex represents the majority of
operator network spend. IT
transformation of networks is seen
as the top way to save opex.
48%
Deploying telecoms functions on
the public cloud was once
considered unlikely. Today, almost
half of operators claim to be doing
so commercially.
49%
Almost half of operators are
deploying service core functions on
the public cloud (with OSS/BSS
close behind).
16%
More than any other technology,
network deployment automation is
seen as the top RoI driver, with 16%
highlighting it as such.
75%
Network automation might not be
ranked highest for opex efficiencies,
but the majority of operators expect
it to deliver more than 5% savings.
23%
With understood RoI and opex
benefits, what could hold up
automation? Internal ownership is a
worry for nearly a quarter of
operators.

In numbers: network solution and
vendor strategies
57%
Network security is a top network
transformation priority; it’s logical
that most operators (57%) also see
it as an important vendor criteria.
20%
Only a minor share of operators
don’t feel it’s important to integrate
new suppliers into their network
infrastructure.
65%
In working to engage new network
vendors, around two thirds of
operators will look to work with
larger systems suppliers.
32%
Vendor references have long been
a supplier evaluation (and
marketing) tool; less than a third of
operators rank them as important.
71%
Network security concerns rate
highest as an obstacle to new
supplier integration, highlighted by
most operators.
56%
Just over half of operators are likely
to work with start-ups as new
suppliers; the door is open for both
large and small players.

In numbers: 5G network strategies
and concerns
20%A fifth of operators see in-building
coverage as their top RAN priority,
suggesting a keen enterprise focus.
69%
More than two thirds of operators
failed to claim spectrum refarming
as a top three RAN priority, despite
highlighting spectrum scarcity.
71%
Most operators plan to start 5G
deployment in non-standalone
mode. However, more than 70%
plan standalone launches in three
years.
57%
More than half of operators think
they are likely to introduce new
vendors into their 5G network
deployments.
6%Only a small minority think they are
very unlikely to use 5G to introduce
new vendors.
26%
More than a quarter of operators
ranked infrastructure costs as the
no.1 barrier to increased 5G spend
– more than any other barrier.

1 Executive summary
2 Network transformation priorities and spending
3 Network transformation technologies
4 Network solution and vendor strategies
5 5G network strategies and concerns

In numbers: network transformation
priorities and spending
64%
Two-thirds of operators prioritise
top-line concerns (generating
revenues) over bottom-line
concerns in network transformation
strategies.
78%
More than any other priority, IT
transformation is deemed very or
extremely important – nearly 80%
of operators highlight it as such.
50%
While 3G networks will be phased
out over many years, half of
operators plan to phase out their
2G networks by the end of 2020.
8%
With 5G builds on the horizon, only a
small minority of operators expect
network investment spend to decline
in 2019.
39%
Most operators plan to invest in
private wireless networks for
verticals; less than 40% have no
plans.
17%
Smart cities dominate private
wireless investment interest; 17% of
operators plan to invest in them
alongside the enterprise customer.

Survey detailsSample sizes
Segment Sample size
Total 100
Region
Asia Pacific 39
Europe 18
Middle East and Africa 18
Americas 25
Organisation size (by connections)
Fewer than 10 million 18
10 million to 49.9 million 43
50 million to 99.9 million 24
Over 100 million 15

Network transformation goalsRevenues over cost savings
• Top-line concerns: Revenue
generation and customer experience
(64% of all responses) reflect a focus
on the top line.
• Churn reduction. While linked to
revenues via customer acquisition,
improved experiences also reflect
concerns around churn.
• Top versus bottom line. With new
services and use cases (5G, IoT,
verticals) on the horizon, a focus on
growth is unsurprising.
• Small companies need growth.
Small operators care least about
opex, highlighting it as their primary
goal about 25% as often as other
operators. Low revenues versus a
fixed cost base likely explains the
need to prioritise revenue growth.
19% 17% 39% 25%
What is the primary goal driving your network transformation strategy?
Saving on opex costs Saving on capex costs
Generating new revenues Improving customer experience

Network transformation priorities IT transformation key – but not to compete with cloud players
• Software and cloud. An industry
shift to software-defined and cloud
architectures is reflected in IT
transformation as a top priority.
• Cloud competition. A lack of focus
on competition with cloud players
suggests a potential blind spot,
particularly as those players begin to
host telecoms functions.
• IT expertise. Where IT technologies
represent new ground for many
operators, upskilling would
presumably be a higher priority.
• New suppliers. The poor showing of
“vendor diversity” is surprising; 51%
of operators note elsewhere that it is
important to introduce new suppliers
into their networks. How honest the
focus on new vendor introductions
truly is must be questioned.
How important are the following priorities as a part of your network
transformation strategy?
36%
28%
45%
35%
47%
37%
32%
30%
26%
32%
37%
33%
29%
23%
26%
33%
28%
35%
26%
20%
16%
27%
23%
26%
24%
33%
19%
6%
13%
6%
9%
5%
9%
11%
6%
14%
2%
2%
2%
3%
6%
Sustainability / energy efficiency
Vendor diversity
IT transformation / Use of IT tech
Regulatory compliance
Network security
End-user security
Automation of business functions andnetwork operations
Re-skilling / upskilling of staff
Competition from public cloud providers
Extremely important Very important Moderately important Slightly important Not at all important

46% 9% 14% 18% 13%
Radio access network Packet core network Service core network
Transport network Operations and billing
Network spending plansRAN dominates spend, supported by transport
• RAN domination. The most
distributed part of the network, RAN
always represents a major cost –
nearly 50% of network spend of the
surveyed operators.
• Age of virtualisation. Virtual RAN
innovation could keep costs in check,
though not in a meaningful way in the
next 12 months. Transport, ranked
second, may not see the same
benefit.
• Virtualisation – part 2. The move to
virtual and cloud architectures has
been under way for some time in the
core (packet/service) and OSS/BSS.
• Spend versus capex. When asked
about “network spend”, operators
were forced to think about opex and
capex together, recognising that
some categories come with higher
operation and integration costs.
In the next 12 months, what share of your network spend do you expect to
support the following?

Network spending plansOpex drives spend across top segments
• Virtualisation beneficiary: packet
core. If operators see packet core as
capex heavy, the move towards
virtual solutions could help cut costs
– and may explain a focus on virtual
EPC.
• Virtualisation multiplier: RAN.
Operators already see opex driving
RAN costs. Site upkeep and rental
help to explain this – and a move to
virtual RAN will only intensify the
opex burden.
• Virtualisation benefits? The use of
(less expensive) IT hardware is often
positioned as a core value of new
virtual architectures. So too, however,
is a reduction in opex, driven by the
use of standard IT operations. How
that factors into any operator’s
thinking is unclear across network
components.
39%
63%
44%52%
32%
61%
37%
56%48%
68%
Radio accessnetwork
Packet corenetwork
Service corenetwork
TransportNetwork
Operations andbilling
Opex
Capex
How do you expect that network spend to be split between opex and capex?

Network spending plans Expectations of lower spend are rare
• Split decision. Roughly half of
operators surveyed (51%) expect
spend to increase this year, with half
expecting it to be stable or decline.
• Growth wins. While most expect
stability, operators planning for costs
to go up (51%) outnumber those
expecting a decline (8%).
• 5G on the horizon. Despite cost-
cutting innovations, imminent 5G
rollouts are likely to be a factor in
near-term spend expectations.
• Latin America up; Europe down.
European operators are more likely to
plan on spending cuts (22% plan
lower spending), while Latin American
operators expect to spend more,
potentially reflecting current network
expansions (4G) versus new 5G
rollouts.
8%
41%40%
11%
Compared to last year, how much do you expect to spend on your network investments in next 12 months?
Up to 10% lower
The same as last year
Up to 10% higher
More than 10% higher

Network spending plansMost operators deploying (or planning) private wireless
• Split decision. Beyond operators
now investing in private wireless, the
rest are evenly divided between
those planning to invest and those
without plans.
• Private networks are already
underway. Often positioned as a
future plan, 21% of operators already
claim to be investing in them.
• Co-investment aspirations. Co-
investment is less common today
(14% versus 21%) but a bigger plan
going forward. Sharing investment
costs is attractive, but it is unclear
how solid the plans are.
• Large operator capabilities. Large
operators are most likely to be
investing today – 33% claim to do so.
The sales and product assets needed
to target verticals are likely a factor.
Investment models for private wireless networks for enterprise customers
Completely operator funded Co-investment with enterprise
21%14%
40%
42%
39%44%
Already implementing Planning to implement No plans

Network spending plansSmart cities on top, with or without co-investment
• Smart cities, finance, and
manufacturing on top. Smart cities
have been an operator focus, given
coverage demands and revenue
potential. Investment budgets and
requirements of finance and
manufacturing make them targets.
• Co-invest versus self-invest parity.
Across most verticals, there is little
difference in interest between
investing alongside the vertical or
investing directly.
• What about venues, energy,
agriculture, mining and utilities?
While often cited as natural targets
for operators targeting enterprises,
few in the survey flagged a major
interest in investing in networks for
these.
Top candidates for private network investment by
funding model
16% 16%
13%
11%
9% 9% 9%
6%
4%3% 3%
2%
17%
14%
12%
10% 10% 10%9%
5%
3%
6%
2% 2%
Self-invest Co-invest

Network transformation goalsResults by region
21%
17%
28%
12%
13%
28%
28%
41%
33%
56%
28%
26%
22%
17%
32%
0% 10% 20% 30% 40% 50% 60% 70% 80% 90% 100%
APAC
Europe
MEA
Americas
What is the primary goal driving your network transformation strategy?
Saving on opex costs Saving on capex costs Generating new revenues Improving customer experience

Network spending plans Results by region
Over the next 12 months, what share of your network spend do you expect to support the following
segments of your network?
45%
9%
16%
18%
12%
Asia Pacific
Radio access network
Packet core network
Service core network
Transport network
Operations and billing
51%
9%
12%
17%
12%
Middle East and Africa
45%
10%
14%
18%
12%
Europe
46%
8%
13%
18%
14%
Americas

Network spending plans Results by region
36%
63%43%
53%
31%
64%
37%57%
47%
69%
Radio accessnetwork
Packet corenetwork
Service corenetwork
Transportnetwork
Operationsand billing
Opex
Capex
Asia Pacific
43%
67%
43% 50%32%
57%
33%
57% 50%68%
Radio accessnetwork
Packet corenetwork
Service corenetwork
Transportnetwork
Operationsand billing
Opex
Capex
Europe
45%61%
44% 50%33%
55%39%
56% 50%68%
Radio accessnetwork
Packet corenetwork
Service corenetwork
Transportnetwork
Operationsand billing
Opex
Capex
Middle East and Africa
33%
67%
40%57%
29%
67%
33%
60%43%
72%
Radio accessnetwork
Packet corenetwork
Service corenetwork
Transportnetwork
Operationsand billing
Opex
Capex
Americas
How do you expect that network spend to be split between opex and capex?

Network spending plans Results by region
5%
22%
8%
46%
44%
44% 28%
36%
28%
50%
48%
13%6% 6%
16%
0%
20%
40%
60%
80%
100%
120%
APAC Europe MEA Americas
More than 10% higher
Up to 10% higher
The same as last year
Up to 10% lower
Compared to last year, how much do you expect to spend on your network investments in next 12 months?

Network spending plans Results by region
Investment models for private wireless networks for enterprise customers
28%
8%
41%51%
31% 41%
Completely funded by operator Via co-investment with enterprise
Asia Pacific
Already implementing Planning to implement No plans
22% 22%
39%22%
39%56%
Completely funded by operator Via co-investment with enterprise
Europe
Already implementing Planning to implement No plans
16% 12%
36% 44%
48% 44%
Completely funded by operator Via co-investment with enterprise
Americas
Already implementing Planning to implement No plans
11% 22%
44%39%
44% 39%
Completely funded by operator Via co-investment with enterprise
Middle East and Africa
Already implementing Planning to implement No plans

Network spending plans Results by region
Top candidates for private network investment by funding model
19%
17%
15%
11%
7% 7% 7%
4% 4% 4% 4%
2%
19%
9%
15%
11%
13%
9%
6%
0%
4% 4%
6%
4%
Asia Pacific
Self-invest Co-invest

Network spending plans Results by region
20%
15% 15% 15%
10% 10% 10%
5%
8%
33%
8%
0%
8% 8% 8%
25%
Finance Manufacturing Smart city Transport &logistics
Automotive Retail Public/enterprisevenues
Health
Europe
Self-invest Co-invest
Top candidates for private network investment by funding model

Network spending plans Results by region
22%
17% 17% 17%
11%
6% 6% 6%
0% 0%0%
26%
16%
11% 11% 11%
5% 5%
11%
5%
Transport &logistics
Smart city Automotive Health Retail Finance Oil and gas Agriculture Manufacturing Mining
Middle East and Africa
Self-invest Co-invest
Top candidates for private network investment by funding model

Network spending plans Results by region
18%
14%
11% 11% 11%
7% 7% 7% 7%
4% 4%
0%
19%
11% 11% 11%
4%
15%
11%
0% 0%
11%
4% 4%
Americas
Self-invest Co-invest
Top candidates for private network investment by funding model

Network transformation goalsResults by operator size (by number of connections)
6%
21%
21%
27%
28%
12%
17%
20%
39%
44%
38%
27%
28%
23%
25%
27%
0% 10% 20% 30% 40% 50% 60% 70% 80% 90% 100%
Under 10 million
10 million to 49.9million
50 million to 100million
Over 100 million
What is the primary goal driving your network transformation strategy?
Saving on opex costs Saving on capex costs Generating new revenues Improving customer experience

Network spending plans Results by operator size (by number of connections)
Over the next 12 months, what share of your network spend do you expect to support the following
segments of your network?
47%
6%
14%
17%
15%
Under 10 million
Radio access network
Packet core network
Service core network
Transport network
Operations and billing
51%
9%
12%
17%
12%
50 million to 100 million
45%
9%
15%
18%
13%
10 million to 49.9 million
44%
12%
15%
16%
13%
Over 100 million

Network spending plans Results by operator size (by number of connections)
36%
61%46% 48%
31%
64%
39%54% 53%
69%
Radio accessnetwork
Packet corenetwork
Service corenetwork
Transportnetwork
Operationsand billing
Opex
Capex
Under 10 million
41%
63%45%
53%
34%
59%
37%55%
47%
66%
Radio accessnetwork
Packet corenetwork
Service corenetwork
Transportnetwork
Operationsand billing
Opex
Capex
10 million to 49.9 million
36%
69%
40%53%
26%
64%
31%
60%47%
74%
Radio accessnetwork
Packet corenetwork
Service corenetwork
Transportnetwork
Operationsand billing
Opex
Capex
50 million to 100 million
40%
60%47% 52%
35%
60%
40%53% 48%
65%
Radio accessnetwork
Packet corenetwork
Service corenetwork
Transportnetwork
Operationsand billing
Opex
Capex
Over 100 million
How do you expect that network spend to be split between opex and capex?

Network spending plans Results by operator size (by number of connections)
7%
17%
7%
56%47%
21% 40%
33% 39%
42%
47%
11%7%
21%
7%
0%
20%
40%
60%
80%
100%
120%
Under 10 Million 10 Million to 49.9 Million 50 Million to 100 Million Over 100 Million
More than 10% higher
Up to 10% higher
The same as last year
Up to 10 % lower
Compared to last year, how much do you expect to spend on your network investments in next 12 months?

Network spending plans Results by operator size (by number of connections)
Investment models for private wireless networks for enterprise customers
17%6%
50%50%
33% 44%
Completely funded by operator Via co-investment with enterprise
Under 10 million
Already implementing Planning to implement No plans
21% 16%
33% 33%
46% 51%
Completely funded by operator Via co-investment with enterprise
10 million to 49.9 million
Already implementing Planning to implement No plans
17% 21%
54% 46%
29% 33%
Completely funded by operator Via co-investment with enterprise
50 million to 100 million
Already implementing Planning to implement No plans
33%7%
27%53%
40% 40%
Completely funded by operator Via co-investment with enterprise
Over 100 million
Already implementing Planning to implement No plans

Network spending plans Results by operator size (by number of connections)
19% 19%
16%
10% 10% 10%
6%
3% 3% 3%
0% 0%
17%
13%
9% 9%
4% 4%
9%
13%
9%
4% 4% 4%
Under 10 million
Self-invest Co-invest
Top candidates for private network investment by funding model

Network spending plans Results by operator size (by number of connections)
18%
15%
13%
10% 10% 10%
8% 8%
5%
3% 3%
14%
22%
14%
11% 11%
8%
14%
0%
3% 3% 3%
10 million to 49.9 million
Self-invest Co-invest
Top candidates for private network investment by funding model

Network spending plans Results by operator size (by number of connections)
31%
22%
9% 9%
6% 6% 6% 6%
3%
0% 0%
21%
14% 14%
11%
7%
0%
7%
11%
4%
7%
4%
50 million to 100 million
Self-invest Co-invest
Top candidates for private network investment by funding model

Network spending plans Results by operator size (by number of connections)
18% 18%
12% 12% 12%
6% 6% 6% 6% 6%
18%
0%
6%
18%
0%
12%
18%
12% 12%
6%
Over 100 million
Self-invest Co-invest
Top candidates for private network investment by funding model

1 Executive summary
2 Network transformation priorities and spending
3 Network transformation technologies
4 Network solution and vendor strategies
5 5G network strategies and concerns

In numbers: network transformation
technologies
55%
Opex represents the majority of
operator network spend. IT
transformation of networks is seen
as the top way to save opex.
48%
Deploying telecoms functions on
the public cloud was once
considered unlikely. Today, almost
half of operators claim to be doing
so commercially.
49%
Almost half of operators are
deploying service core functions on
the public cloud (with OSS/BSS
close behind).
16%
More than any other technology,
network deployment automation is
seen as the top RoI driver, with 16%
highlighting it as such.
75%
Network automation might not be
ranked highest for opex efficiencies,
but the majority of operators expect
it to deliver more than 5% savings.
23%
With understood RoI and opex
benefits, what could hold up
automation? Internal ownership is a
worry for nearly a quarter of
operators.

Survey detailsSample sizes
Segment Sample size
Total 100
Region
Asia Pacific 39
Europe 18
Middle East and Africa 18
Americas 25
Organisation size (by connections)
Fewer than 10 million 18
10 million to 49.9 million 43
50 million to 99.9 million 24
Over 100 million 15

Network technologies and opexIT solutions drive the opex savings agenda
• IT innovation focus. IT systems and
evolution (operations, network
transformation) lead opex savings
thinking – in line with software-driven
telecoms network innovations.
• Automation hype? While on top in
terms of RoI expectations, the
promise of opex savings from
automation surprisingly scored near
the middle of the pack.
• Sharing and capex. A limited focus
on network sharing might be due to
positioning as a capex savings tool,
though opex savings should follow.
• Green tech hype? Unlike sharing,
energy efficiency technologies are
most often positioned around opex
efficiencies; a limited focus from
operators suggests the messaging is
not having an impact.
Technologies that hold the most promise of driving opex savings
in network and service operations (top three choices)
20%14%
8%12% 11% 12%
9% 7% 7%
16%
13%
16% 11% 11% 11%
7% 8% 7%
19%
17%
14%11% 12% 10%
8% 7%2%
Ranked 3rd
Ranked 2nd
Ranked 1st

Network technology and cloudPublic cloud enthusiasm versus public cloud realism
• Public cloud on the mind. Half of
operators are unlikely to be already
deploying telecoms core functions on
public cloud, but it is clearly a current
focus.
• Public cloud without
virtualisation? Further questioning
public cloud adoption progress is the
weak showing for virtualisation;
moving functions to the cloud should
follow virtualisation.
• Virtual RAN maturity. Less
surprising is that virtual RAN is still in
the planning and testing phases
(given recent commercialisation).
• vRAN at smaller operators.
Operators with fewer than 50 million
connections are much more likely to
have no virtual RAN plans given the
maturity and current complexity.
4%
6%
8%
8%
10%
10%
12%
12%
20%
21%
27%
15%
19%
25%
25%
17%
21%
28%
39%
35%
28%
34%
40%
43%
18%
38%
32%
27%
19%
38%
26%
21%
18%
35%
22%
17%
9%
13%
11%
13%
4%
4%
18%
7%
3%
Open source and open networking technologies
DevOps / agile development
Virtual RAN
Small cells
Edge networking
Automation: network operations
Virtualisation / cloudification
Automation: network deployment
Use of public cloud for network functions
Commercial deployment: at scale Commercial deployment: initial Testing phase Planning phase No plans
Where are you in the process of adopting the following technologies?

Network technology and cloudSoftware in the cloud first
• Today’s cloud focus: service core,
operations, billing. Half of operators
claim to be migrating support for their
service core and OSS/BSS to the
public cloud.
• Tomorrow’s cloud focus:
everything. A majority of operators
see some level of support for moving
all network segments to the cloud.
• RAN confusion? Aspirations aside, it
is difficult to believe that 25% of
operators are already rolling out RAN
on the public cloud – though
“implementing” tests of vRAN on
public cloud may be realistic.
• Large operator vRAN momentum.
Operators with more than 100 million
connections are most likely to be
implementing public cloud vRAN and
least likely to have no plans.
25% 28%
49% 46%
37%
53%
39% 43%
38%
19%12% 11%
Radioaccess network
Packetcore network
Servicecore network
Operationsand billing
No plans
Planning toimplement
Alreadyimplementing
Migrating support for network segments to public cloud
resources

Network technology RoIAutomation delivers in RoI (despite opex expectations)
• Automation wins. Some 30%
ranked some form of automation as
the top technology for delivering a
solid RoI.
• But not for opex? When asked
about technologies that could deliver
opex savings, automation was not
highly ranked; it’s unclear if operators
fully understand what automation
can/should deliver.
• Small cell costs versus returns.
Small cells are used to improve
coverage and capacity and may be
critical with high-band 5G. They can
also, however, be costly to deploy.
• Ranking and priorities. Every
technology may deliver a solid RoI,
but operator assets and service
strategies will dictate which are seen
as most important at a given point.
Rank the following technologies in terms of their return
on investment (RoI)? (Top choice)
16%
14%
13% 13%
11%
10% 10%
9%
4%
0
2
4
6
8
10
12
14
16
18
Automation:Network
Deployment
Automation:Network
Operations
Virtual RAN Open Sourceand Open
NetworkingTechnologies
Virtualization /Cloudification
Use of PublicCloud forNetwork
Functions
DevOps / AgileDevelopment
EdgeNetworking
Small Cells

Network technology obstaclesLimited ecosystems and tech maturity dominate
• Automation and structural
barriers. Automation ranks highest
for RoI expectations, but also for
internal ownership as an obstacle,
likely since it can touch multiple parts
of the network.
• Public cloud options. Operators
might want to deploy functions on the
public cloud, but a limited number of
webscale players and vendors with
cloud-ready functions are holding
them back.
• Industry versus internal. Internal
obstacles (expertise/ownership) take
a backseat to industry ones
(ecosystem/maturity) for
virtualisation, edge and open
technologies; operators may be
waiting on vendors to solve their
problems.
What is the greatest obstacle to deploying the following technologies?
21%
13%
10%
13%
20%
22%
11%
17%
9%
24%
23%
16%
17%
19%
23%
22%
12%
16%
22%
22%
29%
23%
22%
25%
25%
18%
26%
11%
24%
25%
25%
15%
14%
22%
23%
16%
14%
11%
12%
15%
17%
10%
11%
20%
26%
8%
7%
8%
7%
7%
6%
9%
10%
7%
Virtualisation / cloudification
Virtual RAN
Use of public cloud for network functions
Small cells
Open source and open networkingtechnologies
Edge networking
DevOps / agile development
Automation: network operations
Automation: network deployment
Uncertain RoI Technology insufficiently mature
Limited vendor ecosystem Lack of internal expertise
Uncertain internal ownership / coordination Don't know

AI and automation use casesBuilding and securing networks takes precedence
• Security above all. More operators
highlight network security as the no.1
use case for AI and automation
(despite a less stellar top three
showing), in line with it being a top
network transformation priority.
• Network versus service. The relative
importance of deployment and planning
versus operations and service security
argues that automation is seen as pre-
launch focused or more important for
mature functions.
• Holistic spectrum confusion.
Spectrum is key to service launches
(and a top barrier to increased 5G
investment). A limited view on how AI
and automation can make the best use
of spectrum assets suggests narrow
operator thinking, or that vendor
marketing is lacking on this front.
Rank the following use cases for the application of artificial intelligence
and automation in your network (top three choices)
19%
13%
22%17% 16%
13%
17%
22%
14%
12% 16%19%
20% 20% 16%
18%15%
11%
Networkdeployment
Network planning Network security Networkoperations /maintenance
Service security Spectrummanagement
Ranked 1st Ranked 2nd Ranked 3rd

Automation opex expectationsGreat expectations from automation
• Automation optimism. 25% of
operators expect savings from
automation of 5% or less. Three
quarters expect upwards of 5%, with
a third expecting upwards of 16%.
• Savings versus experience.
Operators expecting no savings (4%)
may see automation as valuable in
terms of improved service
experience.
• Large-operator optimism. Almost
80% of operators with over 100
million connections expect opex
savings of more than 15%. Given the
complexity of managing a large
network, the value of operations
automation is an obvious line of logic.
• North American optimism. Nearly
50% of North American operators
expect opex savings of 16% or more
– greater than any other region.
What degree of opex savings do you expect network
automation to generate when fully deployed?
21% 40% 28% 7% 4%
0% 10% 20% 30% 40% 50% 60% 70% 80% 90% 100%
1
Chart Title
1% to 5% 6% to 15% 16% to 25% 25%+ Not expecting OpEx savings

Network technologies and opexResults by region
Technologies that hold the most promise of driving opex savings in network and service operations (top three
choices)
13%10%
15% 15%13%
8%5%
8%13%
13% 18%13%
8%8%
13%15% 10%
3%
23%13%
10%
10%13% 13%
8%8%
3%
Asia Pacific Ranked 3rd
Ranked 2nd
Ranked 1st
28%
17%11% 11% 11%
6% 6% 6% 6%
11%
17%22% 22%
17%
6% 6%
17%
17%11%
6%11%
22%
17%
Europe Ranked 3rd
Ranked 2nd
Ranked 1st

Network technologies and opexResults by region
Technologies that hold the most promise of driving opex savings in network and service operations
(top three choices)
11%
22%17%
11%17%
11% 11%
28% 6%11%
17%11%
17%11%
28%
33%
17%
6%
6%
6% 6%
Middle East and Africa Ranked 3rd
Ranked 2nd
Ranked 1st
40%
8% 8%12%
8%
16%
4% 4%
12%
16%20%
8%
4%16%
4%
8%12%
8%
20% 12%
28% 12%
4%
4%
8%4%
Americas Ranked 3rd
Ranked 2nd
Ranked 1st

Network technology adoptionResults by region – Asia Pacific
5%
5%
5%
8%
10%
10%
13%
18%
26%
31%
18%
33%
36%
21%
23%
13%
15%
33%
41%
33%
33%
33%
31%
26%
38%
15%
23%
15%
28%
15%
21%
26%
31%
31%
28%
15%
8%
15%
13%
3%
13%
10%
5%
23%
3%
Automation: network operations
Open source and open networking technologies
DevOps / agile development
Edge networking
Virtual RAN
Small cells
Automation: network deployment
Virtualisation / cloudification
Use of public cloud for network functions
Asia Pacific
Commercial deployment: at scale Commercial deployment: initial Testing phase Planning phase No plans
Where are you in the process of adopting the following technologies?

6%
11%
11%
17%
17%
28%
6%
28%
28%
11%
11%
28%
6%
39%
17%
28%
44%
28%
17%
39%
33%
50%
22%
44%
56%
28%
33%
44%
22%
28%
28%
22%
11%
11%
11%
22%
17%
Virtual RAN
Open source and open networking technologies
DevOps / agile development
Virtualisation / cloudification
Small cells
Automation: network deployment
Edge networking
Use of public cloud for network functions
Automation: network operations
Europe
Commercial deployment: at scale Commercial deployment: initial Testing phase Planning phase No plans
Network technology adoptionResults by region – Europe
Where are you in the process of adopting the following technologies?

Network technology adoptionResults by region – Middle East and Africa
6%
6%
6%
11%
11%
11%
22%
28%
22%
11%
17%
28%
17%
6%
22%
22%
33%
44%
28%
28%
56%
22%
61%
39%
33%
33%
22%
39%
22%
33%
22%
17%
22%
6%
11%
17%
28%
11%
17%
11%
Edge networking
Open source and open networking technologies
Virtual RAN
Small cells
Automation: network deployment
Virtualisation / cloudification
Automation: network operations
DevOps / agile development
Use of public cloud for network functions
Middle East and Africa
Commercial deployment: at scale Commercial deployment: initial Testing phase Planning phase No plans
Where are you in the process of adopting the following technologies?

4%
4%
8%
8%
8%
12%
12%
16%
16%
20%
36%
24%
20%
20%
16%
16%
20%
24%
48%
32%
20%
40%
40%
24%
52%
48%
28%
24%
24%
40%
28%
16%
44%
12%
8%
20%
4%
4%
8%
4%
16%
4%
8%
8%
12%
Small cells
Automation: network operations
Virtualisation / cloudification
Open source and open networking technologies
DevOps / agile development
Virtual RAN
Use of public cloud for network functions
Edge networking
Automation: network deployment
Americas
Commercial deployment: at scale Commercial deployment: initial Testing phase Planning phase No plans
Network technology adoptionResults by region – Americas
Where are you in the process of adopting the following technologies?

Network technology and cloudResults by region
44%
15% 18%8%
36%
56%41%
49%
21%
28%
41% 44%
Radio accessnetwork
Packet corenetwork
Service corenetwork
Operations andbilling
Asia Pacific
Alreadyimplemented
Planning toimplement
No plans
Migrating support for network segments to public cloud resources
28% 28%
6%
33%
50%
28%
33%
39%
22%
72%
61%
Radio accessnetwork
Packet corenetwork
Service corenetwork
Operations andbilling
Europe
Alreadyimplemented
Planning toimplement
No plans

Network technology and cloudResults by region
33%
11% 11%
28%
39%
61%
44%
44%
28% 28%
44%
28%
Radio accessnetwork
Packet corenetwork
Service corenetwork
Operations andbilling
Middle East and Africa
Alreadyimplemented
Planning toimplement
No plans
Migrating support for network segments to public cloud resources
40%
24%
12% 8%
40%
44%
40%40%
20%
32%
48% 52%
Radio accessnetwork
Packet corenetwork
Service corenetwork
Operations andbilling
Americas
Alreadyimplemented
Planning toimplement
No plans

Network technology RoIResults by region
Rank the following technologies in terms of their return on investment (RoI)?
13% 13%
8%
3%
21%
13%
8%
10%
13%
6%
11% 11%
6%
17% 17%
22%
11%
0%
11% 11%
0%
6%
17%
11% 11%
22%
11%12%
16% 16%
4%
8%
16%
4%
12% 12%
Virtualisation /cloudification
Virtual RAN Edge networking Small cells Automation: networkdeployment
Automation: networkoperations
Use of public cloudfor network functions
Open source andopen networking
technologies
DevOps / agiledevelopment
Ranked 1st
Asia Pacific Europe MEA Americas

Network technology obstaclesResults by region – Asia Pacific
What is the greatest obstacle to deploying the following technologies?
21%
13%
26%
13%
13%
18%
13%
15%
8%
26%
28%
36%
23%
10%
15%
13%
18%
18%
21%
15%
18%
21%
33%
18%
28%
23%
26%
13%
31%
10%
26%
15%
23%
28%
18%
23%
15%
8%
8%
13%
21%
18%
8%
21%
15%
5%
5%
3%
5%
8%
8%
10%
5%
10%
Virtualisation / cloudification
Virtual RAN
Edge networking
Small cells
Automation: network deployment
Automation: network operations
Use of public cloud for network functions
Open source and open networkingtechnologies
DevOps / agile development
Asia Pacific
Uncertain RoI Technology insufficiently mature Limited vendor ecosystem
Lack of internal expertise Uncertain internal ownership / coordination Don't know

Network technology obstaclesResults by region – Europe
What is the greatest obstacle to deploying the following technologies?
33%
11%
28%
11%
6%
17%
28%
22%
11%
28%
17%
11%
17%
22%
22%
33%
28%
28%
28%
22%
11%
17%
28%
28%
22%
11%
17%
6%
33%
11%
22%
22%
11%
22%
6%
11%
17%
22%
44%
22%
22%
11%
11%
6%
6%
11%
22%
6%
Virtualisation / Cloudification
Virtual RAN
Edge networking
Small cells
Automation: network deployment
Automation: network operations
Use of public cloud for network functions
Open source and open networking technologies
DevOps / agile development
Europe
Uncertain RoI Technology insufficiently mature Limited vendor ecosystem
Lack of internal expertise Uncertain internal ownership / coordination Don't know

Network technology obstaclesResults by region – Middle East and Africa
What is the greatest obstacle to deploying the following technologies?
11%
22%
17%
22%
11%
17%
11%
22%
17%
28%
17%
28%
17%
28%
11%
17%
22%
33%
11%
11%
28%
28%
17%
17%
17%
17%
11%
22%
28%
17%
17%
17%
22%
33%
22%
22%
22%
17%
6%
11%
28%
33%
11%
6%
11%
6%
6%
6%
6%
11%
11%
6%
Virtualisation / cloudification
Virtual RAN
Edge networking
Small cells
Automation: network deployment
Automation: network operations
Use of public cloud for network functions
Open source and open networking technologies
DevOps / agile development
Middle East and Africa
Uncertain RoI Technology insufficiently mature Limited vendor ecosystem
Lack of internal expertise Uncertain internal ownership / coordination Don't know

Network technology obstaclesResults by region – Americas
What is the greatest obstacle to deploying the following technologies?
20%
8%
16%
8%
4%
16%
12%
20%
4%
28%
16%
4%
12%
16%
16%
16%
16%
12%
28%
36%
32%
24%
32%
20%
40%
20%
36%
16%
24%
24%
20%
24%
16%
8%
20%
12%
12%
12%
16%
20%
12%
12%
24%
12%
12%
12%
12%
16%
8%
12%
4%
12%
16%
Virtualisation / cloudification
Small cells
Edge networking
Small cells
Automation: network deployment
Automation: network operations
Use of public cloud for network functions
Open source and open networking technologies
DevOps / agile development
Americas
Uncertain RoI Technology insufficiently mature Limited vendor ecosystem
Lack of internal expertise Uncertain internal ownership / coordination Don't know

28%26%
10%
21%
8% 8%
10%10%
23%
18%
21%18%
18%21%
23%15%
13%
10%
Network security Network operations andmaintenance
Network deployment Service security Network planning Spectrum management
Asia Pacific
Ranked 3rd
Ranked 2nd
Ranked 1st
AI and automation use casesResults by region – Asia Pacific
Rank the following use cases for the application of artificial intelligence and automation in your network
(top three choices)

AI and automation use casesResults by region – Europe
Rank the following use cases for the application of artificial intelligence and automation in your network
(top three choices)
22%28%
17%
6%
17%11%
28% 17%
22%
28%0%
6%
17%
11%
11%17%
28%
17%
Network deployment Network planning Network security Spectrum management Service security Network operations andmaintenance
Europe
Ranked 3rd
Ranked 2nd
Ranked 1st

AI and automation use casesResults by region – Middle East and Africa
Rank the following use cases for the application of artificial intelligence and automation in your network
(top three choices)
11%
28%
17%22%
17%
6%
22%
17%
22%
0%17%
22%
33% 11%
11%
22%
11%
11%
Network planning Network operations andmaintenance
Spectrum management Network deployment Network security Service security
Middle East and Africa
Ranked 3rd
Ranked 2nd
Ranked 1st

AI and automation use casesResults by region – Americas
Rank the following use cases for the application of artificial intelligence and automation in your network
(top three choices)
12%
28%
20%24%
16%
0%
28%
12%
12%
12%
20%
16%
28%
16%
20%8% 8%
20%
Network planning Network deployment Network security Spectrum management Service security Network operations andmaintenance
Americas
Ranked 3rd
Ranked 2nd
Ranked 1st
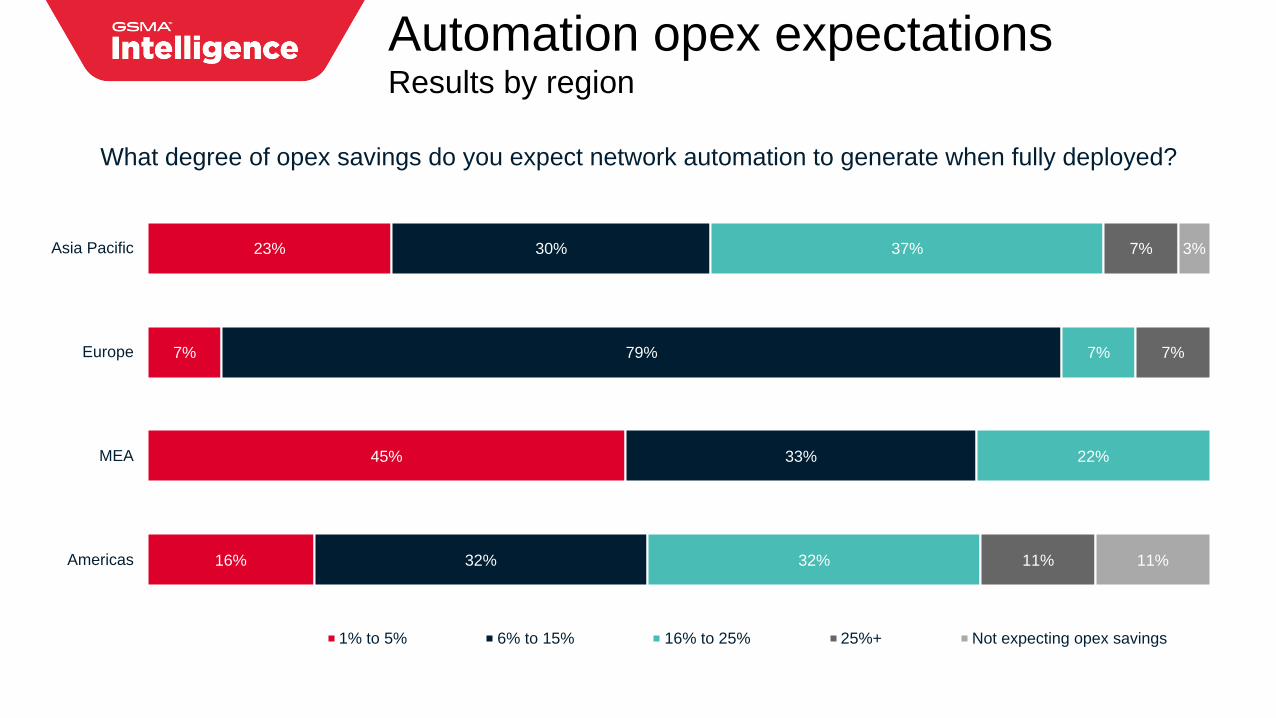
Automation opex expectationsResults by region
23%
7%
45%
16%
30%
79%
33%
32%
37%
7%
22%
32%
7%
7%
11%
3%
11%
Asia Pacific
Europe
MEA
Americas
1% to 5% 6% to 15% 16% to 25% 25%+ Not expecting opex savings
What degree of opex savings do you expect network automation to generate when fully deployed?

Network technologies and opexResults by operator size (by number of connections)
Technologies that hold the most promise of driving opex savings in network and service operations
(top three choices)
28%22%
11% 11%17%
6%0%
6%
17%
17%
22%
11%6%
11%
11%6%
17%
17%
11%
11%6%
11%
11%
11%6%
Under 10 million Ranked 3rd
Ranked 2nd
Ranked 1st
19% 16% 19% 19%
7%12%
7%2%
16%16% 14%
2%
14%
12%
12%
9%
5%
26%
21%
5%
16% 16%
5%
7%
5%
10 million to 49.9 million Ranked 3rd
Ranked 2nd
Ranked 1st

Network technologies and opexResults by operator size (by number of connections)
25%
13% 13%
0%
13% 13%8% 8% 8%
21%
17%
8%
21%
8%4%
4%
17%
0%
13%
17% 17%13%
13%17%
13%
50 million to 100 million Ranked 3rd
Ranked 2nd
Ranked 1st
20%
27% 27%
7%
13%
7%
0% 0% 0%
13%
13% 13%
27%
7%
13%
0%
13%
0%
27% 13% 13%
7%
13%
20%
7%
Over 100 million Ranked 3rd
Ranked 2nd
Ranked 1st
Technologies that hold the most promise of driving opex savings in network and service operations
(top three choices)

Network technology adoptionResults by operator size (by number of connections)
6%
6%
11%
11%
11%
11%
17%
28%
44%
22%
39%
17%
11%
22%
11%
11%
11%
33%
17%
28%
33%
44%
28%
61%
56%
22%
22%
44%
17%
22%
33%
28%
6%
11%
33%
11%
11%
17%
11%
11%
6%
6%
DevOps / agile development
Virtualisation / cloudification
Use of public cloud for network functions
Virtual RAN
Small cells
Automation: network deployment
Open source and open networking technologies
Automation: network operations
Edge networking
Under 10 million
Commercial deployment: at scale Commercial deployment: initial Testing phase Planning phase No plans
Where are you in the process of adopting the following technologies?

Network technology adoptionResults by operator size (by number of connections)
2%
2%
5%
7%
12%
12%
12%
21%
26%
21%
28%
12%
19%
16%
26%
19%
30%
35%
46%
44%
35%
37%
14%
16%
37%
32%
28%
28%
23%
28%
21%
37%
30%
28%
16%
12%
2%
2%
21%
16%
21%
16%
5%
Open source and open networking technologies
Edge networking
Automation: network operations
Small cells
DevOps / agile development
Virtualisation / cloudification
Virtual RAN
Automation: network deployment
Use of public cloud for network functions
10 million to 49.9 million
Commercial deployment: at scale Commercial deployment: initial Testing phase Planning phase No plans
Where are you in process of adopting the following technologies?

Network technology adoptionResults by operator size (by number of connections)
4%
8%
13%
13%
13%
17%
17%
17%
21%
4%
4%
25%
38%
21%
17%
29%
29%
13%
42%
46%
50%
25%
29%
21%
33%
29%
42%
46%
42%
4%
13%
17%
21%
13%
17%
25%
4%
8%
13%
21%
25%
8%
8%
Virtual RAN
Open source and open networking technologies
Edge networking
Small cells
DevOps / agile development
Virtualisation / cloudification
Automation: network deployment
Automation: network operations
Use of public cloud for network functions
50 million to 100 million
Commercial deployment: at scale Commercial deployment: initial Testing phase Planning phase No plans
Where are you in process of adopting the following technologies?

Network technology adoptionResults by operator size (by number of connections)
7%
7%
7%
13%
13%
33%
47%
40%
53%
20%
13%
13%
27%
33%
33%
13%
40%
27%
33%
60%
27%
47%
20%
67%
27%
13%
13%
33%
13%
40%
13%
7%
13%
7%
7%
7%
7%
7%
Virtual RAN
Open source and open networking technologies
DevOps / agile development
Edge networking
Small cells
Automation: network deployment
Virtualisation / cloudification
Automation: network operations
Use of public cloud for network functions
Over 100 million
Commercial deployment: at scale Commercial deployment: initial Testing phase Planning phase No plans
Where are you in process of adopting the following technologies?

Network technology and cloudResults by operator size (by number of connections)
44%
11% 11%6%
39%
44%39% 50%
17%
45%50%
44%
Radio accessnetwork
Packet corenetwork
Service corenetwork
Operations andbilling
Under 10 million
Alreadyimplemented
Planning toimplement
No plans
Migrating support for network segments to public cloud resources
37%
26%
4%9%
35% 56%
40%
44%
28%
19%
56%47%
Radio accessnetwork
Packet corenetwork
Service corenetwork
Operations andbilling
10 million to 49.9 million
Alreadyimplemented
Planning toimplement
No plans

Network technology and cloudResults by operator size (by number of connections)
37%
13%21%
12%
42%
54%29% 50%
21%
33%
50%
38%
Radio accessnetwork
Packet corenetwork
Service corenetwork
Operations andbilling
50 million to 100 million
Alreadyimplemented
Planning toimplement
No plans
Migrating support for network segments to public cloud resources
33%
20% 20% 20%
33%53% 53%
20%
34%27% 27%
60%
Radio accessnetwork
Packet corenetwork
Service corenetwork
Operations andbilling
Over 100 million
Alreadyimplemented
Planning toimplement
No plans

Network technology RoIResults by operator size (by number of connections)
Rank the following technologies in terms of their return on investment (RoI)?
6%
11%
6% 6%
11%
28%
6%
17%
11%
16%
14%
0%
2%
19%
14%
7%
14% 14%
4%
21% 21%
8%
17%
0%
21%
8%
0%
13%
0%
20%
0%
13%
20%
7%
13% 13%
Virtualisation /cloudification
Virtual RAN Edge networking Small cells Automation: networkdeployment
Automation: networkoperations
Use of public cloudfor network functions
Open source andopen networking
technologies
DevOps / agiledevelopment
Ranked 1st
Under 10 million 10 million to 49.9 million 50 million to 100 million Over 100 million

Network technology obstaclesResults by operator size (by number of connections)
What is the greatest obstacle to deploying the following technologies?
17%
11%
6%
11%
22%
22%
17%
11%
17%
17%
28%
11%
17%
11%
11%
22%
22%
33%
28%
22%
28%
44%
17%
33%
11%
11%
11%
11%
17%
17%
6%
28%
28%
11%
22%
11%
17%
17%
33%
17%
11%
22%
17%
11%
17%
11%
11%
6%
11%
6%
17%
17%
Virtualisation / cloudification
Virtual RAN
Edge networking
Small cells
Automation: network deployment
Automation: network operations
Use of public cloud for network functions
Open source and open networking technologies
DevOps / agile development
Under 10 million
Uncertain RoI Technology insufficiently mature Limited vendor ecosystem
Lack of internal expertise Uncertain internal ownership / coordination Don't know

Network technology obstaclesResults by operator size (by number of connections)
What is the greatest obstacle to deploying the following technologies?
19%
19%
23%
19%
7%
12%
7%
23%
9%
23%
19%
23%
19%
11%
7%
16%
16%
21%
25%
25%
26%
18%
23%
23%
21%
21%
33%
14%
24%
14%
28%
19%
21%
23%
21%
23%
12%
5%
5%
5%
32%
26%
19%
12%
5%
7%
9%
9%
12%
7%
11%
14%
7%
9%
Virtualisation / cloudification
Virtual RAN
Edge networking
Small cells
Automation: network deployment
Automation: network operations
Use of public cloud for network functions
Open source and open networking technologies
DevOps / agile development
10 million to 49.9 million
Uncertain RoI Technology insufficiently mature Limited vendor ecosystem
Lack of internal expertise Uncertain internal ownership / coordination Don't know

Network technology obstaclesResults by operator size (by number of connections)
What is the greatest obstacle to deploying the following technologies?
25%
4%
38%
13%
13%
21%
8%
21%
8%
21%
29%
17%
17%
17%
13%
13%
17%
21%
17%
17%
29%
25%
21%
4%
38%
29%
17%
8%
29%
4%
29%
17%
29%
25%
13%
25%
17%
21%
13%
17%
25%
21%
17%
17%
21%
13%
8%
13%
4%
8%
Virtualisation / cloudification
Virtual RAN
Edge networking
Small cells
Automation: network deployment
Automation: network operations
Use of public cloud for network functions
Open source and open networking technologies
DevOps / agile development
50 million to 100 million
Uncertain RoI Technology insufficiently mature Limited vendor ecosystem
Lack of internal expertise Uncertain internal ownership / coordination Don't know

Network technology obstaclesResults by operator size (by number of connections)
What is the greatest obstacle to deploying the following technologies?
27%
13%
13%
13%
7%
20%
7%
13%
20%
40%
33%
27%
20%
27%
27%
27%
27%
27%
7%
13%
20%
27%
20%
27%
33%
27%
33%
7%
33%
27%
20%
20%
13%
27%
7%
13%
20%
7%
13%
20%
20%
13%
27%
7%
7%
7%
Virtualisation / cloudification
Virtual RAN
Edge networking
Small cells
Automation: network deployment
Automation: network operations
Use of public cloud for network functions
Open source and open networking technologies
DevOps / agile development
Over 100 million
Uncertain RoI Technology insufficiently mature Limited vendor ecosystem
Lack of internal expertise Uncertain internal ownership / coordination Don't know

AI and automation use casesResults by operator size (by number of connections)
28%33%
11% 11%6%
11%
28%22%
6%
17%22%
6%
22%
11%
33% 11% 11%
11%
Network deployment Service security Network security Network operations andmaintenance
Network planning Spectrum management
Under 10 million
Ranked 3rd
Ranked 2nd
Ranked 1st
Rank the following use cases for the application of artificial intelligence and automation in your network
(top three choices)

AI and automation use casesResults by operator size (by number of connections)
19%23% 21%
16%12% 9%
23%19%
7% 19%23%
9%
19% 16%
21%14%
9%
21%
Network planning Network security Network operations andmaintenance
Service security Spectrum management Network deployment
10 million to 49.9 million
Ranked 3rd
Ranked 2nd
Ranked 1st
Rank the following use cases for the application of artificial intelligence and automation in your network
(top three choices)

AI and automation use casesResults by operator size (by number of connections)
25%
17%
29%
4%
17%
8%
8%29%
13%
25%
17%
8%
25%
13%
13%
25%
8%
17%
Network deployment Spectrum management Network security Network planning Network operations andmaintenance
Service security
50 million to 100 million
Ranked 3rd
Ranked 2nd
Ranked 1st
Rank the following use cases for the application of artificial intelligence and automation in your network
(top three choices)

AI and automation use casesResults by operator size (by number of connections)
27%20%
13%7%
20%13%
40%
13%
13%
13%
13%
7%
7%
27%33%
20%0%
13%
Network deployment Network planning Network operations andmaintenance
Service security Network security Spectrum management
Over 100 million
Ranked 3rd
Ranked 2nd
Ranked 1st
Rank the following use cases for the application of artificial intelligence and automation in your network
(top three choices)

Automation opex expectationsResults by operator size (by number of connections)
24%
18%
29%
11%
41%
47%
41%
11%
34%
19%
29%
56%
9%
22%
8%
Under 10 million
10 million to 49.9 million
50 million to 100 million
Over 100 million
1% to 5% 6% to 15% 16% to 25% 25%+ Not expecting opex savings
What degree of opex savings do you expect network automation to generate when fully deployed?

1 Executive summary
2 Network transformation priorities and spending
3 Network transformation technologies
4 Network solution and vendor strategies
5 5G network strategies and concerns

In numbers: network solution and
vendor strategies
57%
Network security is a top network
transformation priority; it’s logical
that most operators (57%) also see
it as an important vendor criteria.
20%
Only a minor share of operators
don’t feel it’s important to integrate
new suppliers into their network
infrastructure.
65%
In working to engage new network
vendors, around two thirds of
operators will look to work with
larger systems suppliers.
32%
Vendor references have long been
a supplier evaluation (and
marketing) tool; less than a third of
operators rank them as important.
71%
Network security concerns rate
highest as an obstacle to new
supplier integration, highlighted by
most operators.
56%
Just over half of operators are likely
to work with start-ups as new
suppliers; the door is open for both
large and small players.

Survey detailsSample sizes
Segment Sample size
Total 100
Region
Asia Pacific 39
Europe 18
Middle East and Africa 18
Americas 25
Organisation size (by connections)
Fewer than 10 million 18
10 million to 49.9 million 43
50 million to 99.9 million 24
Over 100 million 15

Network solution prioritiesSecurity is top of mind; pricing is surprising
• Foundational security. As network
threat vectors proliferate, putting security
first is understandable, with recent
concerns around vendor security an
important backdrop.
• Cost (of ownership)? Few operators
would suggest they select solutions
purely based on cost, but it is an
important consideration. Large operators
(100+ million connections) see it as less
important, though.
• Marketing loses. References and
product innovation are traditional vendor
marketing tools – but rank low.
• Large operator security expertise. Of
operators claiming security as important,
those with 100+ million connections were
least likely to highlight it as top,
potentially trusting their internal security
processes/assets.
What are the most important factors in purchasing a
given network product or solution?
21% 19%
11%15% 15%
10% 9%
17%
15%
23%11% 10%
14%
10%
19%
14%11%
18%
12% 13%
13%
Securitycredentials
Cost Productperformance
E2E solutions Productinnovation
Vendorincumbency
Vendorreferences
Ranked 3rd
Ranked 2nd
Ranked 1st

Network priorities: new suppliersSupply chain diversity cannot be ignored
• Vendor diversity imperative.
Supplier diversity is only slightly less
important than open source
technologies; only 20% see it as
unimportant, likely focused on
consolidation and security concerns.
• Priorities versus actions. It is not
clear how operators will prioritise
vendor introductions; other priorities
(price, security, etc.) will also play a
part.
• Large operators on board. Roughly
50% of large operators feel it is
important to add new suppliers. More
significantly, none claim it is not.
• Small operators expect 5G to be
different. While a third of small
operators see new vendor
introductions as important, 75%
expect to include them in 5G builds,
making 5G a turning point.
How important is it for you to introduce new product or technology
vendors into your network?
5% 15% 28% 31% 21%
Not at all important Moderately unimportant Neither important or unimportant
Moderately important Extremely important

Network priorities: open networksOperators are “open” to change in their networks
• Open source imperative. Some
56% of operators claim it is important
to integrate open source technologies
into their network sourcing
processes. More importantly, less
than 20% think it is not important.
• Priorities versus actions. While
open source is deemed to be
important, almost two thirds currently
claim to be in the testing or planning
phase with open networking
technologies. How quickly that
transitions to commercial deployment
will depend on competing priorities.
• Universal agreement. Across all
operator sizes, the importance of
open networking technologies is seen
as similar. Whether or not they all
have the ability to deploy it, all sizes
of operators understand the critical
nature of open networking.
How important is it for you to integrate open source and
open networking technologies into your network?
4% 14% 26% 33% 23%
Not at all important Moderately unimportant Neither important or unimportant
Moderately important Extremely important

New suppliers: size preferenceLarge system suppliers offer stability
• Large versus small. Some 56% of
operators say they would likely
engage startup vendors when
sourcing new suppliers. This jumps to
65% for large system suppliers,
signalling a focus on stability and
size.
• No startup opposition. The
preference for large vendors aside,
only 15% of operators said they
would be unlikely to work with
startups.
• Guided by ecosystem. Vendor
decisions will be shaped by
ecosystem dynamics; a lack of
startups in one segment, for example,
will dictate supplier choice.
• Small likes small. Operators with
fewer than 10 million connections are
more likely to engage startups; if their
size allows nimble sourcing, this
would be a logical outcome.
In engaging new network vendors, which types of
vendors are you most likely to engage with?
34%
25%
31%
31%
26%
29%
7%
14%
2%
1%
0% 10% 20% 30% 40% 50% 60% 70% 80% 90% 100%
Large system suppliers
Smaller startups
Very likely Somewhat likely Neither likely or unlikely Somewhat unlikely Very unlikely

New suppliers: product prioritiesSoftware solutions are easiest
• New services = new suppliers. As
operators drive new services over
their networks (5G, in particular)
service core and OSS/BSS vendors
should benefit.
• Open RAN uncertainty? Only 24%
of operators see the RAN as a major
opportunity for new suppliers. Either
interest in RAN innovations is limited
or operators expect that RAN
evolutions combined with vendor
additions could be difficult.
• NG core evolution. Less than half of
operators think it is likely that they
would look at new suppliers in the
packet core, potentially a function of
product architectures which allow
today’s solutions to (supposedly
seamlessly) support future
technology generations.
In engaging new network vendors, which types of
products are you most likely to procure?
41%
33%
24%
32%
19%
32%
38%
41%
28%
30%
21%
18%
30%
25%
34%
6%
8%
3%
8%
11%
3%
2%
7%
6%
0% 10% 20% 30% 40% 50% 60% 70% 80% 90% 100%
Service core
Billing and operations
Radio access network
Transport
Packet core
Very likely Somewhat likely Neither likely or unlikely Somewhat unlikely Very unlikely

Obstacles: new suppliersProcess and security concerns dominate
• Fear of the unknown (security).
Security was a top-ranked purchasing
priority for network solutions; it is only
natural for it to be a concern when
engaging new (unfamiliar) suppliers.
• New vendors, current processes.
Inertia around existing processes
(integration, admin) and the costs
involved in changing them represent
the biggest set of obstacles.
• Cultural optimism? Operators may
believe that their culture encourages
using new suppliers, but concerns
around processes suggest they may
be incorrect.
• “Big” admin problems. Admin
issues may be an obstacle for 49% of
operators overall but were highlighted
by 73% of operators with more than
100 million connections.
What are the primary obstacles to introducing new
vendors into your network?
71%
58%54%
49%
37%
18%
13%
Networksecurity
concerns
RoIexpectations
Integrationissues
Administrativeissues
Reliabilityissues
Corporateculture
Regulatoryissues
Multiple responses accepted; chart total adds up to more than 100%

Obstacles: open networkingProcess and security concerns dominate, again
• Fear of the unknown – part 2. As
with new supplier introduction,
security ranks highest, likely a
function of operators building out their
familiarity with the technologies.
• Processes – part 2. A focus on
integration and administration points
to process potentially holding back
open technologies.
• RoI versus new suppliers.
Operators see RoI expectations as
less of a concern for open networking
than for introducing new suppliers,
logically following IT transformation
priorities.
• No regulation? Where “open”
technologies could impact network
security or reliability (or be used to
drive supply chain diversity), it is
surprising that so few operators see
regulation as an obstacle.
What are the primary obstacles to introducing open source / open
networking technologies in your network?
66%
55%
49%
44%
37%
12%
5%
Networksecurity
concerns
Integrationissues
Administrativeissues
RoIexpectations
Reliabilityissues
Corporateculture
Regulatoryissues
Multiple responses accepted, chart total adds up to more than 100%

Network solution prioritiesResults by region
33%
18%
8%
15%
8%13%
5%
13%
10%
23% 8% 23% 15%
8%
13%
21% 15%
21% 8%
5%
18%
Security credentials Cost Product performance Product innovation Vendor incumbency E2E solutions Vendor references
Asia Pacific
Ranked 3rd
Ranked 2nd
Ranked 1st
What are the most important factors in purchasing a given network product or solution?
(Top three choices)

Network solution prioritiesResults by region
17%11%
22%
11%
22%
11%6%
33%
17%
17%
6%
11%
6%11%
6%
28%11%
33%
11% 11%
Product performance Security credentials Cost E2E solutions Vendor references Product innovation Vendor incumbency
Europe
Ranked 3rd
Ranked 2nd
Ranked 1st
What are the most important factors in purchasing a given network product or solution?
(Top three choices)

Network solution prioritiesResults by region
11%17% 17% 17%
6%
22%
11%
22%
28%
6%
17%
22%
0%
6%
28%11%
22%6%
11%
11%
11%
Security credentials Cost Vendor incumbency Product performance Vendor references E2E solutions Product innovation
Middle East and Africa
Ranked 3rd
Ranked 2nd
Ranked 1st
What are the most important factors in purchasing a given network product or solution?
(Top three choices)

Network solution prioritiesResults by region
16% 16%20% 20%
8%12%
8%
16%20% 12%
20%
20%8%
4%
32%
16%
8%12%
16%
16%
E2E solutions Security credentials Cost Product innovation Product performance Vendor incumbency Vendor references
Americas
Ranked 3rd
Ranked 2nd
Ranked 1st
What are the most important factors in purchasing a given network product or solution?
(Top three choices)

Network priorities: new suppliersResults by region
22%
6%
18%
6%
22%
12%
31%
28%
28%
24%
33%
28%
33%
28%
18%
17%
11%
36%
Asia Pacific
Europe
MEA
Americas
Not at all important Moderately unimportant Neither important or unimportant Moderately important Extremely important
How important is it for you to introduce new product or technology vendors
(vendors you are not currently working with) into your network?

Network priorities: open networksResults by region
8%
4%
13%
11%
17%
16%
28%
28%
28%
20%
28%
33%
44%
32%
23%
28%
11%
28%
Asia Pacific
Europe
MEA
Americas
Not at all important Moderately unimportant Neither important or unimportant Moderately important Extremely important
How important is it for you to integrate open source and open networking technologies into your network?

New suppliers: size preferenceResults by region
In engaging new network vendors, which types of vendors and products are you most likely to introduce into
your network?
36%
33%
36%
39%
26%
10%
2%
15%3%
0% 20% 40% 60% 80% 100%
Large, system suppliers
Smaller start-ups and specialists
Asia Pacific
Very likely Somewhat likely Neither likely or unlikely
Somewhat unlikely Very unlikely
33%
22%
33%
33%
28%
28% 17%
6%
0% 20% 40% 60% 80% 100%
Large, system suppliers
Smaller start-ups and specialists
Europe
Very likely Somewhat likely Neither likely or unlikely
Somewhat unlikely Very unlikely

New suppliers: size preferenceResults by region
In engaging new network vendors, which types of vendors and products are you most likely to introduce into your
network?
33%
11%
28%
17%
22%
72%
11%6%
0% 20% 40% 60% 80% 100%
Large, system suppliers
Smaller start-ups and specialists
Middle East and Africa
Very likely Somewhat likely Neither likely or unlikely
Somewhat Unlikely Very unlikely
32%
24%
24%
28%
28%
28%
16%
20%
0% 20% 40% 60% 80% 100%
Large, system suppliers
Smaller start-ups and specialists
Americas
Very likely Somewhat likely Neither likely or unlikely
Somewhat unlikely Very unlikely

New suppliers: product prioritiesResults by region
In engaging new network vendors, which types of products are you most likely to procure?
15%
41%
38%
31%
18%
28%
31%
23%
44%
49%
38%
18%
23%
15%
28%
10%
10%
5%
3%
3%
8%
10%
8%
3%
0% 20% 40% 60% 80% 100%
Packet core
Service core
Transport
Billing and operations
Radio access network
Asia Pacific
Very likely Somewhat likely Neither likely or unlikely
Somewhat unlikely Very unlikely
17%
28%
28%
44%
22%
39%
39%
33%
39%
39%
28%
22%
28%
6%
39%
11%
11%
6%
11%
6%
6%
0% 20% 40% 60% 80% 100%
Packet core
Service core
Transport
Billing and operations
Radio access network
Europe
Very likely Somewhat likely Neither likely or unlikely
Somewhat unlikely Very unlikely

New suppliers: product prioritiesResults by region
In engaging new network vendors, which types of products are you most likely to procure?
11%
33%
22%
39%
28%
28%
22%
22%
17%
22%
50%
44%
39%
28%
39%
6%
6%
17%
6%
6%
11%
6%
0% 20% 40% 60% 80% 100%
Packet core
Service core
Transport
Billing and operations
Radio access network
Middle East and Africa
Very likely Somewhat likely Neither likely or unlikely
Somewhat unlikely Very unlikely
32%
56%
32%
24%
32%
28%
36%
36%
44%
44%
20%
8%
16%
24%
20%
16%
16%
8%
4%
4%
0% 20% 40% 60% 80% 100%
Packet core
Service core
Transport
Billing and operations
Radio access network
Americas
Very likely Somewhat likely Neither likely or unlikely
Somewhat unlikely Very unlikely

Obstacles: new suppliersResults by region
What are the primary obstacles to introducing new vendors into your network?
56%
51%
36%
13%15%
77%
46%
56% 56%
28%
22%
11%
56%
72%
28%
39%
44%
28%
17%
89%
56%
68%
48%
40%
16%
8%
60%
68%
Integration issues Administrative issues Reliability issues Corporate culture Regulatory issues Network security RoI expectations
Asia Pacific Europe MEA Americas
Multiple responses accepted; chart total adds up to more than 100%

Obstacles: open networkingResults by region
51%49%
46%
10% 10%
72%
36%
50% 50%
44%
6% 6%
67%
39%
50%
33%
17% 17%
0%
61%
56%
68%
60%
32%
16%
0%
60%
52%
Integration issues Administrative issues Reliability issues Corporate culture Regulatory issues Network security RoI expectations
Asia Pacific Europe MEA Americas
What are the primary obstacles to introducing open source / open networking technologies in your network?
Multiple responses accepted; chart total adds up to more than 100%

Network solution prioritiesResults by operator size (by number of connections)
33%
6% 6%
22%
11%17%
6%
28%
28%22%
6%
6%0%
11%
22%
17%
17%11%
17%11%
6%
Security credentials Product performance Cost E2E solutions Vendor incumbency Vendor references Product innovation
Under 10 million
Ranked 3rd
Ranked 2nd
Ranked 1st
What are the most important factors in purchasing a given network product or solution?
(Top three choices)

Network solution prioritiesResults by operator size (by number of connections)
19% 19%
12%
21%16%
9%5%
12%
19%
12%
7% 16%
16%
19%
19%9%
23% 14%9%
14%
12%
Security credentials Cost E2E solutions Product innovation Product performance Vendor incumbency Vendor references
10 million to 49.9 million Ranked 3rd
Ranked 2nd
Ranked 1st
What are the most important factors in purchasing a given network product or solution?
(Top three choices)

Network solution prioritiesResults by operator size (by number of connections)
33%
21%
13%8%
13%
4%8%
8%
21%
17% 25%
8%
17%4%
25%
13%
17% 8%
17%13%
8%
Cost Security credentials Product innovation Product performance E2E solutions Vendor incumbency Vendor references
50 million to 100 million
Ranked 3rd
Ranked 2nd
Ranked 1st
What are the most important factors in purchasing a given network product or solution?
(Top 3 choices)

Network solution prioritiesResults by operator size (by number of connections)
20%
13%
7%
13%
20%
13% 13%
20%
13%
33%
7%
13%
7% 7%
13%
27%
13%
27%
7%
7% 7%
E2E solutions Security credentials Product performance Vendor references Vendor incumbency Cost Product innovation
Over 100 million
Ranked 3rd
Ranked 2nd
Ranked 1st
What are the most important factors in purchasing a given network product or solution?
(Top three choices)

Network priorities: new suppliersResults by operator size (by number of connections)
7%
8%
39%
16%
4%
28%
23%
25%
47%
28%
30%
38%
27%
6%
23%
25%
27%
Under 10 million
10 million to 49.9 million
50 million to 100 million
Over 100 million
Not at all important Moderately unimportant Neither important or unimportant Moderately important Extremely important
How important is it for you to introduce new product or technology vendors
(vendors you are not currently working with) into your network?

Network priorities: open networksResults by operator size (by number of connections)
How important is it for you to integrate open source and open networking technologies into your network?
7%
7%
22%
12%
17%
7%
22%
28%
25%
27%
28%
35%
29%
40%
28%
19%
29%
20%
Under 10 million
10 million to 49.9 million
50 million to 100 million
Over 100 million
Not at all important Moderately unimportant Neither important or unimportant Moderately important Extremely important

New suppliers: size preferenceResults by operator size (by number of connections)
In engaging new network vendors, which types of vendors and products are you most likely to introduce into your
network?
33%
44%
39%
22%
22%
17%
6%
17%
0% 20% 40% 60% 80% 100%
Large system suppliers
Smaller start-ups and specialists
Under 10 million
Very likely Somewhat likely Neither likely or unlikely
Somewhat unlikely Very unlikely
32%
16%
28%
39%
31%
33%
9%
12%
0% 20% 40% 60% 80% 100%
Large system suppliers
Smaller start-ups and specialists
10 million to 49.9 million
Very likely Somewhat likely Neither likely or unlikely
Somewhat unlikely Very unlikely

New suppliers: size preferenceResults by operator size (by number of connections)
In engaging new network vendors, which types of vendors and products are you most likely to introduce into your
network?
29%
25%
42%
29%
25%
25%
4%
17% 4%
0% 20% 40% 60% 80% 100%
Large, system suppliers
Smaller start-ups and specialists
50 million to 100 million
Very likely Somewhat likely Neither likely or unlikely
Somewhat unlikely Very unlikely
47%
27%
13%
20%
20%
40%
7%
13%
13%
0% 20% 40% 60% 80% 100%
Large, system suppliers
Smaller start-ups and specialists
Over 100 million
Very likely Somewhat likely Neither likely or unlikely
Somewhat unlikely Very unlikely

New suppliers: product prioritiesResults by operator size (by number of connections)
In engaging new network vendors, which types of vendors and products are you most likely to introduce into your
network?
39%
44%
33%
33%
22%
33%
28%
22%
44%
50%
17%
28%
6%
22%
28%
6%
28%
6%
11%
0% 20% 40% 60% 80% 100%
Packet core
Service core
Transport
Billing and operations
Radio access network
Under 10 million
Very likely Somewhat likely Neither likely or unlikely
Somewhat unlikely Very unlikely
9%
39%
40%
33%
19%
37%
30%
28%
35%
44%
40%
23%
28%
21%
30%
10%
7%
2%
9%
5%
5%
2%
2%
2%
0% 20% 40% 60% 80% 100%
Packet core
Service core
Transport
Billing and operations
Radio access network
10 million to 49.9 million
Very likely Somewhat likely Neither likely or unlikely
Somewhat unlikely Very unlikely

New suppliers: product prioritiesResults by operator size (by number of connections)
In engaging new network vendors, which types of vendors and products are you most likely to introduce into your
network?
29%
50%
25%
29%
33%
8%
38%
29%
42%
29%
46%
8%
33%
13%
38%
13%
4%
8%
8%
4%
4%
8%
0% 20% 40% 60% 80% 100%
Packet core
Service core
Transport
Billing and operations
Radio access network
50 million to 100 million
Very likely Somewhat likely Neither likely or unlikely
Somewhat unlikely Very unlikely
7%
27%
20%
40%
27%
40%
33%
33%
33%
40%
20%
27%
27%
13%
20%
20%
13%
13%
7%
13%
20%
7%
0% 20% 40% 60% 80% 100%
Packet core
Service core
Transport
Billing and operations
Radio access network
Over 100 million
Very likely Somewhat likely Neither likely or unlikely
Somewhat unlikely Very unlikely

Obstacles: new suppliersResults by operator size (by number of connections)
What are the primary obstacles to introducing new vendors into your network?
56%
33%
44%
17%
0%
89%
50%54%
47%
33%
16%19%
61%
54%54%50%
46%
17%
8%
75%
67%
53%
73%
27% 27%
20%
73%
67%
Integration issues Administrative issues Reliability issues Corporate culture Regulatory issues Network security RoI expectations
Under 10 million 10 million to 49.9 million 50 million to 100 million Over 100 million
Multiple responses accepted; chart total adds up to more than 100%

Obstacles: open networkingResults by operator size (by number of connections)
What are the primary obstacles to introducing open source or open networking technologies into your network?
61%
50%
33%
17%
6%
56%
50%
56%
46%
39%
7% 7%
65%
44%42%
58%
46%
17%
4%
79%
38%
67%
40%
20%
13%
0%
60%
47%
Integration issues Administrative issues Reliability issues Corporate culture Regulatory issues Network security RoI expectations
Under 10 million 10 million to 49.9 million 50 million to 100 million Over 100 million
Multiple responses accepted; chart total adds up to more than 100%

1 Executive summary
2 Network transformation priorities and spending
3 Network transformation technologies
4 Network solution and vendor strategies
5 5G network strategies and concerns

Survey detailsSample sizes
Segment Sample size
Total 100
Region
Asia Pacific 39
Europe 18
Middle East and Africa 18
Americas 25
Organisation size (by connections)
Fewer than 10 million 18
10 million to 49.9 million 43
50 million to 99.9 million 24
Over 100 million 15

In numbers: 5G network strategies
and concerns
20%A fifth of operators see in-building
coverage as their top RAN priority,
suggesting a keen enterprise focus.
69%
More than two thirds of operators
failed to claim spectrum refarming
as a top three RAN priority, despite
highlighting spectrum scarcity.
71%
Most operators plan to start 5G
deployment in non-standalone
mode. However, more than 70%
plan standalone launches in three
years.
57%
More than half of operators think
they are likely to introduce new
vendors into their 5G network
deployments.
6%Only a small minority think they are
very unlikely to use 5G to introduce
new vendors.
26%
More than a quarter of operators
ranked infrastructure costs as the
no.1 barrier to increased 5G spend
– more than any other barrier.

5G RAN investment prioritiesSupporting new customers and network architectures
• In-building = enterprise. Indoor 5G
may not be critical to all consumer
use cases but will be key for
enterprises – a top 5G priority.
• vRAN = IT transformation. A focus
on vRAN for 5G tracks well with IT
transformation priorities; in order to
manage and deploy virtual RAN
assets, IT transformation is a must.
• mmWave and small cells.
Densification is a given to deliver 5G
coverage and capacity. But the need
to deliver broad coverage early on
likely dictates mmWave and small cell
investment thinking.
• New versus old spectrum. The
relatively low importance of spectrum
refarming may seem at odds with the
advanced state of (and future plans
for) 2G/3G sunsets.
Considering your 5G radio access network, which areas
of investment are most important?
(Top three choices)
20%
8%
15%
7%
13% 12% 11% 11%
13%
15%
11%
14%
15%
11%9% 9%
8%
16%12%
17%
8%
11%14%
11%
In-building 5Gcoverage
mmWavedeployment
New spectrumallocations
Networkdensification
Virtual RAN /OpenRAN
Radio accessnetwork
automation
Wi-Fi integration Spectrumrefarming
Ranked 3rd
Ranked 2nd
Ranked 1st

5G core investment prioritiesCore supports the RAN with backhaul and virtualisation
• Security, again. An overall strategic
and vendor selection priority, network
security was bound to be seen as
important to 5G core investments.
• IT transformation, again. As with
the RAN and overall network
strategies, IT transformation
(virtualisation investment) is a theme
in the 5G core.
• OSS/BSS oversight? For today’s
services, existing OSS/BSS assets
should suffice. Tackling new services
and customers with 5G may require it
to be a greater priority.
• Marginal spread. In the core (and
RAN), the ranking differences across
investment priorities are generally
small; in the early days of 5G, all may
be seen as important until
deployments shed light on priorities.
Considering your 5G core and service network, which
areas of investment are most important?
(Top three choices)
12%
19% 18% 17%12% 12%
7%
10%
10%16%
22%
13%
19%
7%
11%
10%
17% 9%
20%
17%
13%
Edge computing Transport networkupgrades
Network securityupgrades
Virtualisationinvestments
NG core (service-based architecture)
upgrades
Service core (IMS,etc.) upgrades
OSS/BSS upgrades
Ranked 3rd
Ranked 2nd
Ranked 1st

Standalone versus non-standaloneStandalone coming soon
• Non-standalone leads. Initial 5G
deployment has been in standalone
mode; operators surveyed suggest this
will continue to be the case.
• Standalone close behind. Of operators
with plans, 80% plan to deploy
standalone 5G within three years, with
the greatest set of deployments planned
in two to three years.
• Definition of deployment? Standalone
plans may be aggressive but
deployments could span small regions
or even venues – likely the case for
enterprise use cases.
• Regional standalone ambitions.
Within the next two years, more than
50% of operators in Latin America and
Europe expect to launch standalone.
Asia Pacific lags, which is surprising
given the advanced state of 5G there.
Considering your 5G network assets and strategy, when
do you plan standalone versus non-standalone 5G?
(Top three choices)
1%
8%
11%
19%
22%
33%
37%
25%
18%
4%
11%
11%
0% 10% 20% 30% 40% 50% 60% 70% 80% 90% 100%
SA
NSA
Have already begun deployment Within 1 YearIn 1 to 2 Years 2 to 3 Years3+ Years NA / No Plans

Standalone 5G benefitsSaving money over making money?
• Costs dominate. Standalone 5G is
often linked to new use cases.
Regardless, operators see cost
efficiency as most important (high
ranking for cost savings and focus on
simplified architecture).
• Saving money versus making
money. A focus on costs versus new
use cases conflicts with the larger
network transformation priorities
highlighted.
• IoT and new revenues. While not
the no.1 benefit, MMTC support is
clearly distanced from the remaining
benefits and feeds into operator
priorities around revenue generation.
• Long-term thinking. We are still in
the early days of 5G, much less
standalone 5G. Operators may
understandably be confused about its
benefits.
Rank the following benefits of deploying standalone 5G
in your network
(top three choices)
18% 19%24%
19% 17%
28% 24% 14%
13% 18%
26%28%
13%20%
10%
URLLC support Simplified networkarchitecture
Cost savings Network slicingcapabilities
MMTC support
Ranked 3rd
Ranked 2nd
Ranked 1st

5G and new network suppliersNew technologies usher in opportunity
• New vendors win. Well over half of
operators think it likely that they will
leverage new vendors (those they have
not worked with) in their 5G
deployments. Only about 20% think it is
unlikely.
• Incumbents versus start-ups. While
tempting to see this as a boon to start-
ups, new suppliers could include larger
vendors – particularly as IT
transformation efforts proceed.
• Replacement or incremental.
Whether small or large, working with
new vendors will not necessarily come
at the expense of existing ones,
particularly where new capabilities
(such as IT assets) are needed.
• Small is big. Some 75% of small
operators are likely to introduce new
vendors, with only 6% thinking it not
likely.
How likely are you to use 5G to introduce new vendors
into your network?
25%
32%
22%
15%
6% Very likely
Somewhat likely
Neither likely norunlikely
Somewhat unlikely
Very unlikely

68%64%
61%
49%46%
Limited spectrumaccess
Infrastructure costs Technology immaturity Unclear use cases Consumer devicecosts
5G network investment barriersSpectrum: the lifeblood of mobile services
• Spectrum above all. While
marginally leading, a focus on
spectrum underscores the perceived
scarcity of 5G-suitable radio waves.
• Spectrum confusion? If spectrum
access is a barrier to 5G, we would
expect refarming and even Wi-Fi
integration to be greater priorities,
suggesting confusion or a marketing
opportunity for vendors.
• Industry versus structural barriers.
Compared with spectrum access,
cost and technology maturity
concerns are barriers driven by the
industry and should resolve
themselves over time.
• Devices versus use cases. While
trailing other responses, nearly half of
operators see use cases and device
costs 5G barriers – not insignificant.
What is the greatest barrier to increasing your planned
network investment in 5G?
Multiple responses accepted; chart total adds up to more than 100%

5G RAN investment prioritiesResults by region
Considering your 5G radio access network, which areas of investment are most important?
(Top three choices)
28%
5%
15%
5%
18%
10% 10%5%
10%
23%
13%
15%
10%
13%
5%
8%
5%
15%13%
21%8%
13%
15%
8%
In-building 5Gcoverage
mmWavedeployment
New spectrumallocations
Networkdensification
Radio accessnetwork automationand planning tools
Spectrum refarming Wi-Fi integration Virtual RAN /OpenRAN
Asia PacificRanked 3rd
Ranked 2nd
Ranked 1st

5G RAN investment prioritiesResults by region
Considering your 5G radio access network, which areas of investment are most important?
(Top three choices)
17% 17%22%
17%11% 11%
0%6%
11%17% 6%
22%
6%
17%
11%
11%
22% 11%
11%
17%
6%
22% 11%
Wi-Fi integration New spectrumallocations
Radio accessnetwork automationand planning tools
Virtual RAN /OpenRAN
In-building 5Gcoverage
mmWavedeployment
Networkdensification
Spectrum refarming
Europe
Ranked 3rd
Ranked 2nd
Ranked 1st

5G RAN investment prioritiesResults by region
Considering your 5G radio access network, which areas of investment are most important?
(Top three choices)
39%
17%22%
17%
6%
22%
11%6%
11%
6%11%
11% 22%
6%
17%11% 11%
33%17% 6%
Virtual RAN /OpenRAN
In-building 5Gcoverage
New spectrumallocations
Spectrum refarming mmWavedeployment
Radio accessnetwork automationand planning tools
Networkdensification
Wi-Fi integration
Middle East and Africa
Ranked 3rd
Ranked 2nd
Ranked 1st

5G RAN investment prioritiesResults by region
Considering your 5G radio access network, which areas of investment are most important?
(Top three choices)
16% 16% 16% 16%
4% 4%8%
12%
16%
24%
8%4%
16% 16% 8% 0%
16%
12%16% 16%
12%
12%
8%
Networkdensification
In-building 5Gcoverage
mmWavedeployment
WiFi integration Virtual RAN /OpenRAN
Radio accessnetwork automationand planning tools
New spectrumallocations
Spectrum refarming
Americas
Ranked 3rd
Ranked 2nd
Ranked 1st

5G core investment prioritiesResults by region
Considering your 5G core and service network, which areas of investment are most important?
(Top three choices)
21% 23%18%
10% 10% 13%
3%
18% 13% 23%
15% 15% 8%
5%
18%
15% 5%
15% 15%
8%
21%
Network securityupgrades
Transport networkupgrades
Virtualisationinvestments
NG core (service-basedarchitecture) upgrades
OSS/BSS upgrades Edge computing Service core (IMS, etc.)upgrades
Asia Pacific
Ranked 3rd
Ranked 2nd
Ranked 1st

5G core investment prioritiesResults by region
Considering your 5G core and service network, which areas of investment are most important?
(Top three choices)
17% 17%11%
22%
11% 11% 11%
33%
17%
17%
17%
11%
0%6%
22%
17%22%
6%
17%
17%0%
Service core (IMS, etc.)upgrades
Network securityupgrades
Edge computing Virtualisationinvestments
NG core (service basedarchitecture) upgrades
OSS/BSS upgrades Transport networkupgrades
Europe
Ranked 3rd
Ranked 2nd
Ranked 1st

5G core investment prioritiesResults by region
Considering your 5G core and service network, which areas of investment are most important?
(Top three choices)
17%22%
6%
22%28%
6%
33% 22%
17%
11%6%
11%
22%
11%
28%11%
11%
17%
Service core (IMS, etc.)upgrades
Virtualisationinvestments
NG core (service-basedarchitecture) upgrades
Transport networkupgrades
Network securityupgrades
Edge computing OSS/BSS upgrades
Middle East and Africa
Ranked 3rd
Ranked 2nd
Ranked 1st

5G core investment prioritiesResults by region
Considering your 5G core and service network, which areas of investment are most important?
(Top three choices)
8%
20%
8%
20%16% 16%
4%
20%
8%
24%
20%
8% 8%
4%
28%24% 16%
4%
8% 8%
4%
Network securityupgrades
NG core (service-basedarchitecture) upgrades
Virtualisationinvestments
Service core (IMS, etc.)upgrades
Transport networkupgrades
Edge computing OSS/BSS upgrades
Americas
Ranked 3rd
Ranked 2nd
Ranked 1st

Standalone versus non-standalone Results by region
Considering your 5G network assets and strategy, when do you plan standalone versus non-standalone 5G?
5%
17%
6%
11%
11%
8%
39%
22%
17%
21%
16%
45%
16%
11%
28%
28%
28%
37%
26%
29%
50%
33%
22%
28%
33%
16%
37%
21%
22%
11%
17%
11%
11%
11%
5%
17%
22%
5%
11%
NSA
SA
NSA
SA
NSA
SA
NSA
SA
0% 10% 20% 30% 40% 50% 60% 70% 80% 90% 100%
Have already begun deployment Within 1 year In 1 to 2 years 2 to 3 years 3+ years NA / no plans
Europe
Asia Pacific
Middle East and Africa
Americas

Standalone 5G benefitsResults by region
Rank the following benefits of deploying standalone 5G in your network
(top three choices)
18%26% 26%
15% 13%
26%
26%
10%
18%18%
33%23%
15% 18%
8%
URLLC support Simplified network architecture Cost savings Network slicing capabilities MMTC support
Asia Pacific
Ranked 3rd
Ranked 2nd
Ranked 1st

Standalone 5G benefitsResults by region
Rank the following benefits of deploying standalone 5G in your network
(top three choices)
22% 22%17% 17%
22%
39%
6%
33%
17% 6%
11%
44%
11%
17%
17%
URLLC support Simplified network architecture MMTC support Network slicing capabilities Cost savings
EuropeRanked 3rd
Ranked 2nd
Ranked 1st

Standalone 5G benefitsResults by region
Rank the following benefits of deploying standalone 5G in your network
(top three choices)
11% 11%
33%
22% 22%
33% 33%
11%
6%
17%
28% 28%
17%
22%6%
URLLC support Simplified network architecture MMTC support Network slicing capabilities Cost savings
Middle East and AfricaRanked 3rd
Ranked 2nd
Ranked 1st

Standalone 5G benefitsResults by region
Rank the following benefits of deploying standalone 5G in your network
(top three choices)
20%12%
24% 24%
12%
20%28%
24%
8%
12%
24% 24%12%
24%
8%
URLLC support Simplified network architecture Cost savings Network slicing capabilities MMTC support
Americas
Ranked 3rd
Ranked 2nd
Ranked 1st

5G and new network suppliersResults by region
How likely are you to use 5G to introduce new vendors into your network?
32%
29%
21%
16%
3%
Asia Pacific
Very likely
Somewhat likely
Neither likely nor unlikely
Somewhat unlikely
Very unlikely
17%
28%
28%
17%
11%
Middle East and Africa
28%
39%
11%
22%
Europe
17%
35%26%
9%
13%
Americas

5G network investment barriersResults by region
What is the greatest barrier to increasing your planned network investment in 5G?
54%
72%
62%64%
41%
61%
56% 56%
61%
50%
44%
72%
56%
72%
56%
36%
52%
68%
76%
44%
Unclear use cases Network infrastructure costs Technology immaturity Limited spectrum access Consumer device costs
Asia Pacific Europe MEA Americas
Multiple responses accepted; chart total adds up to more than 100%

5G RAN investment prioritiesResults by operator size (by number of connections)
Considering your 5G radio access network, which areas of investment are most important?
(Top three choices)
22% 22%
11%
22%
6% 6%
17%11%
17%
6%
17% 6% 17%
11%
6%11%
6%
17%
17%11%
11%
New spectrumallocations
In-building 5Gcoverage
Virtual RAN /OpenRAN
Radio accessnetwork automationand planning tools
Networkdensification
Wi-Fi integration Spectrum refarming mmWavedeployment
Under 10 million
Ranked 3rd
Ranked 2nd
Ranked 1st

5G RAN investment prioritiesResults by operator size (by number of connections)
Considering your 5G radio access network, which areas of investment are most important?
(Top three choices)
7%
23%
12%16%
12%7%
12% 12%
23%
12%
12%
9%14%
12%7%
12%
16% 7%
16% 12% 12%
16%14%
7%
mmWavedeployment
In-building 5Gcoverage
Radio accessnetwork automationand planning tools
New spectrumallocations
Wi-Fi integration Networkdensification
Spectrum refarming Virtual RAN /OpenRAN
10 million to 49.9 million Ranked 3rd
Ranked 2nd
Ranked 1st

5G RAN investment prioritiesResults by operator size (by number of connections)
Considering your 5G radio access network, which areas of investment are most important?
(Top three choices)
8% 8%
21% 21%17%
13%
4% 4%
21% 21%
17%
8%13%
4%
8%4%
25%21%
8%
8% 8%
13%
8%
4%
Networkdensification
mmWavedeployment
Virtual RAN /OpenRAN
Spectrum refarming In-building 5Gcoverage
Wi-Fi integration Radio accessnetwork automationand planning tools
New spectrumallocations
50 million to 100 million
Ranked 3rd
Ranked 2nd
Ranked 1st

5G RAN investment prioritiesResults by operator size (by number of connections)
Considering your 5G radio access network, which areas of investment are most important?
(Top three choices)
20%13% 13% 13%
7%13% 13%
7%
20%
20%
7%
20%
20% 7%0%
7%
27%
13%
20%
7%
7%
7%13%
7%
New spectrumallocations
In-building 5Gcoverage
Wi-Fi integration Radio accessnetwork automationand planning tools
Virtual RAN /OpenRAN
Networkdensification
mmWavedeployment
Spectrum refarming
Over 100 million
Ranked 3rd
Ranked 2nd
Ranked 1st

5G core investment prioritiesResults by operator size (by number of connections)
Considering your 5G core and service network, which areas of investment are most important?
(Top three choices)
6%
28%
11%
22%
6%11%
6%
33%
11%17%
11%
11%
6%
17%
6%
33%
0%
17% 6%
11%
NG core (service-basedarchitecture) upgrades
Transport networkupgrades
Network securityupgrades
Virtualisationinvestments
Edge computing Service core (IMS, etc.)upgrades
OSS/BSS upgrades
Under 10 million
Ranked 3rd
Ranked 2nd
Ranked 1st

5G core investment prioritiesResults by operator size (by number of connections)
Considering your 5G core and service network, which areas of investment are most important?
(Top three choices)
21%29% 33% 29% 25%
17%25%
42%
54%33%
8% 17%
17%8%
46%17%
17%
38%17%
25% 21%
Service core (IMS, etc.)upgrades
Virtualisationinvestments
Network securityupgrades
NG core (service-basedarchitecture) upgrades
Edge computing OSS/BSS upgrades Transport networkupgrades
10 million to 49.9 million
Ranked 3rd
Ranked 2nd
Ranked 1st

5G core investment prioritiesResults by operator size (by number of connections)
Considering your 5G core and service network, which areas of investment are most important?
(Top three choices)
13%
21%
13% 13% 13%
21%
4%
25%
17%
21% 21%
8%
4%
17%13%
17%13%
21%8%
8%
Service core (IMS, etc.)upgrades
Network securityupgrades
Transport networkupgrades
Virtualisationinvestments
NG core (service-basedarchitecture) upgrades
Edge computing OSS/BSS upgrades
50 million to 100 million
Ranked 3rd
Ranked 2nd
Ranked 1st

5G core investment prioritiesResults by operator size (by number of connections)
Considering your 5G core and service network, which areas of investment are most important?
(Top three choices)
20%
7%
33%
20%
7%0%
13%
27%
20%
7%
7%
13%20%
7%
27%
20%0%
13%20%
13%7%
Network securityupgrades
NG core (service-basedarchitecture) upgrades
Transport networkupgrades
Virtualisationinvestments
OSS/BSS upgrades Edge computing Service core (IMS, etc.)upgrades
Over 100 million
Ranked 3rd
Ranked 2nd
Ranked 1st

Standalone versus non-standaloneResults by operator size (by number of connections)
Considering your 5G network assets and strategy, when do you plan to deploy
standalone and non-standalone 5G?
38%
9%
5%
4%
13%
13%
38%
37%
30%
22%
20%
20%
63%
38%
56%
47%
39%
22%
47%
27%
63%
63%
60%
75%
17%
39%
20%
47%
13%
50%
9%
55%
4%
4%
7%
13%
13%
28%
19%
4%
13%
NSA
SA
NSA
SA
NSA
SA
NSA
SA
0% 10% 20% 30% 40% 50% 60% 70% 80% 90% 100%
Have already begun deployment Within 1 Year In 1 to 2 Years 2 to 3 Years 3+ Years NA / No Plans
Under 10 million
10 million to 49.9
million
50 million to 100
million
Over 100 million

Standalone 5G benefitsResults by operator size (by number of connections)
Rank the following benefits of deploying standalone 5G in your network
(top three choices)
17%11%
28%
17% 17%
28%
28%
6%
17%11%
28%
28%
22%
11%
Simplified network architecture URLLC support Cost savings Network slicing capabilities MMTC support
Under 10 million
Ranked 3rd
Ranked 2nd
Ranked 1st

Standalone 5G benefitsResults by operator size (by number of connections)
Rank the following benefits of deploying standalone 5G in your network
(top three choices)
23%19% 16%
21% 21%
30%
28%
19%5%
19%
26%
28%
19%
23%5%
URLLC support Simplified network architecture MMTC support Network slicing capabilities Cost savings
10 million to 49.9 million Ranked 3rd
Ranked 2nd
Ranked 1st

Standalone 5G benefitsResults by operator size (by number of connections)
Rank the following benefits of deploying standalone 5G in your network
(top three choices)
21%13%
25%17%
21%
25%
21%
13%
17%
21%
25%
38%
13%17%
4%
Simplified network architecture URLLC support Cost savings Network slicing capabilities MMTC support
50 million to 100 million Ranked 3rd
Ranked 2nd
Ranked 1st

Standalone 5G benefitsResults by operator size (by number of connections)
Rank the following benefits of deploying standalone 5G in your network
(top three choices)
20%27%
20% 20%13%
27% 13%
7%
33%
20%
27%
27%
33%
7%
7%
Network slicing capabilities Cost savings Simplified network architecture URLLC support MMTC support
Over 100 million
Ranked 3rd
Ranked 2nd
Ranked 1st

5G and new network suppliersResults by operator size
How likely are you to use 5G to introduce new vendors into your network?
38%
38%
19%
6%
Under 10 million
Very likely
Somewhat likely
Neither likely nor unlikely
Somewhat unlikely
Very unlikely
22%
30%26%
9%
13%
50 million to 100 million
25%
32%16%
21%
5%
10 million to 49.9 million
13%
27%
33%
20%
7%
Over 100 million

5G network investment barriersResults by operator size
What is the greatest barrier to increasing your planned network investment in 5G?
44%
56%
61% 61%
44%42%
72%
65%70%
44%
54% 54%
46%
83%
50%
67% 67%
73%
47% 47%
0%
10%
20%
30%
40%
50%
60%
70%
80%
90%
Unclear use cases Network infrastructure costs Technology immaturity Limited spectrum access Consumer device costs
Under 10 million 10 million to 49.9 million 50 million to 100 million Over 100 million
Multiple responses accepted; chart total adds up to more than 100%


5
Although open networking through Virtualization and Service-Based Architecture is not
a silver bullet, it does represent a path to organically bring new vendors into the ecosystem while
increasing the competitiveness of existing trusted players globally.
Virtual and Open RAN technology is still in its nascent stages, but represents an
opportunity to increase supply chain flexibility and reduce Total Cost of Ownership (TCO).
Open interfaces can help diversify and reinvigorate the supply chain with a “plug and play”
components model that allows operators to use multiple vendors.
While many companies including GSMA have banded together to develop this
technology further, the transition to such technology will not be immediate. The desire to
diversify suppliers does not diminish the importance of existing relationships or the work and
innovations of some of the trusted larger players today. Smaller players lack the scale to deliver
for massive deployments and large suppliers are u nder financial pressure to keep up the pace. As
5G coexists and interoperates with 4G and LTE networks, so must open network technology
integrate into current networks. Current suppliers will necessarily be an important part of the
transition.
56% operators indicate that it is important for them to integrate open source and open
networking technologies into their network. However, only a quarter of operators say they are
commercially deploying open networking technology. Internal expertise gaps are an impediment
to deployment and operators with fewer than 50 million connections are much more likely to
have no virtual RAN plans.
In addition to these questions, GSMA asked this group of operators about their vendor
strategies, including what they are looking for from vendors and how likely they are to engage
new vendors going forward. 57% of operators think they are likely to introduce new network

6
suppliers into their 5G network deployments, with only six % reporting they are very unlikely to
introduce new vendors as part of their 5G deployment.
Without public support, this technology’s success will ultimately depend on internal
factors, such as business prioritization and capital expenditures, as well as external
considerations including vendor availability. Recent actions by Congress - such as the Secure
and Trusted Communications Networks Act or the recently proposed Creating Helpful Incentives
to Produce Semiconductors (CHIPS) for America Act6 – highlight growing recognition of the
need for external funding to achieve the administration’s goals for 5G. Public support such as tax
credits and R&D funding will be critical to this technology’s success.
Are there stakeholder-driven approaches that the U.S. Government should consider to
promote adoption of policies, requirements, guidelines, and procurement strategies
necessary to establish secure, effective, and reliable 5G infrastructure?
Maintaining the integrity, availability and security of wireless network while preserving
global interoperability is important to U.S. and global businesses and economies. The U.S.
members of GSMA are dedicated to protecting their networks from security weaknesses, bad
actors and providing consumers with a secure and reliable experience and services.
Any security scheme should ensure that operators are able to continue to identify and
share problems as they arise and work together for secure, reliable networks across borders.
Efforts such as the Criteria for Security and Trust in Telecommunications Networks and Services
from the Center for Strategic & International Studies (CSIS) show great promise and
complement both the Prague Proposals and the European Union’s 5G Toolbox7.
6 See D. Palmer and Sabrina Rodriguez, “Lawmakers unveil bill to boost semiconductor production”, Politico (June
11, 2020), available at https://www.politico.com/newsletters/morning-trade/2020/06/11/lawmakers-unveil-bill-to-
boost-semiconductor-production-788432 7 See Center for Strategic & International Studies (CSIS), CISS Working Group on Trust and Security in 5G
Networks (May 13, 2020), available at https://www.csis.org/analysis/criteria-security-and-trust-telecommunications-
networks-and-services

7
There is no single measure, framework or control point that can successfully eliminate all
security risks. Multiple and varied approaches are needed to identify and mitigate risks.
Continued collaboration with global standardization work such as security subgroups within
3GPP is critical to identifying and preparing control measures. Such groups help manage security
threats on a global scale with the wider IT world to counter cyberattacks.
How can the U.S. Government best lead the responsible international development and deployment
of 5G technology and promote the availability of secure and reliable equipment and services in the
market?
Transformative advanced communications services are the result of global innovation
particularly inside standards development organizations (SDOs), where the U.S. has always been
a leader. The GSMA applauds Commerce and BIS’ recent decision to encourage U.S. industry’s
contribution and collaboration to standards-development activities8. As highlighted in our March
2020 comments to Commerce, the work that happens within standard setting bodies is vital to
ensuring interoperability and economies of scale. These recognized international bodies provide
the building blocks for emergent technology and enable the design and production of products that
are critical to U.S. competitiveness.
As with previous technological generations, global standards need collaborative input
from U.S. industry leaders. Their continued participation makes our technology better. As we
move to virtualized and open network architectures, such technical specifications will be a
critical piece of the world’s future connectivity.
8 U.S. Department of Commerce, Bureau of Industry and Security, Release of “Technology” to Certain Entities on
the Entity List in the Context of Standards Organizations, Interim final rule, request for public comments, 85 Fed.
Reg. 36719 (June 18, 2020).