becoming wiser decision- makers: a work in progress illinois nwea members seminar nov 1, 2006...
TRANSCRIPT

Becoming Wiser Decision-Becoming Wiser Decision-Makers: A Work In ProgressMakers: A Work In Progress
Illinois NWEA Members Seminar Illinois NWEA Members Seminar
Nov 1, 2006Nov 1, 2006
Meridian, Rolling Meadows, ILMeridian, Rolling Meadows, ILEdward J. DeYoung, Ph.DAssessment Systems ArchitectSchool District [email protected]@consultant.com

AGENDAAGENDA
School District U46 contextSchool District U46 contextWhat did we do?What did we do?What went well?What went well?What would we do differently?What would we do differently?

U46: Standard Characteristics & U46: Standard Characteristics & Recent HistoryRecent History
2003-04: Huge budget shortage2003-04: Huge budget shortage Delayed opening of several new schoolsDelayed opening of several new schools Significant staff reductionsSignificant staff reductions
2004-05 Move to neighborhood schools, which led to 2004-05 Move to neighborhood schools, which led to thousands of students going to different schoolsthousands of students going to different schools

Ethnicity & Economically Ethnicity & Economically Disadvantaged StatusDisadvantaged Status
36.5% of students in 36.5% of students in 2004.05 received free 2004.05 received free or reduced lunchor reduced lunch
Percent of children Percent of children receiving free or receiving free or reduced lunch is reduced lunch is increasing.increasing.
Percent of Hispanic Percent of Hispanic students is increasing students is increasing and percent of White and percent of White students is decreasing.students is decreasing.
Heterogeneous: Heterogeneous: from 7% to 93% from 7% to 93%
free/reduced lunch at free/reduced lunch at ES levelES level


DIPDIP
Assessment, Curriculum, and InstructionAssessment, Curriculum, and Instruction Data ManagementData Management
Refine the student data system and processes.Refine the student data system and processes. Coordinate the technological capacity, appropriate software, and training Coordinate the technological capacity, appropriate software, and training
to make student data accessible and meaningful for administrators and to make student data accessible and meaningful for administrators and teachersteachers..
Fiscal ResponsibilityFiscal Responsibility Align all resources with the District’s mission to increase efficiencies and Align all resources with the District’s mission to increase efficiencies and
effectiveness. effectiveness.

Who Makes Decisions?Who Makes Decisions?
PeoplePeople make decisions make decisions Data do NOT make decisions (nor does a Data do NOT make decisions (nor does a
datum)datum) Analysis and Reflection moves usAnalysis and Reflection moves us
from Datafrom Data to Information to Information to Knowledgeto Knowledge to Insightto Insight to Decisions to Decisions oror more questions –for which we need more questions –for which we need
access to more data and so forth…..access to more data and so forth…..


Started with “the End in Mind”Started with “the End in Mind”
How could/would this assessmentHow could/would this assessment::a.a. Help us improve (measurable) student learning, at the Help us improve (measurable) student learning, at the
school and at the classroom level?school and at the classroom level?b.b. Help us align resource allocation decisions with the Help us align resource allocation decisions with the
goal to improve student learning?goal to improve student learning?Embarked on a Embarked on a comprehensive reviewcomprehensive review of U-46 of U-46
assessments – from the context of a history of assessments – from the context of a history of decentralization & recent budget crisisdecentralization & recent budget crisis
A potpourri of tests A potpourri of tests
Implicit guiding assumptionsImplicit guiding assumptions::a.a. ““Test the least possible to accomplish goals”Test the least possible to accomplish goals”b.b. ““Don’t test if you don’t intend to use the data”Don’t test if you don’t intend to use the data”
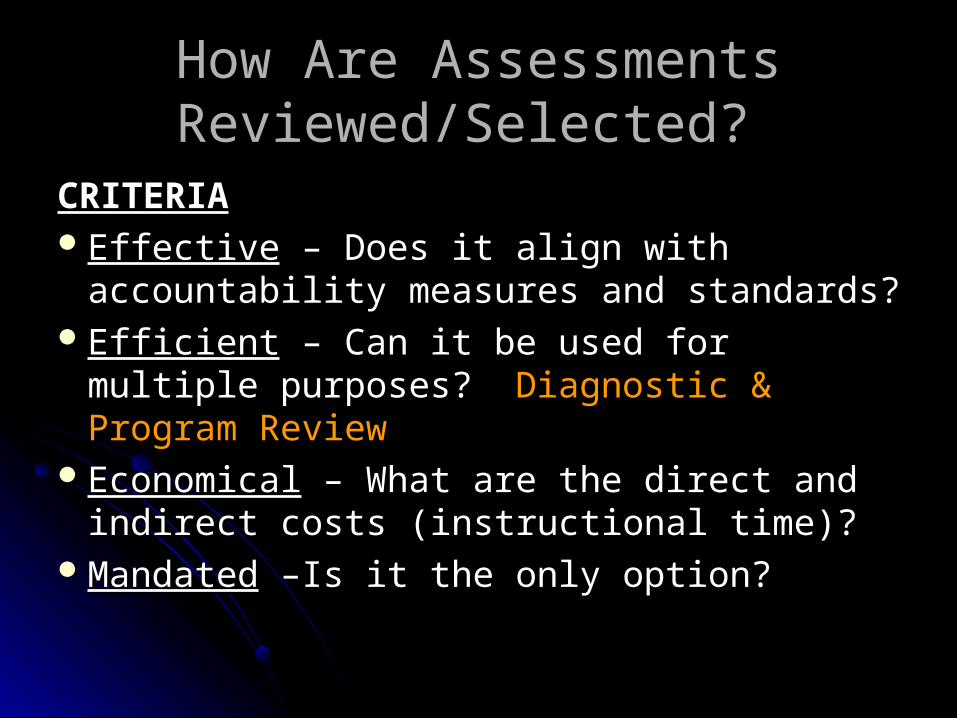
How Are Assessments How Are Assessments Reviewed/Selected? Reviewed/Selected?
CRITERIACRITERIAEffectiveEffective – Does it align with accountability – Does it align with accountability
measures and standards?measures and standards?EfficientEfficient – Can it be used for multiple – Can it be used for multiple
purposes? purposes? Diagnostic & Program ReviewDiagnostic & Program ReviewEconomicalEconomical – What are the direct and – What are the direct and
indirect costs (instructional time)?indirect costs (instructional time)?MandatedMandated –Is it the only option? –Is it the only option?

Choose MAP –but did not (exactly) Choose MAP –but did not (exactly) follow the process..follow the process..
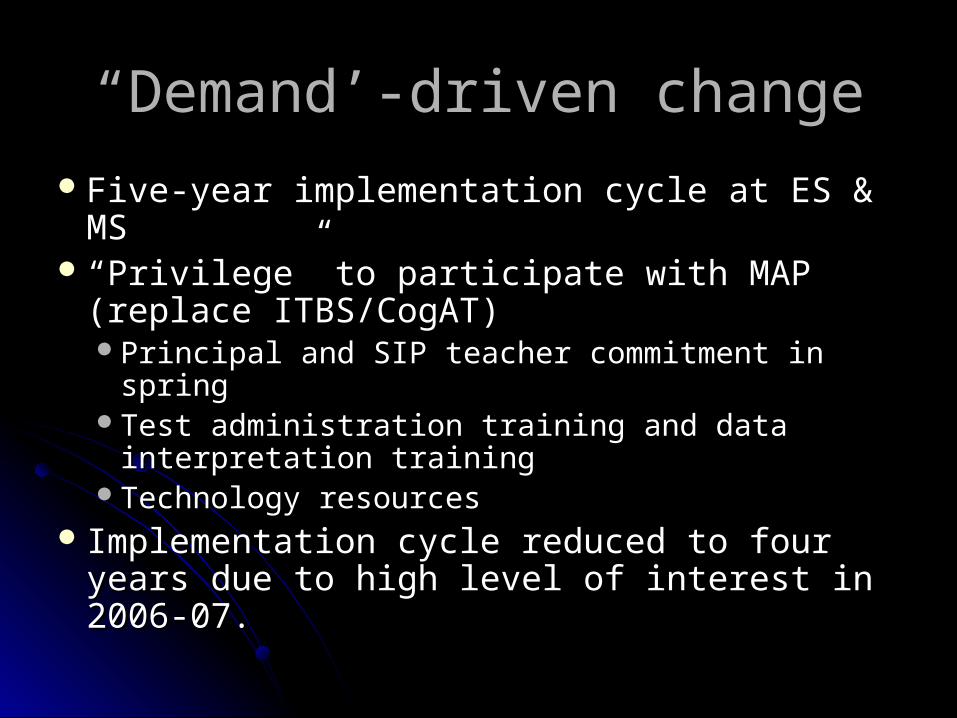
““Demand’-driven changeDemand’-driven change
Five-year implementation cycle at ES & MSFive-year implementation cycle at ES & MS ““Privilege” to participate with MAP (replace Privilege” to participate with MAP (replace
ITBS/CogAT) ITBS/CogAT) Principal and SIP teacher commitment in springPrincipal and SIP teacher commitment in springTest administration training and data Test administration training and data
interpretation traininginterpretation trainingTechnology resourcesTechnology resources
Implementation cycle reduced to four years Implementation cycle reduced to four years due to high level of interest in 2006-07.due to high level of interest in 2006-07.

U-46 implementationU-46 implementation 2003-04 Spring – ALT (Achievement Level Test)2003-04 Spring – ALT (Achievement Level Test)
Selected grades @ 2 middle schools & 2 elementary schoolsSelected grades @ 2 middle schools & 2 elementary schools 2004-05: ~3500 students2004-05: ~3500 students
Grades 3Grades 3rdrd through 6 through 6thth :4 elementary schools (a 5 :4 elementary schools (a 5thth in winter) (add in winter) (add 22ndnd grade in spring) grade in spring)
Grades 7 & 8 @ 3 middle schoolsGrades 7 & 8 @ 3 middle schools Limited high school participation @ 3 locations, “high risk” 9Limited high school participation @ 3 locations, “high risk” 9thth grade grade
studentsstudents 2005-06: ~ 13,500 students2005-06: ~ 13,500 students
21 elementary schools in the fall plus 2 more in the winter21 elementary schools in the fall plus 2 more in the winter 5 middle schools5 middle schools All high schools with variable levels of participation All high schools with variable levels of participation
2006-07: ~ 30,000 students2006-07: ~ 30,000 students 40 elementary schools40 elementary schools 8 middle schools8 middle schools 5 high schools & alternative HS settings; primarily “high risk”, 5 high schools & alternative HS settings; primarily “high risk”,
special education, and ELL studentsspecial education, and ELL students

Staff DevelopmentStaff Development See calendar (updated often) See calendar (updated often)
http://Intranet/assessmenthttp://Intranet/assessment or orDistrict Homepage and then “Teacher District Homepage and then “Teacher
Resources” which takes you to assessmentResources” which takes you to assessmentMAP Administration trainingMAP Administration trainingData Interpretation/Application trainingData Interpretation/Application training
Stepping Stones I (3 hrs. total)Stepping Stones I (3 hrs. total)Stepping Stones II (1.5 hrs, stipend)Stepping Stones II (1.5 hrs, stipend)Stepping Stones III (1.5 hrs, stipend)Stepping Stones III (1.5 hrs, stipend)

Key Roles/ServicesKey Roles/Services ProctorsProctors SIS data entry (TAA)SIS data entry (TAA) Data Interpreter – stipend in 2006-07Data Interpreter – stipend in 2006-07 Principal/Asst. Principal/DivisionalsPrincipal/Asst. Principal/Divisionals MAP coordinatorMAP coordinator TeacherTeacher Instructional coaches – integration of C & I and Instructional coaches – integration of C & I and
AssessmentAssessment Data warehouseData warehouse Data DialoguesData Dialogues

Support for ImplementationSupport for Implementation Data Interpreter –one from each buildingData Interpreter –one from each building Instructional coachesInstructional coaches Assessment, Research, & Evaluation office & Assessment, Research, & Evaluation office &
School Improvements officeSchool Improvements office Jeri Ridenour & Aurora Lozano*Jeri Ridenour & Aurora Lozano* Laura Hill* & Ed DeYoungLaura Hill* & Ed DeYoung Chris DennisonChris Dennison
Data Dialogues –12 key leadership groups Data Dialogues –12 key leadership groups (maximum group size of 20)(maximum group size of 20)
* Additional staff in 2006-07* Additional staff in 2006-07

The Training Vision: The Training Vision: Integrated Delivery of TrainingIntegrated Delivery of Training
Instructional Coaches:Instructional Coaches: Curriculum RoadmapCurriculum Roadmap Data interpretation of MAP, including differentiated Data interpretation of MAP, including differentiated
instructioninstruction
Simplicity from perspective of the school – one Simplicity from perspective of the school – one person delivering servicesperson delivering services
Complexity and challenge from perspective of Complexity and challenge from perspective of priorities between curriculum roadmap (C& I) priorities between curriculum roadmap (C& I) and MAP/ISAT/IMAGE/PSAE/ACCESS and MAP/ISAT/IMAGE/PSAE/ACCESS (assessment)(assessment)

Capacity Building: District, Building, Capacity Building: District, Building, & Classroom& Classroom
PeoplePeopleUsing and interpreting data to guide Using and interpreting data to guide
instruction or inform resource allocation instruction or inform resource allocation decisionsdecisions
Becoming skillful in using data Becoming skillful in using data retrieval/display/interpretation toolsretrieval/display/interpretation tools
TechnologyTechnologyProcedures or policiesProcedures or policies
generalgeneral governing datagoverning dataInterface between technology and peopleInterface between technology and people

What do we do with data?What do we do with data?
District level:District level: Resource allocation – schools at riskResource allocation – schools at risk Program reviewProgram review ELL exit criteria and processELL exit criteria and process
School levelSchool level Adjust classroom groupsAdjust classroom groups Identify students for school level interventionsIdentify students for school level interventions
Classroom levelClassroom level Determine which areas need more emphasisDetermine which areas need more emphasis Modify instructional groupsModify instructional groups

Grade 5
Identify Class RELATIVE
Strengths and/or Areas of ConcernTeacher Report – Mathematics Spring 2002
222 220210
Strengths
Whole class instruction
10.216.7
Instructional groups
Areas of concern
Look for a difference of 3 or more RIT’s

Class Breakdown by RITClass Breakdown by RIT

Class Breakdown by Goal – RIT Ranges
N, Bryan (224)

DesCartes:DesCartes:A Continuum of LearningA Continuum of Learning

District Level: Local Assessment for District Level: Local Assessment for ELL studentsELL students
Exit criteria & processExit criteria & process Triangulation of data: Triangulation of data:
MAP, ACCESS, MAP, ACCESS, teacher teacher recommendationrecommendation
Start with “end in Start with “end in mind” – success in mind” – success in general classroomgeneral classroom
Now ~70%; Before Now ~70%; Before ~30%~30%
Determination of Determination of which form for which form for ACCESS: A, B, or CACCESS: A, B, or C
Maximize student Maximize student potential to exitpotential to exit
Impact: Ask us in Impact: Ask us in May!May!

District & School Level: District & School Level: Predictive Relationship Predictive Relationship between MAP & ISAT between MAP & ISAT or IMAGE; 3or IMAGE; 3rdrd grade grade
exampleexample
Fall 05 MAP
Spring 06
IMAGESpring 06
ISAT140-144 0% 0%145-149 14% 0%150-154 11% 5%155-159 29% 5%160-164 58% 15%165-169 64% 15%170-174 89% 27%175-179 92% 36%180-184 93% 59%185-189 98% 71%190-194 96% 85%195-199 93% 95%200-204 100% 96%205-209 100% 100%210-214 100% 97%215-219 100%220-224 100%225-229 100%
N is very small
Predictive Relationship Between MAP and ISAT or
IMAGE

School Level: SIP School Level: SIP & Strategic & Strategic
Intervention PlansIntervention Plans

What would we do differently?What would we do differently?
Different response from different people!!!Different response from different people!!! Stay with the five year implementation cycleStay with the five year implementation cycle
Quality control on training has deterioratedQuality control on training has deteriorated Go slower with high schools until resources are in Go slower with high schools until resources are in
placeplace Be less accommodating with regard to doing Be less accommodating with regard to doing
training outside the school daytraining outside the school day Participate in selection/recruitment of Participate in selection/recruitment of
instructional coachesinstructional coaches CHALLENGE: Sustain intensity of focus in CHALLENGE: Sustain intensity of focus in
context of initial success - “We know it…”context of initial success - “We know it…”

Celebrate the Celebrate the Impact of a Impact of a
combination of combination of U-46 efforts & U-46 efforts &
state’s move to state’s move to ‘equity’ on ‘cut-‘equity’ on ‘cut-
scores’:scores’:Elementary Elementary
SchoolsSchools
School Name 2003 AYP 2004 AYP 2005 AYP 2006 AYPBartlett Elementary School Y Y Y YCentennial Elementary School N Y Y YCentury Oaks Elementary School N N Y YChanning Elementary School N Y Y YClinton Elementary School Y N Y YColeman Elementary School N Y Y YCreekside Elementary School Y Y Y YFox Meadow Elementary School N Y Y YGarfield Elementary School Y N Y YGlenbrook Elementary School Y Y Y YHanover Countryside Elementary School Y Y Y YHarriet Gifford Elementary School N N Y YHawk Hollow Elementary School Y Y Y YHeritage Elementary School N Y Y Y
Highland Elementary School N N Y YHillcrest Elementary School N Y Y Y
Hilltop Elementary School NOT OPEN NOT OPEN Y YHorizon Elementary School Y Y Y YHuff Elementary School N N Y YIllinois Park Elementary School N Closed Closed ClosedLaurel Hill Elementary School Y N Y YLiberty Elementary School Y Y Y YLincoln Elementary School NOT OPEN NOT OPEN Y YLords Park Elementary School Y N N YLowrie Elementary School N N Y YMcKinley Elementary School N N Y YNature Ridge Elementary School Y Y N YOakhill Elementary School Y Y N YOntarioville Elementary School N N N YOtter Creek Elementary School Y Y Y YParkwood Elementary School N N Y YPrairieview Elementary School Y Y Y YRidge Circle Elementary School Y N Y YSheridan Elementary School Y N Y YSpring Trail Elementary School Y Y Y YSunnydale Elementary School N Y Y YSycamore Trails Elementary School Y Y Y YTimber Trails Elementary School NOT OPEN NOT OPEN Y YWashington Elementary School Y Y Y YWayne Elementary School Y Y Y YWillard Elementary School Y Y Y YWoodland Heights Elementary School Y Closed Closed Closed
Color codes for Federal AYP status as a function of Title I funding
Sanction free Sanction freeMoving out of
sanctionsSanctionsMoving into sanctions

Celebrate Celebrate the Impact the Impact of a of a combination combination of U-46 of U-46 efforts & efforts & state’s state’s move to move to ‘equity’ on ‘equity’ on ‘cut-scores’‘cut-scores’Middle Middle SchoolsSchools
School Subject AYP Subgroup
2003: AYP Sub-group
Status
2004: AYP Sub-group
Status
2005: AYP Sub-group
Status
2006: AYP Sub-group
Status
School Subject AYP Subgroup
2003: AYP Sub-group
Status
2004: AYP Sub-group
Status
2005: AYP Sub-group
Status
2006: AYP Sub-group
Status
Abbott Reading All Yes Yes Yes Yes Kenyon WoodsReading Hispanic Yes Yes
Abbott Reading White Yes Yes Yes Yes Kenyon WoodsReading Asian/Pac. Yes
Abbott Reading Black Yes Yes Kenyon WoodsReading Spec. Ed. No
Abbott Reading Hispanic Yes No Yes Yes Kenyon WoodsReading Econ. Dis. Yes Yes
Abbott Reading Spec. Ed. No Kenyon WoodsMath All Yes Yes
Abbott Reading Econ. Dis. Yes Yes No Yes Kenyon WoodsMath White Yes Yes
Abbott Math All Yes Yes No Yes Kenyon WoodsMath Black Yes
Abbott Math White Yes Yes Yes Yes Kenyon WoodsMath Hispanic No Yes
Abbott Math Black No Yes Kenyon WoodsMath Asian/Pac. Yes
Abbott Math Hispanic No No No Yes Kenyon WoodsMath Spec. Ed. Yes
Abbott Math Spec. Ed. Yes Kenyon WoodsMath Econ. Dis. No Yes
Abbott Math Econ. Dis. No No No Yes Kimball Reading All Yes Yes Yes Yes
Canton Reading All Yes Yes Yes Yes Kimball Reading White Yes Yes Yes Yes
Canton Reading White Yes Yes Yes Yes Kimball Reading Black Yes
Canton Reading Hispanic Yes No Yes Yes Kimball Reading Hispanic Yes No Yes Yes
Canton Reading Asian/Pac. Yes Kimball Reading LEP No No Yes Yes
Canton Reading LEP No Yes Yes Yes Kimball Reading Spec. Ed. No No
Canton Reading Spec. Ed. No Yes Yes Yes Kimball Reading Econ. Dis. Yes No Yes Yes
Canton Reading Econ. Dis. No No Yes Yes Kimball Math All Yes No No Yes
Canton Math All Yes No No Yes Kimball Math White Yes Yes Yes Yes
Canton Math White Yes Yes Yes Yes Kimball Math Black Yes
Canton Math Hispanic No No Yes Yes Kimball Math Hispanic No No No Yes
Canton Math Asian/Pac. Yes Kimball Math LEP No No No Yes
Canton Math LEP No No Yes Yes Kimball Math Spec. Ed. No No
Canton Math Spec. Ed. No No No Yes Kimball Math Econ. Dis. No No No Yes
Canton Math Econ. Dis. Yes No No Yes Larsen Reading All Yes Yes Yes Yes
Eastview Reading All Yes Yes Yes Yes Larsen Reading White Yes Yes Yes Yes
Eastview Reading White Yes Yes Yes Yes Larsen Reading Hispanic Yes Yes Yes Yes
Eastview Reading Hispanic Yes Yes Larsen Reading Spec. Ed. No
Eastview Reading Asian/Pac. Yes Yes Yes Larsen Reading LEP No
Eastview Reading Spec. Ed. No Yes Larsen Reading Econ. Dis. Yes Yes Yes Yes
Eastview Reading Econ. Dis. Yes Larsen Math All No No No Yes
Eastview Math All Yes Yes Yes Yes Larsen Math White Yes Yes Yes Yes
Eastview Math White Yes Yes Yes Yes Larsen Math Hispanic Yes No Yes Yes
Eastview Math Hispanic Yes Yes Larsen Math Spec. Ed. Yes
Eastview Math Asian/Pac. Yes Yes Yes Larsen Math LEP No
Eastview Math Spec. Ed. No Yes Larsen Math Econ. Dis. Yes No Yes Yes
Eastview Math Econ. Dis. Yes Tefft Reading All Yes Yes Yes Yes
Ellis Reading All Yes Yes Yes Yes Tefft Reading White Yes Yes Yes Yes
Ellis Reading White Yes Yes Yes Yes Tefft Reading Black Yes
Ellis Reading Hispanic No Yes Yes Yes Tefft Reading Hispanic Yes No Yes Yes
Ellis Reading Spec. Ed. No Tefft Reading Asian/Pac. Yes
Ellis Reading Econ. Dis. No Yes Yes Yes Tefft Reading Spec. Ed. No No
Ellis Math All No Yes No Yes Tefft Reading Econ. Dis. Yes No Yes Yes
Ellis Math White Yes Yes Yes Yes Tefft Math All Yes Yes Yes Yes
Ellis Math Hispanic No No No Yes Tefft Math White Yes Yes Yes Yes
Ellis Math Spec. Ed. No Tefft Math Black Yes
Ellis Math Econ. Dis. No Yes No Yes Tefft Math Hispanic No No Yes Yes
Kenyon WoodsReading All Yes Yes Tefft Math Asian/Pac. Yes
Kenyon WoodsReading White Yes Yes Tefft Math Spec. Ed. No Yes
Kenyon WoodsReading Black Yes Tefft Math Econ. Dis. Yes Yes No Yes

OpportunityOpportunity
To become wiser decision-To become wiser decision-makers as we expand our makers as we expand our capacity in data collection, capacity in data collection, storage, retrieval, & storage, retrieval, & interpretation to guide interpretation to guide instruction & inform instruction & inform resource allocation resource allocation decisionsdecisions
The “system” can make a The “system” can make a (measurable) difference in (measurable) difference in student learning.student learning.

Further Questions?Further Questions?
Ed DeYoungEd DeYoung
847.888.5000 ext 5382847.888.5000 ext 5382