bearing defect
DESCRIPTION
sharingTRANSCRIPT
MSc Manufacturing 1
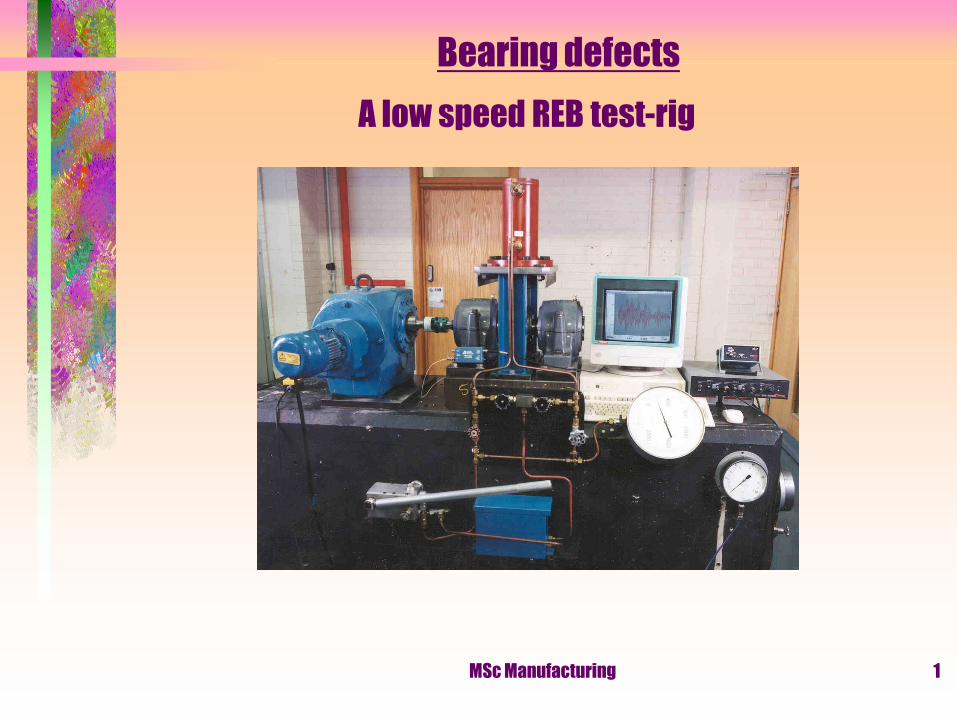
Bearing defects
A low speed REB test-rig
MSc Manufacturing 2
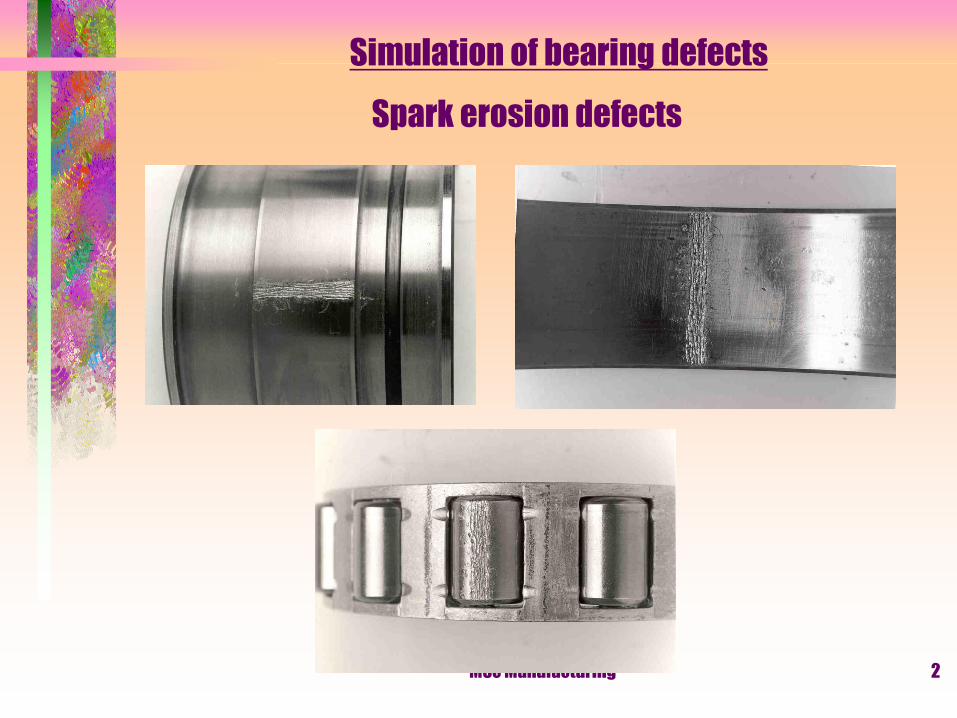
Simulation of bearing defects
Spark erosion defects
MSc Manufacturing 3
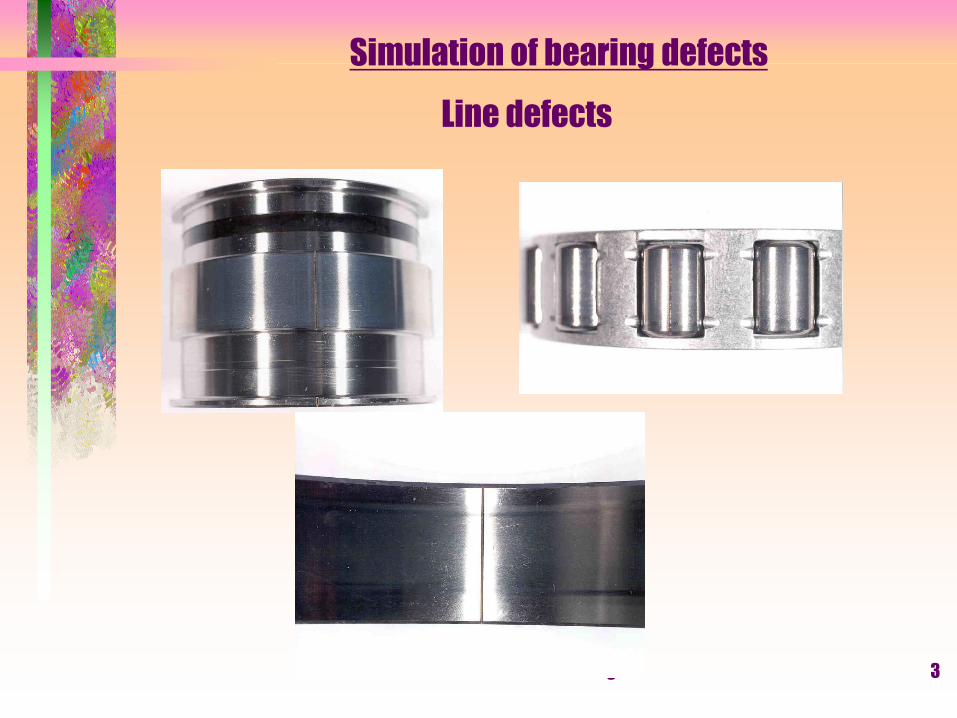
Simulation of bearing defects
Line defects

MSc Manufacturing 4
Simulation of bearing defects
Outer Race Defect: W1 grease
Max amplitude Energy
0 5 10 15 20 25 30 35 400
0.1
0.2
0.3
0.4
0.5
0.6
0.7
SW signature
Peak A
mplit
ude,
Volts
Peak Amplitude: ORD and good bearing, W1 grease
ORD
Good
ORD=0.3344
Good=0.0873
0 5 10 15 20 25 30 35 4010
-8
10-7
10-6
10-5
10-4
SW Signature
Energ
y,
Joule
s
Energy: ORD and good bearing, W1 grease
ORD
Good
ORD=5.2537e-6
Good=3.0248e-7
MSc Manufacturing 5
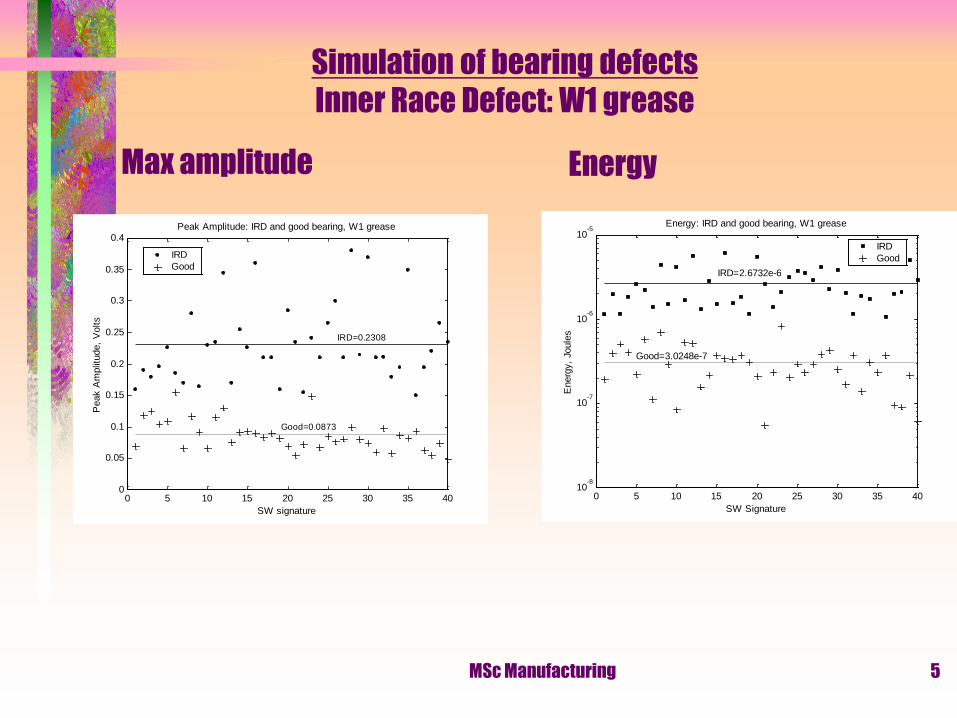
Simulation of bearing defects
Inner Race Defect: W1 grease
Max amplitude Energy
0 5 10 15 20 25 30 35 400
0.05
0.1
0.15
0.2
0.25
0.3
0.35
0.4
SW signature
Peak A
mplit
ude,
Volts
Peak Amplitude: IRD and good bearing, W1 grease
IRD
Good
IRD=0.2308
Good=0.0873
0 5 10 15 20 25 30 35 4010
-8
10-7
10-6
10-5
SW Signature
Energ
y,
Joule
s
Energy: IRD and good bearing, W1 grease
IRD
Good
IRD=2.6732e-6
Good=3.0248e-7
MSc Manufacturing 6
Simulation of bearing defects
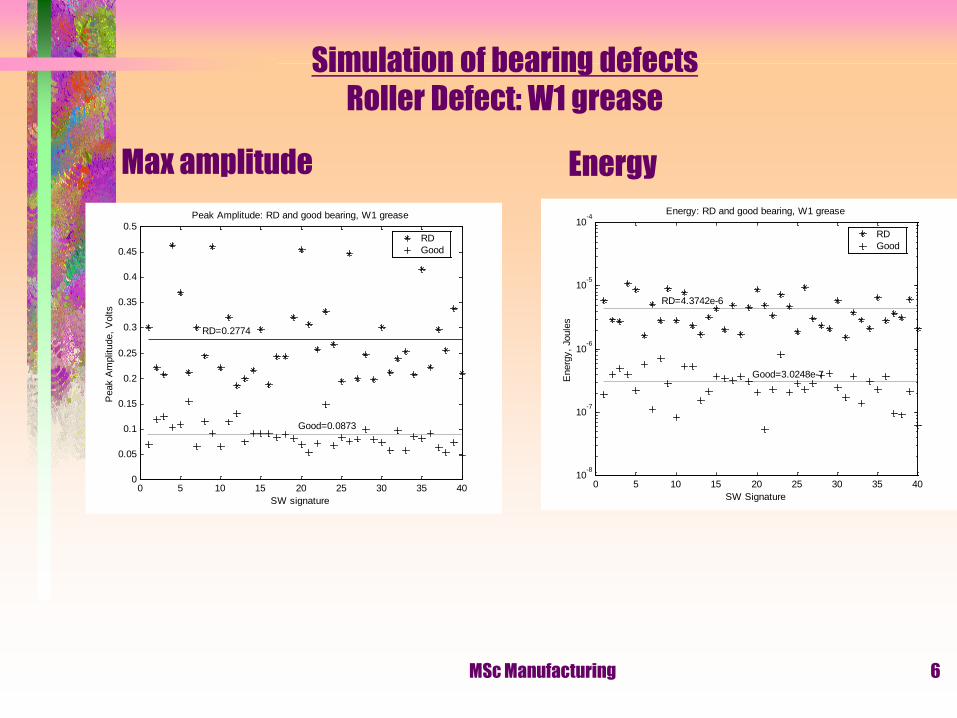
Roller Defect: W1 grease
Max amplitude Energy
0 5 10 15 20 25 30 35 400
0.05
0.1
0.15
0.2
0.25
0.3
0.35
0.4
0.45
0.5
SW signature
Peak A
mplit
ude,
Volts
Peak Amplitude: RD and good bearing, W1 grease
RD
Good
RD=0.2774
Good=0.0873
0 5 10 15 20 25 30 35 4010
-8
10-7
10-6
10-5
10-4
SW Signature
Energ
y,
Joule
s
Energy: RD and good bearing, W1 grease
RD
Good
RD=4.3742e-6
Good=3.0248e-7

MSc Manufacturing 7
Simulation of bearing defects
Debris: W1 grease
Max amplitude Energy
0 5 10 15 20 25 30 35 400
0.2
0.4
0.6
0.8
1
1.2
1.4
SW signature
Peak A
mplit
ude,
Volts
Peak Amplitude: Debris and good bearing, W1 grease
Debris
Good
Debris=0.5429
Good=0.0873
0 5 10 15 20 25 30 35 4010
-8
10-7
10-6
10-5
10-4
SW Signature
Energ
y,
Joule
s
Energy: Debris and good bearing, W1 grease
Good
Debris
Debris=1.4957e-5
Good=3.0248e-7
MSc Manufacturing 8
Simulation of bearing defects
Discussion: Mechanism of SW formation
• The interaction of mating components under
loading condition would break and deform the
surface asperities which generate SW
• The presence of the localised defects (ORD, IRD, RD
) with higher surface roughness and distortion
generated higher SW amplitude than b/g noise
• ORD: more than one SW signature for every ORD
passage. Each roller had to rub against the full
3mm width of the defect

MSc Manufacturing 9
Simulation of bearing defects
Discussion: Mechanism of SW formation
• IRD & RD: SW were only detected for a certain period of
time. SW generated when the IRD and RD were in the
loading zone
• Grease contamination: SW activities random in time. SW
generated by the crushing activities of the debris particles
at the working interfaces. Debris might slide and rub
against the REB components
MSc Manufacturing 10
Simulation of bearing defects
Discussion: Time domain analysis
• The maximum amplitude and energy of ORD, IRD , RD &
grease contamination fluctuated randomly. Attributed to
the breakage and deformation of the asperities were
inconsistent in nature
• ORD: different orientation the roller struck the ORD.
• IRD: the orientation of the roller struck the IRD and the
variation of the defect position in the loading zone.
• RD: the orientation the defective roller rubbed the outer
and inner race. Also movement of roller in the loading zone
• Grease contamination: could occur from any position and
with varying SW strength

MSc Manufacturing 11
Simulation of bearing defects
All types of defects and debris: W1 grease
Max amplitude Energy
0 5 10 15 20 25 30 35 400
0.2
0.4
0.6
0.8
1
1.2
1.4
SW signature
Peak A
mplit
ude,
Volts
Peak Amplitude: All defects and good bearing, W1 grease
ORD
IRD
RD
Good
Debris
Debris=0.5429
ORD=0.3344
RD=0.2774
IRD=0.2095
Good=0.0873
0 5 10 15 20 25 30 35 4010
-8
10-7
10-6
10-5
10-4
SW Signature
Energ
y,
Joule
s
Energy: Defects and good bearing, W1 grease
ORD
IRD
RD
Good
Debris
Debris=1.4957e-5
ORD=5.2537e-6
RD=4.3742e-6
IRD=2.6732e-6
Good=3.0248e-7

MSc Manufacturing 12
Simulation of bearing defects
Discussion: All types of defects and debris, Time domain
analysis
• Highest max amplitude and energy are associated with
grease contamination due to crushing activities
• ORD recorded the highest max amplitude and energy
among the bearing defects due to the closeness of the
defect to the sensor. Shorter transmission path
• Transmission path play an important role in attenuating
the SW signature