bearing capacity and settlement behavior of unsaturated soils from
TRANSCRIPT

mn u Ottawa
L'Universite canadiemie Canada's university

TTTTT FACULTE DES ETUDES SUPERIEURES l = J FACULTY OF GRADUATE AND
ET POSTOCTORALES u Ottawa POSDOCTORAL STUDIES L'Universite canadk'ime
Canada's university
Rui Sun ^ ^ ^ ^ ^ - ^ ^ ^ ^ ^ ^ ^ ^ ^
M.A.Sc. (Civil Engineering) _ ^ . „ „ . „ . „ _ _
Department of Civil Engineering
Bearing Capacity and Settlement Behavior of Unsaturated Soils from Model Footing Tests TITRE DE LA THESE / TITLE OF THESIS
Sai Vanagalli DIRECTEUR (DIRECTRICE) DE LA THESE / THESIS SUPERVISOR
CO-DIRECTEUR (CO-DIRECTRICE) DE LA THESE / THESIS CO-SUPERVISOR
Mohammad Rayhani Mamadou Fall
Jules Anges Infante Sedano
Gary W. Slater Le Doyen de la Faculte des etudes superieures et postdoctorales / Dean of the Faculty of Graduate and Postdoctoral Studies

BEARING CAPACITY AND SETTLEMENT
BEHAVIOR OF UNSATURATED SOILS FROM
MODEL FOOTING TESTS
by
Rui Sun
A Thesis
Submitted under the Supervision of
Dr. Sai K. Vanapalli, P.Eng.
In partial fulfillment of the requirements for
the degree of Master of Applied Science
in Civil Engineering
Department of Civil Engineering
University of Ottawa
Ottawa, Canada KIN 6N5
April 2010
© Rui Sun, Ottawa, Ontario, Canada, 2010

1*1 Library and Archives Canada
Published Heritage Branch
395 Wellington Street OttawaONK1A0N4 Canada
Bibliotheque et Archives Canada
Direction du Patrimoine de I'edition
395, rue Wellington Ottawa ON K1A 0N4 Canada
Your file Votre reference ISBN: 978-0-494-65950-2 Our file Notre reference ISBN: 978-0-494-65950-2
NOTICE:
The author has granted a nonexclusive license allowing Library and Archives Canada to reproduce, publish, archive, preserve, conserve, communicate to the public by telecommunication or on the Internet, loan, distribute and sell theses worldwide, for commercial or noncommercial purposes, in microform, paper, electronic and/or any other formats.
AVIS:
L'auteur a accorde une licence non exclusive permettant a la Bibliotheque et Archives Canada de reproduce, publier, archiver, sauvegarder, conserver, transmettre au public par telecommunication ou par I'lnternet, preter, distribuer et vendre des theses partout dans le monde, a des fins commerciales ou autres, sur support microforme, papier, electronique et/ou autres formats.
The author retains copyright ownership and moral rights in this thesis. Neither the thesis nor substantial extracts from it may be printed or otherwise reproduced without the author's permission.
L'auteur conserve la propriete du droit d'auteur et des droits moraux qui protege cette these. Ni la these ni des extraits substantiels de celle-ci ne doivent etre imprimes ou autrement reproduits sans son autorisation.
In compliance with the Canadian Privacy Act some supporting forms may have been removed from this thesis.
Conformement a la loi canadienne sur la protection de la vie privee, quelques formulaires secondaires ont ete enleves de cette these.
While these forms may be included in the document page count, their removal does not represent any loss of content from the thesis.
Bien que ces formulaires aient inclus dans la pagination, il n'y aura aucun contenu manquant.
• + •
Canada

This thesis is dedicated to my parents and girlfriend
for their love, endless support and encouragement.
ABSTRACT
A series of model footing tests were conducted to determine the bearing capacity and
settlement behaviour of four different soils of which the first two were coarse-grained
soils (i.e. Filtration sand and Quarry sand) and the remainder two were fine-grained soils
(i.e. Sil-co-sil 106 and Mil-u-sil 30) using four different sizes of model footings (i.e. 20
mm x 20 mm, 37 mm x 37 mm, 41.75 mm in diameter, and 50 mm x 50 mm) over a
suction range of 0 to 8 kPa. This range of matric suction 0 to 8 kPa extends over the
boundary effect, transition and residual stages (Vanapalli et al. 1999) for the two coarse
grained soils (i.e. Filtration sand and Quarry sand). A soil container which is 300 mm in
diameter and 700 mm in height has been used in the experiment. The targeted matric
suction values in the soils were achieved by controlling the level of water table in the soil
container and confirmed using Tensiometers installed in the soil at different depths.
The experimental results demonstrated that: 1) The variation of bearing capacity of
coarse-grained soils (i.e. Filtration sand and Quarry sand) with respect to matric suction
was nonlinear in nature. The bearing capacity increases up to the residual suction value
and then decreases with further increase in matric suction values. The trends for
settlement are however opposite; the settlement decreases up to residual suction value
and gradually start increasing along with an increase in the matric suction. 2) For the
unsaturated fine-grained soils (i.e. Sil-co-sil 106 and Min-u-sil 30), bearing capacity
increases and settlement decreases as the matric suction increases because the suction
range (i.e. 0 to 8 kPa) is in the boundary effect zone. In other words, the suction range in
the boundary effect zone is lower than the air-entry value (i.e. saturation zone). More
detailed discussions are offered with respect to the bearing capacity and settlement
behaviour of unsaturated soils including the influence of footing size on the bearing
capacity and settlement results. In addition, these test results were used to verify the
semi-empirical models proposed by Vanapalli and Mohamed (2007) and Oh et al. (2009)
for predicting the bearing capacity and settlement behaviour of unsaturated soils,
respectively.
l

ACKNOWLEDGEMENTS
I am very grateful to my supervisor Dr. Sai K. Vanapalli for his guidance, encouragement,
valuable advice and suggestions throughout this research program.
I would like to thank Geotechnical Lab technicians Kulan Ambalavanar and Jean Claude
Celestin for helping me purchase and set up various materials and facilities required for
the research program. I appreciate the help received from John Perrins in the student
workshop who helped me to fabricate the model footings used in the experiment.
Thanks to my colleagues Won Taek Oh, Fathi, Lu Lu, Joseph, Nil, and other graduate
students in Civil Engineering Department at the University of Ottawa for their assistance.
Finally, I thank the faculty and staff in Civil Engineering Department for providing
support to my graduate study.
11

Table of Contents
CHAPTER 1 1
INTRODUCTION 1
1.1 Statement of the Problem 1
1.2 Background 2
1.3 Objectives of the Research 4
1.4 Scope of the Thesis 5
1.5 Outline of the Thesis 6
CHAPTER 2 7
LITERATURE REVIEW 7
2.1 General 7
2.2 Bearing Capacity of Saturated Soils 7
2.2.1 Terzaghi (1943) 7
2.2.2 Meyerhof(1951) 11
2.2.3 Vesic(1973) 13
2.3 Settlement of Shallow Foundations 15
2.3.1 Introduction 15
2.3.2 Settlement from elastic theory 16
2.3.3 Modulus of elasticity 18
2.4 Failure Mechanisms in Shallow Foundations 19
2.4.1 General shear failure 19
2.4.2 Local Shear Failure 20
2.4.3 Punching Shear Failure 21
2.5 Bearing Capacity of Unsaturated Soils 23
2.5.1 Broms(1964) 23
2.5.2 Steensen-Bach et al. (1987) 24
2.5.3 Fredlund and Rahardjo (1993) 25
2.5.4 Olooetal. (1997) 28
2.5.5 Costa et al. (2003) 29
in

2.5.6 Mohamed and Vanapalli (2006) 30
2.5.7 Vanapalli et al. (2007) 36
2.6 Settlement Behavior of Unsaturated Soils 38
2.6.1 Oh et al. (2009) 39
2.7 Summary 43
CHAPTER 3 44
EQUIPMENTS AND METHODOLOGY 44
3.1 Introduction 44
3.2 Bearing Capacity Test System 44
3.3 Model Footings 45
3.4 Soil Container 46
3.5 Loading Frames 49
3.6 Triaxial Shear Apparatus 50
3.7 TempeCell 51
3.8 WP4-T 52
3.9 Suction Profile Set 54
3.10 Tensiometers 56
3.10.1 Tensiometer Structure 57
3.10.2 Principle and Methodology 57
3.10.3 Calibration of Tensiometer 58
3.10.4 Tensiometer Installation 59
3.11 Load Cell 59
3.12 Displacement Transducer 60
3.13 Data Acquisition System 61
3.14 Summary 62
CHAPTER 4 63
SOIL PROPERTIES 63
4.1 Introduction 63
4.2 Soil Type 63
4.3 Filtration sand 65
4.3.1 Chemical Analysis 65
IV

4.3.2 Suction Profile 65
4.3.3 Shear Strength 67
4.3.4 Soil Water Characteristic Curve (SWCC) 70
4.4 Quarry sand 71
4.4.1 Suction Profile 71
4.4.2 Shear Strength 72
4.4.3 Soil Water Characteristic Curve (SWCC) 74
4.5 Sil-co-sil 106 75
4.5.1 Chemical Analysis and Physical Properties 75
4.5.2 Suction Profile 75
4.5.3 Shear Strength 76
4.5.4 Soil Water Characteristic Curve (SWCC) 78
4.6 Min-u-sil 30 79
4.6.1 Chemical Analysis and Physical Properties 79
4.6.2 Suction Profile 79
4.6.3 Shear Strength 80
4.6.4 Soil Water Characteristic Curve (SWCC) 81
4.7 Summary 82
CHAPTER 5 83
RESULTS AND DISCUSSIONS 83
5.1 Introduction 83
5.2 Soil and Test Preparation 84
5.3 Bearing Capacity Test Programme 85
5.4 Results of Bearing Capacity and Settlement 87
5.4.1 Filtration sand 87
5.4.1.1 Bearing capacity 94
5.4.1.2 Settlement behavior 95
5.4.1.3 Comparisons between the measured and predicted bearing capacity values
and elastic settlements 96
5.4.2 Quarry sand 98
5.4.2.1 Bearing capacity 104
v

5.4.2.2 Settlement behavior 105
5.4.2.3 Comparisons between the measured and predicted bearing capacity values
and elastic settlements 106
5.4.3 Sil-co-sil 106 108
5.4.3.1 Bearing capacity 113
5.4.3.2 Settlement behavior 114
5.4.4 Min-u-sil 30 115
5.4.4.1 Bearing capacity 118
5.4.4.2 Settlement behavior 119
5.4.4.3 Comparisons between the measured and predicted bearing capacity values
and elastic settlements 120
5.5 Summary 121
CHAPTER 6 123
CONCLUSIONS AND RECOMMENDATIONS 123
6.1 Summary 123
6.2 Conclusions 124
6.3 Recommendations 125
REFERENCES 127
APPENDIX 133
VI

List of Figures
Figure 2.1 Bearing capacity failure in soil under a rough rigid continuous foundation
(modified after Terzaghi 1943) 8
Figure 2.2 Slip line fields for a rough continuous foundation (Meyerhof 1951) 11
Figure 2.3 Effect of ground water table on ultimate bearing capacity (modified after
Vesic 1973) 14
Figure 2.4 Footing on a compressible layer (Mayne and Poulos 1999) 17
Figure 2.5 Variation of IG with EJkEd and h/d (Mayne and Poulos 1999) 17
Figure 2.6 General shear failure in soil (modified after Terzaghi 1943 and Vesic 1963 by
Das 1999) 19
Figure 2.7 Local shear failure in soil (modified after Terzaghi 1943 and Vesic 1963 by
Das 1999) 20
Figure 2.8 Punching shear failure in soil (modified after Terzaghi 1943 and Vesic 1963
by Das 1999) 21
Figure 2.9 Nature of failure in soil with relative density of sand (Dy) and D/R (modified
after Vesic 1973) 22
Figure 2.10 The tire pressure versus wheel load of flexible pavement (Broms 1964) 24
Figure 2.11 General scheme of the SWCC measuring equipment (Steensen-Bach et al.
1987) 25
Figure 2.12 The component of cohesion due to matric suction for angles (Fredlund and
Rahardjo 1993) 26
Figure 2.13 Bearing capacity versus matric suction for a strip footing (Fredlund and
Rahardjo 1993) 27
Figure 2.14 Typical schematic pore-water profiles below a spread footing (Fredlund and
Rahardjo 1993) 27
Figure 2.15 General schematic of the testing assembly and used apparatus (Costa et al.
2003) 29
Figure 2.16 University of Ottawa Bearing Capacity Equipment (UOBCE) (Mohamed and
Vanapalli 2006) 31
vn

Figure 2.17 Variation of measured matric suction values in the UOBCE with depth along
with hydrostatic matric suction distribution (after Oh and Vanapalli 2008) 32
Figure 2.18 Vertical stress distribution contours obtained from SIGMA/W due to an
applied unit stress on a rigid footing in UOBCE (after Oh and Vanapalli 2008)..33
Figure 2.19 Comparison between measured and predicted bearing capacity of a
compacted unsaturated sand (Vanapalli and Mohamed 2007) 35
Figure 2.20 Relationship between the bearing capacity fitting parameter, y and the
plasticity index, Ip (Vanapalli and Mohamed 2007) 35
Figure 2.21 Equipment used for determining the bearing capacity of unsaturated soils
under undrained loading conditions (Vanapalli et al. 2007) 36
Figure 2.22 Comparison between the measured and predicted bearing capacity under
undrained loading conditions of compacted Indian Head till specimens (Vanapalli
etal. 2007) 38
Figure 2.23 Estimation of elastic settlement from plate load test (Oh et al. 2009) 39
Figure 2.24 Variation of the fitting parameter, a, with respect to model footing width for
coarse-grained sand (Oh et al. 2009) 40
Figure 2.25 SWCC, variation of modulus of elasticity, and immediate settlement with
matric suction from model footing tests in coarse-grained sand (Oh et al. 2009).41
Figure 2.26 Variation of elastic settlement with respect to various applied stresses for the
100 mm x 100 mm model footing in coarse-grained sand (Oh et al. 2009) 42
Figure 3.1 Bearing capacity test system (modified after Li 2008) 45
Figure 3.2 Different footings used in the research program 46
Figure 3.3 Schematic of the soil container with various elements (modified after Li
2008) 47
Figure 3.4 Various components of the soil container (modified after Li 2008) 48
Figure 3.5 ENERPAC loading frame 49
Figure 3.6 Triaxial Shear Apparatus 50
Figure 3.7 Tempe Cell Setup 51
Figure 3.8 WP4-T 53
Figure 3.9 Schematic diagram of suction profile set (Li 2008) 55
vin
Figure 3.10 Tensiometers of Model 2100 with aplastic holder 56
Figure 3.11 Schematic of the small-tip laboratory Tensiometer (Fredlund and Rahardjo
1993) 57
Figure 3.12 Operating principle of HAE ceramic cup (Lu and Likos 2004) 58
Figure 3.13 "S"-Beam load cell 20210 60
Figure 3.14 Linear Strain Transducer with a magnetic holder 60
Figure 3.15 NIUSB-6210 61
Figure 4.1 Summary of grain size distribution 64
Figure 4.2 Suction profile of Filtration sand 66
Figure 4.3 Stress versus strain response of triaxial specimens under different normal
stresses for the Filtration sand 68
Figure 4.4 Triaxial shear test result of Filtration sand .69
Figure 4.5 SWCC of Filtration sand in the suction range of 0 to 20 kPa 70
Figure 4.6 Suction profile of Quarry sand 72
Figure 4.7 Stress versus strain response of triaxial specimens under different normal
stresses for the Quarry sand 73
Figure 4.8 Triaxial shear test result of Quarry sand 73
Figure 4.9 SWCC of Quarry sand 75
Figure 4.10 Suction profile of Sil-co-sil 106 76
Figure 4.11 Stress versus strain response of triaxial specimens under different normal
stresses for the Sil-co-sil 106 77
Figure 4.12 Triaxial shear test result of Sil-co-sil 106 77
Figure 4.13 SWCC of Sil-co-sil 106 78
Figure 4.14 Suction profile of Min-u-sil 30 79
Figure 4.15 Stress versus strain response of triaxial specimens under different normal
stresses for the Min-u-sil 30 80
Figure 4.16 Triaxial shear test result of Min-u-sil 30 81
Figure 4.17 SWCC of Min-u-sil 30 82
IX

Figure 5.1 Applied pressure versus settlement of Filtration sand under the footing of 20
mm x 20 mm 87
Figure 5.2 Applied pressure versus settlement of Filtration sand under the footing of 37
mm x 37 mm 88
Figure 5.3 Applied pressure versus settlement of Filtration sand under the footing of
41.75 mm in diameter 88
Figure 5.4 Applied pressure versus settlement of Filtration sand under the footing of 50
mm x 50 mm 89
Figure 5.5 Failure surface of Filtration sand under the footing of 41.75 mm in
diameter 90
Figure 5.6 Applied pressure versus settlement of Filtration sand for 2 kPa and 8 kPa
under four footings 90
Figure 5.7 Well defined failure plane under model footing (Oh et al. 2009) 91
Figure 5.8 Failure surface of Filtration sand under the footing of 50 mm x 50 mm 92
Figure 5.9 The variation of bearing capacity and settlement behavior with respect to
matric suction of Filtration sand along with the SWCC 94
Figure 5.10 Comparisons of measured and predicted bearing capacity, and settlement of
Filtration sand 97
Figure 5.11 Variation of settlement with the parameter, a, for the footing 37 mm x 37 mm in Filtration sand 98
Figure 5.12 Applied pressure versus settlement of Quarry sand under the footing of 20
mmx 20 mm 99
Figure 5.13 Applied pressure versus settlement of Quarry sand under the footing of 37
mm x 37 mm 100
Figure 5.14 Applied pressure versus settlement of Quarry sand under the footing of 41.75
mm in diameter 100
Figure 5.15 Applied pressure versus settlement of Quarry sand under the footing of 50
mmx 50 mm 101
Figure 5.16 Failure surface of Quarry sand under the footing of 41.75 mm in
diameter 102
Figure 5.17 The variation of bearing capacity and settlement behavior with respect to
matric suction for Quarry sand along with the SWCC 104
x

Figure 5.18 Comparisons of measured and predicted bearing capacity, and settlement of
Quarry sand 107
Figure 5.19 Variation of settlement with the parameter, a, for the footing 41.75 mm in
diameter in Quarry sand 108
Figure 5.20 Applied pressure versus settlement of Sil-co-sil 106 under the footing of 20
mm x 20 mm 110
Figure 5.21 Applied pressure versus settlement of Sil-co-sil 106 under the footing of 37
mm x 37 mm 110
Figure 5.22 Applied pressure versus settlement of Sil-co-sil 106 under the footing of
41.75 mm in diameter I l l
Figure 5.23 Applied pressure versus settlement of Sil-co-sil 106 under the footing of 50
mm x 50 mm I l l
Figure 5.24 Surface of Sil-co-sil 106 after test under the condition of 2 kPa for different
footings 112
Figure 5.25 Relationship of bearing capacity versus matric suction of Sil-co-sil 106. ..113
Figure 5.26 Relationship of settlement versus matric suction of Sil-co-sil 106 114
Figure 5.27 Applied pressure versus settlement of Min-u-sil 30 under the footing of 20
mm x 20 mm 115
Figure 5.28 Applied pressure versus settlement of Min-u-sil 30 under the footing of 37
mm x 37 mm 116
Figure 5.29 Applied pressure versus settlement of Min-u-sil 30 under the footing of 41.75
mm in diameter 116
Figure 5.30 Applied pressure versus settlement of Min-u-sil 30 under the footing of 50
mm x 50 mm 117
Figure 5.31 Relationship of bearing capacity versus matric suction of Min-u-sil 30 118
Figure 5.32 Relationship of settlement versus matric suction of Min-u-sil 30 119
Figure 5.33 Comparisons of measured and predicted bearing capacity, and settlement of
Min-u-sil 30 120
XI

List of Tables
Table 2.1 Bearing Capacity Factors used in the research study, Nc and Nq from Terzaghi
(1943) and Ny from Kumbhojkar (1993) 10
Table 2.2 Terzaghi (1943) shape factors for various shallow foundations 10
Table 2.3 Variation of Meyerhof's Bearing Capacity Factors Nq, Nc and Ny (Meyerhof
1951) 12
Table 3.1 Specifications of WP4-T 54
Table 4.1 Summary of soil properties 82
Table 5.1 Summary of the various tests conducted at different matric suction values using
different model footing sizes 86
Table 5.2 Moduli of elasticity under four model footings of Filtration sand 96
Table 5.3 Moduli of elasticity under four model footings of Quarry sand 106
Table A.l Grain size distribution data of Filtration sand 133
Table A.2 Grain size distribution data of Quarry sand 133
Table A.3 Chemical analysis of Filtration sand 133
Table A.4 Suction profile data of Filtration sand 134
Table A.5 Suction profile data of Quarry sand 134
Table A.6 Typical Chemical Analysis of Sil-co-sil 106 (%) 134
Table A.7 Typical Physical Properties of Sil-co-sil 106 135
Table A.8 Suction profile data of Sil-co-sil 106 135
Table A.9 Typical Chemical Analysis of Min-u-sil 30 (%) 135
Table A.lOTypical Physical Properties of Min-u-sil 30 135
Table A. 11 Suction profile data of Min-u-sil 30 136
XII

CHAPTER 1
INTRODUCTION
1.1 Statement of the Problem
Conventional soil mechanics principles are commonly used in engineering practice
assuming soils are typically found in a state of saturated condition in nature. However,
soils typically have other fluids in the voids (e.g., air) along with water. There are
numerous soils; for example, expansive, compacted, residual, cemented, weakly bonded
or collapsible soils that are frequently encountered in engineering practice are typically in
a state of unsaturated condition. About 33% of the earth's surface is considered either arid
or semi-arid and the natural soils in these regions are unsaturated soils (Dregne, 1976).
The bearing capacity and settlement are two key parameters required in the design of
shallow foundations. The shallow foundations are usually located above the ground water
table where the soil is typically in a state of unsaturated condition. The stresses associated
with the loading of these foundations are also distributed within the unsaturated zone (i.e.,
above groundwater table). Therefore, the bearing capacity and settlement behavior should
be interpreted taking account of the influence of capillary stresses (i.e., matric suction).
However, in conventional engineering practice, foundations are designed assuming the soil
is in a state of saturated condition such that the design approach is conservative both for
bearing capacity and settlement behavior. The estimated bearing capacity is lower and the
settlement is larger by extending the conventional soil mechanics approach. Such
simplistic approaches are followed in engineering practice because a valid framework for
interpreting the bearing capacity of unsaturated soils is not available.
l

A rational approach for interpreting the mechanical behavior of unsaturated soils, using
two independent stress state variables, namely matric suction and net normal stress was
put forward by Fredlund and Morgenstern (1977). The matric suction is defined as the
difference between the pore air pressure, ua and pore water pressure, uw. Several studies
were undertaken to understand the contribution of matric suction towards the bearing
capacity of unsaturated soils (Broms 1964, Steensen-Bach et al. 1987, Fredlund and
Rahardjo 1993, Schnaid et al. 1995, Oloo et al. 1997, Miller and Muraleetharan 1998,
Costa et al. 2003, Yongfu 2004). However, it is only recently a framework has been put
forward to both interpret and predict the bearing capacity and settlement behavior of
unsaturated soils based on several research studies undertaken at the University of Ottawa.
More details of these studies are briefly summarized in the next section.
1.2 Background
Mohamed and Vanapalli (2006) designed a tank (900 mm x 900 mm x 750 mm) with
special provisions to determine the bearing capacity and settlement behavior of model
footings in both saturated and unsaturated conditions. Based on the bearing capacity
tests using two different sizes of square model footings (100 mm x 100 mm and 150 mm
x 150 mm) on a compacted, fine-grained sand), Vanapalli and Mohamed (2007) have
provided a relationship to both interpret and predict the variation of bearing capacity of
unsaturated soils with respect to matric suction using the saturated shear strength
parameters (c\ (/)) and the Soil-Water Characteristic Curve (SWCC). There was a good
comparison between the measured and predicted bearing capacity values. The proposed
relationship shows a smooth transition between the bearing capacity of unsaturated soils
and the conventional Terzaghi's (1943) bearing capacity equation for saturated soils.
Vanapalli et al. (2007) have conducted a series of model footing tests on statically
compacted unsaturated Indian Head till soil samples at different matric suction values to
2

determinate the contribution of matric suction towards bearing capacity of unsaturated
soils under undrained loading conditions. Based on the results of these studies, Vanapalli
et al. (2007) proposed a relationship for estimating the bearing capacity of unsaturated
soils under undrained loading conditions using the unconfined compression test results
under saturated condition and the soil-water characteristic curve (SWCC). There was a
good comparison between the measured and estimated bearing capacity values.
Oh & Vanapalli (2008) conducted finite element analysis using SIGMA/W of
GEO-SLOPE to model the stress versus settlement behavior of foundations in
unsaturated sands simulating the testing conditions summarized in Vanapalli & Mohamed
(2007) and Vanapalli et al. 2007. The results of the modeling studies show that the
conventional stress distribution theory concepts extending elastic analysis can be used to
estimate the stresses below foundation. In addition, the assumption of calculating the
average matric suction value from 0 to 1.5B depth region is reasonable as it provided
good comparison between the measured and predicted bearing capacity values for sands
in unsaturated conditions (Poulos & Davis, 1974). These results also show that the
bearing capacity of model footings of 50 mm width or lower can be conducted using
relatively smaller size tanks of 300 mm diameter. In other words, the results using tank
sizes greater than 300 mm also provide similar results when the model footings sizes are
less than 50 mm. This study results were encouraging as small scale model footing tests
can be used to generate experimental data more quickly and to understand the various
parameters that influence the bearing capacity and settlement behavior of unsaturated
soils; which are time consuming and difficult to conduct using large size model footing
tests.
Li (2008) conducted model footing tests to investigate the bearing capacity of three
compacted (coarse-grained, sub-coarse-grained, and fine-grained) sands under both
3

saturated and unsaturated conditions. These tests were conducted using four different
sizes of square model footings (20 mm x 20 mm, 25 mm x 25 mm, 37.5 mm x 37.5 mm,
and 50 mm x 50 mm) in two different soil containers (short container with 300 mm in
diameter and 300 mm in height and the tall container with 300 mm in diameter and 700
mm in height) that were specially designed and for conducting these tests. The trends of
experimental results were consistent with the earlier results of Mohamed and Vanapalli
(2006).
A semi-empirical model has been proposed by Oh et al. (2009) to predict the variation of
modulus of elasticity with respect to matric suction for unsaturated soils using the
soil-water characteristic curve (SWCC) and the modulus of elasticity under saturated
conditions. Using this model, three different sandy soils were used to compare the
predicted and measured moduli of elasticity and elastic settlements from model footing
test results. There was good agreement between the predicted and measured moduli of
elasticity and elastic settlements.
All the above studies were encouraging; however, there is a need to conduct more model
footing tests on different soils. In addition, it is also important to understand the various
parameters that influence the bearing capacity and settlement behavior of unsaturated
soils. Such studies will encourage the practicing engineers to extend the mechanics of
unsaturated soils into practice.
1.3 Objectives of the Research
The focus of the present research is to study bearing capacity and settlement behavior of
four different unsaturated soils under a controlled laboratory environment using four
different sizes of model footings in a specially designed apparatus.
4

The following objectives were addressed in the research presented in this thesis:
1) To determine the bearing capacity of four different soils using different size of
model footings under saturated and unsaturated conditions. Two of the soils
studied were coarse-grained sands and the other two were commercially available
Sil-co-sils that are commonly used in paste backfills.
2) To predict the variation of bearing capacities with respect to different matric
suction values using the SWCC and the saturated shear strength parameters and
provide comparison with the measured bearing capacity values.
3) To study the variation of settlement with respect to different matric suction values
under a certain applied stress and provide comparison with the measured and
predicted settlement values.
4) To investigate the influence of size and shape of model footings on the bearing
capacity and settlement behavior of unsaturated soils.
1.4 Scope of the Thesis
The experimental studies related to the research objectives listed in the earlier section
were undertaken at the Geotechnical Laboratory of the University of Ottawa. The shear
strength parameters, namely; the effective cohesion c' and the angle of internal friction </)
of the tested soils were determined using triaxial shear test. The SWCCs for the tested
soils were obtained using Tempe Cell Apparatus and WP4-T. Moreover, other soil
properties such as grain size analysis, suction profile (i.e. the relationship between matric
suction and depth of ground water table) were also determined in the laboratory using the
procedure developed by Li (2008). Different values of matric suction in the soil below the
model footings were achieved by lowering water table to different depths below the soil
surface. The matric suction values in the stress bulb zone under the footing were
confirmed by tensiometers located at different depths in the soil container before
conducting model footing tests under unsaturated conditions.
5

1.5 Outline of the Thesis
This thesis is organized into six chapters. This chapter provides the background
information related to studies undertaken with model footings at the University of Ottawa
and summarizes the objectives of the research program.
The second chapter, "Literature Review", provides a brief summary on the bearing
capacity and settlement of saturated and unsaturated soils.
The third chapter, "Equipments and Methodology", outlines the details of all the
equipments used in the experimental study, including the methodology for carrying out
the research.
The fourth chapter, "Soil Properties", details the properties of four soils which include the
grain size distribution, suction profile, soil-water characteristic curve (SWCC), and the
shear strength characteristics.
The fifth chapter, "Results and Analysis", reports all the test results. The relationship of
bearing capacity and settlement with respect to matric suction is discussed for different
soil studied as a part of the present research. In addition, the influence of footing size and
shape on the bearing capacity values and settlements are also discussed.
The last chapter, "Conclusions", presents summary and conclusions of this research.
Furthermore, experimental problems encountered during the research program are briefly
addressed and some recommendations are also advised for future research studies.
6
CHAPTER 2
LITERATURE REVIEW
2.1 General
Bearing capacity and settlement are two of the key parameters required in the design of
foundations, dams, retaining walls, bridge abutments, and temporary support structures.
This chapter compiles background information related to bearing capacity and settlement
behavior of soils both in saturated and unsaturated conditions. More focus has been
directed towards compiling recent research related to the interpretation and prediction of
the bearing capacity and settlement behavior of unsaturated soils.
2.2 Bearing Capacity of Saturated Soils
In this section, some of the important studies undertaken by various researchers that are
conventionally used in engineering practice with respect to the bearing capacity of
saturated soils are summarized.
2.2.1 Terzaghi (1943)
The failure surface at ultimate load under a continuous or strip foundation suggested by
Terzaghi (1943) is shown in Figure 2.1. The failure area in the soil under the foundation
load was divided into five zones, one Zone I and two pairs of Zone II and Zone III.
7

Figure 2.1 Bearing capacity failure in soil under a rough rigid continuous foundation (modified after
Terzaghi 1943)
i. The triangular Zone I under the footing base is considered as a part of the footing
and penetrates the soil like a wedge because of friction and adhesion between the
footing base and the soil,
ii. Zones II's that are located between Zone I and Zone III are known as the radial
shear zones which constitute the shear pattern lines that radiate from the outer edge
of the base of the footing,
iii. Zones Ill's are identical to Rankine passive state with respect to shear pattern lines
that develop in these zones.
Terzaghi extended the limit equilibrium method and suggested using equation [2.1] for
estimating the ultimate bearing capacity per unit area of the foundation. The bearing
capacity of the soil is dependent on the dimensions of the footing, the unit weight and the
saturated shear strength parameters, c' and </> .
qu=c'Nc+qNq+0.5ByNy [2.1]
where:
qu = ultimate bearing capacity, kPa
8

c = effective cohesion, kPa
</) = internal friction angle for saturated condition, deg.
q = effective overburden pressure, kPa
B = width of the footing, m
y = unit weight of the soil, kN/m3
Nc = bearing capacity factor due to cohesion
Nq = bearing capacity factor due to surcharge
N = bearing capacity factor due to unit weight
Terzaghi also proposed bearing capacity factors in terms of angle of internal friction, (p
as below:
e N«= T [22]
2 cos2 (45 + -H 2
Nc=(Nq-l)cot0 [2.3]
tf,=I*„tanV-^ [2-4]
where:
KD = tan2 (45 + ̂ /2) [2.5] py
Table 2.1 summarizes the variation of the bearing capacity factors with soil friction angle
0 . The values Nc and Nq are from Terzaghi (1943) and Rvalues were obtained by
9

Kumbhojkar (1993). Kumbhojkar (1993) study shows that bearing capacity computations
provide better comparisons with the measured bearing capacity values using the Ny values
based on his study results. Vanapalli and Mohamed (2007) and Oh and Vanapalli (2008)
studies also support these results.
Table 2.1 Bearing Capacity Factors used in the research study, Nc and Nq from Terzaghi (1943) and
N? from Kumbhojkar (1993)
0'
0 1 2 3 4 5 6 7 8 9 10 11 12 13 14 15 16
Nc
5.70 6.00 6.30 6.62 6.97 7.34 7.73 8.15 8.60 9.09 9.61 10.16 10.76 11.41 12.11 12.86 13.68
Nq
1.00 1.1 1.22 1.35 1.49 1.64 1.81 2.00 2.21 2.44 2.69 2.98 3.29 3.63 4.02 4.45 4.92
A/y
0.00 0.01 0.04 0.06 0.10 0.14 0.20 0.27 0.35 0.44 0.56 0.69 0.85 1.04 1.26 1.52 1.82
0'
17 18 19 20 21 22 23 24 25 26 27 28 29 30 31 32 33
Nc
14.60 15.12 16.57 17.69 18.92 20.27 21.75 23.36 25.13 27.09 29.24 31.61 34.24 37.16 40.41 44.04 48.09
Nq
5.45 6.04 6.70 7.44 8.26 9.19 10.23 11.40 12.72 14.21 15.90 17.81 19.98 22.46 25.28 28.52 32.23
A/v
2.18 2.59 3.07 3.64 4.31 5.09 6.00 7.08 8.34 9.84 11.60 13.70 16.18 19.13 22.65 26.87 31.94
0'
34 35 36 37 38 39 40 41 42 43 44 45 46 47 48 49 50
Nc
52.64 57.75 63.53 70.01 77.50 85.97 95.66 106.81 119.67 134.58 151.95 172.28 196.22 224.55 258.28 298.71 347.50
Nq
36.50 41.44 47.16 53.80 61.55 70.61 81.27 93.85 108.75 126.50 147.74 173.28 204.19 241.19 287.85 344.63 415.14
A/y
38.04 45.41 54.36 65.27 78.61 95.03 115.31 140.51 171.99 211.56 261.60 325.34 407.11 512.84 650.87 831.99 1072.80
Table 2.2 below summarizes the shape factor as defined by Terzaghi (1943).
Table 2.2 Terzaghi (1943) shape factors for various shallow foundations
Shape factor
Sc
uy
Strip footing
1.0
1.0
Square footing
1.3
0.8
Circular footing
1.3
0.6
Note 1: sc= shape factor due to cohesion
Note 2: sr= shape factor due to unit weight
Terzaghi (1943) included the shape factors and proposed the following relationships for
10

square and circular foundations.
qu = 1.3cNc + qNq + 0.4yBNy (square foundation) [2.6]
and
qu = 13cNc + qNq + 03yBNy (circular foundation) [2.7]
2.2.2 Meyerhof (1951)
Meyerhof (1951) suggested a bearing capacity theory which could be applied to rough
shallow and deep foundations. The failure surface at ultimate load under a continuous
shallow foundation assumed by Meyerhof (1951) is shown in Figure 2.2. In this figure,
abc is the elastic triangular wedge, bed is the radial shear zone with cd being an arc of a
log spiral, and bde is a mixed shear zone in which the shear varies between the limits of
radial and plane shear, depending on the depth and roughness of the foundation. The
plane be is called an equivalent free surface. The normal and shear stresses on plane be
are p0 and s0, respectively.
Figure 2.2 Slip line fields for a rough continuous foundation (Meyerhof 1951)
11

The ultimate bearing capacity, qu, of the continuous foundation is expressed similar to the
Terzaghi's equation.
qu =c'N'c+qN' +0.5B/N [2.8]
where:
N'c, N'q, Ny = bearing capacity factors associated with cohesion, surcharge and unit
weight which can be determined using the equations below:
Nq = eKXm* 1 + sin 0
1 - sin d)
N'C=(N'-Dcotj
Nr = (Nq-l)tm(lA</>)
[2.9]
[2.10]
[2.11]
Table 2.3 Variation of Meyerhof's Bearing Capacity Factors Nq, Nc and N7 (Meyerhof 1951)
0'
0 1 2 3 4 5 6 7 8 9 10 11 12 13 14 15 16
Nc
5.14 5.38 5.63 5.90 6.19 6.49 6.81 7.16 7.53 7.92 8.35 8.80 9.28 9.81 10.37 10.98 11.63
NQ
1.00 1.09 1.20 1.31 1.43 1.57 1.72 1.88 2.06 2.25 2.47 2.71 2.97 3.26 3.59 3.94 4.34
A/y
0.00 0.002 0.01 0.02 0.04 0.07 0.11 0.15 0.21 0.28 0.37 0.47 0.60 0.74 0.92 1.13 1.38
0'
17 18 19 20 21 22 23 24 25 26 27 28 29 30 31 32 33
Nc
12.34 13.10 13.93 14.83 15.82 16.88 18.05 19.32 20.72 22.25 23.94 25.80 27.86 30.14 32.67 35.49 38.64
Nq
All 5.26 5.80 6.40 7.07 7.82 8.66 9.60 10.66 11.85 13.20 14.72 16.44 18.40 20.63 23.18 26.09
A/v
1.66 2.00 2.40 2.87 3.42 4.07 4.82 5.72 6.77 8.00 9.46 11.19 13.24 15.67 18.56 22.02 26.17
0'
34 35 36 37 38 39 40 41 42 43 44 45 46 47 48 49 50
Nc
42.16 46.12 50.59 55.63 61.35 67.87 75.31 83.86 93.71 105.11 118.37 133.88 152.10 173.64 199.26 229.93 266.89
Nq
29.44 33.30 37.75 42.92 48.93 55.96 64.20 73.90 85.38 99.02 115.31 134.88 158.51 187.21 222.31 265.51 319.07
A/y
31.15 37.15 44.43 53.27 64.07 77.33 93.69 113.99 139.32 171.14 211.41 262.74 328.73 414.32 526.44 674.91 873.84
12

Table 2.3 summarizes the variation of N'q , N'c and /^obtained from Eqs. [2.9] and [2.10]
and [2.11], respectively. The new set of bearing capacity factors were suggested by
Meyerhof (1951) because failure zone surface is different in shape from the failure wedge
proposed by Terzaghi (1943).
2.2.3 Vesic (1973)
Vesic (1973) proposed an improved bearing capacity based on Terzaghi (1943) theory by
introducing different bearing capacity factors and shape factors which were
recommended for reliable computation of the bearing capacity. The shape factors
proposed by Vesic (1973) take into account the bearing capacity factors and the footing
dimensions.
qul, = cNjc+qNjq +0.57BN^r [2.12]
where:
Nqv=e™nUan2(45 + <p'/2)
#„ = (#„,-!)«**'
Nrv = 2(Nq+l)tan<p'
l=l + (B/L)(Nq/Nc)
gq=l + (B/L)tan<p'
£ = l-0.4(fl/L)
[2.13]
[2.14]
[2.15]
[2.16]
[2.17]
[2.18]
A/cv and N are not very different from Terzaghi's bearing capacity factors (i.e. Nc
and N ). However, the value of N is different due to differences in the assumption
13

with respect to the failure angle a (as shown in Figure 2.1). The Ny values of
Terzaghi (1943) and Meyerhof (1951) are lower than the values proposed by Vesic (1973).
The question of which set of N values are more appropriate has remained unsettled,
because of difficulties in selecting a representative value of angle of shearing resistance,
(f> for the bearing capacity factor Ny (Vesic 1973). However, more recently the
Afr values proposed by Kumbojkar (1993) are more widely used.
Vesic (1973) studies also show the position of the ground water table can influence the
bearing capacity of a footing significantly. It was recommended to base the bearing
capacity analysis assuming the highest possible ground water table level during the
lifetime of the foundation. If the highest ground water table level is within the depth,
zw < B below the foundation base, then the effective unit weight, y of the soil below
the foundation base was suggested to be calculated using the equation below (Figure 2.3):
Y=Y+\.-f\(ym-r) B
[2.19]
Dt
1_ Zw K-
Moist unit weight = v?
GWT
B _T_
Effective unit weight = y'
Figure 2.3 Effect of ground water table on ultimate bearing capacity (modified after Vesic 1973)
14

If zw = B, the effective unit weight should be taken as ym (moist unit weight) and for a
water table at or above the foundation level, the submerged unit weight should be used in
the Equation [2.12].
2.3 Settlement of Shallow Foundations
2.3.1 Introduction
The safety against bearing capacity failure as well as excessive settlement of the
foundation should be considered in the design of foundations. In many practical scenarios,
it is the settlement which will be the governing design criteria rather than the bearing
capacity of the soil. This section describes the procedures for estimating the settlement of
foundations due to simple axial load.
The settlement of a foundation can have three components: (a) elastic settlement, S,; (b)
primary consolidation settlement, Sc; (c) secondary consolidation settlement, Ss. Thus the
total settlement St can be expressed as
5 r=S, .+5 c+5, [2.20]
For any given foundation, one or more of the components may be zero or negligible.
Elastic settlement is caused by deformation of dry, saturated or unsaturated soil without
any change in moisture content (Das 1999). Primary consolidation settlement is a
time-dependent process which occurs in clayey soils located below the ground water
table as a result of the volume change in soil because of the expulsion of water that
occupies the void spaces. Secondary consolidation settlement follows the primary
15

consolidation process in saturated clayey soils is a result of the plastic adjustment of soil
fabric.
2.3.2 Settlement from elastic theory
Mayne and Poulos (1999) provided a general relationship for elastic settlement
calculation of footings using displacement influence factors derived from elasticity
continuum theory. It is assumed that the soil stiffness increases linearly with depth, from
a value of E0 at footing level. According to this theory (Figure 2.4):
qdIGIFIE(l-V2) [2.21]
where:
d = equivalent diameter of a rectangular footing
v = Poisson's ratio of soil
IG = displacement influence factor (Figure 2.5)
IE = settlement coefficient factor to account for depth of embedment
IF = rigidity coefficient factor
The relationships to estimate IE and If are:
' * = 1 -1
r K
' ' = 4 +
3.5exp(1.22v-0.4)
1
fd^
\Ze J + 1.6
[2.22]
[2.23]
4.6 + 10 "/
V 2 7 \d )
16

where Ef = modulus of elasticity of the footing material (which is, in most cases,
reinforced concrete), t = footing thickness, ze = embedment depth of the footing, and kg =
increase in soil stiffness per unit depth (i.e., Es-E0 + kEZ).
diameter, d « 2a>*-
Q = axial load flexible circular looting of radius a
thickness, t
1 Ej = (Ao,-2vAo,)/E(i
Ac,
AC, 'z 1
) Elastic Theory
- - 4 " ••Ao." Layer Ao. W . Depth, h
Ao,
q - Q/(ita ) - surface stress
\ Elastic Modulus, E ^Reference \
Point \
\ Es = E0 + kez
kE \
Depth, z
Poisson's ratio
' A Incompressible Base Layer (Eb = «) T%(
Figure 2.4 Footing on a compressible layer (Mayne and Poulos 1999)
1.0
J? E-
I II I ! J 1111 1 1 I I » H!| 1 1 I I l l l l | I
(Ueshtta & Meyerhof, 1968) T~ • ' » " » " l I I 1 Mill) .. ,,!„,», ,1 i I lllj 1, I, M.UlJ
0.01 0.1 1
E^kgd)
10 100
Figure 2.5 Variation of IG with EJk^d and hid (Mayne and Poulos 1999)
17

2.3.3 Modulus of elasticity
The magnitudes of immediate settlement for practical applications are evaluated from
Young's modulus Es and Poisson's ratio vv. Young's elastic modulus is commonly used
for estimation of settlement from static loads. Lade and Nelson (1987), Lade (1988), and
Lancelotta (1995) studies show that the elastic settlement is significantly influenced by
the stress-strain modulus, Es, while Poisson's ratio, v (which varies from 0.25 to 0.49)
does not play an important role. The modulus of elasticity, E, can be estimated both from
laboratory and field tests. In general, the modulus of elasticity from conventional triaxial
tests can be underestimated due to sample disturbance caused by stress relief and other
mechanical disturbances. To overcome this disadvantage, Davis and Poulos (1968)
suggested the use of ^-consolidation triaxial test results to derive the modulus of
elasticity. According to the test results by Simons and Som (1970), the modulus of
elasticity from ^-consolidation triaxial tests are significantly higher than those
determined from conventional undrained triaxial tests (Oh et al. 2009).
Plate load tests, cone penetration tests, pressuremeter tests or geophysical methods (i.e.,
seismic methods) are usually used to estimate the in situ modulus of elasticity. In the case
of plate load tests (or model footing tests), the modulus of elasticity, E, can be calculated
using Eq. [2.24] (Timoshenko and Goodier 1951).
1-v2
E = —BBI [2.241 AS/Aqp
where Ad I Aq is the slope of the settlement versus plate pressure, Bp'\s the width or
diameter of the plate, and Iw is the influence factor (i.e., 0.79 for a circular plate and 0.88
for a square plate).
18

2.4 Failure Mechanisms in Shallow Foundations
2.4.1 General shear failure
Figure 2.6 shows a shallow foundation of width B located at a depth Df below the
ground surface and supported by a dense sand or stiff clayey soil. If this foundation is
subjected to a load Q which is gradually increased, the load per unit area, q = Q/A (A =
area of the foundation), will increase and the foundation will undergo increased
settlement.
Load per unit area, q
at
w
(b)
Figure 2.6 General shear failure in soil (modified after Terzaghi 1943 and Vesic 1963 by Das 1999)
When q reaches a value equal to qu at foundation settlement S = Su, the soil
supporting the foundation undergoes sudden shear failure. The failure surface in the soil
is shown in Figure 2.6a, and the q versus S plot is shown in Figure 2.6b. This type of
failure is called general shear failure, and qu is the ultimate bearing capacity. In this
19

type of failure, a peak value q = qu is clearly defined in the load-settlement curve.
2.4.2 Local Shear Failure
If the foundation shown in Figure 2.6a is supported by a medium dense sand or clayey
soil of medium consistency (Figure 2.7a), the plot of q versus S will be as shown in
Figure 2.7b.
The magnitude of q increases with settlement up to q = qu, which is usually referred to
as the first failure load. At this time, the developed failure surface in the soil will be like
that shown by the solid lines in Figure 2.7a. If the load on the foundation is further
increased, the load-settlement curve becomes steeper and erratic with the gradual outward
and upward progress of the failure surface in the soil (shown by the broken lines in
Figure 2.7a) under the foundation.
< . " ' "~~*̂
-••••'V.-v»---:->?
< B — * .
k / *" *"" *"* * • « *
V ;•.••-;••:• ^ - - : ^ • - - , . . . . . . , . - , . , _ ,
Load per unit area, (J
Figure 2.7 Local shear failure in soil (modified after Terzaghi 1943 and Vesic 1963 by Das 1999)
20

When q becomes equal to qu (ultimate bearing capacity), the failure surface reaches the
ground surface. Beyond that, the plot of q versus S takes almost a linear shape, and a peak
load is never observed. This type of bearing capacity failure is called local shear failure.
2.4.3 Punching Shear Failure
Figure 2.8a shows the same foundation located on a loose sand or soft clayey soil. For
this case, the load-settlement curve will be like that shown in Fig. 2.8b.
A peak value of load per unit area, q, is never observed. The ultimate bearing capacity,
qu, is defined as the point where AS/A q becomes the largest and almost constant
thereafter.
This type of failure in soil is called punching shear failure. In this case, the failure surface
never extends up to the ground surface.
• • . • • • . / . v •'• ''•'•'
(a)
Load per unit area, q
Figure 2.8 Punching shear failure in soil (modified after Terzaghi 1943 and Vesic 1963 by Das 1999)
21

The nature of failure in soil at ultimate load is a function of several factors such as the
strength and the relative compressibility of soil, the depth of the foundation (Df) in
relation to the foundation width (fi), and the width-to-length ratio (B/L) of the foundation.
Vesic (1973) explained this behavior conducting extensive laboratory model tests using
model rectangular footings loaded on the surface of sand. The summary of Vesic's
findings is shown in Figure 2.9. In this figure, Dr is the relative density of sand, and the
hydraulic radius, R, of the foundation is defined as
P
where: A = area of the foundation = BL
P = perimeter of the foundation = 2(B + L)
Thus
BL R
2(B + L)
[2.25]
[2.26]
0
4
8
g tf
12
16
20
1
1
t 1
Punching
1
1
Local shear
1
1
General shear
\
\
\ "
1 20 40 60
Relative density, D, ("») 80 100
Figure 2.9 Nature of failure in soil with relative density of sand (D,) and Df/R (modified after Vesic
1973)
22

Equation [2.26] yields the relationship below for a square foundation, B =L.
4 [2.27]
From Fig. 2.9 it can be seen that, when Df I R> about 18, punching shear failure occurs
in all cases, irrespective of the relative density of compacted sand.
2.5 Bearing Capacity of Unsaturated Soils
The measured bearing capacity from field tests is typically higher than the estimated or
computed bearing capacity values using classical methods (Terzaghi 1943, Meyerhof
1951, Vesic 1973). This behavior may be attributed to neglecting the contribution of
suction towards the bearing capacity of soils (Steensen-Bach et al. 1987, Fredlund and
Rahardjo 1993). Significant advances were made during the last twenty years towards
understanding the engineering behavior of unsaturated soils; however, a valid framework
for interpreting the bearing capacity of unsaturated soils has not been developed until
recently. Some of the key research works related to the bearing capacity of unsaturated
soils are summarized in this section.
2.5.1 Broms (1964)
Broms (1964) was one of the earliest investigators to propose a method to evaluate the
bearing capacity of flexible pavement in unsaturated soils. This method assumed that the
failure takes place in fully saturated subgrade soil. The bearing capacity was found to be
a function of the degree of saturation, S, the apparent cohesion, c and internal friction
angle, <p. From this study, it was found that a decrease in the degree of saturation from
100 to 90% increased the bearing capacity of two fine-grained soils (i.e., silt and clay) by
approximately 2 and 8% respectively. Broms (1964) studies suggest that the bearing
23

capacity of the subgrade is reduced due to an increase in the degree of saturation. Figure
2.10 shows the relationship between the tire pressure and the ultimate wheel load with
respect to the degree of saturation, S. Apparently, the degree of saturation has a
significant effect on the bearing capacity of the pavement. These studies did not
consider the influence of suction, but were explained with reference of the degree of
saturation, S values.
300 250
£ 200
•5 150 a
§ 100 £ 80 UJ tc a. 60
ui
I 40 30
Figure 2.10 The tire pressure versus wheel load of flexible pavement (Bronis 1964)
2.5.2 Steensen-Bach et al. (1987)
Steensen-Bach et al. (1987) performed surface model footing (22 mm x 22 mm x 20 mm)
tests on Sollerod and Lund sand using a circular steel test pit (200 mm diameter x 120
mm height) under saturated and unsaturated conditions. The capillary pressure (i.e.,
matric suction) below the footings was determined by in-situ measurements using
Tensiometers and using the soil-water characteristic curves (SWCC) (Figure 2.11). It was
found that the measured bearing capacity of unsaturated sand is typically 4 to 6 times
higher than the saturated bearing capacity of the same soil. Based on experimental studies
on model tests on three different sands, Steensen-Bach (1987) concluded that the
presence of capillary pressures is certainly fact, not fiction, and its effect should be
24
T I 1 1 I T ' I ' ' 1 1 1—I I I I
S, »0.8
f*"P . >^>W.. I X I I l l l l t I 1.5 2 3 4 5 7 10 15 20 30 40 50 70 100
W, 1000 lb

carefully considered.
pjgji Membrane Sand Poms glassfilter
-0 ~ « - Crane
Tube with hypodermic needle
H (x yw) = Matric suction
Water reservior with paraffin oil to prevent evaporaton
Electronic balance
Figure 2.11 General scheme of the SWCC measuring equipment (Steensen-Bach et al. 1987)
2.5.3 Fredlund and Rahardjo (1993)
Fredlund and Rahardjo (1993) proposed bearing capacity equations for unsaturated soils
by extending conventional bearing capacity equations including the influence of matric
suction in the term apparent cohesion extending total stress approach.
The apparent cohesion consists of two components expressed by Equation [2.28]. The
first component is the effective cohesion, c' and the other component is the contribution
due to matric suction, (ua - uw). The contribution of matric suction, (ua - uw) can be
considered as an additional cohesion component in total stress approach. In other words,
the conventional bearing capacity theory can be extended to unsaturated soils by adding
the component of matric suction to effective cohesion, c'. The increase of the cohesion is
due to matric suction which is illustrated in Figure 2.12 for various (ph values.
25

cunsal=c+{ua-uw)tm<pb [2.28]
where:
Cunsat = total cohesion, kPa
tpb = internal friction angle with respect to matric suction, (deg.)
0 100 200 300 400 Matric suction, (ua - uw) (kPa)
Figure 2.12 The component of cohesion due to matric suction for angles (Fredlund and Rahardjo
1993)
A theoretical study was undertaken to evaluate the effect of soil matric suction on the
ultimate bearing capacity using a square footing embedded in clay type of soil. Based on
this study, it was reported an increase in the bearing capacity by 27% when the matric
suction increased by an amount equal to the undrained shear strength of the fine-grained
soil. Figure 2.13 shows the relationship between the bearing capacity of a strip footing for
various matric suction values, obtained by Fredlund and Rahardjo (1993).
26

2000
CL
*• 1600
2 1200 o> ,c
I 800 CD
IB I 400 3
- ' • • ' 1
$ =20°
1
• <p * 15 c' =5kPa Q
Df » 0.5 m -^
1
7
Syr
-
i
0 50 100 150 200 250 300 Matric suction, (ua - uw) (kPa)
Figure 2.13 Bearing capacity versus matric suction for a strip footing (Fredlund and Rahardjo 1993)
Profile 1 shows the variation of matric suction above the ground water table, while
Profile 2 is conventional analyses ignoring the influence of matric suction (Figure 2.14).
The use of Profile 1 should be encouraged in engineering practice, particularly in
semi-arid and arid regions because it is more rational. Conventional analyses for
saturated soils ignore the influence of contribution of matric suction towards bearing
capacity.
Profile 1 Unsaturated analyses
Excessive evaporation
Footing
Flooding dessicated soil
Footing _ Profile 2 H Conventinal analyses
GWT
Hydrostatic line
Pore-water pressure Pore-water pressure
Figure 2.14 Typical schematic pore-water profiles below a spread footing (Fredlund and Rahardjo
1993)
27

2.5.4 Oloo et al. (1997)
Oloo et al. 1997 proposed a method based on bearing capacity for designing unpaved
roads consisting of a base layer overlying a subgrade taking account of the influence of
matric suction. Furthermore, a general bearing capacity equation (Equation 2.29) that can
be used for computing the bearing capacity of unsaturated soils was proposed. The
proposed equation was tested on two fine-grained soils (i.e., Botkin silt and glacial till).
Two different scenarios were considered in this equation. In the first scenario, the matric
suction is considered to be uniform below the footing. In the second scenario, the
equation considers the variation of the matric suction under the footing as hydrostatic
above the ground water table.
qu^[c'+(ua-uJh(tan<P'-tan^) + (ua-uJ^an^b]Nco+0.5(r-Am^-)Nro [2.29] tan^
where:
Xm = rate of decrease of suction with depth
Nco, Nyn = bearing capacity factors proposed by Oloo (1994)
{ua ~ u w ) h = matr ic suction at the air entry value, k P a
{ua - u w ) s = matric suction at the surface, kPa
Oloo et al. (1997) further simplified Equation [2.29] to take the form as Equation [2.30]
assuming matric suction to be uniform within a layer of an unsaturated soil and the air
entry value, (ua-uw)h is close to zero.
qu =[c'+(ua -uw)tan0h]Nco+O.5BrNro [2.30]
28

The bearing capacity of an unsaturated soil increases linearly with matric suction if this
equation used. Equation [2.30] suggests that the soil desaturates immediately after
application of even small values of matric suction. Such an assumption is valid more for
coarse-grained soils in comparison to fine-grained soils. This assumption is simple for
practical purposes; however, it is not valid as several studies related to unsaturated soils
have shown that the engineering properties vary in a non-linear fashion with the matric
suction (Vanapalli et al. 1996).
2.5.5 Costa et al. (2003)
Costa et al. (2003) carried out a study to investigate the influence of matric suction on the
plate load test results performed on Lateritic soil deposit at a depth of 1.5 m, which was
in a state of unsaturated condition. Matric suction was monitored during the tests with
tensiometers installed at the bottom of the testing pit as shown in Figure 2.15. The
bearing plate was 0.8 m in diameter and 25 mm in thickness.
anchor pile
steel rod
steel rod
hydraulic jack
tensiometer. compression post
bearing plate
Figure 2.15 General schematic of the testing assembly and used apparatus (Costa et al. 2003)
29

Field test results show that small increases in matric suction lead to substantial increases
in bearing capacity of the soil-plate system. Changes in matric suction were observed to
significantly influence settlement response, particularly for high levels of surcharge load.
The rate of settlement shows a non-linear decreasing trend with increasing soil matric
suction.
Costa et al. (2003) proposed a bearing capacity equation (Equation [2.31]) for
comparisons with the experimental results.
<rp = rHNqCq+0.5yBNrCr + {c'+(ua-uw)tznf}NeCe [2.31]
where:
a = predicted failure stress,
H = depth of the bearing plate,
N, Nc, N = bearing capacity factors (estimated according to Vesic 1973), and
£ , Cy> Cc = s n a P e factors (estimated according to Vesic 1973)
Equation [2.31] however does not provide reasonable comparisons between the measured
and predicted bearing capacity values.
2.5.6 Mohamed and Vanapalli (2006)
Mohamed and Vanapalli (2006) carried out model footing tests in a specially designed
bearing capacity tank (University of Ottawa Bearing Capacity Equipment, UOBCE,
900x900x750 mm), which has provisions to simulate both saturated and unsaturated
conditions in the tank (Figure 2.16). Two different sizes of model footings (i.e.
lOOmmx 100mm and 150mmx 150mm) were used to determine the values of bearing
capacity with respect to matric suction of compacted coarse-grained sand.
30

1. Roller 2. Reaction beams 3. Hopper 4. Crank 5. Piezometer 6. DAS (Data acquisition
System) 7. Thin geotextile sheet 8. Drainage valve 9. Dead loads 10. Loading machine 11. Electrical motor 12. Loading arm 13. Tensiometers 14. Stiffeners 15. C-clamps 16. Aggregate layer 17. Supporting beams 18. Steel base
Figure 2.16 University of Ottawa Bearing Capacity Equipment (UOBCE) (Mohamed and Vanapalli
2006)
Figure 2.17 shows the variation of matric suction values with depth which were measured
using several tensiometers in the UOBCE. The matric suction value at the centroid of the
matric suction distribution diagram from 0 to 1.5B depth region was considered as the
average value of matric suction (i.e., 6 kPa in this case) for the analysis of the
experimental results. This is the zone of depth in which the stresses due to loading are
predominant (Poulos and Davis, 1974).
31

10-
150 -
300-
5 0 0 -
6 0 0 -
(T) measured matric suction
(T) linear variation of simplified matric suction
(7) Tensiometer (7) Model footing
>~<ih
UWJAiL')AQ
Average T suction value |1-5B X J 1
GWT
Figure 2.17 Variation of measured matric suction values in the UOBCE with depth along with
hydrostatic matric suction distribution, (after Oh and Vanapalli 2008)
Oh and Vanapalli (2008) conducted computer modelling studies using the results of
Vanapalli and Mohamed (2007) which is shown in Figure 2.18. The vertical stress
distribution contours due to an applied unit stress on rigid footing using axisymmetric
analysis (Diameter = 112.8 mm, which represents an equivalent diameter for 100 x 100
mm square footing) in the UOBCE were modeled. The results shown in Figure 2.18 were
obtained from the finite element analysis (SIGMA/W of GEO-SLOPE) using linear
elastic model. It can be seen that the stress intensity under the center of a footing at a
depth lower than 1.5B is less than 0.15 in comparison to the applied unit stress at the
surface. These results are consistent with the conventional stress distribution theory
concepts based on elastic analysis and support the assumption that the average matric
suction value can be estimated from 0 to 1.5B depth region (Vanapalli and Mohamed,
2007). The stress distribution diagram illustrates that bearing capacity model studies can
be undertaken using relatively smaller size tanks such as 300 mm diameter yielding
similar results.
32

Unit stress
Surface
WWmmXKKKKKKKKKKKKK,
Figure 2.18 Vertical stress distribution contours obtained from SIGMA/W due to an applied unit
stress on a rigid footing in UOBCE (after Oh and Vanapalli 2008)
Vanapalli and Mohamed (2007) proposed an equation to both interpret and predict the
variation of bearing capacity with respect to matric suction for surface model footings on
unsaturated soils using the saturated shear strength parameters (i.e. c and 0 ) and the
SWCC as below:
quk^[c +{ua-uw)b{\-Sv)i^(l) +{ua-uw)AVRSv tm(f}xNcl+Q.5BYNYi y?r
[2.32]
where:
qul! = the ultimate bearing capacity
{// = a fitting parameter, (ua -uw)AVR is average (representative) suction value, B is
the width of footing.
33

L = the length of footing
y = soil unit weight
Nc, N = bearing capacity factors from Terzaghi (1943)
N? = bearing capacity factor from Kumbhokjar (1993)
£c, E,y = shape factors from Vesic (1973) which can be determined using the equations
below
L = 1.0 + rN^
KNcj (-)
1.0-0.4 'B^
v w
[2.33]
[2.34]
Vanapalli and Mohamed (2007) provided comparisons between the measured bearing
capacity values and predicted bearing capacity values using some of their own results and
others from literature of unsaturated soils for both coarse and fine-grained soils. There
was a reasonable good comparison. Figure 2.19 shows a typical result of their studies on
coarse-grained sand.
Moreover, Vanapalli and Mohamed (2007) also provided a relationship (Figure 2.20)
between the fitting parameter, y/ and / that can be used for predicting the bearing
capacity of unsaturated soils as given below:
yr = -0.0031(//) + 0.3988(/p) +1
where / = plasticity index
[2.35]
A best-fit between the measured and predicted bearing capacity values for sands was
achieved using y/ value equal to 1 according to the test results by Mohamed and
34

Vanapalli (2006). The approach for predicting the bearing capacity of unsaturated soil is
similar to the approach proposed by Vanapalli et al. (1996) to predict the variation of
shear strength with respect to suction using the effective shear strength parameter c' and
4 along with the SWCC.
Experimental Results
Proposed Results
£ 1200
CO Q. (0
o O)
_c
re 0)
CQ
800
400
2 4 6 8
Matric suction, (ua -u v ) (kPa)
10
Figure 2.19 Comparison between measured and predicted bearing capacity of a compacted
unsaturated sand (Vanapalli and Mohamed 2007)
&- 6
n
0
1 1 1 ^ x 1 1 1 J? 1 1 1 sS^1>
Botkin Pit S i l t J / ^ /
/ s' Glacial Till
I / V I I / . I I I fr' l l
3 different sands Z/^ \ \ 1 I y^ l I
7 3r •"- u
/ s^ i / / i
!r 1 1 1
>F = -0.0027(/)2)+0.3987(/l)+1
i i i i
i i i i
5 10 15
Plasticity index, /
20
Figure 2.20 Relationship between the bearing capacity fitting parameter, if/ and the plasticity index, Ip
(Vanapalli and Mohamed 2007)
35

2.5.7 Vanapalli et al. (2007)
Vanapalli et al. (2007) have conducted a series of model footing tests on statically
compacted unsaturated Indian Head till soil samples at different matric suction values to
determinate the contribution of matric suction towards bearing capacity of unsaturated
soils under undrained loading conditions by using specially designed equipment (Figure
2.21).
Figure 2.21 Equipment used for determining the bearing capacity of unsaturated soils under
undrained loading conditions (Vanapalli et al. 2007)
The soil was compacted in a high strength plastic mould. During the saturation process of
the compacted specimen, a compactor plate was securely placed on the surface of
compacted soil and fixed to the cross bar of the loading machine to prevent any possible
volume change of soil due to swelling. The compacted soil was saturated using a
downward flow of water simulating natural flow behavior in field conditions. This flow
was achieved through drainage holes on the compaction plate. Once the compacted soil in
the plastic container was fully saturated, it was subjected to natural air drying for several
days. The changes in the suction values with respect to depth in the soil sample due to air
36

drying were monitored using tensiometers.
The bearing capacity was determined using a 50 mm x 50 mm footing which was loaded
in a conventional loading frame. After the tests, three specimens were collected from the
compacted soils using 50mm diameter stainless steel thin-wall tubes. Two of the
specimens were used for measuring the undrained strength by conducting unconfined
compression tests (1.14 mm/min). The third specimen was used for measuring matric
suction following axis translation technique to verify the accuracy of the suction
measurements of tensiometers. In addition, the water content variation with respect to
depth was also investigated.
Using the results of these studies, Vanapalli et al. (2007) proposed a relationship for
estimating the bearing capacity of unsaturated soils under undrained loading conditions
from unconfined compression test results.
The bearing capacity can be predicted with the equation:
^=[qMllBUal)f2]llHBfLXNq/NcWa [2.36]
where:
qult = ultimate bearing capacity, kPa
qu(msal) = unconfined compression shear strength for an unsaturated soil, kPa
Nc, N = cohesion and surcharge factors
Ncs = factors associated with cohesion under undrained condition
B, L = footing width and length, m
Equation [2.36] is similar in form as Skempton (1948) equation for estimating the bearing
capacity of saturated soils from conventional unconfined compression test results. Figure
37

2.22 shows that there is a good comparison between the measured bearing capacity
values from model footing tests and estimated bearing capacity values from unconfined
compression tests.
500
400
0. J*
q 300 m •o u U 200
Q.
100
0 0 100 200 300 400 500
Measured B.C (kPa) Figure 2.22 Comparison between the measured and predicted bearing capacity under undrained
loading conditions of compacted Indian Head till specimens (Vanapalli et al. 2007)
2.6 Settlement Behavior of Unsaturated Soils
The settlement behavior typically governs the design of a foundation in comparison to the
bearing capacity of the soil in several scenarios. This is particularly true for
coarse-grained soils such as sands in which foundation settlements are immediate in
nature. Foundations are conventionally designed assuming that the soil in which they are
placed is in a saturated condition. The concepts of conventional soil mechanics may not
be valid in the estimation of elastic settlement of foundations in unsaturated soils. Several
investigations have shown that the elastic settlement in shallow foundations can be
significantly reduced due to the contribution of matric suction (Oh et al. 2009).
•
-
55 kPa
yO v =
100 kPa
O /
= 0kPa
205 W * /
°S
38

2.6.1 Oh etal. (2009)
Oh et al. (2009) have proposed a semi-empirical model to predict the variation of
modulus of elasticity with respect to matric suction for unsaturated sandy soils using the
soil-water characteristic curve (SWCC) and the modulus of elasticity under saturated
conditions.
Equation [2.24] was used to determine the modulus of elasticity for saturated conditions.
A value of 0.3 was used for v in the study, assuming drained loading conditions for the
tested sands. The procedure used in the calculation of elastic settlement for saturated
conditions is illustrated in Figure 2.23.
App
lied
str
ess
t AqP
1
,
/ (1-v2)BPlw
' ^ ( A 6 )
I AqPJ v = 0.3 (assuming drained loading conditon)
Settlement A5
Figure 2.23 Estimation of elastic settlement from plate load test (Oh et al. 2009)
A simple equation is proposed by Oh et al. (2009) for predicting the variation of modulus
of elasticity of unsaturated sandy soils using the SWCC and the modulus of elasticity
under saturated conditions.
39

(u —u ) , „\ F -F +F a— —(s^V
(pa/\oo){ > [2.37]
where Eunsat is modulus of elasticity under unsaturated conditions, Esat is modulus of
elasticity under saturated conditions, a and /? are fitting parameters, and Pa is atmospheric
pressure (i.e., 100 kPa). In Eq. [2.37], the terms S? and the parameter, a control the
nonlinear variation of the modulus of elasticity. The term (Pa/100) was used for
maintaining consistency with respect to the dimensions and units on both sides of the
equation. The value of /? is similar to using fitting parameter ^ (i.e., 1 for predicting the
bearing capacity of sandy soils; see Equation [2.35]). Fitting parameter a is related with
model footing size. A relationship between the parameter a and footing width for
coarse-grained soils is shown in Figure 2.24. However, more tests using larger footing
sizes would be valuable to verify this relationship.
3.0
2.5 h
a 2.0 -
I 1.5 2 O. 1.0 -
0.5 -
0.0
Coarse-grained sand R2 = 1
Xf
jor a = 0.033 + 0.011 B + 3.6 x KT^B2
37.5 100.0
Model footing width, B (mm)
150.0
Figure 2.24 Variation of the fitting parameter, a, with respect to model footing width for
coarse-grained sand (Oh et al. 2009)
40

100 S
Measured from Tempe cell apparatus
Residual value
2 4 6 8
Matric suction, (ua-uw)(kPa)
Figure 2.25 SWCC, variation of modulus of elasticity, and immediate settlement with matric suction
from model footing tests in coarse-grained sand (Oh et al. 2009)
41

Figure 2.25 shows the SWCC, the variation of modulus of elasticity, and elastic
settlement with respect to matric suction for model footing tests conducted on
coarse-grained sand. Comparisons are provided between the measure and predicted
values of elastic settlements for an applied stress of 40 kPa. The results show there is
good agreement between the predicted and measured moduli of elasticity and settlements.
Figure 2.26 shows the variation of elastic settlement with respect to matric suction for
different applied stress values in the range of 40 to 400 kPa for the 100 mm x 100 mm
model footing tested in coarse-grained sand. For the applied stress of 400 kPa, the
minimum elastic settlement is 3.50 mm at a matric suction value of 5 kPa. This elastic
settlement value is the same as the value measured for an applied stress of 100 kPa at a
matric suction value of 0.5 kPa. The study shows that elastic settlements in shallow
foundations can be significantly reduced even if low matric suction values are maintained
in sandy soils.
25
20
c a> E i> 10
a> CO
5
0 0 1 2 3 4 5 6 7 8 9 10
Matric suction, (ua-uw) (kPa)
Figure 2.26 Variation of elastic settlement with respect to various applied stresses for the 100 mm x
100 mm model footing in coarse-grained sand (Oh et al. 2009)
42

2.7 Summary
A comprehensive review of the background related to bearing capacity and settlement of
saturated and unsaturated soils is presented in this chapter. There are many methods
available for determining the bearing capacity and settlement behavior such as standard
penetration tests (SPT) or cone penetration tests (CPT). Several studies are conducted and
are in progress at the University of Ottawa for estimating the bearing capacity and
settlement behavior of unsaturated sands from CPT results (Mohamed and Vanapalli 2009;
Mohamed et al. 2010). However, only those methods that can be used for interpreting the
model footing results with respect to the bearing capacity and settlement behavior are
summarized in this Chapter.
In summary, the contribution of matric suction towards bearing capacity and settlement
behavior of unsaturated soils cannot be ignored. The simple models proposed by
Vanapalli and Mohamed (2007) and Oh et al. (2009) for predicting the bearing capacity
and settlement behavior are useful tools. However, there is a need to perform more
laboratory studies to better understand how the various parameters such as the footing
size and type of soil influence the bearing capacity and settlement behavior of
unsaturated soils. These studies form the focus of research presented in this thesis.
43

CHAPTER 3
EQUIPMENTS AND METHODOLOGY
3.1 Introduction
This chapter provides details of the bearing capacity testing system that was specially
designed at the University of Ottawa for determining the bearing capacity and settlement
behavior of model footings in saturated and unsaturated conditions. Another unit, referred
to as the suction profile set for determining the variation of capillary suction (i.e., matric
suction) with respect to depth above the ground water table unit is also described. In
addition, equipment details of the Tempe Cell and Decagon's WP4-T Dewpoint
PotentiaMeter used for measuring the Soil-Water Characteristic Curve (SWCC) are also
provided. Other equipment such as the triaxial shear apparatus used for measuring the
saturated shear strength parameters is briefly discussed. The methodologies associated
with conducting the various laboratory tests required for the research program presented
in this thesis are also summarized.
3.2 Bearing Capacity Test System
Figure 3.1 shows the bearing capacity test system along with a soil container and other
accessories. An electrically operated and mechanically controlled loading machine with a
robust loading frame is used for this test system. More elaborate design details of this
equipment are available in Li 2008 and Vanapalli et al. 2010.
The model footing can be placed on the surface of the compacted soil specimen in the
soil container under both saturated and unsaturated conditions and loaded to failure using
a loading frame. Some key details related to the system and the other elements are
discussed in later sections of this chapter.
44

1. Loading frame
3. Soil container
5. Settlement transducer
7. Model footing
9. Data acquisition system
2. Loading machine
4. Water container
6. Load cell
8. Tensiometer
10. Suction profile set
Figure 3.1 Bearing capacity test system (modified after Li 2008)
3.3 Model Footings
Four aluminum footings were used in the research program. They include three square
footings with dimensions of 20 mm x 20 mm, 37 mm x 37 mm and 50 mm x 50 mm and
one circular footing with diameter of 41.75 mm. The footings of 37 mm x 37 mm and
41.75 mm in diameter have equivalent area which is equal to 1369 mm2. The objective of
using different size and shape footings in this study is to understand the influence of
footing size and shape on the bearing capacity and settlement behavior of unsaturated
soils (Figure 3.2).
45

Figure 3.2 Different footings used in the research program
All the model footings are relatively smaller in size in comparison to the diameter of the
bearing capacity tank soil container. The ratio of the soil container size to the model
footing sizes used in the present study is greater than 6. Adams and Collin (1997), Carter
(2006) and Vanapalli et al. (2007) experimental studies show that there would be no
influence of stresses on the boundaries of the soil container due to the applied loads on
the footing by using ratio of the soil container size to the model footing size of 6 or
greater. In other words, the size of soil container which is greater than the present soil
container will also provide the same bearing capacity values. Earlier studies by Poulos
and Davis (1974) and more recent modeling studies by Oh and Vanapalli (2008) also
support these findings. More details on the influence of size of the footing were discussed
in the results and discussions (i.e. Chapter 5).
3.4 Soil Container
The bearing capacity tank soil container has several other features to systematically
conduct the bearing capacity tests using model footings. This unit facilitates saturation
and desaturation of the soil sample in the container. Figure 3.3 shows the schematic of the
container with all the various elements.
46

Figure 3.3 Schematic of the soil container with various elements (modified after Li 2008)
Figure 3.4 shows the different individual elements of the soil container system. The soil
container assembly is fabricated from cylindrical tube of 300 mm in diameter, 700 mm in
height and 8 mm in thickness is shown in Figure 3.4a. Figure 3.4b shows the base plate
with circular grooves to facilitate gradual and even drainage of water into and out of the
container. The circular grooves of the bottom plate are covered using a stainless steel lid
(Figure 3.4c) of 260 mm in diameter and 1.25 mm in thickness with small holes (2 mm in
diameter). Above the lid, a geotextile and filter paper are provided (Figure 3.4d) to
prevent the soil particles from getting into the circular grooves of the base plate and
valves.
The soil container allows lowering the water table to a depth of 700 mm below soil
surface. By varying the depth of water table, different values of capillary suction (i.e.,
matric suction) can be achieved below the footing for conducting the bearing capacity
tests. In other words, the variation of bearing capacity with respect to matric suction for
model footings can be determined using this equipment. The settlement behavior of
model footings can also be studied simultaneously.
47

(8(Q)(fl)<£ 5 1 -1351® psnjjpjraiui) jramratgjiiro p u s sup JJHJ spraniujidkiirosi ajraniyi

3.5 Loading Frames Figure 3.5 shows ENERPAC loading frame. The frame is a part of H-Frame Presses made
by Enerpac Hydraulic Technology. It is made of steel and its height is 1930 mm (76") and
1030 mm (i.e., 40.50") of wide. It has a capacity of 50 tons.
Engineering Laboratory Equipment Ltd. loading machine is attached on the top of this
frame. This unit is an electrically operated and mechanically controlled loading system
for loading the model footings. The engine is mounted on and fixed to the frame by a
piece of specially designed steel (250 mm x 400 mm x 8 mm) and bolts which were
designed and manufactured at the University of Ottawa student workshop.
Figure 3.5 ENERPAC loading frame
49

3.6 Triaxial Shear Apparatus
Triaxial shear apparatus used for determining the saturated shear strength parameters is
TRI-FLEX 2 system manufactured by ELE International, Ltd. The TRI-FLEX 2 Triaxial
System is a versatile unit with loading machine, triaxial cell and other accessories and
can accommodate up to 4" (102 mm) diameter test specimen, a free-standing
multi-function compact control panel and three pressure interface devices (Figure 3.6).
Figure 3.6 Triaxial Shear Apparatus
The effective shear strength parameters of the four soils (i.e., c' and 0') used in this
research program were determined under consolidated drained conditions in the present
research program following the procedures summarized in ASTM D4767-04. The
experiments were conducted assuring fully drained conditions (i.e., the pore-water
pressure was equal to zero). More details about the soil specimen preparation and strain
rate are discussed in Chapter 4.
50

3.7 Tempe Cell
The setup details used in the present research program for measuring the SWCC in the
laboratory using the Tempe Cell Apparatus is shown in Figure 3.7. A soil specimen with
the same density as the soil in the bearing capacity cylinder (see Fig. 3.1, item 3) can be
placed on the saturated ceramic disk in the Tempe Cell for measuring the SWCC.
Figure 3.7 Tempe Cell Setup
The soil specimen in the Tempe Cell was saturated prior to the measurement of the
SWCC by allowing access of water from a container that was placed at a higher level.
This technique facilitates removal of any air bubbles from the specimen, which will
collect on the soil specimen surface. After the specimen was saturated, a known value of
matric suction value was applied by increasing the air pressure in the Tempe cell. The
applied air pressure, ua will be equal to the matric suction, (ua - uw) as the pore-water
51

pressure, uw at the bottom of the soil specimen is equal to atmospheric pressure (i.e., zero
value). The water expelled from the specimen due to the application of the matric suction
is collected in a separate tube from the bottom of the ceramic disk.
A time period of one day or two days is required for achieving equilibrium conditions
with respect to each applied matric suction value. The mass of the Tempe cell is
continuously monitored on an electronic balance. The water content is determined for
each applied pressure by calculating the lost mass of the Tempe Cell. The SWCC is
obtained from the water content versus matric suction relationship. Typically, a minimum
of 6 to 8 readings of different matric suction values will be used for obtaining the SWCC.
Two pressure gauges (one with a range of 0 to 10 kPa and another with a range of 0 to
200 kPa) were used for determining the SWCC. The 10 kPa range pressure gauge was
used for determining the SWCC of coarse-grained soils (i.e., Filtration sand and Quarry
sand). This narrow range pressure gauge is useful to precisely apply small pressures to
carefully determine the air-entry value and residual suction value from the SWCC of the
coarse-grained soils. The various zones of the SWCC for the coarse-grained soils are
typically in the range of 0 to 10 kPa. However, for fine-grained soils, both the pressure
gauges were used. The pressure gauge with the 10 kPa range was used for obtaining the
SWCC in the low matric suction range (i.e., 0 to 10 kPa); and the 200 kPa pressure gauge
was replaced measuring the SWCC in the matric suction range of 10 to 200 kPa. For
suction values greater than 200 kPa, WP4-T is used.
3.8WP4-T
The SWCC range for fine-grained soils (i.e., Sil-co-sil 106 and Min-u-sil 30) typically
extends over a large suction range from 0 to 10,000 kPa. However, as described earlier,
the pressure range for Tempe Cell is from 0 to 200 kPa. The WP4-T (Figure 3.8)
measures water potential from 0 to -300 MPa and uses an internal fan that speeds up
equilibration to reduce measurement times to less than 5 minutes. Therefore, for large
suction values (i.e. larger than 200 kPa) of Sil-co-sil 106 and Min-u-sil 30, the WP4-T
was used to determine the water content versus matric suction relationship.
52

The WP4-T works on the principle of chilled mirror technique according to ASTM
D6836-02. The WP4-T consists of a sealed block chamber in which the soil sample can
be placed in a 15 ml polyurethane sampling cup. The block chamber consists of a mirror
and an optical sensor for detecting condensation on the mirror. At equilibrium of the
sample with the chamber environment, the WP4-T measures water potential of the air in
the chamber which is the same as water potential of the soil sample. With the help of the
built in software, the total suction of the soil sample is displayed on the LCD panel. The
matric suction is approximately equal to total suction assuming that osmotic suction is
negligible as the soils do not have salt concentrations. The corresponding water content
of the soil sample was then determined using oven following the procedures described in
ASTMD2216.
Figure 3.8 WP4-T
Table 3.1 summarizes the specifications of WP4-T which are from Decagon Devices, Inc.
website.
53

Table 3.1 Specifications of WP4-T
Accuracy:
Range:
Measurement Time:
Temperature Control:
Sensor Type:
Operating Environment:
Universal Power:
Warranty:
Sample Dish Capacity:
Weight:
Dimensions:
Case Material:
Data Communications:
Display:
Interface Cable:
±0.1 MPa from 0 to -10 MPa
l%from-10to-300MPa
0 to -300 MPa
~5 minutes for most soil samples
-20 minutes for plant tissue samples
15to50°C(±0.2°C)
1) Chilled-mirror dewpoint sensor
2) Infrared temperature sensor
5to43°C(41toll0°F)
110 V to 220 V AC, 50/60 Hz
1 years, parts and labor
7 ml recommended (15 ml full)
3.2 kg (5.2 kg shipping weight)
24.1 x 22.9 x 8.9 cm (9.5 x 9.0 x 3.5 in)
Powder-painted aluminum
RS232 compatible
8-data bit ASCII code
9600 baud
no parity
1 stop bit
20 x 2 alphanumeric dot-matrix LCD with backlighting
Standard RS232 serial cable (included)
3.9 Suction Profile Set
The suction profile set (Figure 3.9) designed by Li (2008) facilitates in the development
of a pre-calibrated relationship between the capillary stresses (i.e., matric suction) and the
soil depth varying the depth water table below the surface of any desired soil. The matric
suction in the soil (i.e., above the water table) can be measured using tensiometers.
Typically two tensiometers were installed in the soil which has the same density as the
soil in the bearing capacity cylinder (see Fig. 3.1, item 3) at 50 mm and 100 mm below
54

the soil surface to measure the matric suction. Equilibrium conditions with respect to
matric suction values were typically achieved in a period of 12 to 24 hours.
Figure 3.9 Schematic diagram of suction profile set (Li 2008)
The set consists of a long transparent acrylic soil column (50 mm in diameter and 1500
mm in height), a water container, thin plastic drain tube, valves and a pulley block.
Suction profile set is fixed on the left side of the bearing capacity frame (see Figure 3.1,
item 10). The pre-calibrated relationship measured between matric suction and depth of
water table can be used to achieve expected matric suction values in the soil container of
55

bearing capacity test system quickly by adjusting the water table depth. This relationship
was verified using tensiometers measuring the suction values in the soil container of
bearing capacity test system.
This technique discussed above can eliminate the soil fabric disturbance that may
contribute to unreliable measurement of matric suction using tensiometers. The matric
suction should be reliably measured as its range is narrow (i.e., from 0 to 10 kPa) for
coarse-grained soils. The tensiometer ceramic tip also can easily get ruptured and will
become dysfunctional when they are inserted into coarse-grained soils with angular or
sub-angular grains. This technique was first used by Li (2008) for determining the
bearing capacity tests for Unimin 2075 sand and was found to be useful and hence
extended in the presented study.
More details with respect to tensiometers are described in the next section.
3.10 Tensiometers
Tensiometer (Figure 3.10) is conventionally used for the direct measurement of matric
suction in unsaturated soils in a range of 0 to 100 kPa. The details of tensiometer
structure, principle, calibration and installation are discussed in the following sections.
Figure 3.10 Tensiometers of Model 2100 with a plastic holder
56

3.10.1 Tensiometer Structure
The commercial tensiometers used in the present research program were manufactured by
Soilmoisture Equipment Corp. in California, USA. The unit used is model 2100 which
consists of a plastic body tube, a porous ceramic cup sensor with a 1 bar (100 kPa)
air-entry value, and a vacuum dial gauge. A thin neoprene tube is also used to connect
body tube and ceramic cup to transfer suction from sensor to gauge.
The ceramic cup is typically an inverted cup or small probe that can be filled with water.
This tip is used to create a saturated hydraulic connection between the unsaturated soil
and the water in the tensiometer body through the use of a pressure sensor. A typical
setup of laboratory commercial tensiometer is shown in Figure 3.11.
Figure 3.11 Schematic of the small-tip laboratory tensiometer (Fredlund and Rahardjo 1993)
3.10.2 Principle and Methodology
The technique for measuring the matric suction in soils using the tensiometer relies on the
properties of the high-air entry (HAE) materials typically prepared using ceramic
materials such as kaolinite. The HAE materials are characterized by microscopic pores of
57

relatively uniform size and size distribution. The surface tension forces maintain the
gas-liquid interfaces formed in the material's pores of the saturated HAE material
(ceramic disk). In other words, surface tension acts as a membrane for separating the air
and water phases.
The maximum sustainable difference between the air pressure, ua, above the disk and the
water pressure, uw, within and below the disk is inversely proportional to the maximum
pore size of the material and mathematically expressed using Young-Laplace Equation
3.1. Figure 3.12 explains the operating principle of HAE ceramic cup (Lu and Likos,
2004).
K-o»=^r [2U]
where, (ua -uw)h= air-entry value, kPa
Ts = the surface tension of the air water interface, kPa
Rs = the effective radius of the maximum pore size of the HAE material
Air Pressure, ua
- Air-Water Interface
High-Air-Entry Ceramic
- Pore Water
Water Pressure, uw
Figure 3.12 Operating principle of HAE ceramic cup (Lu and Likos 2004)
3.10.3 Calibration of Tensiometer
The ceramic cup should be immersed in water for at least one hour or more to fill the
pores with water. The tensiometer system is then filled with de-aired water. A small
suction is applied at the filler end for removing air from the bourdon tube in the vacuum
dial gauge. Also, the tube can be tapped to release the air bubbles. A small vacuum
58

pressure should be applied again to flush the air-free water through the system to remove
the air. After the process is done, the service cap is replaced and the water vent screw is
tightened. The tensiometer after these preparation techniques is ready for laboratory or
field installation.
Evaporation can significantly influence the matric suction value measurement. Long-term
evaporation from the ceramic cup should be avoided, since it reduces the sensitivity of
the instrument.
3.10.4 Tensiometer Installation
In order to install the tensiometer in the soil, a good contact is required between the
ceramic cup and the soil to maintain continues link between the pore water and the
measurement system. A thin wall 6 mm tube can be used to core a hole in the soil to place
the ceramic cup. The plastic tube should be handled carefully and not to be bent. The
ceramic cup must be mounted in the region where matric suction values are required
(Fredlund and Rahardjo 1993). Furthermore, the ceramic cup and pressure gauge should
be placed at the same elevation.
After installation is completed, the unit will come to equilibrium condition with the soil
and the matric suction value can be read directly on the dial gauge in kPa.
3.11 Load Cell
A lightweight "S"-Beam load cell 20210 (Figure 3.13) was used to measure the load. The
unit can function both in tension or compression. The output can be received and
recorded with Data Acquisition System (DAQ).
The load cell has 0.11 to 177.93 kN capacities. It is made of Nickel/Chrome Plated Alloy
Steel and can work under -17.78 - 65.56 deg. C.
59

Figure 3.13 "S"-Beam load cell 20210
3.12 Displacement Transducer
The displacement of the footing was measured using Linear Strain Transducer (LSCT),
HS50/5732 (Figure 3.14).
Figure 3.14 Linear Strain Transducer with a magnetic holder
f?«>
60

The weight of LSCT is less than 250 g and can be fixed on a magnetic holder. The
maximum displacement of this model is 51 mm. The hysteresis-compensated with
linearity is better than ±0.1% of full scale in both directions. It requires input of 10V DC
with an output up to 6.5 mV per volt.
3.13 Data Acquisition System
The data acquisition system used in the present research program was NI USB-6210
(Figure 3.15) from National Instruments Corporation to collect data of measured
parameters. The NI USB-6210 is a bus-powered M Series multifunction data acquisition
(DAQ) module for USB that is optimized for superior accuracy at fast sampling rates. It
offers 16 analog inputs; a 250 kS/s single-channel sampling rate; four digital input lines;
four digital output lines; four programmable input ranges (±0.2 to ±10 V) per channel;
digital triggering; and two counter/timers.
I
>«B8S8U
Figure 3.15 NI USB-6210
61

3.14 Summary
This chapter briefly summarizes details of the equipments used in the research program
presented in the thesis. The bearing capacity test system was used to conduct model
footing tests in a specially designed unit. The triaxial shear apparatus was used to
determine the effective shear strength parameters. The Tempe Cell and WP4-T were used
to measure the Soil-Water Characteristic Curve (SWCC). The suction profile set was used
for developing pre-calibrated relationship between the matric suction and the soil depth
from surface (i.e., depth of water table). The details of additional tools used (i.e.,
tensiometers, load cell, settlement transducer and data acquisition system) were also
presented.
62

CHAPTER 4
SOIL PROPERTIES
4.1 Introduction
This chapter summarizes the properties of four different soils used in the research
program; namely, Filtration sand, Quarry sand, Sil-co-sil 106 and Min-u-sil 30. Two of
the four soils were coarse-grained sands and the remainder two soils were fine-grained
silica. The conventional properties which include the grain size analysis and the effective
shear strength parameters were determined in the Geotechnical laboratory of the
University of Ottawa. Unsaturated soil properties of the four soils were also determined.
Tempe cell was used for determining the Soil-Water Characteristic Curve (SWCC) of the
two coarse-grained soils. The SWCC for the two fine-grained soils (i.e., Sil-co-sil 106
and Mil-u-sil 30) were determined using both the Tempe cell and the WP4-T. The suction
profile (i.e., the relationship of matric suction with respect to depth above the water table
in the soil container used for measuring the bearing capacity of model footings) was
determined using a specially designed apparatus which is referred as suction profile set.
Equipment details and methodologies for conducting the tests were discussed in Chapter
3.
4.2 Soil Type
The grain size distribution of Filtration sand and Quarry sand are determined by
conducting sieve analysis using lOOOg dry sand following ASTM D422 (1994b). The data
of grain size distribution of these two soils are in Table A.l and Table A.2 of Appendix.
The sieve analysis results of Sil-co-sil 106 and Min-u-sil 30 are supplied by the
63

manufacture. Figure 4.1 summarizes the results.
100
90
^ 80 a?
ro 70
8 60 (0
°- 50 0) O)
5 40 c o 30 0)
a 20
10
0 o.c
• Rltration sand
• Quarry sand
-*—Sil-Co-Sil106
—K—Min-U-Sil30
01 0.01 0.1 1 10
Grain Size (mm)
Figure 4.1 Summary of grain size distribution
The median grain size, D50 of Filtration sand and Quarry sand are 0.68 mm and 0.19 mm,
respectively. The coefficient of uniformity, Cu (i.e., Dgo/Dio) of both soils are less than 6
and the coefficient of curvature, Cc (i.e., (D3o)2/(Di0xD6o) of Filtration sand and Quarry
sand are 0.88 and 1.44, respectively. Both soils were classified as poorly graded sand (SP)
according to the Unified Soil Classification System (USCS).
For Sil-co-sil 106 and Min-u-sil 30, the median grain size, D50 is 0.024 mm and 0.0083
mm, respectively. 50 % or more passes the No. 200 sieve (opening diameter: 75 um). As
both soils are non-plastic and inorganic silt which are primarily composed of SiC>2
(99.7%), they were classified as silt (ML) according to USCS.
64

4.3 Filtration sand
The Filtration sand used in the present study is obtained from FILTERSIL Inc. in
Mauricetown, New Jersey. This commercial industrial quartz sand is selected for use in
the research program because it is dense, durable sand and is resistant to degradation
during handling and backwashing.
4.3.1 Chemical Analysis
The data of chemical composition supplied by manufacture is summarized in Table A.3
of Appendix.
4.3.2 Suction Profile
Suction profile of Filtration sand was measured using the suction profile set described in
Chapter 3. The results obtained from this set were used to control the depth of the water
table to achieve pre-decided matric suction profile below the model footings prior to
conducting the bearing capacity tests. The Filtration sand was initially saturated in the
suction profile set by raising the water level from bottom of the soil column. The water
table is then lowered to various depths and the capillary suction is measured using
tensiometers to obtain the suction profile.
Figure 4.2 shows the relationship between the water table and matric suction for the
Filtration sand using the suction profile set for two depths 50 mm and 100 mm (see Fig.
3.1, item 10). The stresses associated with the model footing loading are typically
distributed in the depth from 0 to 1.5B and these two depths fall in this range (Poulos and
Davis 1974, Agarwal and Rana 1987). The contribution of matric suction towards the
bearing capacity and resistance to settlement due to the loading of the footing also comes
from this depth of 0 to 1.5 B (Oh and Vanapalli 2008, Oh et al. 2009). Therefore, the
65

average matric suction value from the matric suction profile under the model footing is
necessary for interpreting the results. The depth 50 mm and 100 mm correspond to values
of B and 2B for the maximum size footing used in the present research program (i.e., 50
mm).
The water table was first lowered to 50 mm below the soil surface for a period of 24 hrs
to attain equilibrium conditions with respect to capillary stresses (i.e. matric suction). The
matric suction readings were measured at two different levels of depth using tensiometers.
This procedure was repeated by varying the depth of water table below the soil surface to
different levels (i.e., 150 mm, 250 mm, 350 mm, 450 mm, 550 mm, 650 mm, and 750
mm, 850 mm) while measuring matric suction values after 24 hrs. A maximum depth of
850 mm was chosen because the maximum height of the soil container (see Fig.3.1, item
3) is 700 mm. The data of suction profile is summarized in Table A.4 of Appendix.
The measured dry unit weight of the specimen was equal to 16.72 kN/m .
(0 Q. J£ C .o "•S u 3 (0
o
tri
a 2
14
12
10
8
6
4
2
0
0 100 200 300 400 500 600 700 800 900
Depth of water table (mm)
Figure 4.2 Suction profile of Filtration sand
66

The matric suction in the Filtration sand increases linearly for the depth of 100 mm after
lowering depth of water table. However, for the depth of 50 mm, the matric suction
increase linearly up to 450 mm and then increases nonlinearly at a faster rate. Such a
behavior was attributed to the evaporation of water from the soil column at the surface.
These results suggest that the matric suction close to surface of the footing should be
reliably determined as matric suction is sensitive to environmental conditions and it
significantly influences the bearing capacity and settlement behavior of unsaturated soils.
4.3.3 Shear Strength
The effective shear strength parameters (i.e., c' and <p ) of Filtration sand were measured
using triaxial shear apparatus under consolidated drained conditions (i.e., CD tests). The
amount of soil required for achieving dry unit weight equal to 16.25 kN/m3 for a specimen
with the dimensions of 50 mm in diameter and 108 mm in height was determined. A
saturated porous stone and filter paper were placed on the pedestal of the triaxial cell and
a rubber membrane of 50 mm in diameter was secured with an O-ring. The pre-calculated
amount of sand was placed in the rubber membrane using a small spoon and
intermittently compacting the sand with a little mallet. After the soil was filled in the
rubber membrane a filter paper and porous stone were placed on the top of the specimen.
Filter paper was used for preventing the migration of soil particles into the porous stone.
The rubber membrane at the specimen base and the top cap were secured with rubber "O"
rings. Once the above operations were done, the triaxial cell was assembled, filled with
water, and placed on the apparatus in the testing frame. The triaxial cell and the sample
lines were connected to the appropriate valves before applying cell pressure and back
pressure sequentially to conduct the test following the ASTM D4767-04.
The rate of shear used of 1.14 mm/min was used for determining the shear strength
parameters; the same rate was used for loading the model footings for determining the
67

bearing capacity. Similar rates of shear were used by earlier investigators for determining
the effective shear strength parameters using direct shear apparatus and also for loading
the model footings on coarse-grained sands (Mohamed and Vanapalli 2006, Li 2008,
Vanapalli et al. 2010).
The stress versus strain curves under different normal stresses (i.e., 50 kPa, 100 kPa and
150 kPa) is shown in Figure 4.3. The modulus of elasticity under normal stress of 50 kPa
was slightly higher in comparison to data tested with a normal stress of 100 kPa. This
may be attributed to some differences in initial properties of the specimen or due to
experimental errors. The stress-strain relationship is nonlinear which is similar to the
model footing test results (described in Chapter 5). The failure occurs typically at an axial
strain in the range of 1-4%. These results are consistent with the results of other
investigators on coarse-grained soils (Salgado et al. 2000).
(0 Q. •tt
O <
ss,
0) Im.
w L.
o *>• flj
> a> n
900
800
700
600
500
400
300
200
100
0
/-"~ "***--»^
- - - - . . • /
/ • / /
I : " / / I':
" l :
if " — - - _
i i i
50 kPa
150 kPa
i i
0 2 4 6 8 10 12
Axial strain, e(%)
Figure 4.3 Stress versus strain response of triaxial specimens under different normal stresses for the
Filtration sand
68

In Figure 4.4, both Mohr's envelopes and stress point form relations (i.e., q - p plots) are
summarized. The shear strength parameters effective cohesion, c' and internal friction
angle, <p were equal to zero and 45.7° respectively from both these relationships.
900
800
-S> 700 Q.
£ . 600
uT 500 0) 0)
£ 400 » n 300
w 200
100
0
Failure / envelope / s
y ' < / ' Kf line
r \ I I I l i 11 i I
CTkffJibCnjc (J\* cr;b a\c 0 200 400 600 800
Normal stress, a (kPa)
m = 0
a = 35.6°
c' = 0
0 '=45.72°
Figure 4.4 Triatrial shear test result of Filtration sand
The bearing capacity factors increase significantly for large <p values, which are typical
for coarse-grained soils. Also, bearing capacity of unsaturated soils is significantly
influenced even for small values of matric suction for coarse-grained soils
(Steensen-Bach et al. 1987, Vanapalli and Mohamed, 2007, Vanapalli 2009). Therefore,
<p should be determined carefully for reliable determination of the bearing capacity of
soils under different values of matric suction. However, there are several other parameters
such as the dilatancy and applied normal stress also can influence the internal friction
angle, (f> . Bolton (1986) studies on sands show that the effective stress and soil density
69

affect the rate of dilatancy of soils and thereby influence the internal friction angle, <p
value.
4.3.4 Soil Water Characteristic Curve (SWCC)
Information related to the water storage characteristics of unsaturated soils can be derived
from the soil water characteristic curve (SWCC). A typical SWCC exhibits three
identifiable stages of desaturation (Vanapalli et al. 1996): the boundary effect stage or
capillary saturation zone, the transition stage or desaturation zone (i.e., primary and
secondary transition stage), and the residual stage. The air-entry value (AEV) of the
tested soil was determined by the intersection of the two linear slope segments in the
boundary effect and transition stages of the SWCC (see Fig. 4.5). Similarly, the residual
suction was determined by the intersection of the two linear slope segments in the
transition and residual stages of the SWCC (Vanapalli et al. 1999).
100 -r
^5
c .o "̂ a 3
4-»
ra O)
o 0) 0) l _ O) Q)
Q
80
60
40
20
Residual suction: 2.2 kPa
Air-entry value: 0.9 I
0.1 1 10
Matric Suction (kPa)
100
Figure 4.5 SWCC of Filtration sand in the suction range of 0 to 20 kPa
The SWCC of Filtration sand was measured on a specimen (which is 63.9 mm in
70

-5
diameter and 31.9 mm in height) with dry unit weight equal to 16.19 kN/m . The initial
conditions of the test specimen used for measuring the SWCC are similar to that of
specimens used for measuring shear strength and bearing capacity tests. The water
content at saturated condition of specimen was 22.87%. Figure 4.5 shows the measured
SWCC of Filtration sand.
The air-entry value (i.e. the matric suction value at which air recedes into the soil pores)
of Filtration sand is 0.9 kPa and the residual suction is 2.2 kPa. The shape of the SWCC
depends on the pore size distribution and volume change of the soil and the air-entry
value and the residual suction value are affected by the initial water content, soil structure,
mineralogy, and the stress history (Vanapalli et al. 1999). Filtration sand desaturates at a
fast rate as the soil particles are relatively coarse-grained in nature and the pore size
distribution is more uniform. More than 90% of the water was drained when the matric
suction in the tested specimen reached a value of 20 kPa. These results are consistent
with the results of other coarse-grained soils reported in the literature (Reinson et al. 2005,
Mohamed and Vanapalli, 2006, Alim et al. 2009).
4.4 Quarry sand
Quarry sand is natural sand from Burnside Quarry on March road in Ottawa.
4.4.1 Suction Profile
The same procedures described in section 4.2.3 were used for determining suction profile
of Quarry sand. Figure 4.6 shows the relationship between the water table and matric
suction for two depths 50 mm and 100 mm. The data of suction profile is provided in
Table A.5 of Appendix. The measured dry unit weight of the specimen was equal to 16.19
kN/m3.
71
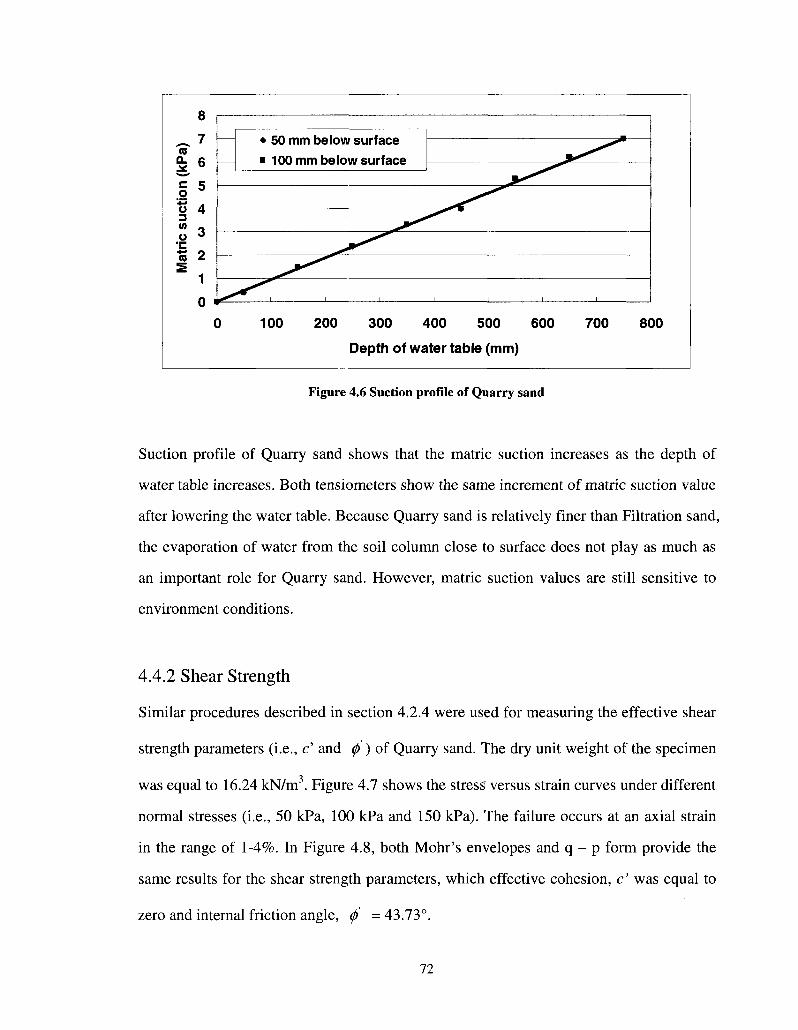
Figure 4.6 Suction profile of Quarry sand
Suction profile of Quarry sand shows that the matric suction increases as the depth of
water table increases. Both tensiometers show the same increment of matric suction value
after lowering the water table. Because Quarry sand is relatively finer than Filtration sand,
the evaporation of water from the soil column close to surface does not play as much as
an important role for Quarry sand. However, matric suction values are still sensitive to
environment conditions.
4.4.2 Shear Strength
Similar procedures described in section 4.2.4 were used for measuring the effective shear
strength parameters (i.e., c' and <p ) of Quarry sand. The dry unit weight of the specimen
was equal to 16.24 kN/m . Figure 4.7 shows the stress" versus strain curves under different
normal stresses (i.e., 50 kPa, 100 kPa and 150 kPa). The failure occurs at an axial strain
in the range of 1-4%. In Figure 4.8, both Mohr's envelopes and q - p form provide the
same results for the shear strength parameters, which effective cohesion, c' was equal to
zero and internal friction angle, <p = 43.73°.
72

800
700 h
fa 600 a.
! f 500 10 (0 a; 400
S 300
200
100
50 kPa 100 kPa 150 kPa
6 8 10
Axial strain, e(%)
ure 4.7 Stress versus strain response of triaxial specimens under different normal stresses for the
Quarry sand
900
800
~ 700
h 600
a 500 0) CD
i= 400 CO
| 300 w 200
100
0
(
-
Failure / envelope y r -
/ yr Kf line
y ^ ^ ^ X \
yffS , Y \ o"3aO"3bcJ3c cna a;b cnc
) 200 400 600 800
Normal stress, a (kPa)
m =0
a = 34.65°
c' = 0
0 ' = 43.73°
Figure 4.8 Triaxial shear test result of Quarry sand
73

4.4.3 Soil Water Characteristic Curve (SWCC)
The measured SWCC of Quarry sand for two different suction ranges are shown in
Figure 4.9. From Figure 4.9a, the air-entry value and residual suction of Quarry sand
were found to be 3.2 kPa and 9 kPa, respectively.
The SWCC was measured on a specimen (which is 63.9 mm in diameter and 31.9 mm in
height) with a dry unit weight equal to 16.19 kN/m3. The water content at saturated
condition was 24.25%. Reinson et al. (2005) stated that the air-entry value is a function of
the size of the largest pores, which are larger for coarse-grained soils and smaller for
fine-grained soils. Quarry sand is relatively finer compared to Filtration sand and hence it
has a higher air-entry value and desaturates at a relatively low rate.
100 <
~ 80
o | 60
(0
M- 40 o a> a> S> 20 a a
0
-
0.1
1 • • • I - - N \
_ . „ \ Residual suction: 9 kPa Air-entry value: 3.2 kPa V
i i
1 10
Matric Suct ion (kPa)
100
(a) SWCC of Quarry sand in the suction range of 0 to 20 kPa
74

- t r t r t -
Deg
ree
of S
atu
ratio
n (
%)
to *
* o
> co
c
o
o o
o o
c
o
r-N N I \
>
1 1 10 100 1000
Matric Suction (kPa)
(b) SWCC of Quarry sand in the suction range of 0 to 200 kPa
Figure 4.9 SWCC of Quarry sand
4.5 Sil-co-sil 106
Sil-co-sil 106 (Barco 290) is fine-grained commercial silt obtained from Opta Minerals
Inc. in Waterdown, Ontario.
4.5.1 Chemical Analysis and Physical Properties
The data of chemical and physical properties of Sil-co-sil 106 supplied by manufacture
are summarized in Table A.6 and Table A.7 of Appendix.
4.5.2 Suction Profile
The relationship between matric suction and depth of water table for Sil-co-sil 106 is
summarized in Figure 4.10. The data of suction profile is provided in Table A.8 of
Appendix. The measured dry unit weight of the specimen was equal to 15.76 kN/m3.
Suction profile of Sil-co-sil 106 shows that the matric suction increases after 50 mm
75

depth of water table. Such a behavior implies that the capillary height of Sil-co-sil 106
was equal to 50 mm. Adhesion of water to the walls of a vessel will cause an upward
force on the water at the edges. The surface tension acts to hold the surface intact, so
instead of just moving the edges upward, the whole water surface is dragged upward.
Therefore, the water table was still on the soil surface until it was lowered to 50 mm.
Both tensiometers show the same increment of matric suction value after lowering the
water table, similar to the Quarry sand results discussed earlier.
Figure 4.10 Suction profile of Sil-co-sil 106
4.5.3 Shear Strength
The effective shear strength parameters (i.e., c' and <p ) of Sil-co-sil 106 were measured
using triaxial shear apparatus under consolidated drained conditions. The dry unit weight
of the test specimens used in the study were equal to 14.61 kN/m3. A shear rate of 1.14
mm/min was used similar to other soils used in this study. The stress versus strain curves
under different normal stresses (i.e., 50 kPa, 100 kPa and 150 kPa) is shown in Figure
4.11. The stress-strain relationship is nonlinear and leveled off at an axial strain of 10%.
76

Figure 4.12 shows the result of the triaxial shear tests using Mohr's envelopes and q - p
form. The effective cohesion, c' was equal to zero and the internal friction angle 0 =
38.96°.
700
600
| 500
r i S> 200
-
-
50 kPa
150 kPa
*•* /
/ /
/
/
1 / ^
' •
^-'*~
1 _ J 1 1 1 1
100 -
0 2 4 6 8 10 12 14 16 18
Axial strain, e(%)
Figure 4.11 Stress versus strain response of triaxial specimens under different normal stresses for the
Sil-co-sil 106
700
600 (0
!* 500 H
« 400 w 0) S 300 k .
S 200 .C (/)
100
0 {
Failure envelope
\ ^r
> / ^ ^ / \ ^^^*^~^ Kf line
sSy^ ^ \
^^\ I I i \ ll i I
ak o^ ajc aia a;b a;0 ) 200 400 600
Normal stress, a (kPa)
m =0
a =32.16°
c' = 0
0 ' = 38.96°
Figure 4.12 Triaxial shear test result of Sil-co-sil 106
77

4.5.4 Soil Water Characteristic Curve (SWCC)
Figure 4.13 shows the measured SWCC of Sil-co-sil 106. The air-entry value of Sil-co-sil
106 is 30 kPa which is relatively high compared to the coarse-grained soils (i.e.,
Filtration sand and Quarry sand).
The SWCC was measured on a specimen (which is 63.9 mm in diameter and 31.9 mm in
height) with dry unit weight equal to 14.22 kN/m3. The water content at saturated
condition was 31.25%. Fredlund et al. (2002) studies show that a material's SWCC is
closely related to its grain size distribution. Fine-grained soils typically have non-uniform
pore size distributions. Consequently, the SWCC of Sil-co-sil 106 exhibit relatively
flatter slope in comparison to coarse-grained soils (i.e., Filtration sand and Quarry sand).
Rowlett (2000) measured the SWCC for Sil-co-sil 90 which is a little bit finer than
Sil-co-sil 106 used in the present study. The air-entry value for Sil-co-sil 90 was between
20 kPa and 30 kPa. There is a good comparison between the SWCC measured from both
these studies.
100
80
ura
** (0 (/}
"o 0) Q)
<D Q
60
40
20
0.1
-•—* * *• - * \
Air-entry value: 30 kPa
1 10 100
Matric Suction (kPa)
1000 10000
Figure 4.13 SWCC of Sil-co-sil 106
78

4.6 Min-u-sil 30
Min-u-sil 30 is fine-grained industrial silt obtained from the Plant of Berkeley Springs in
West Virginia under U.S. Silica Company in Atlanta, USA.
4.6.1 Chemical Analysis and Physical Properties
The data of chemical and physical properties of Min-u-sil 30 supplied by manufacture are
summarized in Table A.9 and Table A. 10 of Appendix.
4.6.2 Suction Profile
Figure 4.14 shows the relationship between matric suction and depth of water table for
Min-u-sil 30. The data of suction profile is provided in Table A. 11 of Appendix. The
measured dry unit weight of the specimen was equal to 13.11 kN/m3.
(0
|
I
10 9 8 7 6 5 4 3 2 1 0
• 50 mm below surface • 100 mm below surface
100 200 300 400 500 600 700 800
Depth of water table (mm)
Figure 4.14 Suction profile of Min-u-sil 30
Suction profile of Min-u-sil 30 shows that the matric suction starts increasing after 150
79

mm depth of water table. Similar to Quarry sand and Sil-co-sil 106, the increment of
matric suction value on both tensiometers for Min-u-sil 30 was found the same after
lowering the water table.
4.6.3 Shear Strength
Similar procedures described in section 4.2.4 were used for measuring the effective shear
strength parameters of Min-u-sil 30. The dry unit weight of the specimen was equal to
13.03 kN/m3.
The stress versus strain curves under different normal stresses (i.e., 50 kPa, 100 kPa and
150 kPa) is shown in Figure 4.15. The stress-strain relationship is nonlinear and leveled
off at an axial strain of 10%. Similar behavior was observed from the model footing test
results of Min-u-sil 30 (described in Chapter 5).
500
400 -"ST Q. J*
~o < 300 ID (0
<a (A
5 200
• >
0) Q
-
-
t
50 kPa 100 kPa 150 kPa
s s / /
V 1 1 1 1 1 •
100
0 2 4 6 8 10 12 14 16 18
Axial strain, e(%)
Figure 4.15 Stress versus strain response of triaxial specimens under different normal stresses for the
Min-u-sil 30
80

Figure 4.16 shows the result of the triaxial shear test in terms of Mohr's envelopes and q
- p form. The effective cohesion, c' was equal to zero and the internal friction angle <p
= 35.33°.
600
~ 500 Q.
f 400
$ 300
15 200
w 100
0
Failure envelope -
S^^~~~~~~~\ Kf line
^^\ ( I n I i I
C>3a CTab^cCTia 0\b (J\c
0 200 400 600
Normal stress, a (kPa)
m =0
a = 30.04°
c '=0
0' = 35.33°
Figure 4.16 Triaxial shear test result of Min-u-sil 30
4.6.4 Soil Water Characteristic Curve (SWCC)
Figure 4.17 shows the measured SWCC of Min-u-sil 30. The air entry value of Min-u-sil
30 is 100 kPa.
The SWCC was measured on a specimen (which is 63.9 mm in diameter and 31.9 mm in
height) with dry unit weight equal to 12.43 kN/m3. The water content at saturated
condition was 41.21%. The SWCC of Min-u-sil 30 is similar to Sil-co-sil 106 as the
characteristics of both these soils were approximately the same.
81
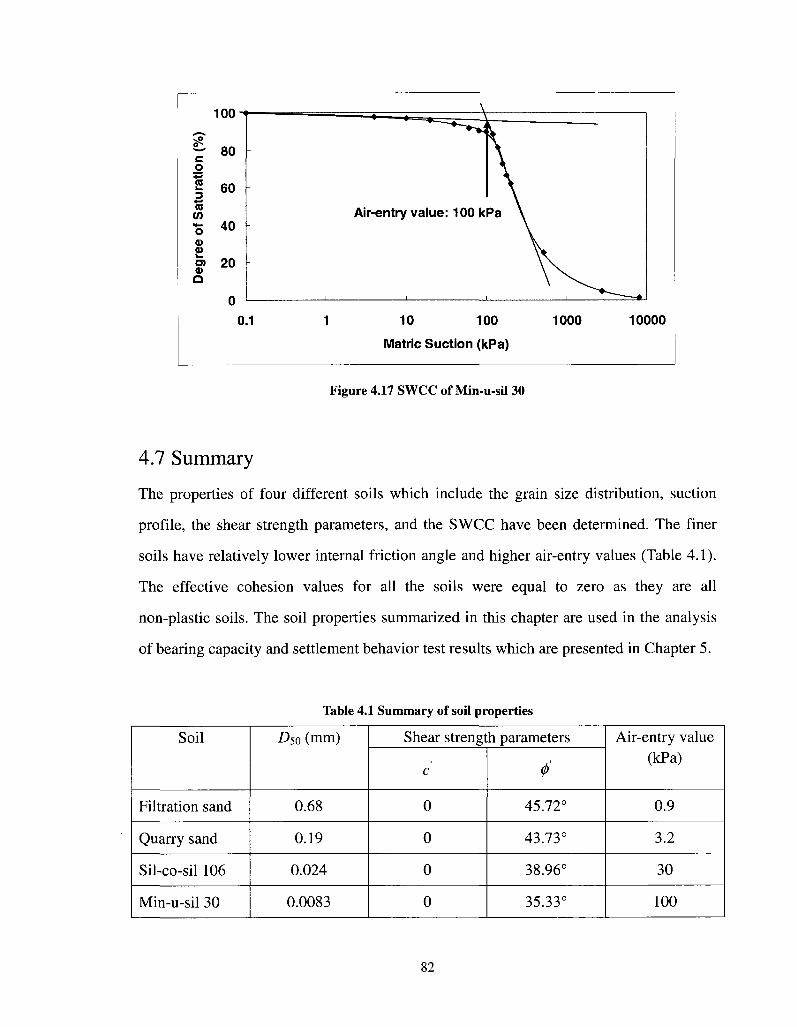
100-1
~ 80
| 60
(0 (0 "5 40
Deg
ree
IN)
o
o
0
p \
Air-entry value: 100 kPa \
-
1 1 10 100
Matric Suction (kPa)
1000 10000
Figure 4.17 SWCC of Min-u-sil 30
4.7 Summary
The properties of four different soils which include the grain size distribution, suction
profile, the shear strength parameters, and the SWCC have been determined. The finer
soils have relatively lower internal friction angle and higher air-entry values (Table 4.1).
The effective cohesion values for all the soils were equal to zero as they are all
non-plastic soils. The soil properties summarized in this chapter are used in the analysis
of bearing capacity and settlement behavior test results which are presented in Chapter 5.
Soil
Filtration sand
Quarry sand
Sil-co-sil 106
Min-u-sil 30
Table 4.1 Summary of soil properties
D50 (mm)
0.68
0.19
0.024
0.0083
Shear strength parameters
c
0
0
0
0
$
45.72°
43.73°
38.96°
35.33°
Air-entry value (kPa)
0.9
3.2
30
100
82

CHAPTER 5
RESULTS AND DISCUSSIONS
5.1 Introduction
Model footing tests were conducted on four different soils; namely, Filtration sand,
Quarry sand, Sil-co-sil 106 and Min-u-sil 30 under both saturated and unsaturated
conditions using the bearing capacity test system described in Chapter 3. The bearing
capacity and settlement were determined over a matric suction range of 0 to 8 kPa for all
these soils. The experimental set up was limited to achieving matric suction values of 8
kPa as the height of the soil container was limited (i.e. 700 mm). The range of suction
studied extends over the boundary effect, transition and residual stages for two of the
coarse-grained soils studied (Vanapalli et al. 1996). However, for the other two relatively
fine-grained soils, the matric suction range of 0 to 8 kPa falls in the boundary effect zone.
Both these soils are still in a state of saturated condition for this matric suction range.
Four model footings of different sizes (i.e., 20 mm x 20 mm; 37 mm x 37 mm; 41.75 mm
in diameter; and 50 mm x 50 mm) were used in the present research program to study the
influence of footing size on the bearing capacity and also settlement behavior of different
unsaturated soils. The focus of the study presented in this chapter is to provide
comparisons between the measured and predicted bearing capacity and settlement
behavior of different unsaturated soils. The bearing capacity of the unsaturated soils is
predicted using the approach presented by Vanapalli and Mohamed (2007) and the
settlement was estimated using the approach by Oh et al. 2009.
Some key details with respect to testing techniques used are also summarized in this
Chapter. The testing techniques are succinctly provided where necessary to assist in the
discussion of the results.
83

5.2 Soil and Test Preparation
The procedure for the preparation of soil before conducting model footing tests is
summarized below:
1. Prepare the soil container: The base of the soil container with slots (see Figure 3.4b)
was cleaned to ensure free flow of water. A lid with perforations was placed on the
base of the soil container to cover the slots. A geotextile of the same diameter as the
base of the soil container was placed on top of the lid. Lastly, a filter paper of the
same diameter as the geotextile was placed on the geotextile, to allow the free flow of
water but block the soil particles migration. The base plate and soil container were
then fastened with screws tightly to prevent any leakage of water.
2. The soil was placed into the container in several layers. Each soil layer thickness was
equal to 100 mm was evenly compacted using a 2 kg weight manually. This
procedure was useful in achieving a relatively higher value of density index, Dr>
which is the ratio of the difference between the void ratios of a cohesionless soil in its
loosest state and existing natural state to the difference between its void ratio in the
loosest and densest states. The densest density of the soil was obtained by filling the
mould with the soil by tapping it sharply on the sides with a rubber mallet. The
loosest density of the soil was obtained by filling the mould with the soil without
subjecting it to any vibrations.
3. A valve connected to the base of the soil container provides access of water to the
compacted soil in the container under a controlled head of water. Water flows through
slots in the container base and rises up from bottom slowly until the soil is saturated
(i.e., the water table reaches the soil surface in the container). This technique
facilitates escape of air from bottom of the soil container to the soil surface gradually
to ensure saturated condition.
4. Two Tensiometers were installed for the measurement of matric suction. One was
placed at 10 mm under the soil surface and the other was inserted to a depth of 1.5 B
(B is the footing width) beneath the soil surface. The information of matric suction at
two points (i.e., close to surface and at 1.5 B depth) was used in the calculation of the
84

measurement of average matric suction. The procedure used is consistent with the
methods followed in Vanapalli and Mohamed (2007) and Oh et al. 2009.
5. The load cell and displacement transducer were calibrated before conducting tests to
collect reliable and reproducible data.
6. Different values of matric suction (i.e., 2 kPa, 4 kPa, 6 kPa and 8 kPa) were achieved
by adjusting the water head following the suction profile method and confirmed by
Tensiometers. The procedure followed is summarized in greater detail in section 3.9.
The model footing was loaded to failure after reaching equilibrium conditions with
respect to the pre-decided matric suction value. More details of how the equilibrium
conditions were achieved are discussed in a later section of this chapter.
7. After completion of each test, the soil in the top layer was sliced into grid and re-
compacted using 2 kg weight to achieve similar initial conditions as other tests. The
tank was saturated again using the procedures described earlier. This procedure was
used as sand fabric is not significantly influenced in comparison to fine-grained soils.
This technique facilitated in conducting a large number of tests in the research
program. Several trial tests were conducted by earlier investigators at the University
of Ottawa Geotechnical laboratory using this procedure for sandy soils (Li 2008,
Vanapalli et al. 2010). The tests were then conducted with a different value of matric
suction. Sufficient care was taken to ensure identical initial conditions for all the tests
conducted.
5.3 Bearing Capacity Test Programme
A total of 80 tests were conducted at a strain rate of 1.143 mm/min to study the bearing
capacity and settlement behaviour of four sands using four different sizes of footings. The
strain rate was kept constant for all the tests. This strain rate was chosen because earlier
investigators used the same value for determining the bearing capacity and settlement
behavior of coarse-grained unsaturated sands (Mohamed and Vanapalli 2006, Li 2008,
Oh and Vanapalli 2008). The results of these studies also show reasonably good
comparisons can be obtained between the measured and predicted bearing capacity and
settlement values using this strain rate. The details of the various tests conducted for the
present research program are summarized in Table 5.1.
85
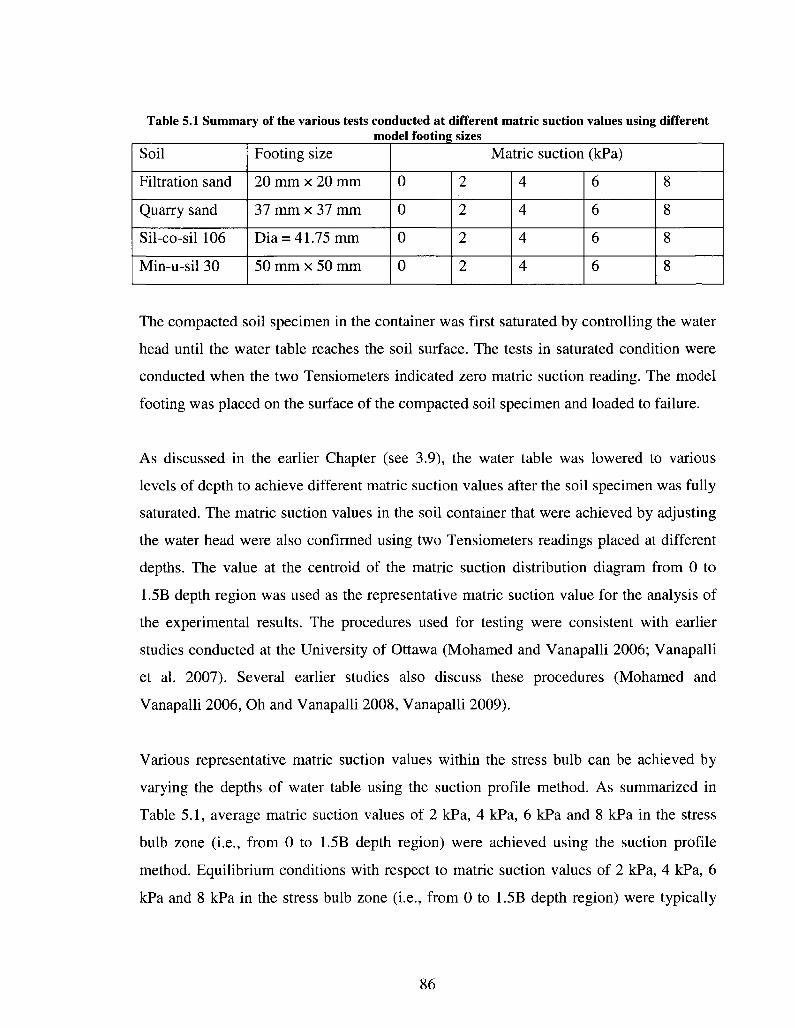
Table 5.1 Summary of the various tests conducted at different matric suction values using different model footing sizes
Soil
Filtration sand
Quarry sand
Sil-co-sil 106
Min-u-sil 30
Footing size
20 mm x 20 mm
37 mm x 37 mm
Dia = 41.75 mm
50 mm x 50 mm
Matric suction (kPa)
0
0
0
0
2
2
2
2
4
4
4
4
6
6
6
6
8
8
8
8
The compacted soil specimen in the container was first saturated by controlling the water
head until the water table reaches the soil surface. The tests in saturated condition were
conducted when the two Tensiometers indicated zero matric suction reading. The model
footing was placed on the surface of the compacted soil specimen and loaded to failure.
As discussed in the earlier Chapter (see 3.9), the water table was lowered to various
levels of depth to achieve different matric suction values after the soil specimen was fully
saturated. The matric suction values in the soil container that were achieved by adjusting
the water head were also confirmed using two Tensiometers readings placed at different
depths. The value at the centroid of the matric suction distribution diagram from 0 to
1.5B depth region was used as the representative matric suction value for the analysis of
the experimental results. The procedures used for testing were consistent with earlier
studies conducted at the University of Ottawa (Mohamed and Vanapalli 2006; Vanapalli
et al. 2007). Several earlier studies also discuss these procedures (Mohamed and
Vanapalli 2006, Oh and Vanapalli 2008, Vanapalli 2009).
Various representative matric suction values within the stress bulb can be achieved by
varying the depths of water table using the suction profile method. As summarized in
Table 5.1, average matric suction values of 2 kPa, 4 kPa, 6 kPa and 8 kPa in the stress
bulb zone (i.e., from 0 to 1.5B depth region) were achieved using the suction profile
method. Equilibrium conditions with respect to matric suction values of 2 kPa, 4 kPa, 6
kPa and 8 kPa in the stress bulb zone (i.e., from 0 to 1.5B depth region) were typically
86

achieved in a time period of 24 hours. The model footing was loaded to failure after
achieving equilibrium conditions with respect to each desired value of matric suction.
5.4 Results of Bearing Capacity and Settlement
5.4.1 Filtration sand
The measured dry unit weight of Filtration sand after compaction was equal to 16.21
kN/m3. This value corresponds to 98.23% of the density index value. Figure 5.1 to 5.4
show the applied pressure versus settlement behavior from bearing capacity tests
conducted on four different sizes of footings, respectively. The footing was loaded to a
settlement value which is equal to 25% of the footing size.
<0 Q.
re (
k
3 in (0 <u
sdP
r
.£ a a <
IOU
160
140
120
100
80
60
40
20
n
y " s
: *' / : '
/ : /
:/ .-y''
• / / ^ ^ - - - - ~
/.* / "" / / / ^^ / •'/ S
/••/ /
/ / ' -
- - " ^ i — ' * * i i i
Footing 20 mm x 20 mm
Saturated 2kPa 4kPa 6kPa 8kPa
0 1 2 3 4 5 6
Settlement (mm)
Figure 5.1 Applied pressure versus settlement of Filtration sand under the footing of 20 mm x 20 mm
87

250
Footing 37 mm x 37 mm
Saturated 2kPa 4kPa 6kPa 8 kPa
4 6 8 10
Settlement (mm)
Figure 5.2 Applied pressure versus settlement of Filtration sand under the footing of 37 mm x 37 mm
300
Footing 41.75 mm in diameter
Saturated 2kPa 4kPa 6kPa 8 kPa
4 6 8 10
Settlement (mm)
Figure 5.3 Applied pressure versus settlement of Filtration sand under the footing of 41.75 mm in diameter
88

500
Footing 50 mm x 50 mm
Saturated 2kPa 4kPa 6kPa 8 kPa
0 2 4 6 8 10
Settlement (mm)
Figure 5.4 Applied pressure versus settlement of Filtration sand under the footing of 50 mm x 50 mm
From the test results (Figure 5.1 to 5.4), two different modes of failure, namely; general
shear failure and local shear failure were observed. For instance, the footing 41.75 mm in
diameter demonstrated two different failure modes for 2 kPa and 8 kPa matric suction
values (Figure 5.5). General shear mode of failure was observed for 2 kPa matric suction
and local shear mode of failure was observed for 8 kPa matric suction value (see Figure
5.6(c)).
The soil in an unsaturated condition with matric suction 2 kPa was effective in pulling the
particles together and offering more resistance to the applied load and hence there is
limited settlement with well defined failure load (Figure 5.7). In other words, the mode of
the failure represents general shear failure conditions (see Fig. 5.5(a)). However, at 8 kPa
matric suction value, most of the water drained from the sand (i.e., the degree of
saturation is low at 15.05% and the specimen behavior was more like a dry sand) offering
little resistance. Due to this reason, the load carrying capacity of the footing was
relatively high at 2 kPa matric suction value in comparison to 8 kPa matric suction values
(see Figure 5.6). More discussions are offered on this topic analyzing the results in later
section of the Chapter.
89

(a)2kPa 5 = 35.67% (b) 8 kPa 5=15.05%
Figure 5.5 Failure surface of Filtration sand under the footing of 41.75 mm in diameter
— — — 8 kPa Footing 20 mm x 20 mm
/
/ y
^// 2 3 4
Settlement (mm)
250
150 V
•a 100
4 6
Settlement (mm)
(a) (b)
500 i
4 6
Settlement (mm)
4 6
Settlement (mm)
(C) (d)
Figure 5.6 Applied pressure versus settlement of Filtration sand for 2 kPa and 8 kPa under four footings
90

Figure 5.7 Well defined failure plane under model footing (Oh et al. 2009)
The difference in the failure mode (i.e., general shear or local shear) can also be
attributed to the size of the model footing. When a footing size is relatively large (i.e., 50
mm x 50 mm) compared with the soil particle sizes, the general shear failure conditions
are predominant because the soil matric suction offers more resistance. However, when a
footing size is relatively small, the load applied on the model footing is mostly carried by
the individual soil particles and there is significantly less contribution to the frictional
resistance arising between the soil particles (Oh et al. 2009). In other words, at the same
matric suction value the failure mode can be different depending on the size of the
footing for the same soil.
Figure 5.8 shows the failure surfaces of different unsaturated conditions under the footing
of 50 mm x 50 mm. The diameter of bulged zone was approximately 200 mm which is
less than the diameter of the soil container (i.e., 300 mm) (Fig. 5.8(a)). This behaviour
implies that there is no boundary effect influence on the model footing test results. These
results are consistent with the numerical modeling studies (Figure 2.15) undertaken by
Oh and Vanapalli (2008). Both the numerical modelling studies and the experimental
91

results show the bearing capacity of model footings of 50 mm width or lower can be
conducted using relatively smaller size tanks such as 300 mm diameter.
(a)2kPa 5 = 35.67% (b) 4 kPa 5 = 20.65%
(c) 6 kPa 5 = 17.9% (d) 8 kPa 5 = 15.05%
Figure 5.8 Failure surface of Filtration sand under the footing of 50 mm x 50 mm
The variation of bearing capacity and settlement behavior with respect to different matric
suction values for four model footings are shown in Figure 5.9 along with the Soil-Water
Characteristic Curve (SWCC). The results demonstrate that matric suction plays an
important role in the contribution of increasing bearing capacity and reducing settlement
in the boundary effect and transition zones. The settlements estimated for an applied
stress of 20 kPa are used in this figure. This stress is chosen as settlement behavior is in
elastic range for the applied stress of 20 kPa. Also, in many practical scenarios, typical
stresses on the foundation are of the order of 20 kPa.
92

100 |*-»s
80 Air-entry value: 0.9 kPa
I so n (0
1 40
20
Residual suction: 2.2 kPa
4 6
Matric suction (kPa)
(a)
10
500
2 4 6 8
Matric suction, ua-uw (kPa)
(b)
93

(c)
Figure 5.9 The variation of bearing capacity and settlement behavior with respect to matric suction for Filtration sand along with the SWCC
5.4.1.1 Bearing capacity
Figure 5.9(b) shows the bearing capacity increases up to residual suction value (i.e., 2.2
kPa) and then decreases with further increase in matric suction values for all the four
model footings. There is a significant increase in the bearing capacity due to the
contribution of matric suction in the boundary effect and transition zones. For the matric
suction values higher than residual suction, the degree of saturation S becomes low and
the contribution of matric suction towards bearing capacity (i.e. (ua - UW)AVRSV in Equation
[2.32]) is small and also the corresponding density, y value decreases as water content
reduces due to desaturation. Therefore, the bearing capacity decreases for higher matric
suction values in the residual zone. Similar behavior was observed from the studies of
Steensen-Bach et al. (1987), Vanapalli and Mohamed (2007), Li (2008) and Vanapalli et
al. (2010).
94

qult=[c +(ua-uJh(l-Snt™<P' + (ua-uw)AVRSv' tm0]xNjc+O.5ByNr£r [2.32]
The bearing capacity value also increases with an increase in the footing size under
various matric suction values. For example, the size of footing 50 mm x 50 mm is 2.5
times larger than footing 20 mm x 20 mm, and the ultimate bearing capacity of footing
50 mm x 50 mm is approximately around two times greater than footing 20 mm x 20 mm.
It is of interest to note that the bearing capacity of the circular footing (i.e. 41.75 mm in
diameter) was higher than the equivalent square footing (37 mm x 37 mm) by a mean
value of 1.38 times (Figure 5.8(b)). Such a behavior can be attributed to the B value in
Equation [2.32], which is the width or diameter of the footing. As the values of shape
factors £c and £y are the same for square or circular footings, the increase in the bearing
capacity of a circular footing can be attributed to its larger B value in comparison to the
square footings. Gourvenec et al. (2006) showed that the bearing capacity of a circular
footing is more than that of an equivalent square footing by 3% based on the finite
element analysis (FEA) studies.
5.4.1.2 Settlement behavior
Table 5.2 summarizes the moduli of elasticity values derived from the experimental
results. The modulus of elasticity values increase with an increase in matric suction value
in the boundary effect and transition zones. Due to this reason, elastic settlements of four
model footings are relatively low up to residual suction value (Figure 5.9(c)). However,
the settlements increase when the matric suction values are higher as there is a gradual
decrease in the modulus of elasticity value in this zone (i.e. residual zone). After residual
suction, the degree of saturation S becomes low and the contribution of matric suction
(ll —U ) / a\
towards modulus of elasticity (i.e., j— ^ySp J in Equation [2.37]) is small. Therefore,
modulus of elasticity decreases and thus settlement increases after residual suction.
E -F unsat sat (panoo){ } [2.37]
95

E= ' - " ' BI
Table 5.2 Moduli of elasticity under four model footings of Filtration sand
Matric suction
(kPa)
0
2
4
6
8
Footing size (mm)
20x20
152
1759
1218
1009
700
37x37
277
2301
1609
1980
1423
D = 41.75
561
2871
2182
4209
823
50x50
2706
5128
6349
3578
2720
Figure 5.9(c) shows that the footings (i.e., 20 mm x 20 mm and 37 mm x 37 mm)
approximately have the same elastic settlements under various matric suction values
because the sizes of both model footings are relatively close to each other and also they
are smaller size footings. The settlement in a larger size model footing (i.e., 50 mm x 50
mm) is lower than the settlement in a smaller size footing (i.e., 20 mm x 20 mm). Such a
behavior can be attributed to higher value of modulus to elasticity for larger size footings
in comparison to smaller size footings. Equation [2.24] can be used as a tool to explain
this behavior. These results demonstrate that even low values of matric suction can
significantly increase the modulus of elasticity of coarse-grained soils.
5.4.1.3 Comparisons between the measured and predicted bearing capacity
values and elastic settlements
Figure 5.10 shows the comparisons between the measured and predicted bearing capacity
values and elastic settlements for the model footing of 37 mm x 37 mm using Equations
[2.32], [2.37] and [2.24]. The local shear failure criterion was used in the prediction of
the bearing capacity. A value of tan <f =2/3 tan0 was used to determine the modified
internal friction angle. For the calculation of settlement, Poisson's ratio, v value equal to
0.3 was used in the study, assuming drained loading conditions for the tested soils. The
96

fitting parameters y/, /? and a were equal to 1, 1 and 2.5 respectively based on the criteria
discussed in Oh et al. 2009.
500
(8
3; *—* a-> ** o S Q. (8 u o> = 15 V
.Q V
** (0
1
400
300
200
100
Footing 37 mm x 37 mm
•
•
• Measured
Predicted
•
^ ' •
I I I !
4 6
Matric suction, ua-uw (kPa)
(a)
10
3.0
2.5 h
0.5 h
0.0
Footing 37 mm x 37 mm
For an applied stress of 20 kPa
Measured Predicted
0 2 4 6 8 10
Matric suction, ua-uw (kPa)
(b)
Figure 5.10 Comparisons of measured and predicted bearing capacity, and settlement of Filtration sand
97
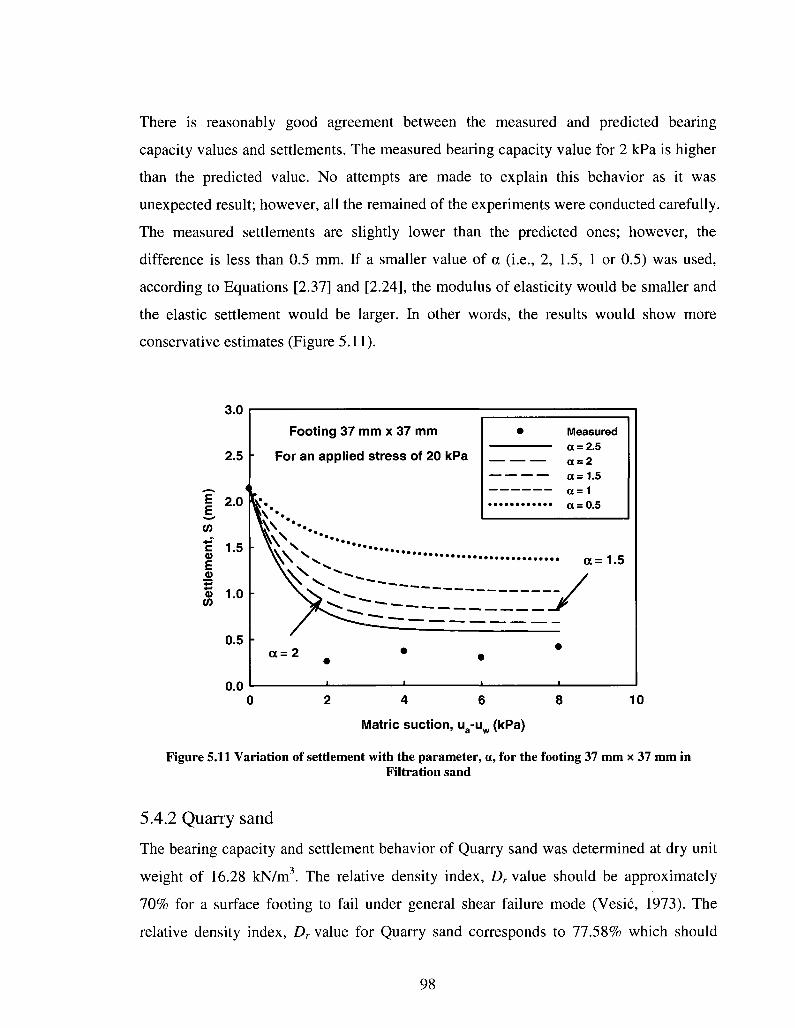
There is reasonably good agreement between the measured and predicted bearing
capacity values and settlements. The measured bearing capacity value for 2 kPa is higher
than the predicted value. No attempts are made to explain this behavior as it was
unexpected result; however, all the remained of the experiments were conducted carefully.
The measured settlements are slightly lower than the predicted ones; however, the
difference is less than 0.5 mm. If a smaller value of a (i.e., 2, 1.5, 1 or 0.5) was used,
according to Equations [2.37] and [2.24], the modulus of elasticity would be smaller and
the elastic settlement would be larger. In other words, the results would show more
conservative estimates (Figure 5.11).
Footing 37 mm x 37 mm
For an applied stress of 20 kPa
Measured a = 2.5 a = 2 a =1.5 a = 1 a = 0.5
a=1.5
2 4 6 8
Matric suction, ua-uw (kPa)
10
Figure 5.11 Variation of settlement with the parameter, a, for the footing 37 mm x 37 mm in Filtration sand
5.4.2 Quarry sand
The bearing capacity and settlement behavior of Quarry sand was determined at dry unit
weight of 16.28 kN/m3. The relative density index, Dr value should be approximately
70% for a surface footing to fail under general shear failure mode (Vesic, 1973). The
relative density index, Dr value for Quarry sand corresponds to 77.58% which should
98

translate to achieving general shear failure conditions. However, such a behavior was not
observed from Quarry sand. This may in part be attributed to the presence of fines (4% of
silt). Figure 5.12 to Figure 5.15 show the applied pressure versus settlement obtained
from bearing capacity tests under four different sizes of footings, respectively. More
defined failure characteristics were observed for the larger size model footings which
were explained in the earlier section.
300
Footing 20 mm x 20 mm
Saturated 2kPa 4kPa 6kPa 8kPa
2 3 4
Settlement (mm)
Figure 5.12 Applied pressure versus settlement of Quarry sand under the footing of 20 mm x 20 mm
99

1000
800
n Q.
I -I"
200
•&zm
Footing 37 mm x 37 mm
Saturated 2kPa 4kPa 6kPa 8 kPa
8 10 0 2 4 6
Settlement (mm)
Figure 5.13 Applied pressure versus settlement of Quarry sand under the footing of 37 mm x 37 mm
600
500 •
a. i 400 0) 3
u 300
I 200
100
-
•
Sr .<>
^
rf / -
*& s « • * '
,*£&r .^^-^
• ~'
:=*"-
^^""
.•••*• • •"
1
4 6 8
Settlement (mm)
10
Footing 41.75 mm in diameter
Saturated 2kPa 4kPa 6kPa 8 kPa
12
Figure 5.14 Applied pressure versus settlement of Quarry sand under the footing of 41.75 mm in diameter
100

800
? 600 Q.
I 400 h
< 200
S--/-. / /
/ / / // /
Footing 50 mm x 50 mm
Saturated 2kPa 4kPa 6kPa 8 kPa
0 2 4 6 8 10 12 14
Settlement (mm)
Figure 5.15 Applied pressure versus settlement of Quarry sand under the footing of 50 mm x 50 mm
The mode of failure is close to punching shear failure conditions from the test results.
The ultimate bearing capacity was therefore assumed to be a value equal to 20% of the
footing size in the present research according to ASTM Dl 194-94. Figure 5.16 shows the
failure surfaces of footing 41.75 mm in diameter under different matric suction values.
For the condition of 2 kPa (Figure 5.16(a)), the failure surface did not extend up to the
soil surface, while for the conditions (i.e., 4 kPa, 6 kPa and 8 kPa), the failure surface
extended up to the soil surface. However, there was no visible bulging on the soil surface.
(a) 2 kPa S = 99.60% (b)4kPa 5 = 84.04%
101

(c)6kPa 5 = 59.52% (d) 8 kPa 5 = 39.35%
Figure 5.16 Failure surface of Quarry sand under the footing of 41.75 mm in diameter
Figure 5.17 shows the variation of bearing capacity and settlement behaviour with respect
to different matric suction values for three model footings (i.e., footing 20 mm x 20,
footing 41.75 mm in diameter and footing 50 mm x 50 mm) along with the SWCC.
Unreasonable results were obtained using footing 37 mm x 37 mm; these results may be
attributed to errors in the collection of data. Therefore, the results of 37 mm x 37 mm
were not shown.
For discussing the settlement behavior, measured elastic settlements at an applied stress
of 40 kPa were used. This stress is chosen as settlement behaviour is in elastic range for
the applied stress of 40 kPa.
102

c o
CO (0
1
100
80
60
40
20
Air-entry value: 3.2 kPa Residual suction: 9 kPa
4 6
Matric suction (kPa)
(a)
10
800
I cr
f i i
Boundary effect zone
4 600 h
400
• Footing 20 mm x 20 mm V Footing 41.75 mm in diameter • Footing 50 mm x 50 mm
200
Transition zone i
Residual zone
4 6
Matric suction, u -u (kPa)
10
(b)
103

E E "**' CO ** c <D E 0) £ <D CO
3.5
3.0
2.5
2.0
1.5
1.0
0.5
0.0 0 2 4 6 8 10
Matric suction, ua-uw (kPa)
(c)
Figure 5.17 The variation of bearing capacity and settlement behavior with respect to matric suction for Quarry sand along with the SWCC
5.4.2.1 Bearing capacity
Figure 5.17(b) shows the bearing capacity increases as matric suction increases in the
boundary effect zone. In the transition zone, the bearing capacity increases first in the
lower matric suction region and then decreases with further increase in matric suction.
For the matric suction values higher than air-entry value (i.e., 3.2 kPa), the degree of
saturation S reduces dramatically and the contribution of matric suction towards bearing
capacity (i.e. {ua - UW)AVRSV in Equation [2.32]) significantly decreases and also the
corresponding density, y value decreases as water content reduces due to desaturation.
Therefore, the bearing capacity increases nonlinearly until a certain value of matric
suction when (ua - UW)AVRSW and y become relatively small.
qid!=[c +(ua-uJh(l-S^tan0 +(ua-uw)AVRS* tm0]xNcl+O.5ByNy{r [2.32]
104
For an applied stress of 40 kPa
Boundary effect zone A
* Footing 20 mm x 20 mm V Footing 41.75 mm in diameter • Footing 50 mm x 50 mm
Residual zone

However, there were experimental limitations with respect to the measurement of matric
suction. The matric suction value on the soil surface was sensitive to the surrounding
environment and was having a significant influence on the calculation of the matric
suction value (i.e. (ua - UW)AVR) as the waiting period increased. In some experiments, the
actual representative matric suction value might be higher than the measured value.
The bearing capacity of a larger footing is higher than the bearing capacity of a smaller
size footing at any given matric suction value (Fig. 5.17(b)). Reasons associated with this
behavior were discussed in an earlier section.
5.4.2.2 Settlement behavior
Figure 5.17(c) shows the elastic settlement decreases with an increase in modulus of
elasticity as matric suction increases in the boundary effect zone. In the transition zone,
decreasing trend of elastic settlement can be observed in the lower matric suction region.
However, the elastic settlement gradually starts increasing as the matric suction
approaches the residual zone which is attributed to the gradual decrease of modulus of
elasticity. Because the degree of saturation S becomes low and the contribution of matric
suction towards modulus of elasticity (i.e. y-2 ~lSp) in Equation [2.37]) is small.
Table 5.3 shows the moduli of elasticity under three model footings. Similar trends in
behaviour were also reported by Oh et al. (2009) (see Figure 2.25). Besides, the result
(Fig. 5.17(c)) also shows that larger footing can reduce more settlement under various
matric suction values.
E = E unsat sat
[2.37]
1-v2
£ = - — — B I [2.24] AS/Aqp
pw
105

Table 5.3 Moduli of elasticity under four model footings of Quarry sand
Matric suction
(kPa)
2
4
6
8
Footing size (mm)
20x20
301
895
892
399
D = 41.75
520
1870
1986
1172
50x50
2230
3879
4019
3498
5.4.2.3 Comparisons between the measured and predicted bearing capacity
values and elastic settlements
Figure 5.18 shows the comparisons between the measured and predicted bearing capacity
values and elastic settlements for the model footing of 41.75 mm in diameter using
Equations [2.32], [2.37] and [2.24]. The parameters are the same as Filtration sand (i.e.,
t a n / = 2/3tan0', v = 0.3, y/= \,P= 1 and a = 2.5).
1000
re a.
a->. +* u a Q. CO u O) C
re a> A a> +* re U
lj]
800
K00
400
200
Footing 41.75 mm in diameter
• •
• Measured
Piedicted
•
t*000^ I i i i
2 4 6 8
Matric suction, u -u (kPa)
10
(a)
106

^ fc E,
CO
Set
tlem
enl
£ 3
20
15
10
5
n
Footing 41.75
r For
• \
- \
mm in diameter
an applied stress of 40 kPa
— • T t
• Measured Predicted
• i
4 6
Matric suction, ua-uw (kPa)
(b)
10
Figure 5.18 Comparisons of measured and predicted bearing capacity, and settlement of Quarry sand
There is also reasonable agreement between the measured and predicted bearing capacity
values and settlements. Several of the salient features for Filtration sand discussed in the
earlier sections can also be observed for Quarry sand. However, there were some
discrepancies between the measured and predicted values which may be attributed to the
different modes of failure.
The measured bearing capacity values are higher than the predicted values and the
measured settlements are slightly lower than the predicted ones. Such a behavior is
conservative; however, more investigations are required on different types of sands to
fully characterize the behavior.
Different values of parameter a (i.e., 2, 1.5, 1 or 0.5) were used to understand the
sensitivity with respect to settlement. Figure 5.19 summarizes these results. If a smaller
value of a (i.e., 2, 1.5, 1 or 0.5) was used, according to Equations [2.37] and [2.24], the
107

modulus of elasticity would be smaller and the elastic settlement would be larger. In
other words, the results would show more conservative estimates.
25
Footing 41.75 mm in diameter
For an applied stress of 40 kPa
Measured a = 2.5
a = 1 . 5 a = 1 <x = 0.5
a = 1 . 5
V 4 6
Matric suction, ua-uw (kPa)
10
Figure 5.19 Variation of settlement with the parameter, a, for the footing 41.75 mm in diameter in Quarry sand
5.4.3 Sil-co-sil 106
The Sil-co-sil 106 used in the present research is manufactured from quartz that has a
high percentage of silt sizes content (92.8%). Several studies have shown that this soil is
highly sensitive to water content changes (Fall et al. 2004, Nasir and Fall 2009). This soil
is stable at low water contents and offer high resistance to static loads. However, it is
unstable under impact or dynamic loading conditions. Once collapse initiates in some
pockets of the silt size particle aggregations with high degree of saturation and low
suction, water gradually squeezes out and carries soil along with it under impact of
vibration (Li 2008).
This soil is studied in this research program because of its wide applications in mining
industry. It is chosen as a candidate material to understand the bearing capacity and
108

settlement behavior and to check whether semi-empirical equations proposed for
unsaturated soils can be extended for this soil.
The experimental procedures described for determining the variation of bearing capacity
and settlement behavior of model footings in earlier sections were used for the Sil-co-sil
106. Typical punching shear failure conditions were observed when the model footings
were loaded in this soil.
After the completion of each test, the soil container was subjected to vibration (i.e., using
a rubber hammer and knocking on the side of bearing capacity tank container). It was
interesting to note that even under the impact of low intensity rubber hammer knock; a
smooth surface was achieved due to the movement of soil and water. In other words, the
density and water content conditions were similar to initial conditions prior to conducting
the test. Several precautions were taken to check that identical initial testing conditions
prevail prior to conducting the next series of bearing capacity tests. This was ascertained
by checking the dry unit weight of Sil-co-sil 106, which was equal to 15.05 kN/m3.
Figure 5.20 to Figure 5.23 show the applied pressure versus settlement obtained from
bearing capacity tests under four different sizes of footings, respectively. The footing was
loaded to a settlement value which is equal to 30% of the footing size.
109

DUU
500
fa a. * 400 £ 3 If)
% 300 a. •a Q)
iL 200 Q.
< 100
n
s ^
S .— X ^ ^
yf>
^ /
/ / ,'~ / y
./ y +*'
.• ^ y ^ < ^ ~*
i"** i t * " ' r '' i i i i 1
Footing 20 mm x 20 mm
Saturated 2kPa 4kPa 6kPa 8 kPa
0 1 2 3 4 5 6 7
Settlement (mm)
Figure 5.20 Applied pressure versus settlement of Sil-co-sil 106 under the footing of 20 mm x 20 mm
800
-2 600 Q.
10
% 400
< 200
-
#. .•* . . • •
, • • * ' ••• *?•"
~ * - ~ r ^ i
..•' .!
,• M\
s
,' / * * *r • ^
^
-.."**
X
' ' / '
/ '.' y s' * y y •f' ^ —
Footing 37 mm x 37 mm
Saturated 2kPa 4kPa 6kPa 8kPa
8 10 0 2 4 6
Settlement (mm)
Figure 5.21 Applied pressure versus settlement of Sil-co-sil 106 under the footing of 37 mm x 37 mm
110

1200
1000
i 800
« 600
I 400
200
Footing 41.75 mm in diameter
Saturated 2kPa 4kPa 6kPa 8 kPa
4 6 8
Settlement (mm)
12
Figure 5.22 Applied pressure versus settlement of Sil-co-sil 106 under the footing of 41.75 mm in diameter
1200
1000
(0
£. 800
3 V)
2 600 0L TJ 0>
a 400 Q. <
200
-
/ V
/'/ '',' .-I
*"&<•' — ^ " " ' I 1 •
. / . //
' ' ' S
/< ' '//
s/' ^ .' // s*f / ^
r s ^ jr
• • •
Footing 50 mm x 50 mm
Saturated 2kPa 4kPa 6kPa 8kPa
6 8
Settlement (mm)
10 12 14
Figure 5.23 Applied pressure versus settlement of Sil-co-sil 106 under the footing of 50 mm x 50 mm
The results from Figure 5.20 to 5.23 demonstrate that the applied pressure increases with
an increase in the settlement. No defined peak failure conditions were observed for most
111

of the results as the resistance to the applied static load was increasing with settlement. In
other words, the nature of this soil is stiff under static loading conditions.
Figure 5.24 shows the soil surfaces after test under the condition of 2 kPa (i.e., the degree
of saturation is 99.83%) for the four footings. Typical punching shear behaviour was
observed from all the different footings. Due to this reason, the ultimate bearing capacity
was defined when the settlement reached 20% of the footing size according to ASTM
D1194-94.
(a) Footing 20 mm x 20 mm (b) Footing 37 mm x 37 mm
(c) Footing 41.75 mm in diameter (d) Footing 50 mm x 50 mm
Figure 5.24 Surface of Sil-co-sil 106 after test under the condition of 2 kPa for different footings
The variation of bearing capacity and settlement with respect to different matric suction
values for four model footings are shown in Figure 5.25 and Figure 5.26, respectively.
112

For the measured values of elastic settlement, an applied stress of 80 kPa was used. This
stress is chosen as settlement behavior was still in the elastic range for the applied stress
of 80 kPa.
5.4.3.1 Bearing capacity
Figure 5.25 Relationship of bearing capacity versus matric suction of Sil-co-sil 106
The results demonstrate that Sil-co-sil 106 can carry high static load compared to the
other two sands discussed earlier. Such a behavior can be attributed to temporary
cementation that develops at the interparticle contact of the silt size fraction (Lee et al.
2007). The soil behaves more like a composite material rather than particulate material
and contributes to the bearing capacity and offers resistance to the settlement. In addition
to the contribution of cementation, the bearing capacity also increases due to the
contribution of matric suction (Fig. 5.25). The matric suction range (i.e., 0 to 8 kPa)
tested is lower than the air-entry value of the Sil-co-sil 106 which is 30 kPa. In other
words, the matric suction range (i.e., 0 to 8 kPa) is still in the boundary effect zone and
the increase in bearing capacity is linear.
113

The bearing capacity of the model footings also increases with an increase in the footing
size under various matric suction values. The circular footing of 41.75 mm in diameter
has higher bearing capacity than the equivalent square footing of 37 mm x 37 mm. The
reasons associated with this behavior have been explained in an earlier section.
Some scatter in the data (i.e., 2 kPa under the footing of 37 mm x 37 mm, 6 kPa and 8
kPa under the footing of 41.75 mm in diameter) can be attributed to the measured matric
suction readings in stress bulb by Tensiometers. The matric suction readings were
sensitive and were changing during the test. These results clearly demonstrate that the
stress state (i.e., matric suction is changing) without any change in water content. The
change in matric suction may be attributed to the temporary cementation forces that are
developing at the interparticle contact points. Such a behavior may also be attributed to
non-uniform water contents within the soil. More studies are necessary to study the soil
structural changes and also the micro fissures and cracks that may have developed and
contributed to the non-uniform water contents to provide more rigorous and valid
justifications.
5.4.3.2 Settlement behavior
3.0
2.5 K
0.0
For an applied stress of 80 kPa
* Footing 20 mm x 20 mm T Footing 37 mm x 37 mm • Footing 41.75 mm in diameter • Footing 50 mm x 50 mm
4 6 8
Matric suction, ua-uw (kPa)
10
Figure 5.26 Relationship of settlement versus matric suction of Sil-co-sil 106
114

The trends of the results in Figure 5.26 show that the elastic settlement decreases with an
increase in the modulus of elasticity due to the contribution of matric suction. The erratic
results may be attributed to the non-uniform properties of the soil and changing matric
suction values during the test. However, the results are consistent with general trends
observed in the settlement behavior of footings; larger size footing settlements are lower
than a smaller size footing. More details with respect to this behavior were discussed in
an earlier section.
5.4.4 Min-u-sil 30
Min-u-sil 30 is the soil that has maximum percentage of fines (99.5%) in comparison to
other soils used in present research program. The measured dry unit weight of Min-u-sil
30 was 13.17 kN/m3. Figure 5.27 to Figure 5.30 show the results of the applied pressure
versus settlement obtained from bearing capacity tests under four different sizes of
footings, respectively. The footing was loaded to a settlement value which is equal to
30% of the footing size.
350
300
D.
0)
3 200 (0 10
£
a;
3- 100
50
0
Footing 20 mm x 20 mm
Saturated 2kPa 4kPa 6kPa 8 kPa
1 2 3 4 5 6 7
Settlement (mm)
Figure 5.27 Applied pressure versus settlement of Min-u-sil 30 under the footing of 20 mm x 20 mm
115

300
250 r
Footing 37 mm x 37 mm
Saturated 2kPa 4kPa 6kPa 8kPa
4 6 8 10
Settlement (mm)
Figure 5.28 Applied pressure versus settlement of Min-u-sil 30 under the footing of 37 mm x 37 mm
500
Footing 41.75 mm in diameter
Saturated 2kPa 4kPa 6kPa 8kPa
4 6
Settlement (mm)
10
Figure 5.29 Applied pressure versus settlement of Min-u-sil 30 under the footing of 41.75 mm in diameter
116

700
600 h
Footing 50 mm x 50 mm
Saturated 2kPa 4kPa 6kPa 8kPa
12 14 4 6 8 10
Settlement (mm)
Figure 5.30 Applied pressure versus settlement of Min-u-sil 30 under the footing of 50 mm x 50 mm
Most of the results showed local shear failure behavior under different footings (Figure
5.27 to 5.30). Therefore, the ultimate bearing capacity was defined as the inflexion
pressure according to ASTM Dl 194-94. For the specimens showing punching shear
failure mode, the bearing capacity value was estimated at the settlement which is 20% of
the footing size (ASTM Dl 194-94). The variation of bearing capacity and settlement
with respect to different matric suction values for three model footings (i.e., footing 20
mm x 20 mm, footing 41.75 mm in diameter and footing 50 mm x 50 mm) are shown in
Figure 5.31 and Figure 5.32, respectively.
The results of 37 mm x 37 mm footing are not consistent with the expected behavior.
Such a behavior may be attributed to the influence of micro fissures or cracks or due to
differences in cementation activity in this soil. As discussed earlier, more studies are
necessary to further investigate this behavior.
For the measured values of elastic settlement, an applied stress of 40 kPa was used. This
stress is chosen as settlement behaviour is in elastic range for the applied stress of 40 kPa.
117

5.4.4.1 Bearing capacity
Figure 5.31 Relationship of bearing capacity versus matric suction of Min-u-sil 30
The trends from the results of three model footings (Figure 5.31) demonstrate that the
bearing capacity increases linearly with increase in matric suction. This behavior is
consistent with the behavior of Sil-co-sil 106, discussed in the earlier sections. As this
soil has high air-entry value of 100 kPa, the range of matric suction from 0 to 8 kPa is in
the boundary effect zone. In this range of matric suction, the relationship between bearing
capacity and matric suction is linear. This behavior can be observed from the tests results.
For the suction range (i.e. 0 to 8 kPa), the degree of saturation S is equal to 1 so the part
(i.e. (ua - UW)AVR) in Equation [2.32] is proportional to the bearing capacity. Therefore, the
bearing capacity increases with increase in matric suction.
qult=[c +(ua-uw)h(\-Snt^ + (ua-uw)AVRS'// tm</>']xNjc+0.5BrN^r [2.32]
118

The bearing capacity value increases with an increase in the footing size under various
matric suction values. Such a behavior can be attributed to the B value in Equation [2.32],
which is the width or diameter of the footing. In addition, the change in matric suction
due to the temporary cementation forces was also observed as Sil-co-sil 106. More
research is necessary to understand the influence of cementation forces on the matric
suction readings.
5.4.4.2 Settlement behavior
? E, CO
Set
tlem
ent,
4.0
3.5
3.0
2.5
2.0
1.5
1.0
0.5
0.0 0 2 4 6 8 10
Matric suction, ua-uw (kPa)
Figure 5.32 Relationship of settlement versus matric suction of Min-u-sil 30
Similar to Sil-co-sil 106, Min-u-sil 30 showed similar trends in the settlement behaviour.
Elastic settlement decreases with increase in matric suction since both soils have
relatively high air-entry values which are higher than the suction range (i.e., 0 to 8 kPa).
The modulus of elasticity (i.e. Eq. [2.37]) can increase along with matric suction as the
degree of saturation S is equal to 1 in the suction range. Therefore, the settlement
decreases with an increase in matric suction. Furthermore, larger size footing settlements
are lower than the smaller size footing for all the different matric suction values that were
used in the testing program.
119
For an applied stress of 40 kPa
J I I L

E = E unsat sat
iUa-Uw)
(PJIOO) /100P '
E = 1-v2
B.I.. AS/Aqp "
[2.37]
[2.24]
5.4.4.3 Comparisons between the measured and predicted bearing capacity
values and elastic settlements
Figure 5.33 shows the comparisons between the measured and predicted bearing capacity
values and elastic settlements of Min-u-sil 30 using Equations [2.32], [2.37] and [2.24].
The parameters are tan^* = 2/3tan0 , v = 0.3, y/ = 1, /? = 1 and a = 2.5.
4 6
Matric suction, ua-uw (kPa)
(a)
2 4 6 8
Matric suction, ua-uw (kPa)
«T 300 0. ^t
capa
city
, q
to
ro
©
en
o
©
O)
• i iso (0 0) n
Ulti
mat
e
in
o 3
O
O
Footing 20 mm x 20 mm
• .»
•
• Measured Predicted
•
«• 7 0° 0 .
ff 600
2" u 500 Q. n ™400 c S 300 n a | 200
t
3 100
Footing 50 mm x 50 mm
•
•
• Measured Predicted
•
£ 500 - Footing 41.75 mm in diameter
•
• •
• Measured Predicted
•
4 6
Matric suction, ua-uw (kPa)
10
(b)
?
I (/)
emen
t S
ett
50
40
30
20
10
0
For
Footing 20 mmx 20 mm
an applied stress of 40 kPa
• • •
• Measured Predicted
•
4 6
Matric suction, ua-uw (kPa)
10
(c) (d)
Figure 5.33 Comparisons of measured and predicted bearing capacity, and settlement of Min-u-sil 30
120

There is some agreement between the measured and predicted bearing capacity values
and settlements for the model footing of 20 mm x 20 mm at lower matric suction values.
However, as the model footing size increases, the measured bearing capacity values are
relatively higher than the predicted values. The differences in the measured and predicted
bearing capacity values can be attributed to the cementation forces. Rinaldi and
Capdevila (2006) stated that matric suction and cementation together have significant
influence on the stress-strain behaviour of many soils. However, the matric suction is still
the main parameter that contributes to an increase in the bearing capacity and reducing
settlement of soils that are in a state of unsaturated condition.
5.5 Summary
In this chapter, the results of bearing capacity and settlement behaviour for four different
unsaturated soils were analyzed. The bearing capacity test system (described in Chapter 3)
used was reliable and efficient for conducting the proposed research program using the
model footing tests. For the coarse-grained soils (i.e., Filtration sand and Quarry sand),
the bearing capacity increases up to the residual suction value and then decreases with
further increase in matric suction value; however, the settlement decreases up to residual
suction value and gradually starts increasing along with an increase in the matric suction.
The proposed equations by Vanapalli and Mohamed (2007) and Oh et al. (2009) are
respectively found to be useful for interpreting and predicting the bearing capacity and
elastic settlement of unsaturated soils.
For the fine-grained soils (i.e. Sil-co-sil 106 and Min-u-sil 30), the bearing capacity
increases and settlement decreases in the matric suction range of 0 to 8 kPa. The bearing
capacity value increases with an increase in the footing size. There is a linear increase in
the bearing capacity because the matric suction range (i.e., 0 to 8 kPa) falls in the
boundary effect zone. However, there is an opposite trend with respect to settlement
behaviour; which is again consistent expected behavior in unsaturated soils. The results
clearly show that cementation forces influence the bearing capacity and settlement
behavior of Sil-co-sil 106 and Min-u-sil 30. This is demonstrated from the measured
results which show higher bearing capacity and lower settlement than the expected
121

contribution from matric suction. More investigations are however necessary to better
understand the various parameters that influence these soils.
122

CHAPTER 6
CONCLUSIONS AND RECOMMENDATIONS
6.1 Summary
The key objective of the research presented in this thesis is to determine the bearing
capacity and settlement behaviour of four different soils of which the first two were
coarse-grained soils (i.e. Filtration sand and Quarry sand) and the remainder two were
fine-grained soils (i.e. Sil-co-sil 106 and Mil-u-sil 30) using four different sizes of model
footings (i.e., 20 mm x 20 mm, 37 mm x 37 mm, 41.75 mm in diameter, and 50 mm x 50
mm) over a suction range of 0 to 8 kPa. The two fine-grained soils (i.e., Sil-co-sil 106
and Mil-u-sil 30) studied are commonly used in mining industry. Sil-co-sil 106 is used
for a variety of foundry products and Min-u-sil 30 is used as filler and extender for paints,
inks and plastics and other industrial applications.
The range of matric suction 0 to 8 kPa extends over the boundary effect, transition and
residual stages (Vanapalli et al. 1999) for the two coarse-grained soils studied in the
present research program. Both the coarse-grained soils provided an excellent
opportunity to understand the nonlinear nature of the bearing capacity and settlement
behaviour over this matric suction range. In addition, these test results also provided an
opportunity to verify the semi-empirical models proposed by Vanapalli and Mohamed
(2007) and Oh et al. (2009) for predicting the bearing capacity and settlement behaviour
of the two coarse-grained soils, respectively. The semi-empirical models for predicting
the bearing capacity and settlement behaviour need the saturated soil properties and the
Soil-Water Characteristic Curve (SWCC).
The matric suction in the stress bulb below the model footings of the two fine-grained
soils (i.e. Sil-co-sil 106 and Mil-u-sil 30) was changing because of cementation properties
123

during the test. Due to this reason, the bearing capacity and settlement behaviour of Sil-
co-sil 106 were not predicted. However, for both these soils, the bearing capacity and
settlement behaviour were determined and the results were analyzed. An attempt was
made to predict the bearing capacity and settlement behaviour of Min-u-sil 30.
The bearing capacity and settlement behaviour from model footing tests for all the four
soils were conducted under a controlled laboratory environment using a strain rate of
1.143 mm/min. The same strain rate was also used for determining the saturated shear
strength parameters of the coarse-grained soils using the triaxial shear apparatus. The
modelling studies by Oh & Vanapalli (2008) show that the bearing capacity of model
footings of 50 mm width or lower can be conducted using relatively smaller size tanks of
300 mm diameter. Li (2008) designed a special bearing capacity test system using 300
mm diameter cylinder to conduct to model tests using footing sizes lower than 50 mm
using soil suction profile technique (described in Chapter 3). The equipment and the
technique were used in the present research program; they worked well for conducting all
the 80 tests described in the present research program. These many numbers of tests
would not have been possible to be conducted with the specially designed equipment.
6.2 Conclusions
The following conclusions can be drawn from the studies undertaken through this
research program.
(i) The variation of bearing capacity of coarse-grained soils (i.e., Filtration sand
and Quarry sand) with respect to matric suction was nonlinear in nature. The
bearing capacity increases up to the residual suction value and then decreases
with further increase in matric suction values. All the footings showed similar
behaviour. The trends for settlement are however opposite; the settlement
decreases up to residual suction value and gradually start increasing along
with an increase in the matric suction. These results are consistent with the
bearing capacity results reported in the literature by Mohamed and Vanapalli
(2006) and settlement behaviour reported by Oh et al. (2009).
124

(ii) For the unsaturated fine-grained soils (i.e. Sil-co-sil 106 and Min-u-sil 30),
bearing capacity increases and settlement decreases as the matric suction
increases because the suction range (i.e. 0 to 8 kPa) is in the boundary effect
zone. In other words, the suction range in the boundary effect zone is lower
than the air-entry value (i.e. saturation zone). These results are consistent with
the theoretical formulations of the bearing capacity and settlement behaviour
of unsaturated soils.
(iii) The footing size (from 20 mm to 50 mm) has significant influence on the
measured bearing capacity and settlement behaviour of the unsaturated soils.
The bearing capacity value increases with an increase in the footing size.
However, there is an opposite trend with respect to settlement behaviour;
which translates to lower settlement for footings when the footing sizes are
larger.
(iv) Sil-co-sil 106 has shown significant resistance to the static loading conditions;
however, it offers limited resistance to vibration or dynamic loading
conditions. When a footing is loaded in this soil, there is a partial collapse
and water squeezes out from the zone of loading into other regions of low
initial water content. This tendency proliferates with further loading of the
footing and contributes to total collapse.
(v) The proposed equations by Vanapalli and Mohamed (2007) and Oh et al.
(2009) are respectively useful for predicting the bearing capacity and elastic
settlement of unsaturated soils. There are good comparisons between the
measured and predicted bearing capacity and settlement values for all sands
with different model footings.
(vi) A value of fitting parameter a (which is influenced by footing size) controls
the variation of the modulus of elasticity (see Equation [2.37]) between 0.5
and 2 provides conservative elastic settlements. It is recommended to use
these values in engineering practice.
6.3 Recommendations
Some recommendations are provided for future research work.
125

The matric suction values closer to the soil surface are highly sensitive to the
humidity conditions of the testing environment. The matric suction can be
relatively high in dry environments and low in humid environments. Due to
this reason, the representative matric suction value (i.e., (ua - UW)AVR) estimated
may be erroneous if matric suction values are not determined close to the
surface. Therefore, it is suggested to measure the water content value closer to
the surface and back calculate the matric suction value from the measured
SWCC data on the same soil. Such a technique will be useful in the reliable
estimation of representative matric suction value (i.e., (ua - UW)AVR )•
More tests are necessary to be conducted at different strain rates to understand
its influence to the bearing capacity and settlement behaviour.
The matric suction in the stress bulb below the footings of all the two fine
grained soils (i.e. Sil-co-sil 106 and Mil-u-sil 30) is significantly influenced
due to the cementation forces. Small model footings may not provide reliable
results. It is recommended to use larger size model footings and a larger size
bearing capacity tank for obtaining reliable and reproducible results. More
research is necessary to understand the influence of cementation forces on the
matric suction readings.
126

References
Adams, M.T., and Collin, J.G. 1997. Large model spread footing load tests on
geosynthetic reinforced soil foundations. Journal of Geotechnical and
Geoenvironmental Engineering, ASCE, Vol. 123, No. 1.
Agarwal, K.B., and Rana, M.K. 1987. Effect of ground water on settlement of footings in
sand. In proceedings of the 9th European Conference on Soil Mechanics and
Foundation Engineering, pp. 751-754.
Alim, M.A., Nishigaki, M., Chegbeleh, L.P., Akudago, J.A. and Komatsu, M. 2009.
Determination of soil-water characteristic curves of unsaturated sandy soils using
membrane filter with stainless wire mesh. Journal of the Faculty of Environmental
Science and Technology, Okayama University, 14(1), pp. 13-16.
ASTM, Dl 194-94. 2003. Standard test method for bearing capacity of soil for static load
and spread footings. American Society of Testing Material, Philadelphia.
ASTM, D2216. 1994. Laboratory determination of water (moisture) content of soil and
rock by mass. American Society of Testing Material, Philadelphia.
ASTM, D422. 1994b. Standard test method for particle size analysis of soils. American
Society of Testing Material, Philadelphia.
ASTM, D4767-04. 2004. Standard test method for consolidated undrained triaxial
compression test for cohesive Soils. American Society of Testing Material,
Philadelphia.
ASTM, D6836-02. 2008. Standard test methods for determination of the soil water
characteristic curve for desorption using a hanging column, pressure extractor, chilled
mirror hygrometer, and/or centrifuge. American Society of Testing Material,
Philadelphia.
Bolton, M.D. 1986. The strength and dilatancy of sands. Geotechnique, 36(1): 65-78.
Broms, B.B. 1964. The effect of degree of saturation on the bearing capacity of flexible
127

pavements. Highway Research Recoed, No. 71: 1-14.
Carter, J.P. 2006. Application of structured soil models to shallow footing problems. Soil
and Rock Behavior and Modeling (GSP 150), ASCE, 194, 2.
Costa, Y.D., Cintra J.C., and Zornberg J.G. 2003. Influence of matric suction on the
results of plate load tests performed on a lateritic soil deposit. Geotechnical Testing
Journal, 26(2): 219-226.
Das, Braja M. 1999. Shallow foundations: bearing capacity and settlement. CRC Press
LLC, Florida.
Davis, A.G, and Poulos, H.G. 1968. The use of elastic theory for settlement prediction
under three dimensional conditions. Geotechnique, 18: 67-91.
Dregne, H.E. 1976. Soils in arid regions. New York: American Elsevier, 5 pp.
Fall, M., Benzaazoua, M., and Ouellet S. 2004. Effect of tailings properties on paste
backfill performance. In Proceedings of 8th International Symposia on Mining with
Backfill, Beijing, China, pp. 193-202.
Fredlund, D.G, and Morgenstern, N.R. 1977. Stess state variables for unsaturated soils.
Journal of Geotechnical Engineering, 103(GT5): 447-466.
Fredlund, D.G, and Rahardjo, H. 1993. Soil mechanics for unsaturated soils. John Wiley
& Sons, INC., New York.
Fredlund, M.D., Wilson, G.W., and Fredlund, D.G 2002. Use of the grain-size
distribution for estimation of the soil-water characteristic curve. Canadian
Geotechnical Journal, 39: 1103-1117.
Kumbhojkar, A.S. 1993. Numerical evaluation of Terzaghi's Nr. Journal of Geotechnical
Engineering, ASCE, 119(3): 598.
Lade, P.V. 1988. Model and parameters for the elastic behavior of soils. In proceedings of
the International Conference on Numerical Methods in Geomechnics, Innsbruck,
Austria. Edited by G Swoboda. Balkema, Rotterdam, the Netherlands.
Lade, P.V., and Nelson, R.B. 1987. Modeling the elastic behavior of granular materials.
128

International Journal for Numerical and Analytical Methods in Geomechanics,
ll(5):521-542.
Lancelotta, R. 1995. Geotechnical engineering. Balkema, Rotterdam, the Netherlands.
Lee, C , Lee, J., Lee, W., Yoon, H., Cho, T., and Quang, T.H. 2007. Cementation effects
on rigid-soft particle mixtures. Geo-Denver: New Peaks in Geotechnics.
Li, X.D. 2008. Laboratory studies on the bearing capacity of unsaturated sands. Master's
thesis, University of Ottawa, Ottawa, Ont.
Lu, N., and Likos, W. 2004. Unsaturated soil mechanics. John Wiley and Sons, New
York, NY, USA.
Mayne, P.W., and Poulos, H.G. 1999. Approximate displacement influence factors for
elastic shallow foundations. Journal of Geotechnical and Geoenvironmental
Engineering, ASCE, 125(6): 453-460.
Meyerhof, GG. 1951. The ultimate bearing capacity of foundations. Geotechnique, 2: 301
-332.
Miller, G.A., and Muraleetharan, K.K. 1998. In situ testing in unsaturated soil. In
Proceedings of the 2nd International Conference on Unsaturated Soils, Beijing, China,
1:416-421.
Mohamed, F.M.O., and Vanapalli, S.K. 2006. Laboratory investigations for the
measurement of the bearing capacity of an unsaturated coarse-grained soil. In
Proceedings of the 59th Canadian Geotechnical Conference. Vancouver, British
Columbia, Canada.
Mohamed, F.M.O., and Vanapalli, S.K. 2009. An experimental investigation of the
bearing capacity of unsaturated sand using cone penetration tests. In Proceedings of
the 62nd Canadian Geotechnical Conference & 10th Joint CGS/IAH-CNC
Groundwater Conference, Halifax, Canada.
Mohamed, F.M.O., Vanapalli, S.K., and Saatcioglu, M. 2010. Comparison of bearing
capacity of unsaturated sand using the cone penetration tests (CPT) and the plate load
129

tests (PLT). In Proceedings of the 5th International Conference on Unsaturated Soils,
Barcelona, Spain.
Nasir, O., and Fall, M. 2009. Modeling the heat development in hydrating CPB structures.
Computers and Geotechnics, 36: 1207-1218.
Oh, W.T., and Vanapalli, S.K. 2008. Modelling the stress versus settlement behavior of
model footings in saturated and unsaturated sandy soils. In Proceedings of the 12th
International Conference of International Association for Computer Methods and
Advances in Geomechanics (IACMAG), Goa, India.
Oh, W.T., Vanapalli, S.K., and Puppala, A.J. 2009. Semi-empirical model for the
prediction of modulus of elasticity for unsaturated soils. Canadian Geotechnical
Journal, 46: 903-914.
Oloo, S.Y. 1994. A bearing capacity approach to the design of low-volume traffic roads.
PhD thesis, University of Saskatchewan, Saskatoon, SK, Canada.
Oloo, S.Y., Fredlund, D.G., and Gan, J.K-M. 1997. Bearing capacity of unpaved roads.
Canadian Geotechnical Journal, 34: 398 - 407.
Poulos, H.G., and Davis E.H. 1974. Elastic solutions for soil and rock mechanics. John
Wiley and Sons, NY, USA.
Reinson, J.R., Fredlund, D.G., and Wilson, GW. 2005. Unsaturated flow in coarse porous
media. Canadian Geotechnical Journal, 42: 252-262.
Rinaldi, V.A., and Capdevila, J.A. 2006. Effect of cement and saturation on the
stress-strain behavior of a silty clay. Unsaturated Soils 2006 (GSP 147), ASCE, Vol.
189, No. 94.
Rowlett, D.K. 2000. Development of a stand-pipe lysimeter for unsaturated waste rock.
Master's thesis, University of Saskatchewan, Saskatoon, Sask., Canada.
Salgado, R., Bandini, P., and Karim, A. 2000. Shear strength and stiffness of silty sand.
Journal of Geotechnical and Geoenvironmental Engineering, ASCE, Vol. 126, No. 5.
Schnaid, E, Consoli, N.C., Cudmani, R.O., and Militistsky, J. 1995. Load-settlement
130

response of shallow foundations in structured unsaturated soils. In Proceedings of the
1st International Conference of Unsaturated Soils, Paris, France, pp. 999 - 1004.
Simons, N.E., and Som, N.N. 1970. Settlement of structures on clay with particular
emphasis on London clay. Construction Industry Research and Information
Association, London. Report 22.
Skempton, A.W. 1948. The <j>u =0 analysis for stability and its theoretical basis. In
Proceedings of the 2nd International Conference of Soil Mechanics and Foundation
Engineering, 1:12-11.
Steensen-Bach, J.O., Foged, N., and Steenfelt, J.S. 1987. Capillary induced stresses - fact
or fiction?. 9th ECSMFE, Groundwater Effects in Geotechnical Engineering, Dublin:
83-89.
Terzaghi, K. 1943. Theoretical soil mechanics. John Wiley and Sons, INC., New York,
NY, USA.
Timoshenko, S., and Goodier, J.N. 1951. Theory of elasticity. McGraw-Hill, New York.
Vanapalli, S.K. 2009. Shear strength of unsaturated soils and its applications in
geotechinical engineering practice. UNSAT Asia-Pacific 2009, Australia, Keynote.
Vanapalli, S.K., Fredlund, D.G., Pufahl, D.E., and Clifton, A.W. 1996. Model for the
prediction of shear strength with respect to soil suction. Canadian Geotechnical
Journal, 33(3):379-392.
Vanapalli, S.K., Fredlund, D.G., and Pufahl, D.E. 1999. The influence of soil structure
and stress history on the soil-water characteristic curve of a compacted till.
Geotechnique, 49(2): 143-159.
Vanapalli, S.K., and Mohamed, F.M.O. 2007. Bearing capacity of model footings in
unsaturated soils. In Experimental Unsaturated Soil Mechanics. Springer Proceedings
in Physics. Springer-Verlag Berlin Heidelberg. Vol. 112. pp. 483-493.
Vanapalli, S.K., Oh, Won Taek, and Puppala, Anand J. 2007. Determination of the
bearing capacity of unsaturated soils under undrained loading conditions. In
131

Proceedings of 60th Canadian Geotechnical Conference & 8th Joint CGS/IAH-CNC
Groundwater Conference, T6-A, Ottawa, Canada.
Vanapalli, S.K., Sun, R., and Li, X. 2010. Bearing capacity of an unsaturated sand from
model footing tests. In Proceedings of the 5th International Conference on
Unsaturated Soils, Barcelona, Spain.
Vesic, A.S. 1963. Bearing capacity of deep foundations in sand. Highway Research
Record, 39: 112-153.
Vesic, A.S. 1973. Analysis of ultimate loads of shallow foundations. Journal of the Soil
Mechanics and Foundation Division, ASCE, 99(SM1): 45 - 73.
Yongfu Xu 2004. Bearing capacity of unsaturated expansive soils. Geotechnical and
Geological Engineering, 22: 611 - 625.
132

APPENDIX
Table A.l Grain size distribution data of Filtration sand
Sieve No.
12 20 25 30 40 60 Pan
Opening diameter (mm)
1.7 0.85 0.71 0.6
0.425 0.25
Mass retained
(g) 0
164.01 235.39 359.32 201.5 29.15 6.13
% retained
0 16.401 23.539 35.932 20.15 2.915 0.613
% passing Cumulative
100 83.599 60.06
24.128 3.978 1.063
0
Table A.2 Grain size distribution data of Quarry sand
Sieve No.
30 40 60 80 100 200 Pan
Opening diameter (mm) 0.6
0.425 0.25 0.18 0.15
0.075
Mass retained
(g) 9.91 10.68 175.5
339.81 175.61 247.04 36.15
% retained
0.991 1.068 17.55
33.981 17.561 24.704 3.615
% passing Cumulative
99.009 97.941 80.391 46.41 28.849 4.145
0
Table A.3 Chemical analysis of Filtration sand
Chemical compound Silicon Dioxide (SiOa) Iron Oxide (Fe203) Aluminum Oxide (AI2O3) Calcium Oxide (CaO) Titanium Dioxide (Ti02) Magnesium Oxide (MgO) Potassium Oxide (K20) Loss on Ignition (L.O.I.)
% by weight 99.230 0.110 0.330 0.020 0.010 0.010 0.010 0.160
133

Table A.4 Suction profile data of Filtration sand
Depth of water table (mm)
0 50 150 250 350 450 550 650 750 850
Matric suction of 50 mm below soil suface (kPa)
0 0.8 1.8 2.2 3.6 4.4 6
7.8 9
11.6
Matric suction of 100 mm below soil suface (kPa)
0 0.8 1.8 2.2 3.6 4.4 5
5.6 6.2 7.4
Table A.5 Suction profile data of Quarry sand
Depth of water table (mm)
0 50 150 250 350 450 550 650 750
Matric suction of 50 mm below soil suface (kPa)
0 0.4 1.5 2.4 3.3 4
5.3 6.2 7
Matric suction of 100 mm below soil suface (kPa)
0 0.4 1.5 2.4 3.3 4
5.3 6.2 7
Table A.6 Typical Chemical Analysis of Sil-co-sil 106 (%)
Silicon Dioxide (total)
Aluminum Oxide
Iron Oxide
Titanium Oxide
Calcium Oxide
Loss On Ignitition
Si02
A1203
Fe203
Ti02
CaO
LOI
> 99.80
-0.05
-0.04
-0.02
<0.01
-0.10
134

Table A.7 Typical Physical Properties of Sil-co-sil 106
Colour
Hardness (Mohs)
Specific Gravity (g/cc)
pH
White
7
2.65
7
Mineral
Moisture
Melting Point (°F)
Melting Point (°C)
Quartz
< 0.20%
-3100
~ 1700
Table A.8 Suction profile data of Sil-co-sil 106
Depth of water table (mm)
0 50 150 250 350 450 550 650 750 850
Matric suction of 50 mm below soil suface (kPa)
0 0
1.8 2.8 4
4.8 5.8 7 8 9
Matric suction of 100 mm below soil suface (kPa)
0 0
1.8 2.8 4
4.8 5.8 7 8 9
Table A.9 Typical Chemical Analysis of Min-u-sil 30 (%)
Si02 (Silicon Dioxide)
Fe203 (Iron Oxide)
AI2O3 (Aluminum Oxide)
Ti02 (Titanium Dioxide)
CaO (Calcium Oxide)
99.5
0.024
0.30
0.01
0.02
MgO (Magnesium Oxide)
Na20 (Sodium Oxide)
K20 (Potassium Oxide)
LOI (loss on Ignition)
0.01
0.01
0.01
0.2
Table A.10 Typical Physical Properties of Min-u-sil 30
Bulk density-compacted (kg/m3)
Bulk density-uncompacted (kg/m3)
Hardness (Mohs)
Median diameter (MICRONS)
Oil absorption (D-1483)
1009.16
784.90
7
8.0
23
PH
-30 Micron (%)
+325 Mesh (%)
Yellowness index
Specific gravity
6.5
97
0.3
4.0
2.65
135

Table A. 11 Suction profile data of Min-u-sil 30
Depth of water table (mm)
0 150 350 550 750
Matric suction of 50 mm below soil suface (kPa)
0 0.2 3.6 6.4 8.6
Matric suction of 100 mm below soil suface (kPa)
0 0.2 3.6 6.4 8.6
136