bear traps: can russia avoid the pitfalls on the road to …crifes.psu.edu/papers/bearcrifes.pdf ·...
TRANSCRIPT
Bear Traps: Can Russia Avoid the Pitfalls onthe Road to Sustainable Economic Growth?1
Clifford G. Gaddy and Barry W. Ickes
Center for Research on International Financial and Energy Security
This report was produced with generous financial support fromthe Smith Richardson Foundation and from support by theHuman Capital Foundation to the Center for Research onInternational Financial and Energy Security, CRIFES.
1The authors are respectively, Senior Fellow, The Brookings Insti-tution, 1775 Massachusetts Avenue, N.W., Washington, DC 20036-2103([email protected]), and Professor of Economics, The Pennsylvania StateUniversity, University Park, PA 16802 ([email protected]). They are also mem-bers of the Center for Research on International Financial and Energy Security(CRIFES, www.crifes.psu.edu), where Ickes is Director and Gaddy is Senior Sci-entific Fellow.

Contents
Preface ix
1 Introduction 1
2 Investment and Physical Capital 72.1 Introduction . . . . . . . . . . . . . . . . . . . . . . . . . . . . 72.2 Is Investment a Problem in Russia? . . . . . . . . . . . . . . . 9
2.2.1 New versus Installed Capital . . . . . . . . . . . . . . . 102.3 Growth Models and Russian Growth . . . . . . . . . . . . . . 102.4 How High Is Investment in Russia? . . . . . . . . . . . . . . . 12
2.4.1 Traditional Comparisons . . . . . . . . . . . . . . . . . 122.4.2 PPP Comparisons . . . . . . . . . . . . . . . . . . . . 142.4.3 Growth Equations Revisited . . . . . . . . . . . . . . . 21
2.5 Why is the Relative Price of Investment so High in Russia? . . 232.6 Quantity of Capital . . . . . . . . . . . . . . . . . . . . . . . . 25
2.6.1 The τ effect. . . . . . . . . . . . . . . . . . . . . . . . . 262.7 Machinery and Equipment . . . . . . . . . . . . . . . . . . . . 282.8 Consequences of High Relative Price . . . . . . . . . . . . . . 292.9 Conclusion . . . . . . . . . . . . . . . . . . . . . . . . . . . . . 31
2.9.1 There are two views about investment in Russia. . . . . 32
3 Economics of Location 393.1 Introduction . . . . . . . . . . . . . . . . . . . . . . . . . . . . 393.2 Cost of Cold . . . . . . . . . . . . . . . . . . . . . . . . . . . . 40
3.2.1 Size as Salvation and as Stumbling Block . . . . . . . . 413.2.2 Measuring Cold: TPC . . . . . . . . . . . . . . . . . . 443.2.3 The Cost of the Cold . . . . . . . . . . . . . . . . . . . 49
3.3 Cost of the Cold . . . . . . . . . . . . . . . . . . . . . . . . . 58
v

vi CONTENTS
3.3.1 Siberia and the GULAG . . . . . . . . . . . . . . . . . 603.4 Conclusion . . . . . . . . . . . . . . . . . . . . . . . . . . . . . 63
4 Market-Impeding Federalism 674.1 Introduction . . . . . . . . . . . . . . . . . . . . . . . . . . . . 67
4.1.1 Decentralization versus Federalism . . . . . . . . . . . 684.2 Predation and Capture . . . . . . . . . . . . . . . . . . . . . . 714.3 Blanchard-Shleifer Model . . . . . . . . . . . . . . . . . . . . . 714.4 Loser Regions . . . . . . . . . . . . . . . . . . . . . . . . . . . 74
4.4.1 Inter-regional transfers . . . . . . . . . . . . . . . . . . 764.4.2 Inter-regional migration . . . . . . . . . . . . . . . . . 784.4.3 Lights On . . . . . . . . . . . . . . . . . . . . . . . . . 79
4.5 Fictitious Capital . . . . . . . . . . . . . . . . . . . . . . . . . 804.6 Historical Digression . . . . . . . . . . . . . . . . . . . . . . . 83
4.6.1 Federalism versus Efficiency . . . . . . . . . . . . . . . 864.7 Conclusion . . . . . . . . . . . . . . . . . . . . . . . . . . . . . 87
5 Human Capital 915.1 Introduction . . . . . . . . . . . . . . . . . . . . . . . . . . . . 915.2 Population Size . . . . . . . . . . . . . . . . . . . . . . . . . . 93
5.2.1 Age Structure . . . . . . . . . . . . . . . . . . . . . . . 975.2.2 Mortality . . . . . . . . . . . . . . . . . . . . . . . . . 101
5.3 Health . . . . . . . . . . . . . . . . . . . . . . . . . . . . . . . 1065.4 Education . . . . . . . . . . . . . . . . . . . . . . . . . . . . . 109
5.4.1 Location . . . . . . . . . . . . . . . . . . . . . . . . . . 1115.5 Conclusion . . . . . . . . . . . . . . . . . . . . . . . . . . . . . 113
6 Conclusion 1176.1 Introduction . . . . . . . . . . . . . . . . . . . . . . . . . . . . 117
7 Appendix 121

Preface
The purpose of this report is to study the potential pitfalls Russia faces onthe road to sustainable economic growth. The report was produced thanksto generous financial support from the Smith Richardson Foundation, andfrom the support of the Human Capital Foundation to CRIFES, the Centerfor Research on International Financial and Energy Security.
ix


Chapter 1
Introduction
Russia seems on a perpetual search for the sources of sustainable growth ofits economy. As so often in the past, discussions of “modernization,” “inno-vation,” and “diversification” are popular now in Russia. The chief sponsortoday is President Medvedev, who says Russia’s resource-based economy isprimitive and noncompetitive. Reactions to Medvedev’s modernization cam-paign vary. Some think this is a great hope to resume serious reform of theRussian economy and politics; others are cynical and are sure it will neverhappen. But virtually all agree that he’s correct in saying that if his mod-ernization program were to be successful, it would be wonderful for Russia.Our reaction is different. We think it most likely that under the specific
Russian circumstances today, a modernization program would lead to nega-tive results. This is because none of the modernization programs currentlybeing discussed take into account the real causes of Russia’s backwardness.We argue that there are two main causes. The first is the inherited pro-duction structure — both the particular kinds of physical and human capitalthat were accumulated in the Soviet era and the manner in which they wereallocated, including their spatial allocation. The second cause of backward-ness is the condition we call rent addiction, which means that there is animperative to distribute a large share of Russia’s oil and gas rents to the pro-duction enterprises that employ this inherited physical and human capital.Any “modernization” policy that fails to address the problem of addictionwill simply distribute more rents to the addicts. Far from truly modernizingRussia, it will only reinforce the backwardness and inefficiency.Herein lies the tragedy. Russia does need to move on a path towards
sustainable growth. But unless the policies to achieve that goal are chosen
1

2 CHAPTER 1 INTRODUCTION
with full recognition of the real causes of stagnation and backwardness – rentaddiction and the structural legacy it helps perpetuate – the policies willlikely lead to even worse problems in the future. They appear to lead to thegoal but in fact lead into traps. Our purpose in this work is to warn againstsuch mistaken and misinformed policies by identifying and analyzing thespecific conditions for Russia’s backwardness. Because they are specificallyRussian – rooted in Russia’s geography, notably its vast size and resourceabundance, and its history – we call them “Bear Traps.”Russia is a resource dependent economy, and its addiction to resource
rents is the most important feature of its political economy. We have dealtat length with this issue in our book (Gaddy and Ickes, forthcoming) and ina recent article (see Appendix to this report). Hence, for the purposes of thisreport we will take the problem of resource dependence and addiction as agiven feature of the environment as we examine the Bear Traps that Russiafaces. As we examine the consequences of Russia’s inherited structure onits economic future we must not forget that it is the abundance of resourcerents that makes it possible to preserve these distortions. And that it is theaddictive nature of Russia’s relationship with these rents that provides themechanism for its preservation.Typically the problems of the Russian economy manifest themselves in a
distorted way, via mismeasurement. In Soviet times outside analysts exam-ined data on the economy with great caution, owing to the hurdles presentedby central planning. Although central planning is dead and Russia has amarket economy now, the need for caution remains. There are two primaryreasons for this. First, there are Russia’s specific geographical peculiarities:space and cold.1 Second, there are legacies from the Soviet period that con-tinue to distort our picture. In the Soviet period it was the price systemthat led to a distorted prism, the "circus mirror effect," where distorted rela-tive prices made loss-making manufacturing enterprises seem productive andmade the resource sectors seem like modest contributors to prosperity. TheSoviet price system is history, but the legacy of decisions made in the Sovietperiod continues to have effects. In particular, many of these legacies leadto an overvaluation of assets and consequently to an underestimation of thereturns on those assets. This is not, primarily, a statistical issue; rather it is
1Although Canada is similarly large and cold, unlike Russia, very little of its populationlives and works in the very coldest parts of the country. The impact of size and cold aremuch less in Canada because it has adapted to its situation in a much more rational way.
3
a failure to take into account the legacy of misallocation and inherited struc-ture. This leads both to overestimation of assets and failure to recognize thatlegacies are the real problem. This is the ultimate Bear Trap.The key problem in Russia is the systematic misuse of assets. The returns
to investments in physical and human capital are systematically below (orappear to be below) what they should be. That is, the effective input levelsof capital and labor services are below the measured levels. This leads to amisdiagnosis of Russia’s maladies. By overstating the input levels one con-cludes that the key Russian problems are efficiency, primarily organizational,and perhaps also corruption. We argue, on the contrary, that the input levelsare systematically overstated. If we used the correct levels the picture wouldbe different. We refer to this as the τ -factor. The idea is that if measuredcapital and labor services are L and K, respectively, the actual effective val-ues are τLL and τKK, where τL, τK < 1. Hence these are discount factorsthat ought to be applied to measure the actual factor services used in Rus-sia. Our goal in this report is to explain the causes and magnitudes of thesediscount factors.The first direction of our investigation will thus focus on physical assets,
capital. In chapter 2 we investigate how capital is systematically over-valuedin Russia. Investment represents the sacrifice of current consumption forfuture benefits, but as we will demonstrate Russia receives far less futurebenefit than its sacrifice implies. The primary reason for this is that con-ventional ways to account for capital accumulation do not take into accountfeatures of space and cold. In chapter 3, we then examine how the legacyof the location policies pursed in Soviet times produce this handicap. Theanalysis of chapters 2 and 3 present a dilemma, however. If cold and spaceare such handicaps to growth, why is they not removed by investment poli-cies? That is, why doesn’t a market economy undo the location decisions ofthe Soviet period, and cause the distribution of population to move towardsthe warmer parts of Russia? We try to answer this question in chapter 4where we focus on the implications of federalism in Russia. Our analysisshows that federalism "Russia style" leads to an immobilization of factors.There is, in fact, a political imperative to "keep the lights on" – that is, tokeep factories running and people in place to man them – in what oughtto become the ghost regions of Russia. We then turn to an analysis of theother important factor for growth, human capital, in chapter 5. The problemof Russia’s demography and its health crisis are well-known. The importantquestion, however, is how important are these issues to Russia’s economic

4 CHAPTER 1 INTRODUCTION
future. We argue in chapter 5 that the emphasis on these problems missesthe key point. As with physical capital, human capital is mismeasured inRussia. There is a τ -factor regarding labor as well, and failure to recognizethis can lead to another Bear Trap, another barrier to long-term Russiangrowth. The real goal of Russian policy should be to eliminate the impact ofthe τ -factor (to bring τ closer to unity).Bear Traps thus arise because of the failure to recognize the implications
of the τ -factor. It is important to emphasize that τ is not a measure of igno-rance. It is the result of a systematic overvaluation of assets. The τ -factoris not unique to Russia. But owing to the peculiarities of Russia’s climate,location, and history, its impact is greater there than in other countries. Therisk of misdiagnosis of Russia’s maladies is correspondingly greater. The mis-diagnosis leads to faulty policies which invariably waste resources and in theworst case may even make the real problems worse. A prime example is theattention given to corruption as a main cause of Russia’s inefficiency. Over-valuation of assets makes total factor productivity (TFP) in Russia appearvery low. This is just a feature of arithmetic. But the interpretation of lowTFP is that corruption and general inefficiency are the prime culprits. Thisis not to argue that corruption is not an important problem in Russia, butwhile the emphasis stays on corruption and general inefficiency the impactof the legacies is ignored. And this leads to Bear Traps.Not all of the special factors associated with Russia’s legacy are im-
mutable. Much is self-induced. Physical geography cannot be changed, buteconomic geography can be. Where you choose to locate economic activityis endogenous. Calls for modernization and diversification ignore the ben-efits of Russia’s geography and fail to recognize how the τ -factor is goingto make diversification truly difficult. In our concluding section, we arguethat Russia should take advantage of its resources (whose location is partof its physical geography) but minimize the negative effects of geography bymoving non-resource industries into regions that are warmer and closer tomarkets.2
2Nothing illustrates the problem better than this story ("Vekselberg to Revive SovietOil Plant to Save Town") from Bloomberg, May 26, 21010. "Russian billionaire ViktorVekselberg plans to renovate a moneylosing, Soviet-era synthetic oil plant as PresidentDmitry Medvedev demands the rich invest in towns left impoverished by dying industries."The largest oil producer in the world will make synthetic oil to save a dying one-plant town.According to a spokesman for Vekselberg: "While the Zavod Slantsy plant is the only hopefor the town’s economy, the potential for ‘innovation and efficiency’ sparked Vekselberg’s

5
interest .... [Vekselberg] aims to upgrade the plant and produce synthetic fuel that cancompete with petroleum...."


Chapter 2
Investment and PhysicalCapital
2.1 Introduction
Properly conceived, investment is the essence of the process of creating amarket economy. Transition is typically thought of as re-writing the rules,and progress in transition is measured by what is still missing among the rules— and now institutions as well. But the big problem for Russia is not whatis missing, but rather what is there — as a result of 70 years of misallocation.The real task of transition is to unmake and rebuild that old economy, i.e.,investment. All else is prelude.Analysis of investment decisions can be broken down into two compo-
nents: the gap between the desired and actual capital stock, and the optimalpath in closing this gap. Much of the analysis of investment in Russia im-plicitly focuses on the latter problem, given the emphasis on corporate gover-nance and corruption as determinants. In the case of Russia, however, thereare important misperceptions with regard to both the actual and desired cap-ital stocks, and without understanding this a complete understanding of theproblem of investment is unobtainable. In particular the actual capital stockin Russia is over-stated due to a failure to write down to market, and thedesired capital stock is underestimated because of an unwillingness to recog-nize the distance to the market (the competitiveness of Russian capital). Inthis paper we examine the forces that lay behind these two tendencies.The ironic situation of the Russian economy is that changing the rules,
7

8 CHAPTER 2 INVESTMENT AND PHYSICAL CAPITAL
and even the institutions, of the economy will not make many of these assetsprofitable to use in a market economy. Yet, as we will see agents still preferto keep them in operation. This represents an important puzzle about theRussian economy that we address in this chapter. Moreover, it is the contin-ued operation of many of these enterprises that makes the price of investmentgoods in Russia extraordinarily high when measured at international prices.This means that the increment to productive capacity that Russia gets for itsinvestment effort is low compared with other comparable countries, includingtransition economies.1
Why is the investment problem under-estimated? One reason is that theinherited capital stock from Soviet times was so large. Since the Sovietsover-invested for 70 years, one might logically ask, how could underinvest-ment be the problem now? Under-investment could, in fact, be a healthyphenomenon. But this misses a fundamental point. The Soviet Union didnot just over-invest; it mis-invested. It built and installed the wrong kinds ofcapital, and it located this capital in the wrong places. As a result, the actualand market value of the inherited capital stock is low. The depreciation ofthe capital stock caused by liberalization and the transition to the marketeconomy is, in fact, disinvestment.2 Hence, the market value of the capitalstock at the start of transition was far below its notional value.Yet when people speak of investment needs, they most often refer to what
it would take to make existing physical configurations viable.3 This is notat all the correct way to view the issue, because it takes Soviet investmentdecisions as the correct base to build on. Yet it is a characteristic way of
1The fact that investment rates measured at world prices is correlated with levels andgrowth rates of output across countries is a robust result in development economics ([8],[15]). The critical question is whether this is due to distortions that raise the prices ofinvestment goods, or the relative efficiency of the production of consumption goods as inpoorer countries. We argue below that in the case of Russia it is primarily problems onthe investment side that dominate.
2What is the market value of the capital stock? It is that capital stock’s contribution tothe expected discounted value of future profits. The historical value of the capital stock,in contrast, is the sum of past investment, less depreciation. Given the regime changeimplied by transition, the probability that the market value would be within an order ofmagnitude of the historical value, let alone the same, must be very close to zero. Even inmarket economies the two quantities don’t coincide, but on average they would be close.The problem in Russia is the systematic bias: that the market value is systematicallylower than the historical value, and that the difference is at least an order of magnitude.
3That is, these analysts assume that the capital stock itself is fine but the problem iswith institutions and organization.

2.2 IS INVESTMENT A PROBLEM IN RUSSIA? 9
viewing the problem, and we will focus on this.
2.2 Is Investment a Problem in Russia?
How important a problem is the investment rate in Russia? The Soviet pe-riod demonstrated that very high investment rates were no guarantee againststagnant, and even decreasing growth rates. This has led many observers tode-emphasize the role of investment rates, and to focus instead on organiza-tional improvements and other elements of economic reform as crucial. Theimplicit assumption is that inherited inefficiency takes the form of productionwell within efficiency frontiers, and that privatization and other institutionalreforms can lead to rapid improvements in productivity growth. A clearexample of this view was offered by Palmeda and Lewis:4
There are no natural or economic obstacles to high economicgrowth in Russia, and the current situation need not be toler-ated. Russia can rely on a skilled and inexpensive labor force,large and economically attractive energy reserves, and surpris-ingly, much spare capacity in potentially productive industrialassets. Explicit and targeted social policies combined with bal-anced and enforceable regulations (mostly at the sector level, in-volving taxes, energy, land and red tape) would remove the mostimportant market distortions. The payoff would be strong eco-nomic growth in Russia (Palmeda and Lewis, 2001: 49).
While organizational improvements are clearly important, this view ignoresthe fact that the capital stock Russia inherited from the Soviet period — itsinstalled capital — is highly inefficient and may not be competitive even withfrontier management. This is partly the result of investment decisions withenergy and other inputs that were priced too low, and without regard to thecosts of the cold and location. Moreover, the enterprises that produce inef-ficient producer goods present a continued handicap for the growth process,as outlined below.
4Although Palmeda and Lewis focus primarily on industry impediments due to lackof competition, rather than macro institutional issues such as corruption, lack of labormobility, or corporate governance.

10 CHAPTER 2 INVESTMENT AND PHYSICAL CAPITAL
2.2.1 New versus Installed Capital
Especially in transition, it is crucial to distinguish the returns from installedand new capital. Installed capital is critical because inherited capital stocksfrom the Soviet period are so inefficient. Returns to new investment can behigh, however, precisely because they can be appropriate to new economiccircumstances.The problem is how to encourage new investment that does not just
replenish depreciated capital stuck in the wrong places. This is difficult dueto the need of relational capital.
2.3 Growth Models and Russian Growth
Recent literature on the sources of economic growth underscores the im-portance of investment. In their benchmark study, Ross Levine and DavidRenelt (1992) concluded that despite the dozens of policy or institutionalvariables that have been hypothesized to account for growth, the only trulyrobust correlation they found was that between growth and investment shareof GDP. Their work spurred a number of subsequent efforts to analyze theprospects for long-term growth, including in transition countries. Such analy-ses typically proceed from some form of the Levine-Renelt growth equation(see [11]): by = α+ β1y0 + β2n+ β3 sec+β4i (2.1)
where by is the growth of per-capita GDP over some period, y0 is initialper-capita GDP, n is population growth over the same period, sec is thesecondary school enrollment rate (measured in the beginning period), and iis the investment share of GDP.5 This type of specification focuses on therole of catch-up in the growth process. Economies can expect rapid growthwhen there is a lot of catching up to do. The key policy variable, however, isthe investment rate. Estimation of such equations for samples of transitioneconomies shows that the role of investment is critical for growth projections(see, for example, [1]). This is especially true when one considers policy andinstitutional variables. Some fixed effect variables might affect growth but
5In almost all of the cross-country literature by is measured at international prices whilei is measured at domestic prices. See [11] for example. The literature does not seem tomake notice of this. We discuss the implications of this below.

2.3 GROWTH MODELS AND RUSSIAN GROWTH 11
Russian cannot change its climate.6
Sutela, [18, 216-7], for example, explores the prospects for Russian eco-nomic growth under three different scenarios for investment: a basic scenariowhich employs the historical average investment rate of 21%, an optimisticscenario which uses 30%, and a pessimistic scenario which uses a rate of 15%.Using a model like (2.1) Sutela shows that the long-run growth rate morethan doubles going from the pessimistic to the optimistic scenario.7 Theforecasts for by are given in table 2.1:
Investment Rate Per-Capita GDP Growth (by)Pessimistic Scenario 15% 2.0%
Baseline 21% 3.0%
Optimistic 30% 4.7%
Table 2.1: Forecasts for GDP Growth Using the Levine-Renelt Equa-tion
The critical lesson of these and similar exercises — based on the initialstudies by Fischer and Sahay (2000) — is that investment is crucial for growthin transition economies. It then becomes important to ask whether Russiacan produce the type of investment needed to meet Putin’s goals for growth.This exercise is further pursued by Crafts and Kaiser (2002). Two impor-
tant adjustments are made; first, they use additional explanatory variablessuch as the rule of law to tighten the forecasts. Second, they adjust theinitial income variable to measure the gap from the frontier at the start oftransition, not earlier.These exercises are baselines for projections in transition economies. The
key result of all these exercises, as the table shows, is that investment is thekey variable for growth. A ten percent increase in the rate of investmentleads to a 1.75% increase in the growth rate of GDP per-capita. Clearly,
6Though as we discuss in chapter 3 it could change the location of its industry andpopulation.
7The forecasting model used by Sutela is the Levine-Renelt equation. In our notationit is: by = −0.83− .35 ∗ y0 − .38 ∗ n+ 3.17 ∗ sec+17.5 ∗ i

12 CHAPTER 2 INVESTMENT AND PHYSICAL CAPITAL
these results imply that meeting the Putinesque goals of doubling RussianGDP, will require a very high rate of investment.
2.4 How High Is Investment in Russia?
During the Soviet period investment rates were very high. The Soviet growthmodel was extensive, and investment rates exceeded 30% (See [8, 1786 ] foranalysis). Much of this investment was wasted, however, due to the knowninefficiencies of the Soviet model. Hence, when transition started there wasneed for investment to modernize the capital stock even as old capital had tobe (or should have been) written off. To what extent did Russia invest in thepost-Soviet era and how does this compare to other fast-growing economies.We can summarize our findings in terms of three comparisons. First, the
Russian investment rate is less than those observed in fast growing ("miracle"economies). Second, Russian investment is less than the levels observed inEU accession countries. Third, Russian investment levels are only in themiddle of the pack of CIS countries.
2.4.1 Traditional Comparisons
Measured in the traditional manner – ratio of investment to GDP – Rus-sia’s investment rate is not that high by international standards. Figure 2.1shows that the investment rate in Russia falls far below historical and currentrates in Japan, China, South Korea, and the Czech Republic. Note that Ko-rea’s growth takeoff occurred when its investment rate rose above 25%, withso-called miracle periods occurring when the rate is even higher. Russia, incontrast, saw its investment rate drop to below 20% by the mid-1990s, downto under 15% in the post-crisis year of 1999.In figure 2.1 we note that the investment rate of Russia is below that of
Japan, China, Korea, and the Czech Republic. Notice that the takeoff inKorean growth occurs when the investment rate rises above 25%, and thatthe miracle periods occur when the investment rate is even higher. Russianinvestment declined from the beginning of transition until 1999. Since then ithas recovered — this is the sharp recovery in investment, and the rapid growthyear to year that is talked about quite often. Nonetheless it is apparent thatthis is still significantly lower than other comparable economies.The fact that investment rates in Russia are lower now than in the early

2.4 HOW HIGH IS INVESTMENT IN RUSSIA? 13
Investment/GDP Ratio %
EU Accession
Slovakia 28.9
Czech Republic 29.1
Hungary 25.8
Estonia 30.2
Slovenia 25.5
Poland 21.4
Lithuania 22.0
Latvia 24.7
Romania 21.4
Bulgaria 18.2
Ex Soviet Union
Azerbaijan 34.1
Belarus 25.4
Ukraine 21.5
Tajikistan 16.5
Uzbekistan 22.1
Russia 20.3
Kyrgyzia 17.7
Armenia 21.3
Kazakhstan 22.2
Georgia 25.2Averrages of observations from 1995-2005
Table 2.2: Investment Rates in TransitionEconomies

14 CHAPTER 2 INVESTMENT AND PHYSICAL CAPITAL
10
15
20
25
30
35
40
45
1970 1975 1980 1985 1990 1995 2000 2005
CHINAJAPAN
KOREARUSSIA
Per
cent
of G
DP
Figure 2.1: Gross Capital Formation for Selected Economies, Domestic Prices
1990’s (let alone the Soviet period) may be less important if there has beena significant increase in the efficiency of investment. After all, one goal ofeconomic reform has been to improve the nature of the investment process.Whether efficiency has actually risen is an important question that we discussbelow. It is important to note, however, that the investment rate is also lowcompared not only with fast growing economies but in comparison to slowergrowing ones too — Czech Republic, Japan in the 1990’s.The obvious, but important, conclusion is that if Russia did not have oil
this investment rate would lead to much slower growth. Russia’s GDP leveland its growth rate are enhanced by its resource abundance.
2.4.2 PPP Comparisons
In the previous section we analyzed Russian investment rates measured atdomestic prices. Development economists have increasingly turned their fo-cus, however, to measuring investment at international prices. Using inter-national prices allows one to measure the true value of the physical capitalobtained as a result of the investment effort. If a country’s relative priceof investment is high this means that the country gets less increase in cap-

2.4 HOW HIGH IS INVESTMENT IN RUSSIA? 15
ital stock per unit of savings than in a country with a lower relative price.8 This is because in many developing economies investment is the focus ofmany policy distortions. The relative price of investment when measured atinternational prices is higher in poor countries than in rich countries.9 Thismeans that when we measure investment rates at international prices richercountries tend to invest a higher share of GDP than poor countries.10 In thissection, we examine the relative price of investment in transition economies.For transition economies there is an extra complication. Under the Soviet
system the relative price of investment was low due to planners’ preferences.Consumption was a residual priority. Hence, liberalization of prices causes ashock to the relative price of investment, pushing it up in the early stages oftransition.11 In the ensuing period, however, the relative price of investmentdeclines. Figure 2.2 shows this decline in Hungary and Poland. In Poland thedecrease in the relative price of investment was more immediate — a reflectionof the quicker pace of price liberalization in general. In both cases, however,the relative price of investment is significantly lower in the second half ofthe 1990’s than in the first half. Hence, transition led to an effectively lowerrelative price of investment in Hungary and Poland.In Russia price liberalization also led to a shock to the relative price of
investment. Subsequently, however, the relative price of investment has beenincreasing, significantly. Indeed, the distortion in relative prices (which couldbe measured as the difference from unity) has more than doubled duringtransition. A similar tale can be told for Ukraine.
8De Long and Summers [2, 396] stress the distinction "between investment effort — shareof national product saved, plus capital inflows — and investment — buildings constructedand machines put into productive use. Many of the policies that have been followed inthe post-WWII period, especially in the developing world, seem designed to maximize’investment effort,’ while ensuring that each unit of ’investment effort’ translates into aslittle actual investment as possible."Like so many other aspect of economic policy, what was merely a disease in developing
countries was a pathology in the socialist world.9In principle, the concept of high and low is relative to an international benchmark.
In practice, the Penn World Tables uses the US as a benchmark. So if the relative priceis greater than unity it means that the cost of increasing capital (in terms of foregonedomestic consumption) is higher than in the US.10This was first noted by [17, 339].11This has been intensively analyzed by Richard Ericson (1999). Essentially, costs of
investment were shifted, under Soviet pricing rules, onto consumption. This was an implicittax on consumption to finance investment. When price liberalization occurs, investmentgoods must cover their costs, so their relative price rises.

16 CHAPTER 2 INVESTMENT AND PHYSICAL CAPITAL
0.8
0.9
1.0
1.1
1.2
1.3
1.4
1.5
86 88 90 92 94 96 98 00 02 04 06
HUNGARY POLAND
Rel
ativ
e P
rice
of In
vest
men
t
Figure 2.2: The Relative Price of Investment in Hungary and Poland: TheImpact of Liberalization and Transition

2.4 HOW HIGH IS INVESTMENT IN RUSSIA? 17
0.4
0.8
1.2
1.6
2.0
2.4
1992 1994 1996 1998 2000 2002 2004 2006
China 1China 2Czech RepublicHungaryPolandRomania
RussiaSingaporeSlovakiaSloveniaUkraine
Rel
ativ
e P
rice
of In
vest
men
t
Figure 2.3: The Relative Price of Investment in Transition Economies
18 CHAPTER 2 INVESTMENT AND PHYSICAL CAPITAL
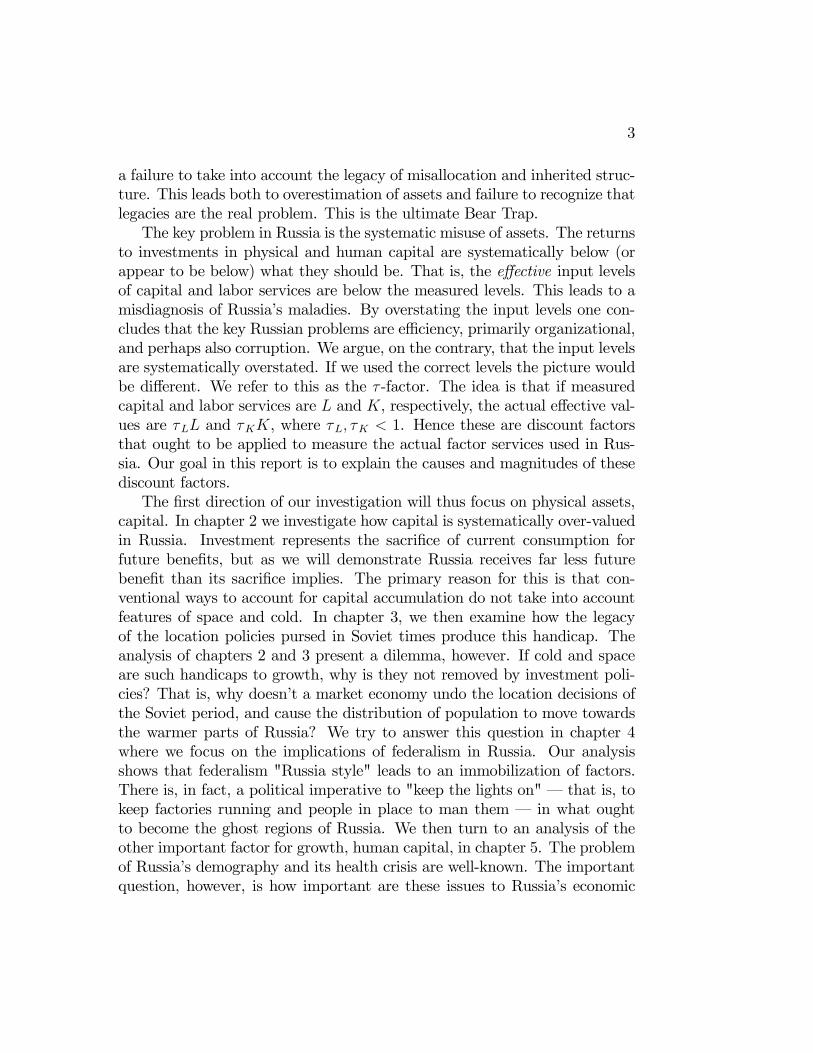
Measured at international prices the relative price of investment is high intransition economies in general, and in Russia in particular (see figure 2.3).Notice that the dispersion in relative prices has increased over the period,the coefficient of variation increasing from .188 in 1991 to .304 in 2000.12
This is somewhat surprising. One might expect that market reforms wouldcause the relative price of investment to converge. At least this would be soif all differences in relative prices were due to planning distortions. These areimportant, but they are not the only ones. For example, governments mayengage in policies that distort prices. That seems to be what is taking placein Russia and Ukraine in figure 2.3.Compare the same countries as in figure 2.4 above:
0
10
20
30
40
50
60
1970 1975 1980 1985 1990 1995 2000 2005
China 1China 2
JapanKorea
Russia
Per
cent
of G
DP
Figure 2.4: Gross Capital Formation at International Prices
Given the high relative price of investment in Russia (and Ukraine) itfollows that investment rates are lower when measured at international prices(figure 2.5). The adjustment is quite dramatic for Russia. Recall from table1 that Russia invested, on average, about 20% of GDP at domestic prices.At international prices, however, the investment rate falls below 10% after
12Notice that much of this divergence is caused by Russia and Ukraine.

2.4 HOW HIGH IS INVESTMENT IN RUSSIA? 19
0
10
20
30
40
50
60
1992 1994 1996 1998 2000 2002 2004 2006
China 1China 2Czech RepublicHungaryPoland
RussiaSlovakiaSloveniaUkraine
Per
cent
of G
DP
Figure 2.5: Investment Rates at International Prices
1998. Adjustment for international prices reduces investment rates for allof the economies displayed in figure 2.5, but the adjustment is highest forRussia and Ukraine. Moreover, the gap increased during the second half ofthe 1990’s.
The impact of a high relative price of investment on growth is straightfor-ward. It means that for any level of savings, the addition to the capital stockis lower. Hence, when we compare the relative price of investment to growthperformance it is not surprising that we find a strong negative relationshipfor transition economies, as in figure 2.6. Notice that Russia is a bit of anoutlier because of its energy abundance. It is less reliant, in a period of highand rising oil prices, on investment. The negative impact of the relative priceof investment is quite apparent.

20 CHAPTER 2 INVESTMENT AND PHYSICAL CAPITAL
0.6 1.1 1.6 2.1 2.6 3.1 3.6Average Relative Price of Investment
0.8
1.0
1.2
1.4
GD
P G
row
th 20
00/1
995
Czech
Hungary
Poland
Romania
Singapore
Slovak
Slovenia
Ukraine
RussiaChina
Azerbaijan
Armenia
Belarus
Bulgaria
Estonia
Georgia
Kazakhstan
KirgiziaLithuania
Latvia
Tajikistan
Relative Price of Investment and GDP Growth (1995 -- 2000)
Figure 2.6: Relative Price of Investment and GDP Growth

2.4 HOW HIGH IS INVESTMENT IN RUSSIA? 21
2.4.3 Growth Equations Revisited
If measuring investment at international prices confers such a different pic-ture it begs the question how are projections of growth affected? To answerthis we return to the Levine-Renelt equations, but use investment at interna-tional prices. We estimate the equation using data from 1960-89 to maintaincomparability with Levine-Renelt, though we can extend the data period(and do below). In figure 2.3 we present the Levine-Renelt equation and ouralternative, the main difference being that we use investment shares at inter-national prices. Our education variable is also different from Levine-Renelt.We use the share of the population aged 15 and over (as of 1960) that hasattained at least the level of secondary school (BLSECA).13 The data is fromBarro-Lee. We also include a squared-term for educational attainment to ac-count for the non-linear impact of education levels on growth.14 From figure2.3 it is evident that this term is negative and significant.
It should not be surprising that the two equations in figure 2.3 are sosimilar. The key difference, of course, is that the coefficient on investment islower in our preferred alternative. By using the PPP measure of investmentshares we are gauging the impact of actual investment, rather than invest-ment effort as in the Levine-Renelt equation. This suggests that some ofthe
The good news is that Russia has oil so it does not need to invest 55%of GDP in order to grow at satisfactory rates. But this also points outhow misguided is the idea that Russia should diversify out of oil. There aretwo reasons for this. First, and most obvious, oil is the primary generatorof Russian growth. Second, the abundance of oil has raised the relativeprice of investment compared with countries without oil. The implicationsof this second point are critical. Because of Russia’s high relative price ofinvestment, diversification into manufacturing is likely to result in much lessgrowth than would be the case in a less resource abundant economy.
13Recall Levine-Renelt use the level of secondary school enrollment. We use instead anattainment measure: the pct of the total population aged 15 and over that has attainedsome level of secondary education or higher. (In the Barro-Lee education data, appendixA2, it is the sum of "second level, total" and "post-secondary level, total.")14The variable BLSECA is the share of the population aged 15 and over (as of 1960)
that has attained at least the level of secondary school. The data is from Barro-Lee.

22 CHAPTER 2 INVESTMENT AND PHYSICAL CAPITAL
Variable Levine-Renelt Gaddy-Ickes
constant−0.83
(0.97)
0.87
(1.20)
Y60−0.35
(2.50)
-0.27
(3.85)
DPOP−0.38
(1.73)
−0.41
(1.97)
SEC3.17
(2.46)
BLSECA7.83
(2.65)
BLSECASQ−8.05
(1.99)
Investment17.5
(6.53)
12.52
(6.13)
R2 .46 .48
n 101 91t-statistics in parentheses, White corrected standard errors
Table 2.3: Growth Equations Compared

2.5WHY IS THERELATIVEPRICEOF INVESTMENT SOHIGH INRUSSIA?23
2.5 Why is the Relative Price of Investmentso High in Russia?
This is really a manifestation of the Soviet inheritance in all its forms: alegacy of state-owned enterprises, location, and most importantly resourceaddiction.One aspect of this is government ownership. Schmitz (2001)studies the
impact of government production of investment goods in Egypt and Turkey.He shows that the impact on aggregate productivity of government produc-tion of investment can be quite large. Assuming that state-owned capitalgoods producers are 50% as productive as private-owned producers (the re-sult based on case studies in these countries) he shows that aggregate pro-ductivity is only 64% of its potential level. Of course in the case of Russia allinvestment goods producers were 100% state owned prior to privatization,and little restructuring seems to have taken place in many of these enterprises(see, for example, [14]).
Hungary Poland Russia Singapore USACzech
RepublicUkraine
Construction 1.24 1.23 1.86 1.68 1.15 1.17 2.28
Machinery and
Equipment2.06 1.94 2.74 0.65 0.95 2.52 5.33
Stocks 1.68 2.03 2.31 1.43 1.06 2.05 3.13
Capital Formation 1.55 1.54 2.12 0.89 1.05 1.72 2.95Source: Penn World Tables and author calculations
Table 2.4: Investment Price Ratios by Type
A common cross-country observation is that the relative price of invest-ment goods is higher in poorer countries. Hsieh and Klenow ([8]) show thatthis is because of higher relative productivity in consumer goods industriesin poorer countries. This seems also to be the case in Russia, although, per-haps for different reasons. In the Soviet period consumer goods industrieswere low prestige and underinvested in. In the post-Soviet period they havereceived the overwhelming bulk of non-oil FDI. This presumably promotes

24 CHAPTER 2 INVESTMENT AND PHYSICAL CAPITAL
productivity growth in consumption goods industries. The relative low po-litical weight of consumer goods industries probably also means that thesesectors found it harder to resist entry.In figure 2.4 we present calculations of the relative price of investment
(specifically, the price of investment goods relative to consumption goods,PIPC), for capital formation as a whole and by type of investment. The high
relative price of investment for Russia stands out (2.12 compared to 1.05 inthe US). Even in other transition countries, it is lower, aside from Ukraine.What is even more important, however, is the very high relative price formachinery and equipment. For as we discuss (in section 2.7) below, machin-ery and equipment are the most important component of capital formationfor enhancing productivity growth.The legacy of the Soviet period was low productivity assets. According
to one estimate, these were 30% as productive as US assets in 1992 [14, 48].Many dinosaur enterprises managed to survive the upheaval at the end ofthe Soviet period; they did not go extinct. The Soviet legacy in relation tocapital was one of hypertrophied machine building and defense enterprises.There was a dual use imperative in the Soviet economy (Gaddy 1996) thatlowered productivity.These problems should become less important through the passage of
time. As capital depreciates new enterprises built in the market economyshould replace dinosaur enterprises. Russia’s problem — its potential beartrap — is that rent addiction serves to sustain the dinosaurs.15
In a way Russia shares this problem with any country with a history ofinward-oriented development. De Long and Summers [2, 399] point out thatin
"India, like in Argentina, the savings is relatively high but equip-ment is expensive...India demonstrates not that boosting invest-ment is unproductive, but that policies that boost saving whilesimultaneously raising the relative price of investment in equip-ment and structures are unproductive. We suspect that restric-tions on imports of capital goods have ensured that the Indiangovernment’s attempts to support investment have had effects
15The transition to a market economy should have been a cataclysmic event for dinosaurenterprises, just as the K-T event at the end of the Cretaceous Period was fatal for thedinosaurs. Dinosaur enterprises, however, were able to survive by using their relationalcapital to obtain rents. See Ickes (2003).

2.6 QUANTITY OF CAPITAL 25
not on quantities but on prices: India’s policies have managed toenrich industrialists instead of encouraging industry."
But in Russia inward-oriented development was taken to an extreme notwitnessed anywhere else. For the Russian case, the contrast is perhaps thatattempts to support investment have insured the survival of dinosaurs at theexpense of encouraging industry.16
2.6 Quantity of Capital
Even if the relative price of investment is correctly measured investmentfigures may still be inflated due to the standard, but peculiar, method ofmeasuring investment. The standard in national income accounting is toinclude as investment the cost of adjusting to climate and distance. Thus,extra insulation required for a heating plant in Novosibirsk is counted as extracapital. It is important to note that the impact of cold may in fact overstateinvestment in Russia. In calculating investment, the PWT explicitly excludesan adjustment for the extra cost of investing in cold climates.17 A power plant
16Ironically, support for the dinosaurs often comes from the incomes of the oligarchs.One might be tempted to say that in this case rather than enriching them, such policiestax them. Of course, however, the oligarchs participate in these policies precisely becausethis allows them to indeed "enrich themselves" by exploiting the assets that they obtained.See [1].17Kravis, Heston and Summers explicitly discuss this question and explain why they
cannot correct for it: "Suppose that in a cold climate a stream power plant had to bebuilt with insulating walls around its boiler room and switchhouse, whereas in a warmclimate both can be exposed to the weather. Assuming that all other characteristics areidentical, should the inputs and costs required for closed construction in the cold climatebe regarded simply as added costs, or as more output?One line of reasoning in response to such questions is to regard the future flow of services
that each capital good would produce in each country as the basis for evaluating the relativeamounts of investment. This implies that an international comparison should be made ofthe present value of the increases in output – ultimately in the form of consumption goods– that new capital goods would contribute in each economy. In the real world, no datedlist is available of consumer goods that will eventually flow from new investment, but onlythe value of investment an the prices of the capital goods themselves in each country’s owncurrency. Furthermore, knotty problems would arise in isolating the differences in futureflow that could be attributed to the input of capital from the differences attributable toother elements, such as other factor inputs and environment. Therefore, it is too difficultto implement the future-flow-of-services approach [10, 29]."

26 CHAPTER 2 INVESTMENT AND PHYSICAL CAPITAL
built in Siberia requires extra heating and insulation compared with Mexico.That greater cost is included, however, as output, so it shows up as greaterinvestment. If one were to account for this adjustment investment would berelatively even more expensive in Russia, especially as this applies most tostructures and we have seen that the composition of Russian investment isskewed in that direction.
2.6.1 The τ effect.
Capital can be handicapped by location. It may be in extremely remotelocations, cold locations, mountainous regions, and so forth. One way tothink of such "handicapped capital" — capital in abnormal environment — isthat in each period more capital depreciates than would otherwise be thecase. Hence, a greater portion of gross investment is really replacement,though this extra replacement is compensating not for wear and tear or eveneconomic obsolescence, but rather to allow capital to function as it wouldin a normal environment. Failure to account for this depreciation results inovermeasurement of the capital stock.Suppose that we can index by τ the ratio of the true capital stock to the
measured capital stock (τ is thus a mismeasurement index). Now consider thereturn to capital. The actual return to capital is measured capital net of thehandicap. So if the production function is of the customary Cobb-Douglasform, we should write:
Yi = Ai(τK)αi L
1−αi (2.2)
Ignoring τ the marginal product of capital appears as αAiKα−1i L1−αi , but if
τ < 1 (if capital is overmeasured) the actual marginal product of capital isαAiτK
α−1i L1−αi With τ < 1 it is obvious that
αAiKα−1i L1−αi < αAiτK
α−1i L1−αi
In other words, the measured marginal product of capital is in fact smallerthan the actual marginal product of capital. This means that the impact ofinvestment is understated if measured capital is inflated. Alternatively, thedifference in income levels — as in development accounting — overstates theimpact of differences in A, as it understates differences in functioning capitalstocks across countries. This diverts attention from problems with factor

2.6 QUANTITY OF CAPITAL 27
accumulation towards efficiency.18 Ignoring systematic mismeasurement canlead to lack of attention paid to differences in capital stocks.All countries may have instances of inflated capital. Kravis-Heston-
Summers recognize the problem:
"Suppose that in a cold climate a steam power plant had to bebuilt with insulating walls around its boiler room and switch-house, whereas in a warm climate both can be exposed to theweather. Assuming that all other characteristics are identical,should the inputs and costs required for closed construction inthe cold climate be regarded simply as added costs, or as moreoutput?"
They are correct to argue that it should be added cost, but as a practicalmatter they ignore this, and opt to treat it as more output. They recognizethat this means:
"The cost of a flat road of a given specification in one countrywas compared with the cost of a road of the same specification inanother country, and likewise for a mountainous road. The effect,of course, was to treat the mountainous road as more output thana flat road; in a sense, an adverse environment in this instancerequired more production, just as low temperatures necessitatedthe provision of heat and warm clothing. Similarly, insulatingwalls for power plants in cold climates were regarded as part ofoutput rather than mere addition to cost." (Kravis, et al., 1982:28-9).
But for some countries — Russia, in particular, the problem may be sys-tematic.For Russia, in particular, problems of cold and size it is likely to have
more of these handicaps. The impact is systematic, not random in the caseof Russia. So ignoring τ < 1 is likely to be much more problematic in thecase of Russia than in almost any other country in the world.
18Caselli notes, "the consensus view in development accounting is that Efficiency playsa very large role. A sentence commonly used to summarize the existing literature soundssomething like “differences in efficiency account for at least 50% of differences in per capitaincome. (p. 2)”

28 CHAPTER 2 INVESTMENT AND PHYSICAL CAPITAL
This has important implications for thinking about Russia’s relative in-ability to attract foreign direct investment FDI). Conventional wisdom is thatbarriers, restrictions and taxes on investment are the chief culprit preventingcapital flows to developing economies. So, the argument goes, if these restric-tions are removed FDI will flow to Russia. But if τ < 1 rates of return maybe insufficient to attract investment even if "the chief culprit" is eliminated.Because if τ < 1 is due to geographic burdens as in Russia, then removingthe "chief culprits" will not solve the problem. Institutional reforms will notmake Russia more compact or warmer.All countries (except Singapore where τ = 1 — the country is a city,
after all) have a τ < 1. But the handicaps that any country faces can bedecomposed into a self-imposed part and a fixed effect. The latter is dueto irreducible features of the environment optimally adapted to. The formerrefers to the extra costs imposed due to misallocation.The Kravis-Heston-Summers approach is to consider τ < 1 as present but
measurement error. Their implicit assumption is that differences in τ acrosscountries are not systematic. Hence, they can be ignored in comparativeanalysis. This may be true in general, but if one were to take their discussionseriously, one would realize that some countries, notably Russia, would havesystematic errors.
2.7 Machinery and Equipment
DeLong and Summers (1993) argued that machinery and equipment is themost important component of capital accumulation in explaining produc-tivity growth.19 The idea is that ideas may be embodied in capital goods,and it is machinery and equipment where this embodiment takes place. Em-ploying modern machinery and equipment requires skills that are importantfor growth. Moreover, as it is equipment investment that is associated withgrowth, not structures, it is much more likely that the former causes thelatter than an instance of reverse causation.20 They were also able to show
19This idea is also consistent with the ideas of Paul Romer. And Mokyr has referred totechnology embodied in machinery as the "lever of riches." (Mokyr 1990).20That is, if growth caused equipment investment then we would expect to see the same
association with investment in structures. Higher growth would cause demand for bothmore machinery and more structures to house them. But given that the association isbetween equipment investment and growth it is much more likely that the former causes

2.8 CONSEQUENCES OF HIGH RELATIVE PRICE 29
that the effect applies to developing countries: it is not just a rich countryeffect.
The argument that machinery and equipment is the essential feature ofcapital accumulation is even more important when we think about Russia.Lots of capital accumulation in Russia goes towards coping with location andsize; for example, transportation investment and insulation. Neither bringsnew ideas or increases total factor productivity. In Russia a large portionof transportation should really count like insulation in Siberia. Capital for-mation in Russia consists to a much greater extent than in the US, say, ofconstruction as opposed to producer durables. Moreover, construction is thetype of capital formation that lends itself most to corruption in all coun-tries.21 Of course, corruption is high in all the post-Soviet countries.
Given that the relative price of machinery and equipment investment ishigh in Russia it is not surprising that the share of capital accumulation thattakes this form is comparatively low (table 2.5). Whereas in the US about50% of capital accumulation goes to machinery and equipment, in Russia itis less than a quarter.
2.8 Consequences of High Relative Price
The consequences of the high relative price of investment in Russia are sev-eral. First, it means that growth is lower than would be expected given Rus-sia’s savings rate. Russia obtains less return that would be expected fromits sacrifice due to the "tax" it pays on investment. This effect is masked, toa large degree, by Russia’s resource abundance which fuels growth indepen-dently.
Second, the high relative price of investment, and consequently the lowerlevel of actual investment (as opposed to investment effort) means that thegoal of diversifying the Russian economy out of oil and raw materials is moredistant than thought.
the latter.21One might argue that construction is such a high portion of Russian investment pre-
cisely because it is so susceptible to theft. Another important factor, however, is theimpact of cold. Construction is more expensive in cold climates. See chapter 3.

30 CHAPTER 2 INVESTMENT AND PHYSICAL CAPITAL
Share of
Construction
Share of Producer
Durables
Share of changes
in stocks
Belarus .82 .13 .60
Brazil .69 .31 0
Czech Republic .57 .36 .06
Germany .54 .44 .03
Hungary .53 .28 .19
Romania .59 .34 .07
Russia .62 .22 .15
Singapore .25 .77 −.02
Slovakia .66 .30 .03
Ukraine .73 .20 .08
United States .48 .50 .02Source: Penn World Tables
Table 2.5: Components of Domestic Capital Forma-tion

2.9 CONCLUSION 31
2.9 Conclusion
We used PPP investment rates to get the 55% estimate. But this is notthe end of the story because the PPP measures still overvalue investmentin Russia. This is because space and cold issues are not taken into accountin Summers-Heston data — for fundamental reasons. Russia gets even lessper unit of effort than other countries would. So the amount of sacrificedconsumption Russia would require to grow at acceptable rates without oil isimmense.In the next chapter we examine aspects of location in detail. Now we
briefly consider the implications of space and cold on the measure of invest-ment in national accounting statistics.We have quoted from Kravis et al (2002) to describe how investment
is counted in national accounting statistics. There are two dimensions ofthis problem to consider. First, since Russia is colder on average, it spendsmore investment effort on insulation and other geographic hurdles than othercountries. So comparatively its relative price of capital is even higher thanmeasured. Second, Russia has located too much economic activity in placesthat have geographic handicaps, so this reinforces the problem. The firstproblem cannot be overcome — so mismeasurement relative to other coun-tries is inevitable, the second could be addressed by overturning legacies ofpast location decisions. That is, if the second problem were addressed theconsequences of the first problem would be less severe.The analysis clearly implies that Russia gets credit for investment that
shouldn’t be counted. Statistically, it gets rewarded rather than penalizedfor bad location decisions. To achieve the same flow of capital services aplant in Novosibirsk requires more investment than one in Moscow. But thisextra investment is compensation for cold and distance — it adds nothing toproductivity. Hence, poor location decisions make Russia’s capital stock looklarger than it really is — it makes τK smaller. But productivity is still low.22
Notice that this problem is not just about the initial investment decision.All further investment to maintain that location is similarly mis-measured.We can’t adjust statistics for this, but this problem is likely to be very sig-nificant.
22This is obviously a bigger problem for invesment in the regions than for investment inMoscow. So it could explain why returns are lower in regions. Some of the extra returnattributed to Moscow location could be due to access to authorities, but the τ -effect impliesthat this factor may be overstated.

32 CHAPTER 2 INVESTMENT AND PHYSICAL CAPITAL
We turn in the next chapter to the hurdles posed by location legacies.
2.9.1 There are two views about investment in Russia.
• The conventional view is that if the financial system is fixed and ifcorporate governance is straightened out that investment will flow tonon-energy sectors of the economy. The idea is that the risk premiumis too high right now to invest in non-energy sectors. With tax reformunderway, and if new reforms are implemented investment will flow.The barrier to this investment currently are these institutional failuresthat reforms will fix.23
• The alternative view is that investment in non-energy sectors is con-strained by low potential. The problem is that the capital-labor bundlesare too inefficient.24 On this theory even if investment in energy is sa-tiated it will not flow to these sectors. Here it is the internal aspectsthat are critical, not the external, institutional, aspects.
We suggested that agents tend to underestimate investment needs forthree systematic reasons.25 We explore them in turn.Note that underestimating investment needs is precisely the result of the
failure to write-down the capital stock to market valuations. So the opera-tive question is why this write down does not occur in the Russian marketeconomy?
23Even those that recognize that much of the capital stock is junk assume that thereis enough so that with proper institutions productivity increases would occur. What thisview ignores this the write-off issue. Alternatively it assumes that because capital hasno market value it can be feely disposed (in the economy-wide sense). This ignores thepolitical struggle to give it value.24Location is an aspect of this as well.25Note this error occurs as well with natural resources — gold, diamonds, plantinum, etc.
Just because the resources are in the ground does not mean that their extraction has valueonce you incorporate the full costs of operating in these regions. All the arguments wemake here with regard to capital apply equally to the resource sector, and the territorieswhere they are located. Notice that these sites were often originally founded on the basisof prison labor — e.g., Norilsk — so the cost of production was clearly shifted on to others.But there is one key difference. Technological advance (or using Canadian methods)
can lower the cost of operating in cold regions, etc., so it may be profitable in the future(which is another reason for keeping it in the ground) whereas the dinosaur plant in Permwill never be profitable, and time will only cause d to increase.

2.9 CONCLUSION 33
Scrapping Problem
What are the policy implications of the two different views of investment?For the conventional view, the main implications are obvious: continue withinstitutional reforms (tax reforms, corporate governance reforms, financialmarket reforms, etc.) For the alternative view, the policy implications aremore complex.26
The real policy problem of the alternative view is what, if anything, canbe done to change the true investment attractiveness of the non-energy sec-tors? Herein lie some dangers. The critical issue is to distinguish betweeninvestments to improve technical efficiency and those to improve allocativeefficiency.27
Put simply: Do you encourage investment to make economic activityin Novosibirsk more productive, or do you channel that investment into aWestern oblast?Consider the analogy of the investment dilemma of a business faced with
a fundamental technological revolution in its industry. The business has in-vested heavily in the old technology over the years. Its activity is thoroughlydependent on that old technology. The company must choose between up-grading the old technology or scrapping the old technology entirely and fullyre-equipping with the new.The two technologies are incompatible. It is an “all-or-nothing” choice.
Nothing of the existing capital stock can be re-employed. It also cannot besold to help finance the new acquisition.
26On the surface, it might seem that at a minimum, it is at least fine to continue withthe same kind of institutional reforms as dictated by the conventional view. True, thoseinstitutional reforms might not solve the problem. But they can’t hurt. But in fact,it’s never enough to say that an action is worth taking simply because it has benefits.Policy-making is a costly endeavor. One must therefore always consider the alternatives.Prioritizing institutional reforms might divert scarce political as well as monetary resourcesaway from more important and urgent tasks. In Russia, bureaucratic competence is ascarce resource.A second reason why one should not automatically assume it’s OK to push ahead blindly
with “good” institutional reforms is that it might sustain false illusions about the outcome.27See Gaddy and Ickes (2002). Technical efficiency refers to obtaining more output from
given inputs. Allocative efficiency is achieving optimal outcomes given available resources;it compares how resources are allocated across activities. They write: “Improvements in[technical] efficiency involve movements from inside the production frontier to the bound-ary of the frontier. However, the gain implied by this may not be sufficient to overcomethe fact that the enterprise produces the wrong thing in the wrong place (p. 49, fn. 10).”

34 CHAPTER 2 INVESTMENT AND PHYSICAL CAPITAL
The first path–upgrading–is cheaper and produces results immediately.But it locks the company into a second-rate path. Now matter how muchthe old technology is upgraded, continuing to depend on it will ultimatelydoom the company to noncompetitiveness.The second approach is very costly up-front. It requires shutting down
operations for a period. New staffing will be required. A few employees canretrain. Most cannot.Russia structurally (in types of industries and in location) is a like a cor-
poration that made the “wrong” technology choice long ago. Because of thepoor governance of that corporation in the past, it ignored all the signalsindicating that the choice was wrong. Rather, over time it concentrated evenmore on the wrong path.28 In the market economy, when market value fallstoo far below the historical value you recognize the mistake, and disinvest— write down the investment - because you have no choice. But in the So-viet system this feedback was not there. There was no force correcting themistakes.The corporation ended up on the verge of collapse. So new management
took over. The new managers correctly recognized that the current disas-trous state of the corporation was fundamentally due to the managementpractices of the past. So they change the governance procedures. These newprocedures will ensure that future business decisions are rational and willalways be efficiency-enhancing.The problem is that as they focus on a real problem–the old system of
management and decision-making in the company–the new managers ignorethe problem of the inherited antiquated technology. They fail to see that theywill never be able to rehabilitate the company unless they can successfullyrid the company of the single biggest mistake caused by the old managementsystem: the commitment to the wrong technology.And so, working hard to introduce correct new management practices,
they work to “improve” the company’s inherited capital stock–the capitalthat is all based on the wrong technology. They do the “right” things in the“right” way . . . with the wrong capital. They are doomed to fail.The question is why would a new owner be unwilling to write down the
28This is also related to the willingness to write down debts. In Japan worthless debtsremain on the books and the debt overhang prevents growth. In the US, after the S&Lcrisis, debts were written off. The lingering effects of the debt overhang were much smallerin the US.So in market economies you recognize mistakes and try something else.

2.9 CONCLUSION 35
value of the assets and restructure? Why do they maintain the old technol-ogy? The key point is that transparently recognizing that the market valueof the enterprise is much lower than what it is believed to be can be disad-vantageous to the parties concerned. We develop this point in more detail inour Chapter 4 on the political economy of federalism. Before that, however,we examine the economics of location.


Bibliography
[1] Crafts, Nicholas, and Kai Kaiser, "Long Term Growth Prospects inTransition Economies: A Reappraisal," LSE, September 2002.
[2] De Long, J. Bradford, and Lawrence H. Summers, "How Strongly toDeveloping Economies Benefit from Equipment Investment?" Journalof Monetary Economics, 32, 3, December 1993: 395-416.
[3] De Long, J. Bradford, and Lawrence H. Summers, "Equipment Invest-ment and Economic Growth," Quarterly Journal of Economics, 106. 2.May 1991: 445-502.
[4] Ericson, Richard, “The Structural Barrier to Transition Hidden in Input-Output Tables of Centrally Planned Economies,” Economic Systems,V.23, #3, September 1999, pp. 199-224.
[5] Fischer, Stanley, and Ratna Sahay, "The Transition After Ten Years,"IMF Working Paper, WP/00/30, February 2000.
[6] Gaddy, Clifford, The Price of the Past. Washington, Brookings Institu-tion Press, 1996.
[7] Gaddy, Clifford, and Barry W. Ickes, Russia’s Virtual Economy. Wash-ington, Brookings, 2002.
[8] Hsieh, Chang-Tai, and Peter J. Klenow 2007. "Relative Prices and Rel-ative Prosperity." American Economic Review, 97(3): 562—585.
[9] Ickes, Barry W., “Evolution and Transition,” in N. Campos and J. Fidr-muc, eds., Political Economy of Transition and Development, Boston,Kluwer, 2003.
37

38 BIBLIOGRAPHY
[10] Kravis, Irving B., Alan Heston, and Robert Summers. World Productand Income. International Comparisons of Real Gross Product. JohnsHopkins. 1982
[11] Levine, Ross, and D Renelt, "A Sensitivity Analysis of Cross-CountryGrowth Regressions," AER, 82, 1992: 942-963.
[12] Mokyr, Joel, The Lever of Riches, New York, Oxford University Press,1990.
[13] Ofer, Gur, "Soviet Economic Growth: 1928-1985," Journal of EconomicLiterature, Vol. 25, No. 4. (Dec., 1987), pp. 1767-1833.
[14] Palmeda, Vincent, and Bill Lewis, "Unlocking Economic Growth in Rus-sia" in Russia’s Economic Future: A Compendium of Papers, Joint Eco-nomic Committee, US Congress, December 2001.
[15] Restuccia, D. and C. Urrutia, "Relative Prices and Investment Rates,"Journal of Monetary Economics 47, February 2001: 93-121
[16] Schmitz, J., “Government Production of Investment Goods and Aggre-gate Labor Productivity,” Journal of Monetary Economics, 47, February2001, 163-187.
[17] Summers, Robert and Alan Heston, "The Penn World Tables (Mark 5):An Expanded Set of International Comparisons, 1950-88," QuarterlyJournal of Economics, 106, 2, May 1991: 327-368.
[18] Sutela, Pekka, The Russian Market Economy, Helsinki, Kikimora, 2003.

Chapter 3
Economics of Location
3.1 Introduction
The biggest and deepest bear trap may be location. Russia is cold and big.It has a peculiar and unique economic geography that continues to defineRussia and yet prevents it from building a competitive market economy and anormal democratic society. Today, despite the abolition of central planning,Russia still has a nonmarket and nondemocratic distribution of labor andcapital across its territory. Too many people and factories still languish inplaces communist planners put them–-not where market forces would haveattracted them.After the collapse of the command-administrative system of economic
management in the early 1990s, free market forces in Russia began correctingthe spatial misallocation that had occurred during the Soviet era. Peoplemigrated out of the coldest and most remote regions. That self-adjustmentcame to a halt in 1999. Now the trend has reversed. Plans for Siberiandevelopment and repopulation are back on the national agenda. For instance,in June 2006 Putin announced a new migration program designed to attractethnic Russians from abroad to return to Russia in order to repopulate Siberiaand the East.Overall geographical mobility remains quite low in Russia, something
that impedes reallocation of human capital. The total number of internalmigrants in Russia – that is, people who changed their city or district [rayon]of residence during the year – fell from 3.3 million in 1992 to 1.7 million in2009. Russia’s internal migration rate is now only about 1.2 percent. The
39

40 CHAPTER 3 ECONOMICS OF LOCATION
comparable rates for the United States and Canada are over 5 percent. In aneconomy that needs much more dynamism, this trend towards less mobilityis not good. Yet Russian leaders are trying to block the little mobility thatthere is as they argue against the depopulation of Siberia. Calls for policiesto reverse population movements from Siberia is one of the most significantBear Traps in Russia today.
3.2 Cost of Cold
Russia is cold. Our work on “Cost of the Cold” was an attempt to capturesome of excess cost of faulty location decisions. The basic thesis is that muchof the investment in human capital or physical capital will be wasted if youdon’t make the proper locational match.In the course of efforts to reform the Russian economy over the decade
since the collapse of the USSR, the focus has naturally been on the future, notthe past. One of the guiding assumptions has been that if the old system thatproduced the wrong results in the past is now changed, the proper new systemwill automatically produce the right results in the future. The future, then,will take care of the past. Unfortunately, creating a new Russian economyis not that simple. It is not enough merely to dismantle the old systemand replace it with a new one. One must also rectify the consequences ofoperating under the old system for more than seven decades.One specific aspect of this inherited economic geography is the develop-
ment of Siberia. Nowhere was the freedom of the market more deliberatelydefied than in the Soviet efforts to conquer and industrialize Siberia’s vastterritory. Beginning in the 1930s, slave labor built factories and cities andoperated industries in some of the harshest and most forbidding places onthe planet, places to which citizens would not freely have moved en masseon a permanent basis. In the 1960s and 1970s, leaders in Moscow decided tolaunch giant industrial projects in Siberia. Planners sought to create perma-nent pools of labor to exploit the region’s rich natural resources, to produce amore even spread of industry and population across the Russian Federation,and to conquer, tame, and settle Siberia’s vast and distant wilderness areas.This time, new workers were lured to Siberia with higher wages and otheramenities–-rather than coerced there and enslaved–-at great (but hidden)cost to the state.Thanks to the Soviet-era industrialization and mass settlement of Siberia,

3.2 COST OF COLD 41
Russia’s population is now scattered across a vast land mass in cities andtowns with few physical connections between them. Inadequate road, rail,air, and other communication links hobble efforts to promote interregionaltrade and to develop markets. One-third of the population has the addedburden of living and working in particularly inhospitable climatic conditions.About one-tenth live and work in almost impossibly cold and large cities inSiberia. Given their locations, these cities (as they did in the Soviet period)depend heavily on central government subsidies for fuel and food; they alsorely on preferential transportation tariffs. Costs of living are as much as fourtimes as high as elsewhere in the Russian Federation, while costs of industrialproduction are sometimes higher still. The cities and their inhabitants are cutoff from domestic and international markets. Russia is, as a result of its oldcentrally planned system, more burdened with problems and costs associatedwith its territorial size and the cold than any other large state or countryin northern latitudes, like the United States, Canada, or the Scandinaviancountries.From the point of view of economic efficiency–that is, market economic
efficiency–the dominant characteristic of the Soviet period was misalloca-tion. The country’s resources (including human resources) were misused.The Soviet system produced the wrong things. Its factories produced themin the wrong way. It educated its people with the wrong skills. But perhapsworst of all, communist planners put factories, machines, and people in thewrong places. For a country with so much territory, especially territory inremote and cold places, location matters a great deal. Not only did Russiasuffer from the irrationality of central planning for more than seventy years,but Russia’s vast territorial expanse offered latitude for that system to makemistakes on a huge and unprecedented scale. Had the Bolshevik Revolutiontaken place instead in a country as small and contained as, say, Japan, thedamage could not have been as great. While central planning would stillhave distorted the economy, it would not, and could not, have distorted it asmuch in terms of locational decisions. In Russia, Siberia gave the Bolsheviksgreat room for error.
3.2.1 Size as Salvation and as Stumbling Block
In earlier epochs, Russia’s size was seen as its most significant attribute. Itwas the source of wealth, power, and even invincibility. Russian historiansclaim that Russia’s huge territory saved not just Russia itself, but all of

42 CHAPTER 3 ECONOMICS OF LOCATION
western civilization from devastation by serving as a buffer against Tatar-Mongol expansion. Even Pushkin wrote that “[Russia’s] vast plains absorbedthe force of the Mongols and halted their advance at the very edge of Europe. . . [T]he emergent enlightenment was rescued by a ravaged and expiringRussia.”Even today, after the collapse of the USSR, western observers remain in
awe of Russia’s size and resources. They marvel at a country that sprawlsacross eleven time zones with a potential market of nearly 150 million con-sumers. They typically cite a long list of its natural resource holdings: 40percent of world natural gas reserves, 25 percent of the world’s coal, dia-monds, gold and nickel, 30 percent of its aluminum and timber, 6 percent ofglobal oil, and so on, and so on.But in today’s world size is less an asset than a liability. It is a disadvan-
tage that has to be overcome. It is an obstacle to economic competitivenessand effective governance. Population centers are spread over vast distances.As distances between cities and towns increase, physical movement becomesmore difficult. Direct transportation costs increase. Information flows, theestablishment of trust among market actors, and the creation and function-ing of shared institutions are all impaired. In short, “being big” is a seriousimpediment to economic development unless a country can reduce distanceand increase connections between population centers and markets.The primary issue is not just that of Russia’s physical expanse, but the
location of people within that space and what they are close to or not close to(markets, communication routes, and so on). In Russia, it is costly to buildand maintain the infrastructure to keep citizens in economic and politicalcontact with one another and with the center in Moscow. But it is notonly the vast physical space that is the problem. Russians have also locatedthemselves poorly in “thermal” space. The uniquely cold location of manyof Russia’s big cities adds further costs to Russia’s economic geography.
Coldest in the World
It is a commonplace that Russia occupies a cold territory. Not only does itsuniquely large land mass lie in an extreme high-latitude (northern) position,but very little of that territory enjoys any moderating influence of temperateoceans in the east and west. By nearly any conventional measure of tem-perature, Russia claims the distinction of being the coldest country in theworld. It has twice as much territory above the Arctic Circle as Canada, ten
3.2 COST OF COLD 43
times as much as Alaska, and fifteen times as much as Norway, Sweden, andFinland combined. Day after day, the coldest spot on the globe is usuallysomewhere in Russia. Not surprisingly, the lowest temperature ever recordedoutside Antarctica was in Russia.1
In more recent years, such glorification of the cold has been less in fashion.The imperative of competing in the world economy has focused attentionon Russia’s uniquely cold climate as a disadvantage.2 For some, Russia’sproblem with the cold is God-given and it is eternal. What such an argumentfails to recognize is that it does not matter how much of Russia’s land masslies in far-away, cold space. What counts is how much and what kind ofeconomic activity is conducted in those regions. The central point is thatpopulation distribution, and hence a country’s cold, is the result of humanchoices.That Russia does pay some penalty, in human comfort and economic
efficiency, for its cold climate seems clear. The question is, how great apenalty? Answering that question raises others. First, how extensive isthe cold; how can a nation’s cold be measured in an economically relevantway? Second, what economic cost does a country incur per unit of cold?Finally, how much of Russia’s cold is “excess” cold? That is, how much isdue to allocative mistakes of the past, and how much was the unavoidable
1That temperature was recorded three times: in Verkhoyansk on February 5 and Feb-ruary 7, 1892, and in Oymyakon on February 6, 1933. Both locations are in the Republicof Sakha (Yakutiya).
2For some it has produced extreme pessimism, even fatalism, about Russia’s prospects.The best known example is Andrey Parshev’s book, Why Russia Is Not America.(Pochemu Rossiya ne Amerika: Kniga dlya tekh, kto ostayetsya zdes’ (Moscow: KrymskiyMost-9D, Forum, 2000).Parshev argues that largely because of the cold climate and the costs it imposes on
economic activity, Russia is fated to fail as a global competitor and thus should remainoutside the world economic community. While Parshev is fundamentally correct in manyof his assertions about the disadvantages of the cold, he goes badly astray in his analysisbecause he wrongly assumes that Russia’s coldness is an immutable characteristic of thecountry and its location.Parshev is also wrong because he ignores that even a cold climate can have a comparative
advantage and can therefore benefit from trade with other countries. The tragic irony ofParshev’s final recommendation is that if Russia were to follow his advice to withdrawfrom the world economy, it would be immeasurably worse off. However, this is not to saythat Russia’s comparative advantage lies in its current economic structure–a structurethat includes location. The reason Russia is not competitive is precisely that its leadersinsist on producing the same things in the same old locations instead of looking for truecomparative advantage on a nationwide scale.

44 CHAPTER 3 ECONOMICS OF LOCATION
result of Russia’s geography? These questions have been tackled in a projectcalled the “Cost of the Cold,” based at the Brookings Institution’s Center forSocial and Economic Dynamics (CSED) and Pennsylvania State UniversityDepartment of Economics. A summary of some of the findings so far follows.
3.2.2 Measuring Cold: TPC
Traditionally, studies of the effects of temperature on economic activity useterritorial aggregations of climate variables–for instance, an “average na-tional temperature” that is the mean of recorded temperatures spaced fairlyevenly across the country. For economic studies, however, this is inadequate.What is important is the temperature of places where people actually liveand work. If one uses territorial temperature aggregations, then the countriesof northern Europe–Sweden, Norway, and Finland–appear to be cold. Infact, in these countries the population is concentrated along the coasts andin the south, where temperatures are not significantly different from the restof Europe. The same is true for Canada, where most people live along thesouthern border.To discuss the role of temperature across countries in an economically
meaningful way we need to account for the fact that climate varies withina country and economic activity (population) is not uniformly distributedacross territories. We utilize the concept of temperature per-capita (TPC)– a population-weighted mean temperature. We define TPC of country kas:
TPCk = Σjnjtj (3.1)
where nj is the share of a country’s total population that resides in region j,and tj is the average mean temperature in region j.3 We typically measureTPC for a given month — in most cases, January, since this is the coldestmonth — and we use oblasts for the region.4
3We could alternatively write the formula as
TPCk =Σjpjτ jPk
where pj is the population of sub-region j and Pk = Σjpj is the total population of thecountry. Then pjτ j (a magnitude expressed in “person-degrees”) can be thought of as the“amount of cold” in sub-region j and is useful in thinking about the relative contributionsof various sub-regions or cities to the entire country’s aggregate cold.
4Notice that calculating the TPC for Russia by using oblast data pushes down the

3.2 COST OF COLD 45
TPC allows comparison of the temperature of one country with that ofanother in an economically meaningful way. For instance, Canada’s territorylies in a northerly range that is similar to Russia’s. But Canada’s populationdistribution is very different, with a much larger proportion of the totalpopulation living in the southernmost part of the country. Is Russia thencolder than Canada? By how much? For that matter, is Russia colder thanother northern countries such as Sweden?Another useful application of TPC is to track a single country’s tem-
perature evolution over time. Measured by its TPC, a country can becomewarmer or colder not (only) because of global warming or cooling but becauseof population movement. If a country’s territory offers a range of tempera-ture zones, its TPC could theoretically rise or fall if people moved to warmeror colder regions. It is thus meaningful to ask, for instance, whether Russiatoday is colder than it was in 1917.Table 3.1 and figure 3.1 show how TPC data answer such questions.
Around 1930, as Russia entered the period of central economic planning, itwas already “economically colder” than not only the United States but alsoSweden and Canada (table 1). It was more than a degree and a half degreecolder than Canada and well over seven degrees colder than Sweden.
Country and Year TPC (◦C)
USA 1930 1.1
Sweden 1930 -3.9
Canada 1931 -9.9
Russia 1926 -11.6
Table 3.1: TPC’s of the United States, Sweden, Canada, and Russia, around1930
But what is particularly noteworthy is the contrast between Russia and
aggregation problem, but it does not eliminate it. Typically we have data for the largestcity in an oblast. But this may not reflect the actual average temperature in the oblast.Ideally, we would calculate the TPC for an oblast in the same fashion, by using sub-regional data. TPC for Russia would then be a weighted average of TPC of the regions.Unfortunately, we do not have temperature data sufficiently disaggregated to make thisfeasible.

46 CHAPTER 3 ECONOMICS OF LOCATION
the other countries in the subsequent period. An illustrative example com-pares Russia with Canada, both cold climates, with dramatically differentTPC dynamics. In figure 3.1 we see that Russia became colder during the
Russia
-12.8
-12.6
-12.4
-12.2
-12.0
-11.8
-11.6
-11.4
1920 1930 1940 1950 1960 1970 1980 1990
Figure 3.1: Russian TPC in the Twentieth Century
century, in start contrast with Canada as is evident in figure 3.2. Russia’sTPC declined steadily in the Soviet era, ending up a full degree colder by1989, while Canada’s TPC rose by more than one degree in the same period.Canada’s TPC rose more than one degree centigrade during the twentiethcentury. This occurred primarily from population moving to the south. InRussia, thanks to Soviet policies that moved population to the extremelycold regions of the east, TPC fell more than one degree centigrade duringthe same period. In 1997 four of the top ten largest cities in Russia (eachwith population over one million) had average January temperatures of —14o
C or below. In 1897, none of the ten largest cities had such low temperatures.
A further use of the TPC concept is to identify which specific regions ofa country are most responsible for its overall temperature. By decomposingthe aggregate index of coldness, we can find each location’s contribution tooverall national or regional TPC. Associated with every region is a quan-tity of “person-degrees”–the product of its temperature and the number ofpeople who live there. Hence, a very cold place inhabited by only a smallnumber of people may be less important than a somewhat warmer (but stillcold) location with a large number of people. Table 3.2 attempts to identifythe “worst offenders” in the low Russian TPC. It is based solely on cities and

3.2 COST OF COLD 47
Canada
-10.2
-10.0
-9.8
-9.6
-9.4
-9.2
-9.0
-8.8
1920 1930 1940 1950 1960 1970 1980 1990
Figure 3.2: Canadian TPC in the Twentieth Century
asks the question, How much does each of these cities contribute to loweringRussia’s national TPC from a benchmark of −10◦C? The right-hand columnin the table gives the answer. Specifically, we calculate the relative contri-bution of each city to the difference between Russia’s urban TPC (all citieswith a population that exceeds 10,000) and the temperature of Moscow.
Clearly, no single city is the whole problem–even the biggest negativecontributors, Novosibirsk and Omsk, together account for less than 10 per-cent of this reduction of TPC below −10◦ C. However, as a group these citiesare quite significant. To put their importance in perspective, note that thereare a total of nearly 1,300 cities with populations of over 10,000 in Russia,home to almost 100 million people. What table 2 says is that of all theseurban areas, the twenty listed account for over half of the drop in Russia’surban TPC below −10◦.
Also note the diversity of the list in both range of temperatures andrange of populations. Since the product of temperature and population isthe significant factor, the cities fall into three broad categories: (1) relativelysmall but extremely cold cities (Yakutsk, Ulan-Ude, Noril’sk, Chita); (2) verylarge, although not terribly cold–for Russia–cities (the Urals and Volgavalley cities of Yekaterinburg, Chelyabinsk, Samara, Perm’), Ufa; and (3)cold and large cities (the two big “culprits,” Siberian capitals Novosibirskand Omsk).

48 CHAPTER 3 ECONOMICS OF LOCATION
City LocationPopulation
(thousands)
January Temp
◦C
Percent of
Cold
Novosibirsk Siberia 1,399 -19 5.2
Omsk Siberia 1,149 -19 4.3
Yekaterinburg Urals 1,264 -16 3.2
Khabarovsk Far East 607 -22 3.0
Irkutsk Siberia 590 -21 2.7
Yakutsk Far East 196 -43 2.7
Novokuznetsk Siberia 799 -18 2.7
Ulan-Ude Siberia 370 -27 2.6
Krasnoyarsk Siberia 875 -17 2.5
Norilsk Siberia 235 -35 2.4
Chelyabinsk Urals 1,083 -15 2.3
Tomsk Siberia 601 -19 2.3
Chita Siberia 307 -27 2.2
Samara Volga 1,275 -14 2.1
Perm Urals 1,011 -15 2.1
Barnaul Siberia 577 -18 1.9
Ufa Volga 1,089 -14 1.8
Komsomolsk Far East 293 -23.5 1.6
Kemerovo Siberia 490 -18 1.6
Bratsk Siberia 279 -23 1.5
Table 3.2: Leading Negative Contributors to Russian TPC

3.2 COST OF COLD 49
3.2.3 The Cost of the Cold
There are two categories of costs associated with the cold. The first are thedirect costs. Cold reduces the work efficiency of both humans and machines,and it causes damage to buildings, equipment, infrastructure, agriculture,fishing, and to human beings (including deaths). The second type of costsare adaptation costs. These include expenditures of energy for heating, extramaterials (and special materials) that are used in the construction of build-ings and infrastructure–in general, all the money and effort that goes intoprotecting or at least buffering society from the cold.To date, no one has conducted the kind of comprehensive research that
could say what the total effects of cold are on any economy, much less forRussia specifically. But two strains of research offer partial answers. One iscold engineering, which looks primarily at direct costs. The other is the re-search on the effects of global climate change, which looks also at adaptationcosts.
Cold Engineering Research
Cold regions engineering research has been used to study the effects of cold onspecific activities, for instance, mineral extraction, construction, and militaryactivity. These detailed, but narrow studies often place less emphasis on costthan on pure engineering requirements. Nevertheless, the research is valuablein presenting some of the negative productivity effects of cold temperature.In a 1986 paper, Gunars Abele of the U.S. Army’s Cold Regions Research
and Engineering Laboratory synthesized data from various surveys from theconstruction industry and the military that indicate the effect of cold weatheron the productivity of people and machines. Figure 3.3 shows the drop inefficiency for manual and equipment tasks involved in typical constructionor repair work as the air temperature drops from below freezing to −30◦ or−40◦ C. Below −40◦C any manual work becomes nearly impossible, andeven construction equipment is rarely used.To express how the reduced efficiency translates into increased work effort
(in terms of time) required to perform construction or repair work in coldweather, Abele introduced a “cold environment factor” (F ). The baselinevalue (F = 1) represents the time needed to perform the task under idealweather conditions (around +10 to +15◦C for manual tasks and above +5◦Cfor equipment tasks, with no wind or precipitation). The cold environment

50 CHAPTER 3 ECONOMICS OF LOCATION
0
20
40
60
80
100
-50-40-30-20-10010Temperatu re (C)
Eff
icie
ncy
(%
)
Equipment Tasks
Manual Tasks
UpperEfficiency Level
LowerEffic iency Level
Figure 3.3: The Effect of Temperature on Manual and Equipment Tasks
factor rises as adverse weather affects work efficiency. Figure 3.5 6 showsthe cold environment factors for manual (Fm) and equipment tasks (Fe). Forinstance, at −25◦C, the standard time for each manual task would have tobe multiplied by 1.6, and the time for each equipment task by about 1.3. At-30◦C, these ratios rise to over 2.1 (manual) and 1.6 (equipment), and so on.Figure 3.4 shows reduced efficiency due solely to temperature and disre-
gards the effects of other climatic conditions such as wind and snow. Wind, inparticular, is a serious complicating factor for manual tasks in cold weather.The severity of the wind-plus-cold effect, relative to the pure temperatureeffect, can be seen by noting that even at −15◦C, a 20 miles per hour (32kph) wind will produce a manual cold environment factor in excess of 4.0–inother words, quadrupling task performance times.Finally, it is to be noted that in accounting for the adverse effects of cold
on manual tasks, Abele looks exclusively at the physical limitations of cold.He expressly disregards any negative psychological or motivational effects ofworking in extreme cold.What emerges from the cold regions engineering literature is a picture of
an economic environment that is dangerous, costly, and unpredictable. Coldalters the properties of materials, leading to more accidents and breakdowns,and it reduces the ability of human beings to work efficiently and safely. Manyprecautions must be taken, or else serious damage to property and loss of lifemay result. Many of the studies raise the question of whether it is worth it atall to continue work in these regions, especially during winter months. But

3.2 COST OF COLD 51
1
1.2
1.4
1.6
1.8
2
2.2
-40-35-30-25-20-15-10-5
Temperature (Cº)
Col
d en
viro
nmen
t fa
ctor
Manual Tasks Factor, Fm
Equipment Tasks Factor, Fe
Figure 3.4: . Cold Environment Factors at Various Temperatures
even though the engineering literature provides a cautious can-do attitude tosettling and living in cold regions, there is no systematic attempt to measurethe costs associated with living and building in cold climates. To find suchcost estimates, we must turn to recent studies spurred by concern over climatechange.
Adaptation to Cold: The Case of Canada and the US
Reflecting a general concern over the consequences of global climate change,Canadian government agencies in the 1990s attempted to estimate the coststhat Canadians incur in adapting to their climate. The problem, researchersfound, was that although adaptation does occur, it is rarely accounted forand sometimes barely recognized as having taken place. As they wrote:
“Adaptation to present day climate is the result of a slowaccumulation of policies and practices that protect people andproperty and allow economic and social activities to continue witha minimum of loss or disruption. Adaptation costs are thus ‘built-in’ to routine expenditures and budgets...“Because Canada is amodern industrialized country, it has sophisticated systems whichenable Canadians to continue their activities in all but the mostextreme weather conditions. Most Canadians take these systemsfor granted, and indeed believe that the Canadian climate does

52 CHAPTER 3 ECONOMICS OF LOCATION
not much affect them (aside from providing a perennial topic ofconversation!). In fact, these systems are so taken for grantedthat their effectiveness and desirability are seldom evaluated.”
To begin to fill in the gaps, the researchers focused on the sectors ofthe economy most susceptible to climate effects: transportation, construc-tion, agriculture, forestry, water supply and use, household expenditures,emergency planning, and weather forecasting. (They subsumed energy costsunder the appropriate sectors.) Table 3.3 presents their cost estimates.
SectorCost of Climate Adaptation
$ millions per year
Transport 1, 657.3
Construction 2, 000.0
Agriculture 1, 329.6
Forestry 402.6
Water 767.3
Household expenditure 5, 296.4
Other 200.2
Total, all sectors 11, 653.4Note: Costs are in 1990 Canadian dollars.Canada0s GDP in 1990 was approximately $700 billion.
Table 3.3: What Canada Spends in a Year to Adapt to Its Cold
The total figure that the Canadian researchers arrived at is quite large,nearly $12 billion (Canadian). This is about the size of the annual out-put of Canada’s agricultural sector, and it is 1.7 percent of the country’sgross domestic product (GDP). Nevertheless, they caution that it is likelya significant underestimate because they limited themselves to looking onlyat public expenditures at the national level. They note that “[a] more ex-haustive survey would certainly yield a significantly higher adaptation costestimate.”But there is a more serious omission in the Canadian study, one that
the authors themselves admit. Their study was only about adaptation costs

3.2 COST OF COLD 53
and did not attempt to estimate what we have referred to above as directcosts of cold. As high as the Canadian spending on climate adaptation is, itdoes not prevent all climate damage. Thus, a comprehensive account wouldneed to include at least three main categories of such costs: (1) the impacton productive activities ranging from agriculture, forestry, and fishing, tomanufacturing, and so on; (2) the impact on human health and mortality;and (3) the impact on human well-being and comfort apart from health–theso-called amenities effect.Finally, another shortcoming of the Canadian studies is that even if ad-
ditional cost categories were included, their approach leaves us short of thedata needed to answer the question we posed earlier: What is the cost of coldper degree of TPC? That is, we have an (admittedly incomplete) estimateof the total amount of money spent by Canadians to cope with their coldclimate. But how would these costs increase or decrease as TPC changed byone degree, plus or minus? Their data and findings do not allow us to proceedfurther in answering that question. Fortunately, a valuable effort that usesa per-degree-cost approach and which incorporates the missing categories ofcosts was made in an U.S. study conducted three decades ago, when mostU.S. government and independent experts were concerned about, not globalwarming, but global cooling.In the early 1970s the U.S. Department of Transportation sponsored a
series of conferences to study the effects of climate change on the economy andon human well-being. This study, in which researchers were commissionedto study the effects of a cooling of 2o C, is the only one that explicitly looksat the costs of cold for the U.S. economy. In addition to the costs of damageto (reduced value of) the economy’s production sectors such as agriculture,forestry, and marine resources and the extra costs of residential and industrialheating, specialists provided estimates of the costs to human health andcomfort. The health costs included expenses for physicians’ services, hospitalvisits, and drugs. Separately, they estimated the number of excess deathsthat could be attributed to the cold. Finally, they looked at the cost tohuman beings of living and working in cold temperatures as expressed indifferences in wages among urban areas in the U.S. 5
5Robert Anderson, Jr. calculated the health costs of cooling: “The Health Costs ofChanging Macro-Climates,” in Proceedings of the Third Conference on the Climatic Im-pact Assessment Program, edited by Anthony Broderick and Thomas M. Hard. ConferenceProceedings 1974, DOT-TSC-OST-74-15, 1974, pp. 582-92. Ralph D’Arge estimated othereconomic costs of cooling, including agriculture, forestry, and marine resources: “Economic

54 CHAPTER 3 ECONOMICS OF LOCATION
The DOT work was brought to the renewed attention of at least a smallcircle of readers by an iconoclastic study on the effects of global warming byeconomist Thomas Gale Moore in 1998.6 Table 3.4 summarizes the findingsfrom the DOT study, supplemented by Moore’s efforts to update some of thedata. We have converted them into costs per one degree Celsius, in billionsof 1990 dollars.
ActivityCost per C◦
billions of 1990 dollars
Heating 4.9
Health impacts 14.8
Agriculture, forestry, fishing 14.4
Wages 16.2 (10.3− 34.4)
Human life 16.0
Total 66.3 (60.4− 84.5)
Cost as pct of GDP 1.14 (1.04− 1.46)
Table 3.4: What Cold Costs the U.S. Economy Each Year
The total amount — roughly $60− 85 billion — can also be translated intoa percentage of GDP in the United States.7 Thus, for the U.S. economy,the cost of a single “degree of cold” (the additional costs to the economy ifnational TPC were reduced by one degree) would be roughly 1.0−1.5 percent
Impact of Climate Change: Introduction and Overview,” in Conference Proceedings, pp.564-74. The work on the value of climate amenities drew on the work of Irving Hoch:“Variations in the Quality of Urban Life Among Cities and Regions,” in Public Economicsand the Quality of Life, edited by Lowdon Wingo and Alan Evans. Johns Hopkins Press,1977.
6Moore himself did not use the DOT research to study the costs of the cold, but ratherthe benefits of warmer temperatures. See Thomas Gale Moore, Climate of Fear. Why WeShouldn’t Worry about Global Warming (Cato Institute, 1998) and Thomas Gale Moore,“Health and Amenity Effects of Global Warming,” Economic Inquiry, vol. 36 (July 1998),471-488.
7U.S. GDP in 1990 was about $5, 800 billion.

3.2 COST OF COLD 55
of GDP. This is a quite large cost, especially since it is incurred each year.For instance, an American economy that would normally expect to grow atan average of three percent per year over a 30-year period would sacrificeabout 25-35 percent of that cumulative growth for a one-degree decline inTPC.
How Applicable to Russia?
These findings apply to the United States economy. Are they relevant forRussia? There are many problems involved in comparing anything to dowith the U.S. and Russian economies, but we can mention two major issuesof relevance here. The first is the relationship between the gross cost of thecold in the two economies and the efficiency of measures taken to adapt to thecold. The second issue is the very different range of temperatures at whichthe costs of the cold would have to be assessed in Russia and the UnitedStates.With respect to the first: if one spends a dollar in the U.S. to adapt to
the cold, what is the payoff, in terms of reduced damage or direct costs?What is the return to one dollar similarly invested in Russia? An area wherethis is particularly relevant is in assessing the health and mortality costs ofthe cold. Americans spend huge sums to protect their health and treat theirillnesses of all kinds, including those possibly caused by the cold. Russiansclearly do not spend as much, even as a share of their much lower nationalincome. But that lower spending (and consequent lower level of health care)presumably leads to higher mortality rates. The U.S. is estimated to suffer16,000 excess deaths per degree of cold. Pro-rated for population, that wouldimply about 9,000 annual excess Russian deaths per degree of cold. But doRussians die from cold at the same rates as Americans?Then there is the issue of the economic value of each life lost. Cost-of-life
calculations, though commonly used by economists, are controversial enoughas it is. They are based on estimations of what an individual could have beenexpected to earn over the remainder of his or her working life. (Those lifetimeearnings are taken as the value of a person’s contribution to the economy.)This means that we would have to adjust for Russians’ expected longevityas well as their specific earnings structure.In sum, trying to adjust the U.S. findings on cost of the cold for Russian
conditions may not be not particularly productive. It would be wise touse the American results only as a very general indicator that cold in any

56 CHAPTER 3 ECONOMICS OF LOCATION
temperate or cold country undoubtedly has costs. But to determine preciselywhat those costs are, Russia would need to make special studies.
Another good reason to have specific research for Russia is the secondreservation we made earlier about applying U.S. results to Russia, namelythat the countries’ temperature ranges differ so much. The U.S. estimatesare for the cost of a degree of cold at the current U.S. TPC, which, of course,is considerably warmer than Russia’s. The issue here is that the cold-costfunction is clearly nonlinear. The magnitude of the effect will not be the sameat -12o as +3o or +4o. But how much different would it be? Cold engineeringsuggests that at least some of the costs associated with the cold are in factbigger per degree at lower temperatures. for human and machine efficiency.It is clear, for example, from Figure 3.5 5 that a drop in temperature from-20o to -25o has a much greater effect on while a change in temperature from-5o to -10o has relatively little effect on human and machine efficiency thanone from 0o to -5o. productivity, a drop from -25o to -30o is much moresignificant.
An even more serious consideration is what happens when the thermome-ter drops down below certain critical cold thresholds that trigger massive anddisastrous materials failures. For most of the populated world, the extremecold thresholds are, fortunately, not relevant. But Russia is different. Andnowhere are these critical thresholds more of a daily reality for more peoplethan in Siberia. It is not surprising that the most systematic study of thecold thresholds has been made by Russians, for the purpose of determiningwhether Siberian regions needed machines of special design or whether stan-dard machines could somehow be modified through the addition of specialparts made of cold-resistant steels. A compilation of the behavior of machinesat various Siberian temperature levels gives a harrowing picture. See Table3.5: What Table 3.5 shows is that there is a “seismic” component to verycold temperatures: extreme discrete events have the effect of an earthquake.This suggests that it is not just the mean temperature that is important;the variance also matters. To try and analyze this “extreme temperature”component of the overall temperature profile of a location, we created thenotion of a “cold decile.” This is the temperature that marks the coldest tenpercent of all days in the period recorded. Our research suggests that inmost of Russia the cold decile cutoff value is roughly 10 degrees lower thanthe mean. In other words, at any given mean January temperature it can beexpected that ten percent of the time, the mean daily temperature will actu-

3.2 COST OF COLD 57
Temp C◦ Effect on Standard Soviet Machinery
−6 Internal combustion engines require pre-start engine heaters
−10 Destruction of some standard metal dredge components
−15High-carbon steels break; car batteries must be heated;
first critical threshold for standard equipment
−20Standard compressors with internal combustion engines cease to
operate standard excavator hilt beams break; destruction of some
tower crane components, dredging buckets, and bulldozer blades
−25 to −30Unalloyed steels break; car-engine space, fuel and oil tanks must
be insulated; frost-resistant rubber required; non-frost resistant
belts and standard pneumatic hoses break; some cranes fail
−30 Minimum temperature for use of any standard equipment
−30 to −35 Trestle cranes fail; some tractor shoes break
−35 to −40Tin-alloyed steel components (ballbearings, etc.) shatter; saw
frames and circular saws stop work; all compressors stop work
standard steels and structures rupture on mass scaleSOURCE: Adapted from Mote, p. 22. [In turn derived from Dogayev, pp. 29 - 31]
Table 3.5: Cold Thresholds in Siberia

58 CHAPTER 3 ECONOMICS OF LOCATION
ally be 10 degrees below the monthly mean.8 For instance, the city of Omskin Siberia has a January mean of -19o C. But on average, for three days eachJanuary the million-plus residents of Omsk will see the thermometer dropbelow -29o C. And Omsk is only the beginning. It lies in the warmer part ofthe Siberian temperature range. The real cold comes farther east.
3.3 Cost of the Cold
An alternative way to measure the cost of the cold is to consider how Russiamight have developed had Soviet location policies not moved so many peopleto such cold places. One could ask what Russia’s TPC would be withoutsuch policies and then calculate the excess cost brought about by the dis-torted location policies. This is just the exercise pursued by Mikhailova(2004). Specifically, she conducts a counterfactual exercise, examining howRussia would have developed had location policies during the Soviet periodresembled decisions made by Canadians.
The essence of Mikhailova’s study is to use Canadian data to estimatea model that characterizes the dynamic links between, on one hand, spa-tial structure of the economy and, on the other hand, initial conditions andregional characteristics. With this estimated behavior model of the spatialdynamics in market economy in hand she then applies it to Russian initial
8On top of all the other issues that complicate the study of the effect of cold tem-perature, we have hitherto ignored one of the most basic: what is meant by the dailyor monthly mean temperature? This is relevant for the present discussion of extremeevents, since the mean daily temperature may still fail to reflect the fact that the daily lowtemperature may be significantly below the daily mean. In fact, most weather stationsaround the world, including those in Russia, report only the daily maximum and minimumtemperature, and so what is labeled the daily mean is really only an approximate mean,namely the mid-pointrange of the maximum and minimum. Meteorologist John Griffithsnoted that values labeled as mean temperatures have been calculated “in a bewilderingvariety of ways.” He himself personally has unearthed over 100 different methods usedto calculate the daily mean. John F. Griffiths, “Some Problems of Regionality in Appli-cations of Climate Change,” in Proceedings of the Fourteenth International Congress ofBiometeorology, September 1-8, 1996, Ljubljana, Slovenia, pp. 384-390.

3.3 COST OF THE COLD 59
conditions and endowments.9
Mikhailova’s results show that show that the post-Soviet allocation ofpopulation and industry in Russia is far different from that which wouldoccur in the absence of Soviet location policy. It is colder and further to theeast. Namely, the Eastern part of the country is noticeably overpopulatedcompared to the counterfactual market allocation, while the Western partexperiences a relative population deficit. The excess population in Siberianand Far Eastern regions ranges from 9.6 to 17.6 million people according tovarious estimates.10 An illustrative comparison is given in figure 3.5 whichcompares the actual path of TPC in Russia with the forecast of her marketmodel. The differences are significant. Without Soviet location policies TPCrises in Russia, as it did in Canada during the 20th century.Mikhailova then proceeds to estimate the cost to the Russian economy
of the excess population in cold climates. To calculate the cold-related costof spatial inefficiency, she first investigates the relationship between tem-perature and various regional characteristics (energy consumption, healthindicators, and productivity). She estimates the temperature elasticities ofthese characteristics and uses these estimates together with the measure ofextra cold resulted from Soviet investment decisions – 1.5◦C TPC difference– to calculate the cost in terms of present-day Russian GDP.The costs Mikhailova finds are dramatic.
In the most modest of her estimates, this difference in TPCcosts not less than 1% of GDP in extra energy costs, and 0.2% ofGDP in lost productivity in construction sector alone annually. Ifall manufacturing industries had the same temperature elasticityof TFP as construction, loss of another 1.3% of GDP yearly couldbe attributed to cold. Additional 0.85% of aggregate mortalityare also a direct consequence of Soviet spatial policy. These are
9The assumption behind her procedure is not that spatial structures of different marketeconomies should be similar, but rather that the dynamic forces that impact on locationshould be similar. In other words, she does not just compare the existing spatial allocationsin Russia and Canada, but instead looks at the changes in structure over time: initialconditions matter.10Mikhailova tests for the effect of WW2 on location policy. "The impact of WWII,
however drastic in the case of Russia, explains the eastwest misbalance only partly. Evenaccording to the most liberal estimates, the excess population of Siberia and Far Eastremains at the level above 9.6 million after the war adjustment, and is statistically signif-icant."

60 CHAPTER 3 ECONOMICS OF LOCATION
Figure 3.5: Mihailova’s Projected and actual TPC dynamics in Russia
annual costs, but compounded over last 30 years of the Soviet era- a time when the spatial evolution of Russian economy took asharpest detour from the optimal trajectory - lead to a GDP lossin excess of 35% (or 97% in worst case scenario). Every personin Russia gave up at least one fourth (or maybe a half) of hisincome for Siberian development!
These are dramatic costs, but it is important to note that Mikhailova onlyestimates a lower bound to these costs. Mikhailova was only able to estimatea portion of the costs. For example, she assumed that residential electricityconsumption was independent of temperature, but it is almost certainly thecase that in Russia electricity use rises as temperature falls.
3.3.1 Siberia and the GULAG
At the end of the tsarist period, the interior of Siberia was barely charted, letalone settled. The large-scale settlement and urbanization of Siberia were notpossible under the tsars. The costs of peopling, exploiting, and maintainingsuch a vast, cold area were simply too onerous for their market-orientedeconomy. Only the Soviet Union–-a totalitarian state with coercion at its

3.3 COST OF THE COLD 61
core, with its highly centralized control of production and redistribution ofresources and with absolutely no sense of cost–-could conquer Siberia.Like the tsars, the Soviet state used Siberia both as resource frontier
and as penal colony. But the Soviets developed the tsars’ Siberian penalsystem to levels previously unimagined. Under Josef Stalin, the governmentlaunched the labor camp system in 1929 for the explicit purpose of colonizingand exploiting the natural resources of the nation’s most remote regions.By 1934, half a million Soviet citizens–everyone who had received a prisonsentence of three years or longer–were in the GULAG (an acronym basedon the name of the department within the Soviet police ministry that ranthe camp system). Stalin’s great purges of the late 1930s brought the totalcamp population to more than two million.The GULAG and its virtually inexhaustible pool of slave labor became
fundamental tools in the industrialization of Siberia. GULAG inmates–some18-20 million of them over the span of slightly more than two decades–facilitated the exploitation of timber and mineral resources in unpopulatedremote areas. They also laid railroads, constructed roads and dams, dugcanals, developed oil fields, and built factories and farms, all under mon-strously inhuman conditions.World War II gave further impetus to Siberian development when key
factories were moved fromEuropean Russia eastward into the Ural Mountainsand beyond to put them beyond the reach of invading German forces. Siberiareceived 322 of the relocated plants. Postwar economic development plansencompassing both these and yet-to-be-built industrial facilities demandedeven more forced labor. Continuously, from mid-1949 until Stalin’s deathin 1953, the forced labor camps contained around 2.5 million inmates, halfof whom had committed crimes no more serious than petty theft. Duringthose peak years in the late 1940s and early 1950s, the GULAG accountedfor an estimated 15—18 percent of all Russian industrial output and industrialemployment.The GULAG was largely dismantled after Stalin’s death, but it had al-
ready laid the basis for what was to become a massive project of Siberiandevelopment under his successors. Many motives converged in the postwardevelopment of Siberia. Communist economic planners sought to extractSiberia’s oil, gas, diamonds, gold, and other rich mineral deposits to makethe Soviet Union self-sufficient in strategic resources. Military planners, whoalready during the war had begun to reconceptualize western Siberia as astrategic redoubt–a defensible core deep in the interior–wanted to ensure

62 CHAPTER 3 ECONOMICS OF LOCATION
that the entire region be settled and secured. Soviet politicians tasked withengineering and mobilizing society in the 1960s-1980s stressed the ideologyof “conquering new lands”–now to be interpreted as campaigns to overcomenature and the wilderness through industrialization–to increase the strengthof the Soviet state.
Cities were an important feature of the plans for a Siberian industrialutopia. Cities were developed in Siberia in tandem with industries to pro-vide a fixed reserve of labor for factories, mines, and oil and gas fields. Inmany respects, however, the cities were not really cities. Rather than beinggenuine social and economic entities, they were physical collection points,repositories, and supply centers–utilitarian in the extreme. They were builtto suit the needs of industry and the state, rather than the needs of people.Indeed, primary responsibility for planning and constructing city infrastruc-ture fell to the Soviet economic ministry in charge of the enterprise the citywas designed to serve. Few responsibilities were assigned to the municipalgovernments.
Still the cities grew, in both number and size. By the 1970s the SovietUnion had urbanized its coldest regions to an extent far beyond that of anyother country in the world. (See box 2.) At precisely the time when people inNorth America and western Europe were moving to warmer regions of theircountries, the Soviets were moving in the opposite direction.
How cold are Russia’s cities? A comparison with Canada and the UnitedStates is instructive. A list of the 100 coldest Russian and North Americancities with populations of over 100,000 would have 85 Russian, 10 Canadian,and 5 U.S. cities. The first Canadian city to appear on the list (Winnipeg)would be in 22nd place. The coldest U.S. city (Fargo, North Dakota), wouldrank 58th. Americans are accustomed to thinking of Alaska as the ultimatecold region. But Anchorage, Alaska, would not appear on a list of the coldestRussian and North American cities of over 100,000 until position number 135,outranked by no fewer than 112 Russian cities. The explanation for this resultis not that Alaska isn’t cold. It is, It’s just that Americans don’t build largecities there. (In fact, Anchorage is the only city in Alaska with a populationof over 100,000.) For really large cities, things are even worse. The UnitedStates has only one metro area over half a million (Minneapolis-St. Paul)that has a mean January temperature colder than -8o Celsius. Russia has 30cities that big and that cold.

3.4 CONCLUSION 63
Boom... and Bust
In the 1970s and early 1980s, Siberia and the Russian Far East dominatedSoviet regional development programs. Western Siberia, rich not only inoil but also in natural gas, was on its way to becoming the largest energy-producing region in the USSR, and grand long-term industrial projects werebeing planned for the whole of Siberia. Western analysts were astounded bythe magnitude of the projects and by the scale of investment necessary tocarry them out.But the Soviet economic slowdown of the late 1970s would put an end to
such ambitions. By the 1980s, the massive investments in Siberia and the FarEast were offering extremely low returns. Many huge construction projectswere left incomplete or postponed indefinitely. At first, the troubles wereblamed on disproportional and incoherent planning, ineffective management,and poor coordination. But by the reformist era of the late 1980s underMikhail Gorbachev, the problem was seen to be Siberia itself as well asthe efforts to develop it. Criticism of the giant outlays in Siberia becamecommonplace. Regional analysts and planners in Siberia mounted a fiercerearguard action. They tried to justify continued high investment by pointingto the value of the commodities produced in Siberia on world markets and thestate’s dependence on Siberian natural resources and energy supplies. Still,by 1989, the industrialization of Siberia was beginning to seem a monumentalmistake. The Siberian enterprise was, in any case, brought to a screechinghalt by the collapse of the Soviet Union in 1991 and the beginning of Russia’smacroeconomic reforms in the 1990s.
3.4 Conclusion
The costs to Russia of its location, and of its location policies — the immutableand the self-induced problems — are severe. They are a tax on Russian growth,and they are a potential Bear Trap if they are not understood correctly. It istempting to think that given the industrial resources in many of the very coldcities Russia should invest its wealth to modernize these structures. Withenough investment the cold can be adapted to. With sufficient investmentyou can make anything viable. As we noted in Russia’s Virtual Economy:
"Of course, a sufficient infusion of outside resources can guaranteesuccessful restructuring for any enterprise, because this makes it

64 CHAPTER 3 ECONOMICS OF LOCATION
possible to reconstruct the entire enterprise from scratch. There-fore, any meaningful notion of restructuring has to consider theopportunity cost of making a given enterprise viable [?, 7]."
But if one is to invest sufficient resources to rebuild an enterprise whywould you do that in Perm rather than Rostov? Even with zero cost of cap-ital you would not re-invest in Perm. You would build it in Rostov or somesimilarly warmer (for Russia) city. To rebuild in Perm you need directed cap-ital subsidies. When Russia spends money to replace worn-out infrastructurein Siberian and Urals cities that are far colder than urban centers of that sizeanywhere else in the world, when it builds roads to connect cities whose veryexistence no market economy would have tolerated, when it channels invest-ment into factories that were not located, equipped, and staffed with eventhe foggiest idea of a market in mind–when it makes these and hundredsand thousands of other similar investment decisions, it is not only wastingthe very scarce resources it has available today. It is also dooming futuregenerations to continue the waste.Why does this location problem persist? The Soviet Union was disman-
tled in 1991, and a market economy has replaced central planning. Yet thelegacy of the Soviet period in terms of location policy persists. To explainthis, we must turn to political economy, especially the implications of feder-alism Russia style, which we do in the next chapter.

Bibliography
[1] Gaddy, Clifford G., and BarryW. Ickes, Russia’s Virtual Economy. Wash-ington DC, Brookings Institution Press, 2002.
[2] Mikhailova, Tatiana, Essays on Russian Economic Geography: MeasuringSpatial Inefficiency. Unpublished Ph.D. Dissertation, The PennsylvaniaState University, 2004.
65


Chapter 4
Market-Impeding Federalism
4.1 Introduction
"Muscovites should live well. Everyone else should think aboutRussia, so the Muscovites can live even better."1
We have seen that Russia suffers greatly from the legacy of spatial misal-location: too many people, and too much capital, in the wrong places. Thiswould not be so bad if internal labor migration was high. In fact, however, ithas been and remains very low.2 To understand why this legacy persists weturn out attention to the federal structure of Russia. Post-Soviet Russia im-posed a formal federal structure on a spatial distribution of productive forcesthat was non-market. The federalism became market-impeding rather than,as had been intended, market-promoting. We refer to the peculiar Russianpolicy that emerges as “Lights On.”Our argument in this chapter is that the peculiar policy of "lights on"
plays a central role in the conservation of the legacies from the Soviet period.It reduces mobility of both labor and capital. It is the result of the grafting ofa federal system on a non-economic territorial divisions. Given its importancein the political economy of Russia it is worth developing the argument in full.
1Reader comment by a resident of the Russian Far East in Komsomolksaya Pravda, 29May 2010.
2According to the most definitive study on migration in Russia, Andrienko and Guriev(2005), "Throughout more than a decade of economic transition, internal migration rateshave been low, and there has been virtually no convergence across regions."
67

68 CHAPTER 4 MARKET-IMPEDING FEDERALISM
Some have argued that federalism may be advantageous for countries try-ing to reform. A federal structure offers several potential advantages. First,it allows for competition among jurisdictions with regard to policies. Second,a federal structure may serve as a check on central government interference.Some have argued that market-preserving federalism is a "governance solu-tion of the state to credibly preserve market incentives [[13, 83]]." The ex-ample of China is often used to illustrate how market-preserving federalismworks. In contrast, Russia, which is also a federal state, is often character-ized as failing to implement market-preserving incentives. In this chapter wewill show what can happen when federalism is implemented in an economylike Russia in which the initial allocation of resources across regions is non-economic. We will show that the conditions for federalism to work effectivelymay be absent in Russia.Federalism is often considered to be a political structure that is conducive
to market reform. We examine this argument. In particular, we focus on theconsequences of a federal structure where the regional boundaries were cre-ated by administrative fiat, and where some regions may need to shrink ifreforms are undertaken. We argue that observed industrial change will beslower than that predicted by a pure adjustment hypothesis because loserregions will want to subsidize high cost industry to prevent an outflow ofcapital and labor. Moreover, rich regions may also have an incentive to sup-port such policies. In a social planner’s solution to the adjustment problemfor Russia, labor would move from the loser regions where TFP is low. To-tal income would be much higher if Moscow and similar regions were muchbigger. But this lowers wage income in these regions. Hence, governors ofrich regions may also want to restrict the movement of labor. Hence, theyprovide (support) the subsidies that the loser regions want to maintain theirpolitical authority.
4.1.1 Decentralization versus Federalism
Federalism is to be distinguished from decentralization. Governance of anyterritorially large country requires some decentralization. Nondemocratic so-cieties typically use an administrative-hierarchical system of decentralization.Democracies, in contrast, rely on some notion of federalism – that is, a re-gional distribution of political power. Typically, the power distribution isrelated to the regions’ economic importance as reflected in their populationsizes.

4.1 INTRODUCTION 69
Federalism, it is often argued, tends to enhance democratic efficiency. Atleast it may lead to more participation. But what about the relationship be-tween federalism and economic efficiency? The answer depends on the natureof the economic problem. If the problem is central government interferencein – or even predation of – the economy, then federalism can serve to pro-tect the market. If, on the other hand, the problem is regional inequalitiesin economic performance, then federalism may be an obstacle.3 Finally, ifpredation by regional governments is the problem, then federalism is not thesolution.There is always a trade-off between the problems of central government
predation and regional inequality, so the solution will depend on the relativeimportance of the two problems. Here is it important to distinguish casesdepending on initial conditions. In a normal spatial allocation populationadjusts so that marginal returns are equalized.4 Shocks alter conditions fromthat starting point. In Russia, on the other hand, the transition shock isimposed on an allocation that is very far from equilibrium.5 In Russia,market reform requires very large structural changes along regional lines.Yet, the pace of such change is very slow and is inversely related to thedegree of disequilibrium [Ickes and Ofer, 2006]. This suggests that federalistinstitutions may be inhibiting change rather than promoting it.The misallocation of industry across regions also implies that the marginal
cost of taxation differs widely across regions. Allowing subnational unitsfreedom to set tax rates is thus very inefficient. One could argue that Tiebouteffects will solve this.6 But the size of the required population shifts may be
3In Gaddy Ickes 2002 Appendix F ("Regions in R-D space) we develop a model of gov-ernor decisionmaking and show how initial condition can lead to a bifurcation in regionaloutcomes.
4This was noticed long ago by Adam Smith: "The policy of Europe, by obstructingthe free circulation of labour and stock both from employment to employment, and fromplace to place, occasions in some cases a very inconvenient inequality in the whole of theadvantages and disadvantages of their different employments ([14, Book 1, chapter X, page134]).
5For a regional analysis of structural change in Russia see [Ickes and Ofer, 2006].6The Tiebout hypothesis predicts that given that individuals have differing personal
valuations on public services and varying abilities to pay the attendant taxes, individualswill move from one local community to another until they find the one which maximizestheir personal utility. The model states that through the choice process of individuals,jurisdictions and residents will determine an equilibrium provision of local public goods inaccord with the tastes of residents, thereby sorting the population into optimum communi-ties. The relevance to Russia, where internal migration is low and democratic institutions

70 CHAPTER 4 MARKET-IMPEDING FEDERALISM
very large. Else the level of public goods provision across regions will be toogreat for satisfying any democratic criteria.
Why not just re-draw the political boundaries? Keep federalism, butdraw correct boundaries? This is an interesting possibility, but the problemis that without liberalization you don’t know what the correct boundariesare. The virtual economy and pretense means that it is hard to uncoverwhat these boundaries should be. Once transition is underway, on the otherhand, vested interests make it very difficult to re-draw political boundaries.
Notice that with the very large differentials in marginal product acrossregions there are large incentives to move at the individual level. Giventhe wage differentials that exist in Russia today, everyone would want tomove to Moscow. One might also expect that capital would flow to Moscowgiven that productivity is higher there and the infrastructure is better. Butthis is less likely to happen. The reason is that much of the capital inthe regions is fictitious, maintained by the pretense of the virtual economy.Hence, diminishing returns will be reached much sooner in Moscow thanwould be the case if both capital and labor moved.
Contrary to what one might think, in Russia labor is less, not more mobileacross regions than capital. Apparently,investment/disinvestment decisionsproduce more variation in the regional capital stock than interregional mi-gration does for regional labor force. The regional labor supply is extremelystable, shockingly more so than regional capital.7 A cross-sectional series ofregional capital stocks in 1994 and in 2000 display a correlation of 92.6%,8
while the series of regional labor forces are correlated at the 99.8% level.
But officials want to offset this. Not just via the use of propiska, butkeeping enterprises open in home regions plays a big role.
relatively weak is not, perhaps, very strong.7This is not to say that the labor mobility is non-existent in Russia.On the level of
individual firms labor has been getting increasingly more mobile during the transitionperiod. However, most of labor movement is intersectoral but not interregional. The levelof labor migration across regions is still low.
8Note that capital stock is measured as the base (purchase)value of capital adjustedfor depreciation at the official rate, and does not truly represent capital stock used forproduction. If a region is economically successful and the investment level is high, all newcapital correctly shows up in data. If a region is in recession, capital is underutilized, andthe measured capital stock is actually higher than the utilized capital stock. Probably,capital is even more mobile across regions than it appears to be.
4.2 PREDATION AND CAPTURE 71
4.2 Predation and Capture
Market-preserving federalism is seen as a mechanism for preventing preda-tion. The idea is that decentralization of authority, by limiting the informa-tion available to central authorities enhances the credibility of commitmentsnot to predate. By raising the cost of predation through limitations on in-formation, federalist decentralization leads to improved market incentives.The importance of restraining the predatory instincts of central govern-
ments is no doubt important. But it raises the question, why do some govern-ments predate more than others? Why, for example, has the private sectordeveloped more in China than Russia? Blanchard and Shleifer (2001) de-velop a simple model that is very useful for studying this problem. They putforward two hypotheses to explain the greater level of predation in Russia.
• Capture by older firms. Local governments work to generate transfersto older firms and to protect them from new competitors
• Competition for rents by local officials. unintended effect of adminis-trative disorganization. Too many agencies trying to extract rents fromnew private firms
But why are these forces weaker in China? According to Blanchard andShleifer there are two key explanations. First, they argue that initial rentholders were weaker in China than in Russia. This is partly due to the levelof development in the two countries and the nature of economic structure.Second, the strength of the central government in China was stronger — nocollapse of party. Blanchard and Shleifer focus on the consequences of thelatter explanation.We augment the analysis to consider the implications of inefficient federal
boundaries. What happens if the political boundaries in a federal system areinappropriate economic units?
4.3 Blanchard-Shleifer Model
It is useful to set out the basic Blanchard-Shleifer model [B-S] in some detailas it will be the basic structure for what follows. There is a government thathas two levels: central and local. Each local government has a simple choice:

72 CHAPTER 4 MARKET-IMPEDING FEDERALISM
• foster growth, by limiting transfers of resources to state and formerstate firms and allowing new private firms to enter and grow, or
• kill growth, by transferring resources to old firms and/or preventingnew firms from being created.
Why would the government do the latter? Under the capture view it isstraightforward. Under the competition for rent view the government mightbe simply unable to prevent bribes and corruption. Both have the sameimplication for growth.9
Let y be the additional output under growth, and normalize this so italso stands for the additional amount of revenue available to the central andlocal governments under growth. Let b be the private benefits to the localgovernment of killing growth.10
Now turn to the central government. It is assumed to prefer growth. Ithas a carrot and a stick:
• Revenue Sharing. Central government can choose the extent of revenuesharing. Let a be the share of revenues from additional growth goingto the local government.11 If it chooses to foster growth it gets ay.Normalize so this is also how much it values growth. Note that it is expost a that is crucial.
• Political centralization. This is the stick. Central government controlswhether the local government can stay in power. Let px be the prob-ability that the local government stays in power if it kills growth, andpy is the probability it stays in power if it fosters growth. Let p =
pypx.
The value of p will clearly depend on how local officials are chosen.In China they can choose p freely. In Russia, there were elections forthese positions for the first ten years of transition,12 so p depends onhow effective the central government is at affecting elections.
9In Appendix F of Russia’s Virtual Economy we developed a model of governor deci-sionmaking and collusion with regional interests.10Under the capture view this could be transfers back from existing firms — investing in
relational capital. Under the rents interpretation it could be the cost to local officials oftrying to stop bribe-taking.11In practice this could include tax sharing, tax assignments and transfers. The key
point is that a represents what the region ends up with from increased growth, not howthe sharing takes place.12Putin eliminated direct elections for Governor and replaced this with appointments.
But even Stalin could not prevent officials from being captured by local interests.

4.3 BLANCHARD-SHLEIFER MODEL 73
— In other words, p is an index that measures the central govern-ment’s stick with regard to governors. The higher the value ofp the greater the penalty for not engaging in pro-reform policies.Notice that the stick is limited in the sense that the governor canonly lose his job.13
— it would be nice if p were greater than one, but if the center haslittle control over outcomes, and if capture is important, then itmay be less than one.
• Uniformity. Blanchard and Shleifer assume that regions do not differ.Hence, it makes sense to assume uniform values of a, p, and y.14
Under these assumptions the local government chooses growth if
pyay > pxb
orpay > b. (4.1)
Expression (4.1) says that the local government is more likely to choosegrowth the stronger the stick (high p), the larger the carrot (higher a), thelarger the growth potential (y), and the smaller the benefits of not reforming— either capture or the lower are the costs of reducing rents (b).15
Proponents of the federalist position often focus on the fiscal problems ofthe center, which renegotiates its stake and cannot commit.16 They arguethat market-preserving federalism provides better incentives and thus thedifferences in economic performance between China and Russia are explainedby differences in a.
13This is thus a Brezhnevite system of incentives rather than Stalinist incentive system.14This assumption is a result of their interest in comparing China versus Russia. This
assumption, however, has implications that we discuss below.15Notice that Blanchard and Shleifer do not subject b to any resource constraint, though
obviously, there is a limit to how much looting there can be. We follow their interpretationin the subsequent analysis.16What they ignore is an important structural difference. In China industry is not
geographically specialized, in Russia it is. So for insurance reasons, alone, the optimalcontract would have more fiscal federalism in Russia, hence lower a. For an empiricalanalysis of how fiscal transfers are related to structural differences in Russia, see [[11]].Hence, below, our focus on differences across regions.

74 CHAPTER 4 MARKET-IMPEDING FEDERALISM
Blanchard and Shleifer argue that the empirical evidence suggests that amay be lower in Russia than China, but that this is not altogether clear. Onecomplication is that there are actually three levels of subnational governmentsand most of the work looked at the bottom two.17 There certainly appears tobe a high level of fiscal transfers. There are few taxpaying regions and manyrecipients of subsidies. In China, the evidence seems to indicate a value of anear to 0.8. Although this may suggest that there is more redistribution inChina, Blanchard and Shleifer argue that differences in a are probably toosmall to explain the differences in performance.Blanchard and Shleifer note that p also differs significantly between China
and Russia. In China the Party still rules, so p is very high, could be enor-mous. In Russia governors are elected, and the center cannot always get theirway. So p is much lower, perhaps less than unity.This suggests that differences in p could offset large improvements in a in
the case of Russia. With high enough p a high a may not even be necessary.The model suggests that to the extent federalism has been important in
promoting growth in China, such federalism relied crucially on the power ofthe Party. Greater democracy could mean much lower p. Then we would seehow important are the differences in a.The model also suggests that in Russia the primary problem may be
political decentralization. Improvements in a may have little effect in thisenvironment. In other words, the economic benefits of federalism depend onsome degree of centralization.18
4.4 Loser Regions
The analysis in the B-S model is predicated on the idea that all regions couldbenefit from reform — the key problem is incentives. It is certainly true thatmarket reforms would improve efficiency in any region, and certainly acrossregions. But it is not at all clear that reforms will necessarily lead to growthin all regions. Obviously if y is small (or even negative) — if there are poor
17For example, Zhuravskaya finds marginal a to be as low 0.1 between the bottom twolayers of government [[15]].18"As best we can tell, the economic benefits of decentralization obtained from federalism
rely crucially on some form of political centralization. Without such centralization, theincentives to pursue regionalist policies are too high, and cannot be eliminated solelythrough clever economic and fiscal arrangements [[5, 178]]."

4.4 LOSER REGIONS 75
growth prospects — then it really doesn’t matter much about carrots or sticks.In the B-S model appropriate federalism always leads to pro-growth poli-
cies. If p is raised high enough it can always compensate for a low valueof y. B-S improve on the previous literature by showing that variation in ais insufficient to insure that federalism will be growth inducing. But theiranalysis is based on the assumption that y is always positive; that is, thereis always a pro-growth reform that results in higher income in the region.It is important to notice that a is bounded from above by unity. The B-S
model points out that there are thus limits to the carrots that the center canprovide to governors. Indeed, that may be the central point. Moreover, evenif a → 1 the actual carrot is limited by the size of y. If y is low, carrots arelimited.Notice that p on the other hand can go to infinity. But this is still
Brezhnevite incentives.19 The governor can always walk away — all he losesis his b.What B-S do not consider, however, is what happens if y < 0.Notice right away that if y < 0 then a policy of high a provides no carrot!
Indeed, in the case of a loser region governors would prefer to have a < 0.20
That is, they would want to be compensated for the loss — say, for example, interms of tax revenue — incurred by adopting the pro-reform policies. Havinga set of differentiated values of a is a move away from market federalism andtowards discretion. To stay within the context of this literature we keep a
19As opposed to Stalinist incentives which involve the Gulag and worse.20What BS do not answer is why local governments are more likely to be anti-growth
than the central government. They attempt to, arguing that larger units are less likely tobe captured and that big oligarchs may be less anti-growth than local ones. But this isnot all that satisfying.A key reason why some regional officials are anti-growth is that they preside over loser
regions. If they have a large share of dinosaurs, then policies that will be conducive togrowth may also be conducive to growth elsewhere. The key point is that restructuringin Russia has a serious regional aspect to it, the governors realize this, and so they actaccordingly. In this regard the comments of Viktor Tolokonskiy, Governor of NovosibirskOblast (August 2000) are instructive:
“Under conditions of total openness of the economy. . . , we here in Siberiashould not expect any serious investment activity at all. Our costs of pro-duction are too high, residential housing and office manufacturing facilitiesare too expensive, and our transport costs and wages are higher than insoutheastern Asia.”

76 CHAPTER 4 MARKET-IMPEDING FEDERALISM
fixed and then consider side payments that may be needed to get governorsin loser regions to adopt reforms.What does it mean for a pro-growth policy to induce y < 0? Consider a
region whose location-specific endowment is so poor that adoption of marketreforms would lead to a shift of labor and capital out of the region. For exam-ple, regions that are distant from markets and are in very cold regions, andwere over-industrialized in Soviet times. More important, market liberaliza-tion may require the value of capital to be written off. The correct marketresponse is for the region to shrink, for people to move out, and for y < 0.These are true loser regions.21 If subsidies are eliminated regional GDP (atleast as measured) goes down. So the net change in taxable resources goesdown. How does this change the analysis? We treat this in steps.
4.4.1 Inter-regional transfers
If in some regions j, yj < 0, it follows that pro-growth policies will not beadopted even if a "perfect" form of federalism is chosen. That is, even settinga = 1 and letting p → ∞, condition (4.1) will not be satisfied for the loserregion.22 One solution to this problem is to have a differentiated value of athat would allow a < 0 for loser regions. This is because the only way toimplement pro-growth policies in loser regions is to have the winner regionsbuy them off. But this means that a cannot be set equal to one for all regions,since winner regions will have to contribute to the treasury to compensatethe loser regions. Winners would have an a < 1.23
Consider the decision in loser region j. To choose pro-growth a sidepayment is required to offset the negative value of yj. For simplicity assume
21Lant Pritchett introduced the notion of "Zombie Countries" which captures a similarintuition on the international dimension. Consider a country that experiences a negativeshock to labor demand. Then, if "...the negative shock is large and other regions preventlabor mobility then potential ghost countries become unrealized ghosts or zombie coun-tries (the living dead) as nothing, besides out-migration, can prevent an extended andpermanent downward movement in wages." (Pritchett, 2004).22What would it mean for p→∞? This means that with 100% certainty the governor
is fired for not pursuing reform. But even this does not cause reform because no stick issufficient when y < 0. Now you need new kind of carrots (that come from outside theregion).23Although we do not analyze this, one could argue that foreign aid or a budget deficit
is required to maintain high incentives for winner regions. This allows the budget balancecondition to be broken. In our analysis, however, α is fixed.

4.4 LOSER REGIONS 77
a = 1 for this region. Thus for this region payj < b, so a special transfer, φ,is needed so that:24
p[yj + φ] > bj (4.2)
or
φ >bjp− yj. (4.3)
Thus φ is the minimum additional transfer payment required to get the loserregion j to choose pro-growth.25
Notice that in this case we must already alter the model from "perfect"federalism. Now there is a cross-region budget constraint to consider. Whileaj = 1 is still feasible for the loser region, in some other regions that arewinners we must have ai < 1 in order to finance the additional transfers.Suppose that there are only two regions. Then in region i (the "winnerregion") we must have φj ≤ (1 − ai)yi.26 The additional transfers are alsoconstrained by the requirement that i has to have the incentive to reform,which takes place if:
paiyi > bi. (4.4)
In the two-region case a necessary condition for reform to be viable isthat overall reform is efficient: i.e., yi > |yj|. That is, the marginal gainsin region i must be greater than the losses in the loser region. We assumethat this is indeed the case.27 Of course this is not a sufficient condition forreform to be chosen. But it is the interesting case if we want to analyze whenfederalism may impede reforms.
24In this formulation the additional transfer payment covers the loss and the governor’spayoff from pro-reform is then pa times the sum yj +φ. Alternatively, you could calculatethe additional transfer payment, bφ such that bφ + payi > 0.25Introducing φ is a simple way to make the net transfer to a region dependent on its
growth possibilities.26In the general case this constraint would beX
j∈Jφj ≤
Xi∈I(1− ai)yi
where J and I are the sets of loser and winner regions, respectively.27Indeed, we are quite certain that this is the case in Russia.

78 CHAPTER 4 MARKET-IMPEDING FEDERALISM
4.4.2 Inter-regional migration
Does the introduction of differentiated transfer payments — that satisfy con-ditions (4.3) and (4.4) — suffice to insure reform in both regions? Not neces-sarily. There are additional considerations for both loser and winner regionsthat result from the movement of factors caused by reforms. We considerthese in turn.
Migration: loser regions
If an additional transfer payment induces reform in a loser region it willshrink both demographically and economically. A governor who considersonly net income will choose reform. It may be, however, that governorsof loser regions are not indifferent to shrinkage. The status, prestige andother sources of wealth may depend on the size and importance of a region.Hence, from the viewpoint of the governor, reform may incur an additionalcost. Therefore, governors of loser regions may require payments larger thanφj to choose reform.
Migration: winner regions
Recall that pro-growth policies in j lead to out-migration to the winnerregion. So the excess labor moves to the winner region i. If productivityis higher in the winner region this will raise national income, and incomein region i. However, it is crucial to note that migration will also imposeadditional costs on region i. These costs take the form of congestion costs,given that land and infrastructure are given at any point in time.28 Thereare also losses to workers due to downward pressure on wages. Of courseemployers gain, but they are outnumbered by workers. On balance, the netgain could be positive or negative in the winner regions.29 If the net gainswere positive we would expect Moscow to embrace immigration from the rest
28Of course there are also benefits to certain owners of assets. We assume for nowthat the cost of congestion outweighs the gain to rentiers. Otherwise, it would be hardto understand why rich countries limit migration. The gains to international migrationdwarf all other known policies.29It could also be argued, for example, that the benefits take longer to accrue than the
costs. This may be especially true in Russia where any capital flow to the winner regionsis likely to be very gradual if at all.

4.4 LOSER REGIONS 79
of Russia.30 Instead, we see the opposite, which suggests that congestionscosts outweigh the benefits of immigration. Our assumption in the remainderis that net congestions costs are positive. Hence, let ηi be the net congestioncosts in region i.Now the governor of region i must look at two costs: the additional
transfer payment and the congestion cost. Pro-growth is supported by i onlyif
paiyi − ηi > bi. (4.5)
Clearly the size of ηi will matter. If there are many loser regions for eachwinner region congestion costs could be large. Taken to an extreme, if there asingle winner region andmany loser regions, the real and perceived congestioncosts could be enormous.31
Whether (4.5) will be satisfied or not is open to question. But even if it issatisfied, and the governor of i is willing to reform despite being forced to payan additional transfer to region j to reform, the payoff is now much lower.The congestion costs are reducing the payoff to the winner region. Theremay, however, be an alternative. What if the winner region could figure outa way to prevent the loser region from reforming?
4.4.3 Lights On
Suppose that Moscow can make a side payment to region j that keeps en-terprises open in j — keeps "the lights on" — and prevents out-migration.Region i no longer must bear congestion costs. It can reform without havingto suffer from region j0s reform.Let γyi = θ be the payment that i needs to make to keep the lights on
in region j and prevent out-migration. Then if θ > φ region j does notreform.32 In that case the payoff to region i under "lights on" is p(1 − γ)yi≡ pτyi because in this case there is no taxation (so ai = 1). Clearly forthis to be beneficial for region i we need pτyi > bi. For "lights on" to be
30Of course, labor productivity in the US and other leading industrialized countriesis so much higher than in India that world income would rise dramatically with a largereallocation of labor to high productivity countries. Citizens of rich countries do notappear to be sufficiently persuaded of these benefits to open their borders. See [9] forestimates of the potential gains.31Recall the quote that opens this chapter.32If j does not reform it does not receive the additional transfer, which means that i
does not pay the additional tax.
80 CHAPTER 4 MARKET-IMPEDING FEDERALISM
preferable to pro-growth with side payments we also require that:
pτyi > paiyi − ηi (4.6)
orηi > pyi[ai − τ ]. (4.7)
Notice what (4.7) implies. Lights on is preferred to pro-growth even if thetax rate is low, as long as the congestion cost is high.It is important to note that if (4.7) holds region i reforms while the loser
region does not reform, choosing instead to keep the lights on utilizing thepayments made by region i. Moscow reforms and pays Perm to keep thelights on and prevent out-migration. Over time, this leads to an even greaterdivergence in economic performance across these regions. This increases theincentive for migration were Moscow to turn off the lights. Hence, embarkingon this path may create a trap where the winner region has to continue tokeep the lights on.33
What we have demonstrated is that under reasonable conditions it makessense for loser regions to resist reforms if the transfer payments from winnerregions are sufficient. The key condition is that congestion costs in the winnerregion be high enough. Basically, the winner region pays a tax to keeppopulation in the loser regions. As long as economic performance in thewinner regions is not dependent on an inflow of labor this condition is likelyto hold. The fact that Moscow has utilized a residence permit system tolimit in-migration since the early days of economic reform suggests that thiscondition is likely satisfied.34
4.5 Fictitious Capital
We now add capital to the model. In particular, we examine what happens ifin some regions the capital stock has a nominal value greater than its effective33There is an extra effect from lights on that we have not analyzed. By encouraging
Perm not to reform Moscow not only saves congestion costs, it becomes relatively moreattractive for FDI. This happens at the cost of losing some domestic investment that couldcome from Perm. But it may well be that Moscow values the FDI much greater. And infact the concentration of FDI in Moscow has been increasing in recent times.34Moscow’s economic success is not predicated on cheap labor. It has utilized mi-
grant labor for construction, but continues to limit in-migration of permanent population.Moscow’s economic success has more to do with being the financial and economic capitalof the country, and headquarters of the companies that dominate the resource sectors.

4.5 FICTITIOUS CAPITAL 81
productivity. Hence, without subsidies the regional production structurewould unravel. We show that there are conditions where the winner regionswill prefer to keep the fictitious capital employed in the regions. "Lights on"in this setting involves maintaining the fictitious capital in place.Imagine that the economy is a chain of n enterprises (indexed by l =
1, ..., n) ala Blanchard-Kremer. Production is sequential, with each enterprise(l) using the output of the preceding enterprise (l − 1) as an input into itsproduction. The only difference is that each enterprise is in a different region,so there are n total regions as well. Production is sequential. Region 1produces a primary resource that is used in production by region 2, whichproduces an intermediate good used by region 3, etc. At the end of n stepsa good is produced that has value normalized to equal 1. Let the alternativevalue — export value — of the primary resource be c.In Blanchard-Kremer the value of producing in the chain is greater than
the alternative value of the primary resource. One of the problems theyanalyze is inefficient bargaining.35 In their setup only (1/2)n − c is left tosplit due to bargaining at all previous stages. Let us suppose, however, thatthe value of production in the chain is less than the alternative value of theproduct. That is, c > 1. Then it is best to shut down production in then− 1 regions, and finance consumption out of exports alone. Export of theprimary product is more efficient. Less is wasted in the chain. But if thefirst region defects and exports the primary product all the other regions aredevastated. It is quite easy to think of the first region as Tyumen Oblast
35Each unit in the chain must bargain with a supplier and a customer. There is Nashbargaining at each step, so that the surplus is split given the symmetry of the situation.The value of the surplus in the last stage (bargaining between the final producer and thelast intermediate producer) is 1. This follows because the value of the good at stage nis still zero. So the last intermediate producer gets one-half of the surplus, 1/2. Nowwhat happens at the prior stage? The surplus here is 1/2, so the next-to-last intermediateproducer and the last producer each get 1/4. Continue in this fashion and it followsthat the first intermediate producer gets (1/2)n. The surplus available to split at thefirst stage is (1/2)n − c, since the first producer must purchase the primary input toproduce. Clearly then we must have c < (1/2)n in order for there to be positive surplusto split. If c > (1/2)n, then the primary producer will prefer to sell to someone else.Notice that c does not need to be all that large to trigger defection. Suppose the primaryproducer defects. The magnitude of the fall in output? Notice that it could be as largeas 1 −
¡12
¢n. Thus rather meager private opportunities can cause a rather large fall in
output. We can interpret n as the level of complexity of production. As n increasesthe likelihood of defection increases exponentially. The problem is inefficient contractingcauses an inefficient output fall.

82 CHAPTER 4 MARKET-IMPEDING FEDERALISM
producing oil and all other oblasts as industrial regions that process oil intoproducts, for example.If the country is a federal region then the majority can force the winner
region to compensate. Notice that the efficient policy would be to tax theexport and rebate some amount to each citizen in the loser region. This,however, will not be the preferred policy of any Governor if agents are mobile.The reason is that if the enterprises are shut down in the loser regions thereis no reason to stay there. Households can take their checks and move away.This is socially efficient — why pay the costs involved in having people live infar-away regions if that is not necessary. But this is disadvantageous for theGovernor whose power and prestige is lost.The Governors will prefer an alternative policy of forcing the winner re-
gion to subsidize production by diverting some of the primary resource atbelow the export price ("keeping the lights on" once again). This adds valueto the fictitious capital. And it ties the subsidy to the region rather thanto the individual. From the perspective of the Governor this is significantlybetter. It keeps people in the region, and keeps them important.The obvious point is that subsidies are more efficient if they are individual-
specific rather than region-specific. But politically, in a federal region, thereverse is true.
"Lights on" versus Wage Subsidies
Rather than keep the lights on one could just pay a wage supplement toprevent migration. But that is likely to be costlier than lights on. In Germanythe FRG effectively paid such a supplement to keep the East Germans frommoving. In [[1, 46]] respondents point out that what makes them move is notwage differentials but absence of a job. “Wage differentials will not inducethem to move, but lack of work for a sufficiently long period will drive themto it.” This is a form of "lights on" policy. So the cost to Muscovites interms of subsidies to prevent moving is just the cost of keeping the lightson in the home factories. Hence, lights on may be cheaper for Moscow thanwage supplements.Another advantage of lights on over wage supplements is that the former
does not require that a major problem slowing migration: liquidity con-straints be removed.. Andrienko and Guriev [[2]] study migration acrossRussia’s regions and find that liquidity constraints are a major hurdle to mi-gration. Indeed, they find that for the poorest regions — our "loser" regions

4.6 HISTORICAL DIGRESSION 83
— an increase in income raises rather than reduces outmigration. Hence, fora winner region intent on preventing in-migration, lights-on is bound to bepreferred to wage subsidies..
Summary
The problem with loser regions is that they impose a negative externalityon winner regions. So regions likely to win from reform would still prefer topay loser regions not to. For example, Moscow is better off with Perm notreforming even as Moscow does.This may sound unrealistic. But Moscow has propiska and winner regions
subsidize activity in loser regions all the time. So we observe that people stayin Perm, even though income differences are huge, reform does take place inMoscow, and dinosaurs stay open in Perm. Perm governors are happy andMoscow governors are happy.
4.6 Historical Digression
The preceding analysis has shown that with "lights on" the governors of bothwinner and loser regions may be happy. But this equilibrium is inefficient.Moreover, one might expect that this unhappy status quo could unravel aspeople vote with their feet. One of the key advantages of federalism is, infact, the competitive discipline on regional policies imposed by mobility ofthe factors of production. This mechanism is often forgotten in the literatureon market-preserving federalism because of the emphasis on center-regionrelations. But once we consider regional differences this is in fact paramount.Essential to the "lights on" equilibrium are restrictions on mobility that
prevents it from unraveling. It is important to understand that restrictionsto mobility is not a new problem in Russia. Indeed, it has been a crucialelement of Russian economic development for something like 500 years. Itis useful to recall Domar’s (1970’s) analysis of the rise of serfdom in Russia,which begins with a summary of Kliuchevsky that goes something like this[pp. 18-19]:
1. From about mid-1400s, Russia fights wars that eventually require amilitary too big to support by taxes.

84 CHAPTER 4 MARKET-IMPEDING FEDERALISM
2. Government solves problems by assigning land to servitors in exchangefor service.
3. But system breaks down after mid-1500s when peasants start to migrateto newly conquered areas in east and southeast.
4. Under pressure from serving class, government steadily restricts peas-ants’ freedom, resulting in serfdom by mid-1600s.
"The economist would recast Kliuchevsky’s account as follows:The servitors tried to live off rents (in one form or another) tobe collected from their estates. But the estates could not yielda significant amount of rent for the simple reason that land inRussia was not sufficiently scarce relative to labor, and ironically,was made even less scarce by Russian conquests. The scarcefactor of production was not land but labor. Hence it was theownership of peasants and not of land that could yield a incometo the servitors or to any non-working landowning class." [p. 19]
The two essential ingredients for the development of serfdom are: (1) "ahigh land/labor ratio" and (2) "the government’s determination to create alarge class of servitors."Taking this analysis to the current problem of Russia, our story, then,
is that the governors and enterprise directors of low-productivity (cold andremote) regions are the "servitors" of today, their physical capital (manufac-turing assets) in those locations is the "land" they received from the state,the workers in those manufacturing plants are the "peasants," and the op-portunity to move back west to Moscow and so on is the analogue to theopening up of new and fertile land in the Volga valley in the mid-1500s.Therefore, a strict analogue would be:
The peasants [workers] migrate eastward [westward], leaving theservitors’ [governors’] land [factories]with a shortage of labor. Un-der pressure by the servitors [governors], the government restrictsthe peasants’ [workers’] mobility, resulting in serfdom.
But can we really consider loser regions to have high capital-labor ratios?The key point here is to distinguish actual capital and fictitious (virtual) capi-

4.6 HISTORICAL DIGRESSION 85
tal.36 In loser regions there are enterprises that appear to be capital-intensive(the τ -effect once again). They actually are lossmaking, but subsidies andtransfers allow them to keep producing. In a virtual sense they have highcapital-labor ratios. But if labor left the regions this would destroy the pre-tense that these enterprises are productive, and the pretense that the capitalhas value.37 Hence, to maintain the pretense the governors need the labor tostay put.But the important parallel is the one between Domar’s two essential con-
ditions then and the ones today. The combination of (1) the high manufac-turing capital/labor ratio and (2) the government’s commitment to preservethe status of the governors and local capital-owners are leading to a newserfdom.38
Discussion
Because the Soviet system scattered industry across regions lots of fictitiouscapital remains in regions that happen to be the median voter — the colddistant regions. This is important because it affects decisions about the paceof reform made in the center. It would be much less of a problem if theseregions were just poor; in that case income transfers would be a sufficientpolicy response. If the region were poor and of little political weight policycould provide transfers that also support mobility.Problems occur when regions are less transparently poor. It is the pres-
ence of fictitious capital which provides the alternative method of subsidy. Ifregions have fictitious capital specific types of subsidies — such as low energyand transport costs — can be used to make the assets appear to have value.This, of course, ends up wasting more resources. But it is far superior for thepolitical prospects of local officials. These subsidies make regions appear tobe viable, or at least less disadvantaged than they actually are. And thesesubsidies necessarily involve addiction so that they represent claims to fu-
36There is an important contrast between real capital and ficitious capital. The formerrequires a compensating differential to locate in the east. Existing capital may be sunkbut new investment would follow labor to warmer regions. Indeed, if labor migrated andthe capital-labor ratio led to a rise in the real wage this would make it more difficulty toearn rents in the east, further inhibiting new investment in the east. But fictitous capitalis sunk.37The reason is that subsidies can only be attracted if there is labor — population — in
the regions.38See [[7]] for an analysis of Russia’s industrial feudalism.

86 CHAPTER 4 MARKET-IMPEDING FEDERALISM
ture resources. The optimal policy involves subsidies that dissipate and thendisappear over time. This is clearly not the case for addiction.
4.6.1 Federalism versus Efficiency
Our argument suggests that there is in Russia a conflict between two keygoals of reform: democratic federalism and economic efficiency. The reasonis that Soviet federal regions did not evolve as a result of economic activity.Rather they are the result of administrative efforts at occupation and control(by the Russian Empire), and Soviet efforts to invest independent of costconsiderations. The Soviets achieved a balance of economic activity acrossregions through its peculiar pricing system and subsidies (though hidden bythe circus mirror).But why did an arbitrary system of investment and location decisions
lead to systematic inefficiency in regional borders? One might suppose thatif decisions were arbitrary regions would be inefficient in their own ways butnot in any systematic way. This ignores, however, that Soviet location deci-sions (and Tsarist administrative policies) ignored the economic implicationsof size and cold. And size and cold are not randomly, but systematicallydistributed across the Soviet landscape. This creates a systematic regionalbias in terms of economic efficiency. The relative economic advantages ofregions are not randomly distributed across the federation. They are almostperfectly correlated with cold and distance.39
When liberalization took place in Russia the systematically-biased natureof political boundaries becomes critical. During Soviet times regions werenot economic units that had to cover their costs — they were administrativeunits supporting centralized decisionmaking. With market federalist reform,however, the situation is drastically changed. Regions must cover their costsnet of fiscal transfers. To offset this governors seek subsidies to supporttheir regions. Because each unit has an equal vote, and because regions areheavily skewed towards inefficiency the median region votes for pretense andsubsidies.One important feature of federalism is its role as a diversification and
insurance mechanism. There should be gains from trade across regions thatare subject to idiosyncratic shocks. When regions experience adverse shocksincome and tax payments to the center fall. Other regions that did not
39The exception being especially resource rich regions such as Tyumen or Yakutia.

4.7 CONCLUSION 87
experience adverse conditions can pick up the slack. But this insurancemechanism cannot work if shocks are systematic. Federalist insurance canarise from a veil of ignorance. Regions can expect to not be net contributorsor net beneficiaries. But this will not work if there are clear winner and loserregions. Then subsidization replaces insurance. Insurance does not work ifthe risks are systematic and predictable federalism will break down, or youget chronic fiscal transfers that contradict reform.We see this effect in the United States where the equal numbers of sen-
ators results in perpetual agricultural subsidies. These would not survive ifstates voted according to population or if state boundaries were re-drawnto account for changes in relative economic importance.40 Notice, however,that US states did not form for arbitrary reasons. At one time they reflectedcomparative advantage.41 So the inefficiencies are not systematic. The prob-lem in Russia is that they are, and that the median governor is very far fromthe reform end of the spectrum.Because the Soviet system equalized industry across regions you have
lots of fictitious capital in the regions which are the median voter — the colddistant regions. And plenty of labor is associated with that fictitious capitalto act as hostages to continue addiction.
4.7 Conclusion
During the 1990’s the inefficiency of federalism in Russia was paramount.With locally elected Governors the owners of fictitious capital provided nat-ural allies in the effort to attract rents. One of Putin’s first policies uponcoming to power was to reduce the authority of Governors, primarily by elim-inating direct elections. But even centrally appointed governors tend to becaptured by the interests in their own regions.Because of Russia’s Soviet-era territorial legacy, it is not enough for allo-
cation of assets to be made on the basis of market-economy logic alone. Italso has to be made from a national point of view. That is, the owners ofassets have to be able to consider, without prejudice, the costs and benefits
40Imagine the US when all dying industries just happened to be in the Dakotas, Kansas,and other plain states. If the rust belt was not in the northeast, but in the less populatedplains states.41When the Constitution was adopted agriculture was still the dominant industry in
America.
88 CHAPTER 4 MARKET-IMPEDING FEDERALISM
of location as well as all other aspects of potential profitability. Financial oli-garchs who were truly national oligarchs — freed of territorial ties–would beable to do that. They would chose to invest in Western locations. The ironyis that the oligarchs are the one positive force in terms of viewing the econ-omy in national terms, but the concentration of power has negative impactsin terms of democracy.42
42But when the oligarchs’ financial capital is married with regional relational capital,the result is doubly destructive.

Bibliography
[1] Akerlof, George, Andrew Rose, and Janet Yellen, "East Germany in fromthe Cold: The Economic Aftermath of Currency Union",UnderstandingBrookings Papers on Economic Activity 1:1990, pp. 1-105.
[2] Andrienko, Yuri, and Sergei Guriev, "Determinants of Interregional Mo-bility in Russia: Evidence from Panel Data," Economics of Transition,Volume 12 (1) 2004: 1-27.
[3] Andrienko, Yuri, and Sergei Guriev, "Understanding Migration in Rus-sia," NES/CEFIR Working Paper, 23, November 2005.
[4] Blanchard, Olivier, and Michael Kremer, "Disorganization," QuarterlyJournal of Economics,
[5] Blanchard, Olivier, and Andrei Shleifer, "Federalism With and WithoutPolitical Centralization. China versus Russia," IMF Staff Papers, Volume48, Special Issue, December 2001.
[6] Domar, Evsey, "The Causes of Slavery and Serfdom: A Hypothesis,"Journal of Economic History, 30, 1, March 1970: 18-32.
[7] Ericson, Richard E., "The Russian Economy: Market in Form but Feu-dal in Content," in Michael Cuddy and Ruvin Gekker, ed., InstitutionalChange in Transition Economies (London, UK: Ashgate, 2002), pp. 3-34.
[8] Ickes, Barry W. and Gur Ofer, “The Political Economy of StructuralChange in Russia,” European Journal of Political Economy̧ vol., 22, issue2, June 2006: 409-434.
[9] Klein, Paul and Gustavo Ventura, "TFP Differences and the Effects ofFactor Mobility," Working Paper, Penn State University, July 2004.
89

90 BIBLIOGRAPHY
[10] Mikhailova, Tatiana," Essays on Russian Economic Geography: Mea-suring Spatial Inefficiency, Ph.D. Dissertation, The Pennsylvania StateUniversity, 2004.
[11] Narayan, R. Badri, An Examination of Intergovernmental Transfers inthe Russian Federation, Ph.D. Dissertation, The Pennsylvania State Uni-versity, 1999.
[12] Pritchett, Lant, "Boom Towns and Ghost Countries: Geography, Ag-glomeration, and Population Mobility," Center for Global Development,Working Paper 36, February 2004.
[13] Qian, Yingyi, and Barry R. Weingast, "Federalism as a Commitment toPreserving Market Incentives," Journal of Economic Perspectives, 11, 4,Fall 1997: 83-92.
[14] Smith, Adam, An Inquiry into the Nature and Causes of the Wealth ofNations, New York, Modern Library, 1937.
[15] Zhuravskaya, E., , “Incentives to Provide Local Public Goods: FiscalFederalism, Russian Style,” Journal of Public Economics, Vol. 76, No. 3,2000: 337—68.

Chapter 5
Human Capital
5.1 Introduction
There are some parallels between Russia’s physical capital and its humancapital. There are similar pitfalls, bear traps. Measured simply by numbersof people and years of education, Russia has a very large human capital stock.The question is what is happening to the quantity, and more importantly,the quality of that stock.Russia’s population is shrinking. On average, 840,000 more Russians have
died than were born each year since 1993. The country is now on track fora population of 130 million by 2030 and 110 million by 2050. This declinein population has alarmed the country’s leaders. Of particular immediateconcern is the declining number of draft-age males. Within five years, thenumber of 18 year-olds will be only half what it was five years ago. Butmore generally, both the political leaders and many citizens are convincedthat Russia’s shrinking population is a threat to the country’s economicdevelopment.Here’s the bear trap: this focus on numbers does not address – and can
even undermine – the true concern, which is the quality of Russia’s humancapital. A proper human capital approach looks at not only the numbersof the population but their quality. That quality includes skills acquiredthrough schooling and on-the-job experience and the state of health of theworker. An under-appreciated element of the quality of human capital is itsgeographical location. Even more than physical capital, human capital canbe disadvantaged by climate and remoteness. More fundamentally, human
91

92 CHAPTER 5 HUMAN CAPITAL
capital needs to be seen in terms of the appropriateness of its match withthe other factor of production, physical capital.Issues such as population health, age structure, education, living stan-
dards, and even location are therefore the subjects of an investigation intohuman capital.We will refer also to demography. Human capital and demography are
closely related and partially overlapping concepts. Demography is about howmany people there are, their ages, and how healthy they are. The size of thepopulation is determined by three factors: how many people are born, howmany die, and how many people (net) move into the country from outside.The age structure is important because it allows one to forecast the size ofthe future labor force as well as how many other people (the ones too youngor too old to work) that those productive members will have to support. Theratio of productive component to nonproductive is the dependency ratio.There are some main stylized facts about Russia’s demographic and hu-
man capital situation:
1. Russia’s population is shrinking, more and for a longer time than almostany other country’s today.
2. Russia’s working age population in particular is collapsing. The numberof young and old people each productive worker will have to support(the “dependency ratio”) is going to rise sharply.
3. Birth rates are down. Russia shares this trend with other countries.
4. Death rates are up. This the most anomalous trend of all. Not onlyare they much higher than those of the rest of the world, but they havegrown worse in Russia over recent decades.
5. The overall health of the population in all age groups is poor. This isof course connected to mortality.
6. The stock of skills is in question. The education system appears to beperforming poorly, despite high levels of education per worker.
7. The phenomenon of “de-urbanization” is reported.
We will organize our discussion of Russia’s human capital around thesestylized facts of (1) population size; (2) age structure; (3) fertility; (4) mortal-ity; (5) health; (6) education; and (7) location. For each of these elements of

5.2 POPULATION SIZE 93
Figure 5.1: Russia’s Population, 1897-2010
human capital, we will illustrate the situation, mention the proposed causesof the trend (discuss the extent to which the causes of the trend can be identi-fied), discuss the consequences, and ask if remedies can be suggested. Causes,consequences, and remedies are of course connected. We are interested inknowing whether there are specific identifiable causes and consequences of atrend. But we are also concerned with whether it reflects something morefundamental that exists independent of the demographic phenomenon we areexamining. In other words, is it a symptom rather than a factor in itself.As in the previous chapters on physical capital, our goal is to find if thereare margins of investment in human capital which offer promise of raisingRussia’s economic growth in the future.1
5.2 Population Size
Russia’s population has been shrinking without interruption since 1993. Fewother countries have lost as much of their population in recent years as Russia.Between 1995 and 2009 Russia lost a larger share of its population than allbut five other countries in the world.
1The most comprehensive summary of Russia’s current demographic condition is Eber-stadt (2010). Our descriptive statistics in the following are based on many of the sameand similar sources as Eberstadt. Our interpretations of the causes and consequences ofthe phenomena and trends often differ from his, however.

94 CHAPTER 5 HUMAN CAPITAL
Figure 5.2: US Census Projections of Russia’s Population to 2050
Closer inspection, however, suggests that the problem of population lossmay not be so much a problem of Russia’s policies during this period butone of its Communist legacy. Of the 19 countries of the world that lostany population at all in these years, 18 were former Communist countriesof Eastern and Central Europe.2 Not all the successor states of the USSRlost population. The Muslim countries of Central Asia grew. But here,too, the Communist legacy seems important, since even though they aregrowing, Muslim former Soviet countries have population growth rates thatare considerably lower than Muslim countries without a Communist past.Compared to the other non-Muslim republics of the former USSR, Russia
did not fare so poorly. Combined, those other non-Muslim former Sovietrepublics (Armenia, Belarus, Estonia, Georgia, Latvia, Lithuania, Moldova,and Ukraine) had a population loss rate that was 56 percent higher thanRussia’s.3
Not only has Russia lost population for 17 years in a row, but it is pro-jected to continue along that negative growth path for decades to come.The US Census Bureau presents a particularly dire picture, forecasting asteady drop to below 110 million by 2050. (See figure 5.2) The Russian StateCommittee on Statistics (ROSSTAT) is not as pessimistic. They offer three
2The sole exception was Lesotho, which lost only 0.2%.3The world leader in population loss, incidentally, was NATO and EUmember Bulgaria,
which shrunk more than twice as fast as Russia.

5.2 POPULATION SIZE 95
Figure 5.3: Natural Population Increase/Decrease, 1960-2010
scenarios – high, low, and middle – and their forecasts only extend to 2030.But even the lowest scenario is higher than the US forecast for 2030. Thehigh scenario is some 20 percent higher.Russia has actually seen a net increase in migration into the country over
the period when its overall population shrank. In other words, its populationdynamics are driven mainly by its fertility and mortality trends: birth ratesexceed death rates. The net result of births and deaths is referred to as the“natural” increase or decrease of the population. Within a brief period of afew years before and after 1990 that net figure shifted from plus one milliona year to negative one million a year, as is evident in figure 5.3.Russia’s negative population growth has alarmed its leaders, its citizens,
and many observers in the West. It is perhaps the major component of theproclaimed demographic “crisis” in Russia. Surely, something strange is hap-pening in Russia. This sustained population decrease is indeed anomalous.And we will describe other demographic trends that are even more unusual,sometimes bewilderingly so. But our concern is economics. And no matterhow unusual a phenomenon is, we still need to ask, “so what?” How does itmatter for economic growth? In the context of this report, to deserve thelabel of “crisis” the trend in question must be shown to have strong negativeconsequences for Russia’s future economic development.Is that the case for negative population growth? Why should the Rus-
sians or anyone else, care about population size per se? Prestige might be

96 CHAPTER 5 HUMAN CAPITAL
Figure 5.4: Population and GDP Across Countries
a reason. Russians – both the leadership and many of its citizens – areconcerned about Russia’s status as a “Great Power.” For them there is noquestion that a necessary attribute of Greatness is Bigness. At the time of itsdisappearance, the Soviet Union was the third most populous country in theworld, considerably bigger than the United States. Russia today is in eighthplace, and for the prestige-minded the prospect of slipping further down inthe ranks is bitter. Of course, population size is but one dimension of “big-ness.” Territory is another. Russia is the largest country in the world byterritory. But what about economic size? There is a rather obvious positivecorrelation between population size and total wealth: big countries are bigeconomically; and Russia fits in precisely where one would expect. Russia isthe eighth largest country in the world by both population and total wealth(see figure.5.4).
Is there a relationship between population growth and measures of eco-nomic performance, e.g., growth in per capita GDP? Is a growing populationa boon or bane for efforts to improve per capita GDP? A simple scatter plot(figure 5.5) of these two indices measured over the period of 1970-2008 showsthat there is a correlation, but that it is negative: the slower the country’spopulation growth, the faster its per capita GDP growth. This follows ofcourse from the neoclassical growth model, where the steady state capital-labor ratio and the level of per-capita income are inversely related to the

5.2 POPULATION SIZE 97
Figure 5.5: Population Growth versus Per Capita GDP Growth
population growth rate.4
The bottom line is that while concerns about population size and popu-lation growth may be important for the exponents of Great Power thinkingin Russia today, there is no reason to think that the country needs to havea growing population if its main goal is economic welfare. In fact, effortstargeted to promote population growth in itself may be at odds with thegoal of increasing individual wealth and welfare.
5.2.1 Age Structure
There are several concerns about the age structure of Russia’s populationthat are worth consideration. One is that Russia’s working age populationis expected to shrink at an even faster rate than the overall population (seefigure 5.6).5 Another age-structure concern is the cohort of women of child-bearing age. The number of babies born in the future depends on the number
4And it is also apparent in the growth regressions we report in chapter 2. In theLevine-Renelt equation and in our own variation the coefficient on population growth wasnegative.
5Note that the definition of “working age” can and does vary. We will discuss this later.Here we use a range of 20-64 years for both men and women, in contrast to the Russianlegislated definition of 16-59 for men and 16-54 for women.

98 CHAPTER 5 HUMAN CAPITAL
Figure 5.6: Russia’s Working Age Population
of women capable of giving birth as well as the number each one is likely tobear (fertility rate). If the forecasts of Russia’s population made by the USCensus Bureau are borne out, it is apparent why it is likely that births willdecline. Those forecasts show the cohort of women aged 16-39 decreasing byover one-third by 2030.
A third specific widely discussed age-structure concern is the number of18 year old males, since these represent the pool of draft-age men. Fiveyears ago Russia had more 18-year olds than ever before in its history. Butwith the next ten years that number may drop to the lowest in 100 years.Adding to the issue is the ethnic composition of the draft pool (a growingshare of Muslims). This prospect has produced near-panic among militaryestablishment. They propose increasing the pool of draft-eligible men byextending the age of selection for service to 30, and so on. The effects ofsuch a measure on the civilian economy would be huge. The unavoidablereality of a very much reduced pool of men is more likely to lead to moreradical reform. The military doctrine already has abandoned the idea of amass “mobilization army.”
All this said, the most important aspect of age structure of the populationis the ratio of productive members of the population (those active in the labor

5.2 POPULATION SIZE 99
Figure 5.7: Number of Women of Childbearing Age (15-39), actual and pro-jected
Number of 18 Year-Olds in Russia, 1900-2050
1,000
2,000
1900 1920 1940 1960 1980 2000 2020 2040
Thousands
GKS estimatesIDB estimates
Clifford G. Gaddy, The Brookings Institution, May 2006
Figure 5.8: Number of 18 Year-Olds in Russia, 1900-2050

100 CHAPTER 5 HUMAN CAPITAL
force) to others not in the labor force. This is the dependency ratio.6 Whenthe dependency ratio is low economies experience a "demographic dividend,"as savings per-capita will be higher. When the dependency ratio rises growthprospects deteriorate since the same pool of workers must support a largerpool of young and old.Since working age differs, the definitions of “young” and “old” necessarily
also differ. But if we define the working age segment of the population as allmen and women between the ages of 20 and 64, the picture of past, presentand future dependency ratios for Russia is given in figure 5.9.
Figure 5.9: Dependency Ratios
It is clear that the dependency ratio in Russia is increasing from therelatively favorable ratios of the mid 2000’s period. By this measure theproductive part of the population has seen its burden reduced for nearly 20years or so. But the burden is now about to rise steeply. How does thepicture for Russia compare with other countries’? In figure 5.10 we displaythe dependency ratios of the US, Sweden, Australia, Japan, and Russia. Inaddition we show the forecast for Russia. This shows that Russia is notgoing to be entering totally uncharted territory. Japan and others have haddependency ratios that high before. The problem for Russia is that it may
6The importance of the dependency ratio for growth prospects of developing countrieshas been studied by Bloom and Williamson (1997) and Bloom, Canning and Sevilla (2001),who emphasized the role of the demographic dividend in explaining the performance ofthe Asian Tigers.

5.2 POPULATION SIZE 101
be reaching such levels of the dependency ratios as lower levels of per-capitaincome than other countries.
Figure 5.10: The Dependency Ratio in Selected Countries and Forecasts forRussia
It is important to note that there may be a difference in how the depen-dency ratio is composed. The “burden” part – the numerator of the ratio– is the sum of young and old. Eberstadt (2009) points out that the old inall societies consume more than the young and that therefore their burden isgreater. This trend is likely to become even stronger with improvements inmedical care, which focus expenditure on the last years of an extending lifespan. A breakdown of the aggregate dependency ratio into separate ratiosfor young and old might therefore be instructive.The data in table 5.2 shows that even in the pessimistic scenarios of
population dynamics published by the US Census Bureau, it would not beuntil after 2030 that Russia’s dependency ratios exceed those of other devel-oped countries today. The question for Russia is then whether it can reachper-capita income levels consistent with those dependency ratios by then.
5.2.2 Mortality
This is the most anomalous trend of all. Some of these statistics can onlyevoke wonder and worry. Figure 5.11 below shows that death rates (deaths

102 CHAPTER 5 HUMAN CAPITAL
Table 5.1: Composition of Dependency RatiosY oungWA
OldWA
Old+Y oungWA
Sweden (2008) 40% 30% 70%
Japan (2009) 31% 38% 69%
USA (2007) 46% 21% 66%
Russia (2009) 33% 20% 53%
Russia (2030) 34% 36% 70%
Russia (2050) 36% 49% 85%
Note: YOUNG = ages 0-19; OLD = 65 and over; WA (workingage) = 20-64.
Historical data from the Human Mortality Database [www.mortality.org]. The figures
for Russia for 2030 and 2050 are based on population projections by the US Census Bureau
Table 5.2:
per 1,000 population) rose almost continuously in Russia from the early 1960suntil the mid-1990s. Only a few years in the mid-1980s were an exception.7
Since 1995 the picture has been mixed. The modest good news is that deathrates have declined for the past 5-6 years, although they still remain nearlydouble what they were a half century ago.It is especially male death ratesthat alarm. The picture is striking. It is hard to exaggerate how bad maledeath rates are. Russian males in prime working age – 25 to 55 – are dyingat rates 4 to 4.5 times higher than Americans, and 7 to 11 times higher thanSwedes. But the biggest discrepancy of all is among the youngest groups,those in their 30s. Russia has a death rate for 30-34 year-old men that isaround five times that of the US and a whole order of magnitude higher thanScandinavia, the Netherlands, and Japan. The last time Sweden had a deathrate as high as Russia’s today for its 30-34 year olds was 1876 (except forthe single year of the 1918 epidemic). Russian 26 year old men die at thesame rate as Swedish 56 year olds.Equally strange is that the death rateshave increased so much over time, and have been increasing since 1960 at the
7This break in the trend is generally attributed to Mikhail Gorbachev’s anti-alcoholcampaign.

5.2 POPULATION SIZE 103
Figure 5.11: Death Rates, 1950-2010
Figure 5.12: Death Rates for Men Age 30-34, Russia and the US, 1960-2008

104 CHAPTER 5 HUMAN CAPITAL
latest. Figure 5.13 shows that the deterioration of mortality among Russianmales has been highest in the prime working ages of 35-50.The reasons for
Figure 5.13: Male Death Rates by Age Cohort, 2000-2005 Compared to 1960
the high mortality are surely complicated.8 Life-style choices play a key role.All too many Russian men are drinking themselves to death.9 Smoking isanother factor, shown in a recent study to be comparable in effect to drinking.10
Whatever the causes, the deaths of so many men in these ages representsa significant loss of Russia’s potential labor force. One way to gauge howbig the loss is, would be to take a country such as Sweden as a benchmark.We follow the current Russian definition of working age – 16-59 for menand 16-54 for women – and calculate how many potential working years
8See Denisova (2009) for a recent independent analysis and discussion of other studies,Russian and Western.
9Exactly what is causing the heavy drinking itself, however, is not clear. On theone hand, the real (inflation-adjusted) price of vodka today is roughly one-tenth of whatit was in 1988 under Gorbachev. Some of that relative cheapening of alcohol occurredimmediately after abandonment of Gorbachev’s anti-alcohol campaign. But much of ithappened since 2000. Add to that the rise in workers’ wages in the past few years and wehave the following fact: in 1999, the average industrial worker could buy 28 liters of vodkafor his monthly wage. Today, he can buy 78 bottles. This would suggest that incomes andrelative prices have played a role in rising rates of alcohol consumption and (therefore)rising death rates. But in her micro-analysis Denisova (2009) finds that the relative priceof alcohol is a statistically insignificant factor in mortality.10Denisova (2009).

5.2 POPULATION SIZE 105
are lost in aggregate due to excess deaths (the excess of Russia’s age-specificdeath rates for males and females over Sweden’s). We include the other so-called BRIC countries (Brazil, India, and China) for further reference. Asfigure 5.14 shows, Russia is losing some 18 percent of working years for mencompared to less than three percent for Sweden. This is quite a dramaticdifference.
Figure 5.14: Potential Working Years Lost by Deaths in 15-65 Age Range,Percent of Maximum
If measures could be taken to reduce the gap in excess deaths amongworking age men and women, that would, of course, expand the pool ofproductive workers. It could help compensate for the declining size of birthcohorts in the future. If nothing else were changed, it would also mean thatthe dependency ratios would improve (be reduced). However, this does nottake into consideration the fact that an improvement in survival rates amongthose of working age will likely also be accompanied by an improvement forolder ages as well. Therefore the ratio of OLD/WA might not improve at all.That would imply that moving to a “Swedish” survival pattern would notimprove (reduce) that part of the dependency ratio. Recall from the Tableabove that Russia’s ratio of OLD/WA today is 0.20; Sweden’s is 0.30.If, then, improved survival does not lead to lower dependency ratios, it is
clear that the only way to raise per capita wealth for the entire population

106 CHAPTER 5 HUMAN CAPITAL
is to make each working age person more productive. This brings us backto the economic growth exercise. In particular, we must move beyond merenumbers of workers to consider the other attributes of human capital, thosethat reflect quality: health, education, and location. These are considered inthe next three sections.
5.3 Health
The evidence for the effects of health on economic growth is decidedly mixed.The main arguments for including measures of health in measures of humancapital are summed up in the introductory section of a recent volume entitledHealth and Economic Growth:
“Good health raises levels of human capital, and this has a pos-itive effect on individual productivity and on economic growthrates. Better health increases workforce productivity by reducingincapacity, debility, and the number of days lost to sick leave,and increases the opportunities an individual has of obtainingbetter paid work. Further, good health helps to forge improvedlevels of education by increasing levels of schooling and scholasticperformance.”11
Morbidity (illness), of course, is closely connected to and correlated withmortality. Indeed, empirical work on health frequently uses measures of mor-tality – life expectancies, survival rates, death rates – as proxies for healthbecause the data is more readily accessible. Strictly speaking, the conceptsare different and at least in theory they might have different implicationsfor economic analysis. The death of an individual will reduce the actual orpotential stock of human capital (if the person is of working age or younger).If that person were instead to fall victim to a permanently debilitating illnessbut survive, there would be the same loss of human capital but in additionthere would be an extra burden as the person also now joins the ranks of thenonproductive. In that sense morbidity can be worse than mortality.12
11Lopez-Casanovas et al., 2005.12This could be another example of the τ -effect. Suppose that Russia has significantly
higher morbidity than other countries. Since Russian has high educational attainmentit accumulates significant human capital. But if morbidity is high much of this humancapital cannot be used. So measured human capital is higher than actual, effective, humancapital.

5.3 HEALTH 107
The sticking point is that while better health might lead to greater pro-ductivity on the part of the individual worker (following the apparently obvi-ous line of argument presented in the quote above), the overall societal effectcan be different. For one thing, better health usually means better sur-vival rates for the dependent part of the population. Therefore, the greaterwealth produced by the individually more productive worker has to be sharedamong more dependents. There is also a so-called capital dilution argument:as more workers survive, a given stock of physical capital is shared amongmore workers.Research on the contribution of good health to economic growth in the
1990s and early 2000s seemed to show that health has a strong positiveimpact on economic growth, at least for developing countries (and over thelong period of Western economic development). At the macro level thereis no question of a correlation between health and wealth. The issue is thecausality. Does health promote wealth, or does wealth lead to better health?Or are both the result of unmeasured third factors? A number of more recentstudies argue that improved health leads to little, no, or even negative resultsfor economic growth.13
The data for this research was drawn primarily from developing countries.The reason for this is that the variation in both health outcomes and growthperformance is higher amongst these countries, so the effects should be easierto tease out in this setting.14 Bhargava et al. (2001) used a cross-section ofpoor and rich countries. They found a positive effect of increased adult sur-vival rates (ASRs) on GDP growth rates. But the effect was small, even forthe poorest countries: a 1 percentage point increase in ASR was associatedwith a 0.014 percentage point increase in the growth rate. (In other words,increasing the ASR from, say, 40 percent to 60 percent – a very substantialimprovement – would result in an extra 0.25 percent of annual growth.)More important for our analysis, Bhargava et al. concluded that the posi-tive effects of ASR on economic growth rates disappeared entirely for richercountries. For countries at Russia’s current level of per capita GDP, the neteffect of raising the survival ratio was negative.Perhaps a more serious problem for analyzing Russia in this context of
wealth versus health is that Russia already enjoys a level of wealth (per
13See Acemoglu and Johnson (2007), Ashraf, Lester, and Weil (2008), and Weil (2007).14This is important because research shows how hard it is to find a statistically significant
effect.

108 CHAPTER 5 HUMAN CAPITAL
capita GDP) that would seem to be thoroughly unwarranted given the poorhealth of the population. A scatter plot of adult survival ratios (ASR) versusper capita GDP (figure.5.15) illustrates the point. Russia appears to be ahuge outlier. One way to view Russia’s position in figure 5.15 is that given
Figure 5.15: Adult Survival Rate versus GDP per-capita
Russia’s GDP it should have a much higher ASR. The most likely reason isthat Russia’s resource wealth has given it a per-capita income much greaterthan its social capital would suggest. This suggests that the impact on GDPper-capita would be small from improving Russia’s health It is not at all clearthat per capita incomes would rise very much.At the micro level it is apparent that one of the channels through which
better health and survival ratios exert a positive impact on wealth is byinducing individuals to invest more in their education. This is why manyanalysts presume that better health will lead to faster growth. The factthat this effect does not appear in the macro data is surprising, but robust.Moreover, as we will see below, Russians already invest in education at avery high rate. The problem for Russia is not the measured quantity ofeducation, but rather its quality. That is not something likely to be affectedby improvements in healthIn sum, health investment is properly treated not as investment at all
but as consumption. As virtually everyone would agree, “Good health is a

5.4 EDUCATION 109
crucial component of overall well-being.”15 But that is it. As counterintu-itive as it may seem, there is no evidence that Russia’s growth prospectsare impaired by its abysmal health performance. Hence, we conclude thatimproving health is not a silver bullet for ensuring Russia’s future economicgrowth. While it almost certainly can be justified to spend money to improvecitizens’ health for welfare or humanitarian reasons, it would be a mistake toassume that this is an investment that will “pay for itself” by contributingto more economic growth. Russia could spend great amounts on preventiveand curative health care, enlightenment, and so on, and succeed in reducingdeaths, and yet find that economic performance fails to improve at all be-cause the factors that led to high mortality in the absence of the remedies arestill there, and it is those factors, not the mortality per se, that was causingbad performance.
5.4 Education
As in the case of physical capital investment, human capital investment isassumed to be appropriate to what the market demands. We do not worrythat measuring the stock of human capital by accumulated investments willlead to systematic errors. This is because in normal economies, we do notworry that a country will accumulate “the wrong education” on a system-atic scale. But in the Russian case, this is an important consideration, sincethe Soviet economy demanded a different kind of education stock, one ap-propriate for a planned economy. Moreover, even if this inherited stock wasovervalued, is this disappearing as a problem? This will be true only tothe extent that the post-Soviet education system is properly suited to themarket. As we shall explain, the forces that preserve legacies in relation tophysical capital, operate in a similar, if not stronger, manner with regard tohuman capital. Hence, education investments currently being made are stillbeing overvalued.Education has traditionally been the main measure of the quality of hu-
man capital. Human capital is a stock of “skills.” Those skills are typicallymeasured by years of education. This is primarily the result of a lack of al-ternative data, and for most countries this does not introduce serious biases.But in Russia this is problematic. The education component of Russia’s hu-
15Lopez-Casanovas et al. (2005), p. 3.
110 CHAPTER 5 HUMAN CAPITAL
man capital is mismeasured. If the quality and appropriateness of educationare not matched to the needs the quantity is overestimated.
There is much we do not know about the quality of Russian education.Eberstadt (2010) cites statistics on Russian youths’ poor performance insubjects compared to other countries (the so-called PISA study). But theseare averages for the entire population. We know that there is great inequalityin so many other indicators, from health, life expectancy, income. It is likelythat this carries over to educational quality. Perhaps extraordinarily highlevels for some substantial part of the population are being pulled down byvery low levels among others. The issue for productivity is then whetherhaving a population that is moderately well-educated across the board isbetter than having one that is generally less well educated but with a pool ofsuperstars. To put it differently, which is better for growth: having a criticalmass of Sergey Brins or just a general average level of education? Growththeory has not, as of yet, dealt with the distribution of human capital. Andthere does not appear to be any empirical studies that answer that questioneither.
There may be other considerations — equity is one — for desiring broad-based educational improvement. These may lead to increased welfare, andto the sustainability of democracy. But there is little evidence that thesefactors affect a country’s long-term growth potential, despite what may seemto be an intuitive connection.
In general, however, one could conclude that for an economy with a tight-ening supply of labor (the “shrinking” potential labor force) as Russia ap-pears to becoming, education programs that maximize ability to adapt, tochange occupational track, may be more important than absolute levels ofeducation that is suited only to specific technologies. Indeed, if having ahigher level of specialized education makes an individual less likely to “re-tool” oneself for a new occupation, it may be the case that more educationis worse, not better.
The argument here is consistent with addiction. The dinosaur factory in-herited from the Soviet Union commands rents precisely because it representsso much sunk investment. This is investment not only in physical capital —the machines, buildings, and so on — but also in human capital, includingeducation. In fact, the argument for allotting more rents to the Soviet-eradinosaur factories is strengthened by the argument that “the workers cannotmove, and they cannot change occupation.” The more that has been spent

5.4 EDUCATION 111
to develop the current structure, the greater the claim for future rents.16
“Appropriateness” is important concept. Human capital enhances pro-ductivity if it is complimentary to physical capital. If human capital is in-appropriate for what is needed it will not contribute to production. Theeducation might have been the right one for the Soviet system, with its in-centives, but not right for a market economy.Individuals of course can and have indeed chose different tracks as the
market economy has developed. For example, there has been a big shifttowards business and economics training in Russia. This represents a positivedevelopment. But the overall level of education has not improved.There is a one important difference between mismeasured human capital
and mismeasured physical capital. The latter means that less is returnedfor a given level of sacrifice. It must means that you have actually investedless than you thought, and that more sacrifice is needed to get what youexpected to earn. In the case of human capital the problem is different. Hereit is not a question of the level but of the type. With misallocated humancapital more is not a solution. Two humanities PhD’s cannot substitute foran accountant.In the case of human capital what is needed is reform of the educational
system to produce the right kinds of human capital — those that are demandedby the market economy. The problem is that the addictive nature of thesystem makes it hard to reform education.
5.4.1 Location
We examined the general problem of mislocation of factors of productionin Chapter 3. The temperature per capita (TPC) index we introduced inthat chapter was intended to give us a crude instrument to estimate theextent of mismeasurement (the τ factor) that might be attributed to spatialmisallocation of Russia’s capital. The TPC applies to human capital as wellas physical capital. (In fact, of course, the TPC is a measure of humanpopulation in different regions, because population was used as a proxy forall economic activity.). Thus if we studied Russian economic growth using ahuman capital augmented production function, say of the form:
Yt = Kαt H
βt [AtLt]
1−α−β (5.1)
16Addiction and subsidization are thus both related to ignoring the dictum that sunkcosts are sunk.
112 CHAPTER 5 HUMAN CAPITAL
where α, β ∈ [0, 1], α + β ∈ [0, 1], and t denotes time. Here K and H arephysical and human capital respectively, and AL is productivity augmentedlabor. If we measure the contributions to growth with this model, and ifthere is a measurement problem with human capital, then we will attributeinferior results to low productivity. Just as we argued that τ < 1 oughtto be applied as a discount factor to K to control for mismeasurement ofphysical capital, we require a similar factor for human capital. We wouldhave something of the form:
Yt = τKKαt τHH
βt [AtLt]
1−α−β (5.2)
where τK, τH ∈ [0, 1] are discount factors to offset the impact of spatial andlegacy effects on the measurement of asset stocks in Russia.Applying the τ -factor argument to human capital, we can say that one of
the reasons Russia’s human capital is less than it appears to be is because itis located in the wrong place. But the primary problem is that the stock ofhuman capital is less effective than its aggregate measure implies.
De-urbanization?
There has been some discussion of the trend that "Russia is becoming de-urbanized."17 Indeed, by aggregate statistics alone, the trend would appearindisputable. Between 1991 and 2009, Russia’s official statistics on the per-centage of the population classified as urban show a declining urban share in42 of the country’s 78 regions. In the country as a whole, the urban sharedeclined from 73.8 percent to 73.1 percent.However, it turns out that the decline in the number reflects changes
in the definition of urban versus rural – changes apparently implementedunevenly and inconsistently throughout the country.18 The statistical declinedid not reflect a shift of population out of cities to the countryside.A more meaningful concept to measure urbanization or deurbanization
in the Russian context would be the population dynamics of large cities. Ifone looks at cities that had a population of over half a million in 1991 (a
17Eberstadt, pp. 26ff.18The case of Sverdlovsk oblast is a good example. Between 2004 and 2005, its urban
share allegedly dropped from 88 percent to 83 percent, a fact which, if true, would haveinvolved a sudden mass migration of city dwellers to the countryside. What actuallyhappened was that the regional statistics agency reclassified some 70 “population points”as rural rather than urban. No real population shift took place.

5.5 CONCLUSION 113
total of 33 in all), that group has on net gained population in absolute termssince then. Admittedly, most of the gain was due to Moscow. Not includingMoscow, these large cities showed a modest loss in population (-1.8 percentin total over 18 years). But that is a substantially slower rate than Russia’soverall population loss in the period (-4.4 percent). That means that Russiadid not "de-urbanize" in this sense. Relatively speaking, Russia urbanizedby 7.8 percent between 1991 and 2009.But of course the real problem is that some of this urban growth was in
cities that should not have grown. Russia’s problem of shrinking cities, ifthere is one, is not that the trend represents “de-urbanization.” In one senseRussia badly needs to “de-urbanize.” That is, it needs to shrink cities that aremislocated. Moscow is the bright spot. But it should be even brighter. Whencities live Novosibirsk, and Omsk, and Perm lose population it is nothing tolament. They are far larger than they by rights should be.
5.5 Conclusion
To deal with physical capital problem you deal with addiction. To deal withhuman capital education problems you need to fix education policy. The cur-rent educational system limits mobility and so fuels lock-in. This reinforcesthe persistence of educational legacies that are not conducive to a marketeconomy. A better educational system would enhance labor mobility andthen would make it hard to keep labor in the regions. If you fixed the ed-ucational system it would exacerbate regional differences because graduateswould want to locate in the winner regions. The current educational sys-tem is more likely to produce young people for loser regions than a reformededucational system.So the current educational system supports industrial feudalism. Hence,
it is not a surprise that industrial feudalists support the current educationalsystem. The current system helps to produce more claims for addiction.Each new miseducated young person is a forty-year claim on resources for aloser region. This is the primary force that makes education is so hard toreform.


Bibliography
[1] Acemoglu, Daron, and Simon Johnson. “Disease and Development: TheEffect of Life Expectancy on Economic Growth.” Journal of Political Econ-omy. Vol. 115, No. 6, 2007
[2] Ashraf, Quamrul H., Ashley Lester, and David N. Weil. “When DoesImproving Health Raise GDP?” National Bureau of Economic ResearchWorking Paper 14449, October 2008.
[3] Bhargava, Alok, Dean Jamison, Lawrence J. Lau, and Christopher Mur-ray. “Modeling the Effects of Health on Economic Growth,” Journal ofHealth Economics, Volume 20, Issue 3, May 2001, Pages 423-440.
[4] Bloom, David and Jeffrey Williamson, “Demographic Transitions andEconomic Miracles in Emerging Asia” NBER Working Paper, 6268, 1997.
[5] Bloom, David, David Canning, and Jaypee Sevilla, “Economic Growthand the Demographic Transition,” NBER Working Paper, 8685, 2001.
[6] Denisova, Irina. Mortality in Russia: Microanalysis. Centre for Economicand Financial Research at New Economic School. Working Paper No. 128,March 2009.
[7] Eberstadt, Nicholas. Russia’s Peacetime Demographic Crisis: Dimen-sions, Causes, Implications. National Bureau of Asian Research, 2010.
[8] Lopez-Casanovas, Guillem, Berta Rivera, and Luis Currais. Health andEconomic Growth. Findings and Policy Implications. MIT Press, 2005.
[9] Weil, David N., “Accounting for the Effect of Health on EconomicGrowth,” Quarterly Journal of Economics, August 2007, 122 (3), 1265-1306.
115


Chapter 6
Conclusion
6.1 Introduction
In this report we have analyzed the potential barriers to Russia’s long-termgrowth, and the mistaken policy directions that might result from misunder-standing those barriers. Our argument throughout this report has been thatit is too easy to misdiagnose the sources of Russia’s problems. In a generalway it is easy to understand the nature of the barriers to Russia’s long termgrowth. The Russian economy is less efficient than it should be, its mar-ket institutions are less effective than they can be, and its political economyis more problematic than it should be. But the key analytic problem is tounderstand the specific sources of these problems.It is critical, for example, to understand the nature of Russia’s institu-
tional problems. We can think of two types of such problems:
• "typical set"— efficiency loss due to weak property rights, corruption,etc.
• legacy preserving institutions
It is easy to collect information about the problems that make up the"typical set." Russia always fares very low in corruption rankings (takinghigh as good). Problems with property rights enforcement are legion. Butthese problems are symptoms of deeper underlying problems. Focus on the"typical set" makes it seem that these problems can simply be overturnedwith sufficient will. But they stem from deeper causes. They are the out-growth of legacy-preserving institutions.
117

118 CHAPTER 6 CONCLUSION
Russian institutions serve to preserve a legacy of misallocation. Theypreserve the poor location choices and the poor use of assets that is endemicin Russia. This makes the bad equilibrium self-reinforcing. Normally, whenassets are woefully misallocated the decisions will be undone over time. Newinvestments and new activities will reallocate resources. The costs would thendissipate over time. In Russia this does not happen. Its bad institutionsprovide incentives to preserve the misallocations, and its resource wealthmakes it feasible to preserve them.The problem is that the symptoms (like corruption) cannot be fixed with-
out attacking fundamental factors. As long as Russia remains a resourcedependent country the key element of its political economy will be its rentmanagement system (see Appendix).This report has been about “Bear Traps.” That is, our aim has been to
warn about what not to do, as we emphasized the kinds of seemingly self-evident policies that would have either no effect at all on growth or evennegative effects. It might appear that we have offered nothing in the way ofa positive agenda of what should be done? While a comprehensive attemptto draw up such an agenda would require a separate study, in fact, there aresome basic points that flow from what we have said so far.A fundamental theme of our findings is that Russia’s problem with its
stocks of physical and human capital, at present and in the future, is lessabout the pure quantity of the capital and more about its quality. And thedimension of quality that counts the most is the capacity of that capital toreact and adapt to new and changing circumstances – in short, its capacityfor reallocation. The goal of investment policy as well as institutional reformis to make physical and human capital as potentially mobile as possible.The critical difference is between what we referred to as installed cap-
ital versus new capital. This applies to both the physical capital and tothe dimension of human capital associated with education. Enhancing thestocks of physical capital and educational capital is important for growthbut only if conditions exist to free these investments from the constraintsof the inherited structures. Otherwise, big investment programs could endup making Russia’s problems worse. They would perpetuate the inheritedeconomic structures and thus inhibit opportunities for long-term growth.And as far as investment in health and human capital is concerned, we
showed that such investment is unlikely to produce any positive growth effectsat all. In fact, spending to improve health in Russia is properly regarded notas investment at all but as consumption. Improving Russia’s human capital

6.1 INTRODUCTION 119
is important for welfare, but it should not be seen as a solution to Russia’slong-term growth prospects.Another of our findings was that even under optimal conditions for in-
vestment, any dream of creating a “non-oil” Russia that could perform aswell as today’s commodity-based economy is unrealistic. The proportion ofGDP that would have to be invested in non-oil sectors is impossibly high.This suggests that the only realistic future for Russia is one that continuesto be based on the commodity sectors.Yet, contrary to conventional views, this does not have to be a negative
outlook. Russia would, however, need to take a radically different approachto its energy and commodity sectors than at present. Right now, Russia isconstrained by its addiction to commodity rents. In this environment, oiland gas abundance reinforce the inherited structures at the expense of entryand thus creation of new structures. This means that it is impossible totruly modernize Russia without modernizing the oil and gas sectors. Theyneed to be in the forefront. Truly modern oil and gas companies wouldnot support addiction. They would not participate in the various informalschemes to share their rents with dinosaur enterprises. The playing fieldwould be leveled for new entrants in all sectors of the economy. Meanwhile,oil and gas companies themselves would be relieved of the heavy burden ofinformal taxes and political constraints on their business activity. With theoil and gas companies in the lead for modernization, Russia would become agenuine energy superpower, an “energy superpower in depth.”


Chapter 7
Appendix
121