beans in the farming system and domestic economy...
TRANSCRIPT
1
BEANS IN THE FARMING SYSTEM AND DOMESTIC ECONOMY OF UGANDA: A TALE OF TWO PARISHES
Soniia David
Occasional Publications Series, No. 28
October 1999

Correct citation: Soniia David, 1999. Beans in the Farming System and Domestic Economy of Uganda: A Tale of Two Parishes. Network on Bean Research in Africa, Occasional Publications Series, No. 28, CIAT, Kampala, Uganda.
i
PREFACE This volume, the twenty-eighth in a working document series that serves research on common bean (Phaseolus vulgaris L.) in Africa, reports on beans in the farming system and domestic economy of Eastern Africa, using two regions of Uganda as case studies. The objective of this study, initiated by CIAT, was to provide guidance on types of baseline data required for measuring social and economic impact of new crop varieties in Africa. A second objective was to demonstrate the value of monitoring impact in a few selected impact monitoring sites, an approach which can also accommodate a cross-commodity focus and lead to the more effective use of the scarce time of the region’s social scientists. Lessons learned from characterizing bean production systems and farmers are of value to social scientists in other countries besides Uganda, and to those working on crops besides beans. The Pan-Africa Bean Research Alliance (PABRA) serves to stimulate, focus and coordinate research efforts on common bean. PABRA is organized by CIAT in collaboration with two interdependent sub-regional networks of national programs: the Eastern and Central Africa Bean Research Network (ECABREN) and the SADC Bean Research Network (SABRN) for southern Africa. Working documents include bibliographies, research reports and bean network discussion papers. These publications are intended to complement two associated series of Workshop Proceedings and Reprints. Further information on bean research in Africa is available from: Pan-Africa Coordinator, CIAT, P.O. Box 6247, Kampala, Uganda. Regional Coordinator, Eastern and Central Africa Bean Research Network, P.O. Box 2704, Arusha, Tanzania. Regional Coordinator, SADC Bean Research Network, P.O. Box 2704, Arusha, Tanzania.
ii
ACKNOWLEDGEMENTS The author would like to thank all who contributed in various ways to this study. Louise Sserunjogi provided helpful input on food consumption issues. Harriet Nafuna of Mission:Moving Mountains and Nathan Mayeku in Mbale and John Kasaga and Charles Kigongo of World Vision-Ssii (Mukono) were invaluable in providing an introduction to the study communities. The expert contributions of all enumerators and my research assistant, Sarah Kasozi, are gratefully acknowledged. The author is grateful to the Canadian International Development Agency (CIDA), the Swiss Agency for Development and Cooperation (SDC) and the United States Agency for International Development (USAID) for financially supporting the work reported here.

iii
TABLE OF CONTENTS INTRODUCTION 1 SOCIO-CULTURAL CONTEXT 2 METHODS 3 RESULTS: 3 Demographic profile of surveyed households 3 Household resources 4 Beans in the farming system 5 Bean varieties 7 Seed sources 7 Household organization of production 8 Bean production in 1994 9 Bean sales and income 10 Food consumption patterns 13 Bean consumption 15 CONCLUSIONS 18 Figure 1: Map showing study districts and counties 20 Figure 2: Principal food crops grown in Nabongo and Lugala 21 Figure 3: Traditional cash crops grown in Nabongo and Lugala 22 Figure 4: Historical changes in the proportion of population growing
major crops, Nabongo 23 Figure 5: Historical changes in the proportion of population growing
major crops, Lugala 24 Figure 6: Ranking of bean production constraints, Nabongo and Lugala 25 Figure 7: Mean quantities of beans harvested in 1994 26 Figure 8: Mean quantities of beans sold in 1994 27 Figure 9: Mean earnings from beans in 1994 28 Figure 10: Bean availability calendar 29 Appendix 1: Cropping calendars, gender division of labor and crop prices 30 Appendix 2: Crop prices 33 Appendix 3: Varieties and farmer preferences 34 Appendix 4: Bean consumption 36 Appendix 5: Impact indicators 37 REFERENCES 38 PUBLICATIONS OF THE NETWORK ON BEAN RESEARCH IN AFRICA 39

1
BEANS IN THE FARMING SYSTEM AND DOMESTIC ECONOMY OF UGANDA: A TALE OF TWO PARISHES
Soniia David
CIAT, Pan-African Bean Research Alliance, P.O. Box 6247, Kampala, Uganda
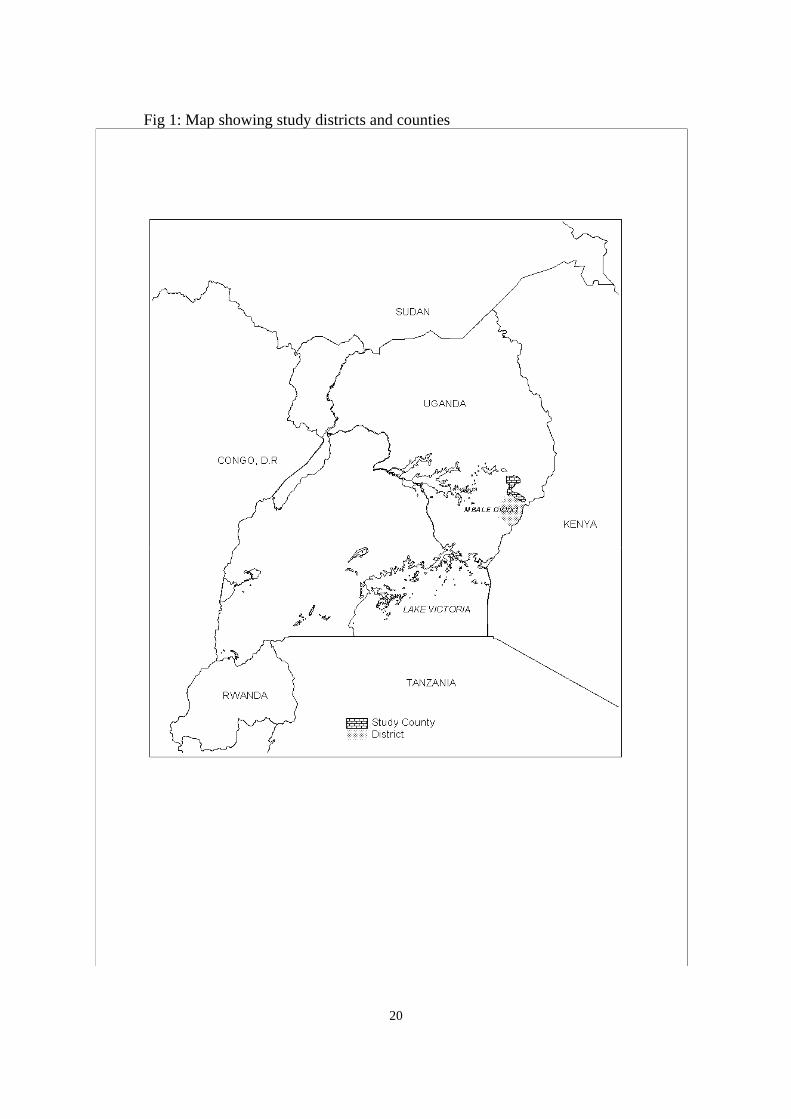
INTRODUCTION The common bean (Phaseolus vulgaris L.) plays a paramount role in human nutrition and market economies throughout Eastern Africa. In this region, beans provide the second most important source of protein after maize and the third most important source of calories after maize and cassava (Pachico, 1993). But the predominance of local varieties1 susceptible to numerous biotic and abiotic stresses contributes to significant economic losses. The response to this situation by bean researchers has been commendable: between 1992 and 1996, 69 cultivars were released and disseminated in eight Eastern African countries (David, 1997). While information is readily available on the performance advantages of introduced varieties, documenting their impact at farm level presents a greater challenge. Several factors account for the paucity of bean-related impact studies, including the expense of ex-post impact assessment, limited and scattered seed dissemination, a shortage of social scientists in national agricultural research systems (NARS) and the absence of baseline data against which to assess change. The objectives of this paper are twofold: 1. to provide a detailed description of the bean producing environment in two Ugandan parishes prior to the introduction of two cultivars released by the National Research Organization (NARO), K132 and K1312; and 2. to highlight the types of data needed for measuring social impact, an under-researched area in the wider field of impact assessment. Impact assessment seeks to measure the effects, positive and negative, of technological adoption, whether from an economic, social or environmental perspective. While recognizing that all three perspectives are inextricably linked, social impact assessment specifically seeks to document the effects of technological change on: the well-being of a target population, social organization, and social relations at the community, household, intra-household and individual levels. The two study locations of Nabongo Parish in Mbale District and Lugala and Namukuma Parishes3 in Mukono District (Figure 1) were selected to represent different market orientations of bean farmers. Beans are an important cash crop in Nabongo, while farmers in Lugala grow the crop largely for subsistence. The locations also differ with 1 Local varieties refer to farmers’ traditional varieties (landraces), while modern varieties are those developed by the formal research system. 2 These varieties were bred by CIAT under the names CAL 96 and MCM 5001 respectively. 3 The study was initiated in Lugala Parish but later expanded to neighbouring Namukuma Parish. For ease of reporting, throughout this document reference is made to Lugala although data were collected in both parishes.

2
respect to infrastructure and agroecological and demographic conditions (Table 1), factors hypothesized to affect the adoption of crop varieties and other agricultural technologies. Throughout this paper, variations within the production system and domestic economy will be analyzed along two dimensions: location and household wealth status. Table 1: Biophysical and demographic characteristics of study parishes
Nabongo
Lugala/Namukuma
Sub-county and county
Muyembe, Bulambuli
Ngogwe, Buikwe
Study villages
Bwikhonge, Bumulaha and Bunywaka
Nakawali, Kimbugu, Lwala (Lugala) Namukuma, Bulunda (Namukuma)
Altitude (masl)
1078
1189
Dominant soil type
Ferralsols
Nitosols
Rainfall (mm)
1222
1319
Population
7,526
3,987
Households in study villages (June 1995)
304
213 (Lugala)
194 (Namukuma) Population density (km2)
186
151
Accessibility
Good
Poor
Source: Republic of Uganda, 1992 SOCIOCULTURAL CONTEXT The Bagisu are the predominant ethnic group in Nabongo, while the Baganda inhabit Lugala and Namukuma. Both communities are predominantly Christian. The basic social unit consists of the household, a non-residential unit whose members are defined by their relation to the head4. In Nabongo, both public (freehold) and traditional (usufruct rights) land tenure systems are in place. In Lugala, a confused amalgamation of various forms of traditional (mailo, kibanja, customary tenants) systems and public tenancy have resulted in a situation of land insecurity. Geographically, the two study locations are quite diverse. Nabongo lies in a fertile valley near the foothills of Mount Elgon in the eastern part of the country, 37 km from the district capital, Mbale. Study villages have easy access to the main Moroto-Mbale road and farmers sell their produce in three nearby periodic markets: Kamu, Bunangaga and Bunambutye. Due to 4 Since the unit of analysis in this study was the farm plot, women in polygamous units who typically live in their own homes and cultivate independently of their husbands were defined as independent households.
3
relatively high population density, the settlement pattern consists of closely located homesteads separated by farm plots. Lugala and Namukuma Parishes lie close to Lake Victoria, approximately 35 km from Mukono Town (56 km from Kampala, Uganda's capital) in the central region. Secondary forests in this remote area attract logging concessions. Since feeder roads leading to the study villages are virtually impassable during the rainy season, access and marketing are difficult. Farmers take their produce to markets in Nkokonjeru and Kampala, although the cost of public transport to Kampala is prohibitive5. Traders sometimes frequent the area to purchase coffee, cassava, cocoa, vanilla and other produce. Characteristic of the hilly, forested typography of central Uganda, homesteads are located far apart. METHODS Both informal and formal methods of data collection were used. Participatory rural appraisal techniques were used in group meetings to identify farmers' bean varietal preferences, and to collect information on various aspects of the farming system and on their expectations of impact from the new bean varieties. In June 1995, a formal survey was conducted of 158 randomly selected bean growing households (80 in Nabongo and 78 in Lugala). The sample was stratified by village and wealth on the basis of categories derived from wealth ranking exercises. The survey investigated the cropping system, bean yields and varieties, income from beans, the gendered nature of decision-making in production and marketing and men’s involvement in cultivating beans on personal plots. Women were the principal respondents during the formal survey, alone (60%) or with their husbands (28%). Twenty married women farmers in Nabongo who produced beans on personal plots were surveyed in 1997 to investigate the situation of independent female producers. In June 1995 (a postharvest period when beans are in abundance) and September 1996 (a period of relative bean scarcity), information was collected on bean consumption patterns. Sample sizes for the food consumption surveys were 80 and 78 households in Nabongo and Lugala, respectively, in June, and 40 and 48 households in September. Persons responsible for the provision of food were asked to recall all foods prepared for household members over the previous 7 days and how much beans they usually cooked, among other questions. The analysis describes consumption frequency and the amount of energy and protein derived from beans. No attempt is made to assess overall dietary adequacy or comment specifically on the contribution of beans to child nutrition. RESULTS Demographic profile of surveyed households A total of 423 and 481 people lived in surveyed households in Nabongo and Lugala. On average, households in Lugala were larger than those in Nabongo (a mean of 6.1 persons compared with 5.3; P≤.05). Richer households in Nabongo, but not in Lugala, were significantly larger than poorer households (P≤.005). The majority of surveyed households in both locations were headed by a resident male over 30 years of age. Men in polygynous marriages comprised 13% of the sample in Nabongo and 8% in Lugala. The high proportion of de jure female-headed households in Lugala (23%) can be attributed to AIDS-related
5 A return trip cost Ush 4000-6000. US$1=Ush 960.

4
mortality and high male outmigration. Farming was the predominant occupation among household heads (84% in Nabongo and 80% in Lugala). Other key occupations among heads of households in Nabongo were teaching and salaried employment (4% each), whereas fishing (6%), trading and pitsawing (5% each) were important in Lugala. Household resources There were significant differences in both locations between households on the basis of wealth (Table 2). The poorest households tended to have fewer members, cultivate smaller farms, depended less on hired labour and were more likely to be headed by a woman or elderly person. On average, farm size was smaller in Lugala than Nabongo, with 36% of households compared to 24% of Nabongo households cultivating less than an acre in the first season. In Nabongo, but not in Lugala, farm size was positively associated with wealth. Table 2: Household differentiation by wealth on selected socioeconomic characteristics
(percent of households)
Nabongo
Lugala
Wealthy (n=16)
Middle (n=35)
Poor (n=29)
Wealthy (n=14)
Middle (n=33)
Poor (n=31)
Sex of household head Male Female Single individual
94 6 0
86 6 9
66 24 10
86 7 7
79 18 3
48 45 7
Age of household head 20-30 31-50 51+
19 44 38
31 40 29
35 21 45
21 43 36
45 39 15
17 40 43
Household size
7
5
4
7
6
6
Farm size in season A (ha) ≤ 0.4 0.4-2 2+
6 69
25*
20 77 3
38 62 0
29 64 7
33 55 12
42 48 10
Hires labor
88**
57
45
36
18
16
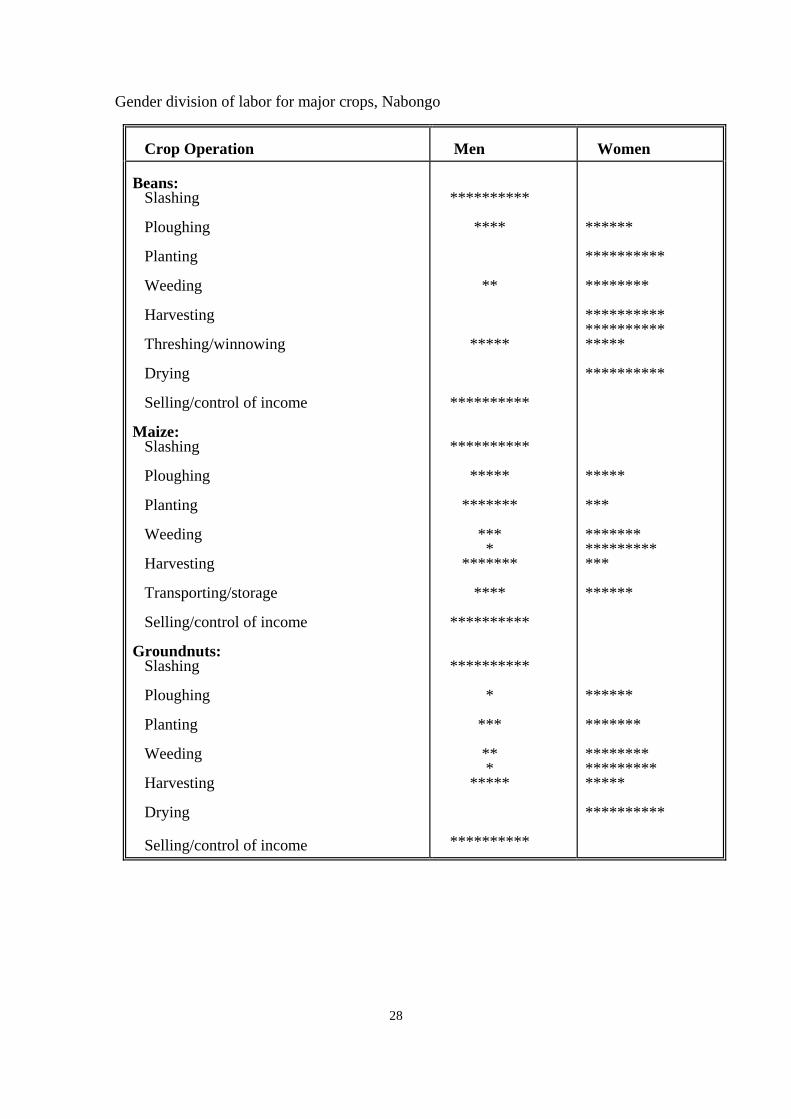
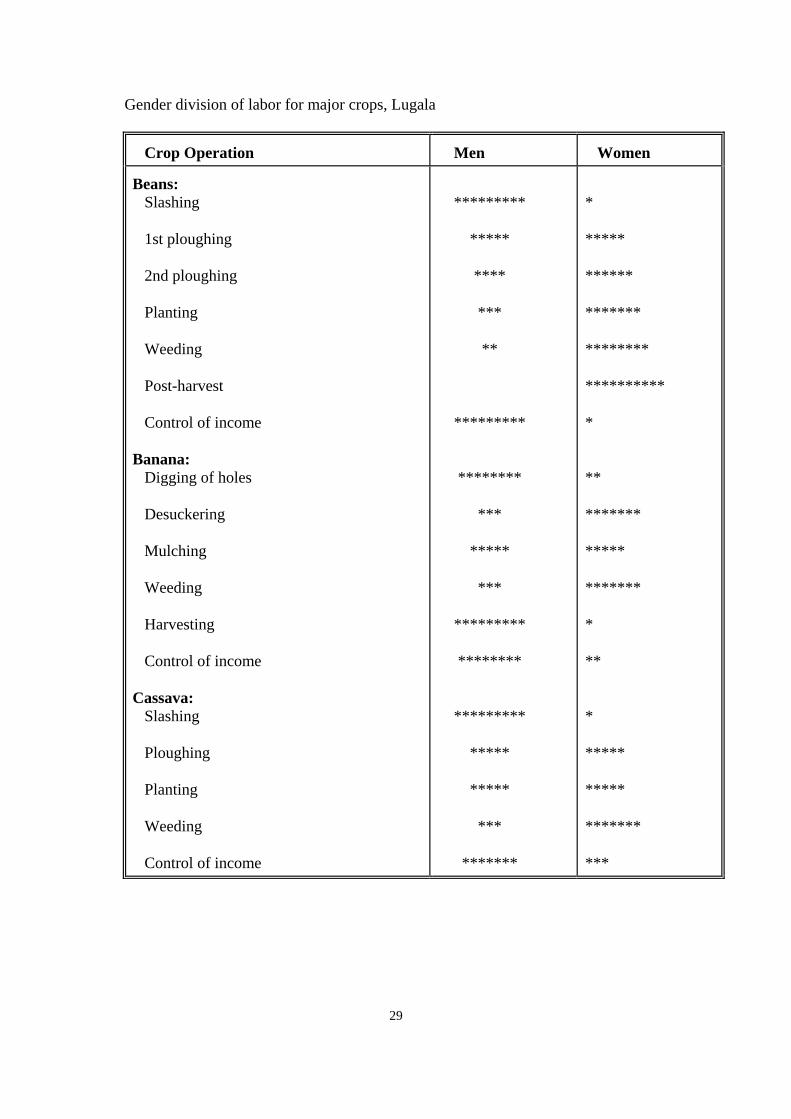
*P≤.002; **P≤.02 Household labor force involved in bean production, as shown in Table 3, did not vary significantly by locality. The average number of men and women regularly involved in bean production was equal in both locations (1.1). Nevertheless, female input in field and postharvest tasks exceeded that of males in both locations (see Appendix 1 for the gender division of labor), although male involvement in bean production has increased in Nabongo
5
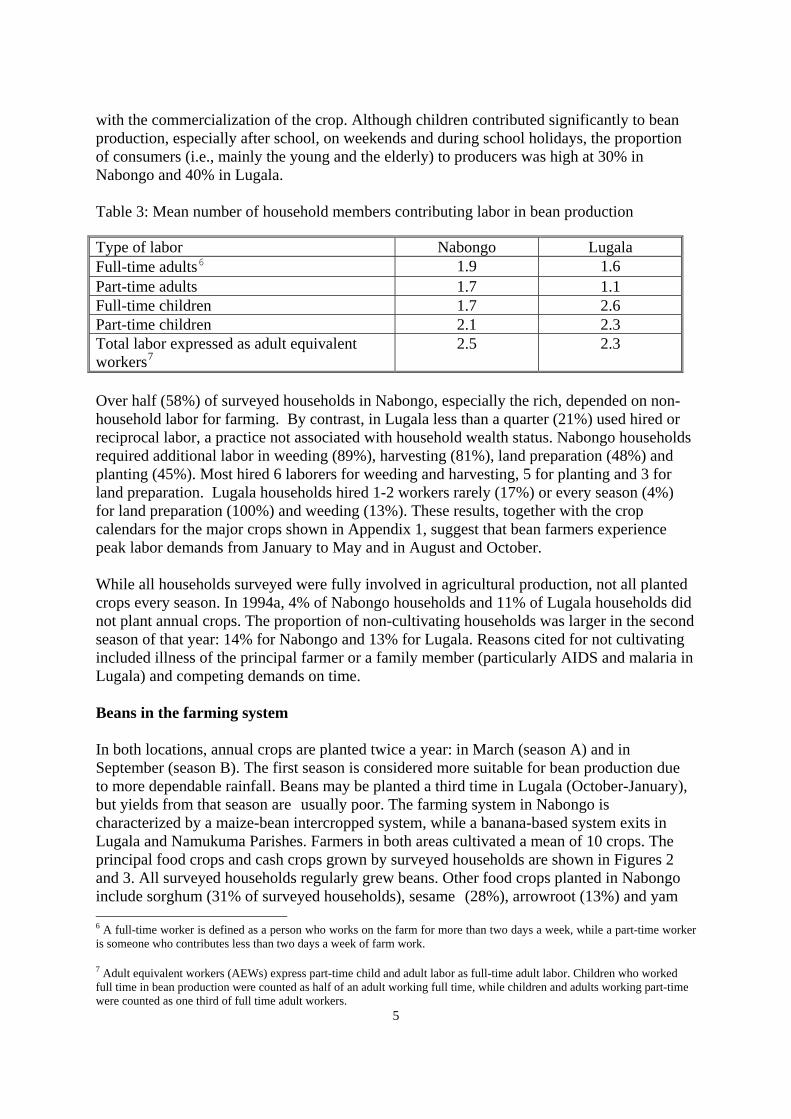
with the commercialization of the crop. Although children contributed significantly to bean production, especially after school, on weekends and during school holidays, the proportion of consumers (i.e., mainly the young and the elderly) to producers was high at 30% in Nabongo and 40% in Lugala. Table 3: Mean number of household members contributing labor in bean production Type of labor Nabongo Lugala Full-time adults6 1.9 1.6 Part-time adults 1.7 1.1 Full-time children 1.7 2.6 Part-time children 2.1 2.3 Total labor expressed as adult equivalent workers7
2.5 2.3
Over half (58%) of surveyed households in Nabongo, especially the rich, depended on non-household labor for farming. By contrast, in Lugala less than a quarter (21%) used hired or reciprocal labor, a practice not associated with household wealth status. Nabongo households required additional labor in weeding (89%), harvesting (81%), land preparation (48%) and planting (45%). Most hired 6 laborers for weeding and harvesting, 5 for planting and 3 for land preparation. Lugala households hired 1-2 workers rarely (17%) or every season (4%) for land preparation (100%) and weeding (13%). These results, together with the crop calendars for the major crops shown in Appendix 1, suggest that bean farmers experience peak labor demands from January to May and in August and October. While all households surveyed were fully involved in agricultural production, not all planted crops every season. In 1994a, 4% of Nabongo households and 11% of Lugala households did not plant annual crops. The proportion of non-cultivating households was larger in the second season of that year: 14% for Nabongo and 13% for Lugala. Reasons cited for not cultivating included illness of the principal farmer or a family member (particularly AIDS and malaria in Lugala) and competing demands on time. Beans in the farming system In both locations, annual crops are planted twice a year: in March (season A) and in September (season B). The first season is considered more suitable for bean production due to more dependable rainfall. Beans may be planted a third time in Lugala (October-January), but yields from that season are usually poor. The farming system in Nabongo is characterized by a maize-bean intercropped system, while a banana-based system exits in Lugala and Namukuma Parishes. Farmers in both areas cultivated a mean of 10 crops. The principal food crops and cash crops grown by surveyed households are shown in Figures 2 and 3. All surveyed households regularly grew beans. Other food crops planted in Nabongo include sorghum (31% of surveyed households), sesame (28%), arrowroot (13%) and yam 6 A full-time worker is defined as a person who works on the farm for more than two days a week, while a part-time worker is someone who contributes less than two days a week of farm work.
7 Adult equivalent workers (AEWs) express part-time child and adult labor as full-time adult labor. Children who worked full time in bean production were counted as half of an adult working full time, while children and adults working part-time were counted as one third of full time adult workers.

6
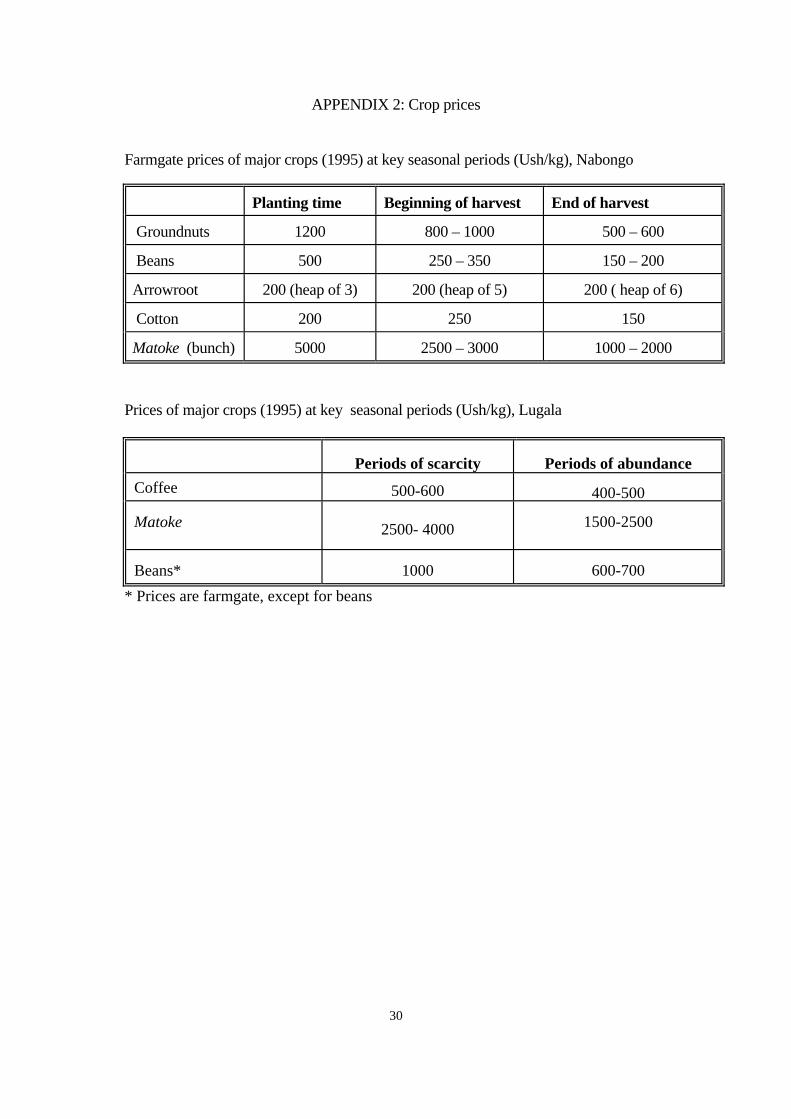
(10%). Farmers in Lugala also grew arrowroot (53%), yam (19%) and brewing bananas (17%). The decline of cotton in Nabongo meant that households depended mainly on food crops for cash income. The status of beans in the two communities contrasts sharply: in Nabongo the crop is considered a principal food and cash crop but holds a lesser status in Lugala where coffee, bananas and vanilla are the main cash crops and fish is an important source of protein. Both areas have experienced important changes in the cropping system since the 1960s (Figures 4 and 5). The decline of matoke (cooking bananas) in both areas was attributed to banana weevils, drought (Nabongo) and declining soil fertility, while cassava production has declined in Nabongo (and other parts of Eastern Uganda) as a result of East African cassava mosaic virus. Favorable markets, particularly in Mbale, contributed to the increased importance of beans. With the decline of coffee, bean production became more commercialized in Mbale in the early 1980s in response to demand from neighboring Kenya and urban centres in other parts of Uganda. In addition, many Nabongo farmers who lost their livestock during cattle raids by the Karamajong in 1987-88 were forced to rely more on beans as a source of protein. Bean production increased in importance in Lugala as consumption shifted from fresh to dry beans. In 1994, farm-gate prices for beans were higher in Lugala (Ush. 125-1270/kg) compared to Nabongo (Ush 98-400/kg) and differed by variety (see Appendix 1 for prices of other crops). During season A beans are intercropped with maize (100% in Nabongo and 64% in Lugala), cassava (25% in Nabongo and 79% in Lugala), bananas (63% and 21%), cotton (30% in Nabongo),) and other crops (11% and 14%). In Nabongo, the largest area sown to beans was intercropped with maize (98% of households), matoke (61%) or cassava (36%). In Lugala, the largest areas planted with beans were intercropped with cassava (40% of households) and maize (35%). All Nabongo households (N=40) reported planting beans on their best soils compared with 88% of Lugala households. A significant proportion of households (30% in Nabongo and 23% in Lugala) usually planted beans as a sole crop in the first season. Use of agricultural inputs was negligible in both localities; only one household in Nabongo used fertilizer on maize. In both localities, but particularly in Nabongo with its higher population pressure, land is fragmented so that a household's bean plots may be located in other villages. Significantly, the production constraints identified by farmers in both locations did not include soil fertility (Figure 6). While soils in Nabongo are still relatively fertile, observations from on-farm bean varietal trials in Lugala, and symptoms mentioned by farmers (e.g. yellowing of leaves), indicate soil deficiencies. The principal constraint mentioned in Nabongo was ootheca, a leaf beetle. In Lugala, farmers complained about “worms” and aphids. Although farmers in both localities recognized yield loss due to diseases, (i.e., yellowing leaves, “a lot of rain”8), in Lugala these constraints received a low ranking, possibly indicating farmers' poor understanding of diseases or their feeling of helplessness regarding the problem.
8 According to farmers, this problem (possibly common bacterial blight or anthracnose) only occurs when beans are planted late.
7
Bean varieties In 1994a, surveyed farmers in both locations grew a total of 8 landraces (Appendix 2), predominantly bush types. Traded varieties such as K20 (released in 1968) and Manyigamulimi (a landrace) were sown as pure varieties, while varieties with low market value individually were often grown and sold in mixtures which farmers did not bother to sort out. Farmers identified four varieties in Nabongo and three in Lugala which were no longer grown due to lack of market (Nabongo) and unavailability of seed (Lugala). Compared to farmers in Lugala, Nabongo farmers sowed a higher mean number of landraces: 2.1 compared to 1.5 in 1994a (P≤.0001) and 1.9 compared to 1.4 in 1994b (P≤.006). This finding, which may be related to land availability, contradicts observations made elsewhere on the negative effects of commercialization on bean varietal diversity (Hoogendijk and David, 1997; Ferguson and Mkandawire, 1993). The number of bean varieties sown in 1994a was positively associated with wealth among Nabongo households (P≤.05). The top three preferred bean varieties in Nabongo were K20 (known locally as Tanzania), Buwanga and Kanyebwa. In Lugala, Manyigamulimi was the most popular variety followed by K20 (known locally as Nambale) and Kanyebwa. Manyigamulimi fetched a higher price (Ush 600-1200/kg) than K20. K20 was preferred in Nabongo for its marketability and stability under various stress conditions, whereas Manyigamulimi was liked for its superior attributes. Varietal characteristics desired by farmers in the two communities include: high yields, marketability, good taste, short time to maturity, attractive color and appearance, quick cooking time and resistance to bruchids. Bush growth habit, tolerance to poor soils and drought, resistance to ootheca, delayed germination when still in the pod, ability to compete with weeds and digestibility were additional characteristics mentioned by Nabongo farmers. The most important cooking characteristics desired by women farmers in Nabongo were, in order of importance: starchiness, soup thickness, ability to break up easily, brown colored soup and swelling capacity (see Appendix 3). In both areas, women play the major role in deciding which bean varieties to plant, either on their own (23% in Nabongo and 65% in Lugala) or in consultation with their male partners (20% in Nabongo and 5% in Lugala). The decision is jointly made by 24% of farm couples in Nabongo and 13% in Lugala. Male farmers in Nabongo were more frequently involved in this decision than those in Lugala, on their own (16% compared with 10%) or in consultation with their wives (18% compared with 4%). Since Bagisu and Baganda males were not traditionally involved in bean seed management and selection, in Nabongo this trend reflects the commonly recorded pattern of greater male decision making in the production of a commercialized crop. Greater male involvement in decision-making does not, however, translate into equal labor contribution in the field. Seed sources In both areas, seed shortage was considered an important production constraint. Women farmers in Nabongo ranked lack of good quality seed and diseases as more important constraints than a male dominated group, reflecting the gender division of labor in seed selection and field management. Male emphasis on seed availability may highlight their greater commercial orientation, hence their concern with obtaining large quantities of seed. Farmers in Nabongo relied primarily on their own bean seed, but also obtained seed from
8
commercial sources and other farmers. Most farmers in Lugala/Namukuma are chronically seed deficient because they chose to eat or sell most of their seed due to storage problems. The main sources of seed in Lugala were shops, followed by farmers' own seed and borrowing from other farmers. Household organization of production Differences between Nabongo and Lugala in the organization of bean production and ownership of plots confirms conclusions in the gender and development literature that commercialization of a "female" crop often results in increased male involvement and an increase in women's responsibility for meeting household food requirements. As Table 4 shows, while most households in both locations cultivated beans on plots considered as belonging to all household members or to the wife (in cases where men contributed little or no labor9), the cultivation of personal bean plots by both men and women is an emerging trend in Nabongo. Spouses were more likely to cultivate separate plots (with or without a common plot) in better-off households, in situations of polygynous marriage and in households with older heads. Eight of the 13 independent male producers surveyed in 1995 were 61 years and above, all except one, enjoyed rich or average wealth status and, in 8 cases, the households had access to 1-2 ha of farm land. Table 4: Spousal organization and ownership as percentage of bean plotsa
Nabongo
1995 (N=64)
Nabongo
1996 (N=24)
Nabongo
1997 (N=20)
Lugala 1995
(N=78) Household plot only
72
67
0
57
Personal plot belonging to one spouseb
8
25
30
44
Personal plots belonging to both spousesb
21
8
70
0
a The 1995 and 1996 surveys covered random samples; the 1997 survey targeted independent female bean farmers b In Nabongo household plots may be cultivated in conjunction with personal plots Women in Nabongo grow beans on personal plots for income-generation (95%) and to provide food for the family (70%). Whereas men invariably consider beans as a cash crop, women cultivate beans independently for three reasons: mainly for sale, for both food and sale and mainly for food. A minority of women switched from household production to cultivating personal plots to stop their husbands from selling off beans intended for food. In short, cultivating personal plots gives women control over the crop. Most obtained land from 9 What farmers in Lugala identified as wife's or husband's plots differs conceptually from the notion of personal plots in Nabongo (i.e. where production is initiated by an individual who controls disposal of the crop). In all cases in Lugala, wives’ plots were never cultivated in conjunction with household plots, as occurred in Nabongo. Even where men contributed little or no labor on bean plots, the beans were used for household consumption and they often had input in decisions regarding disposal of the crop.
9
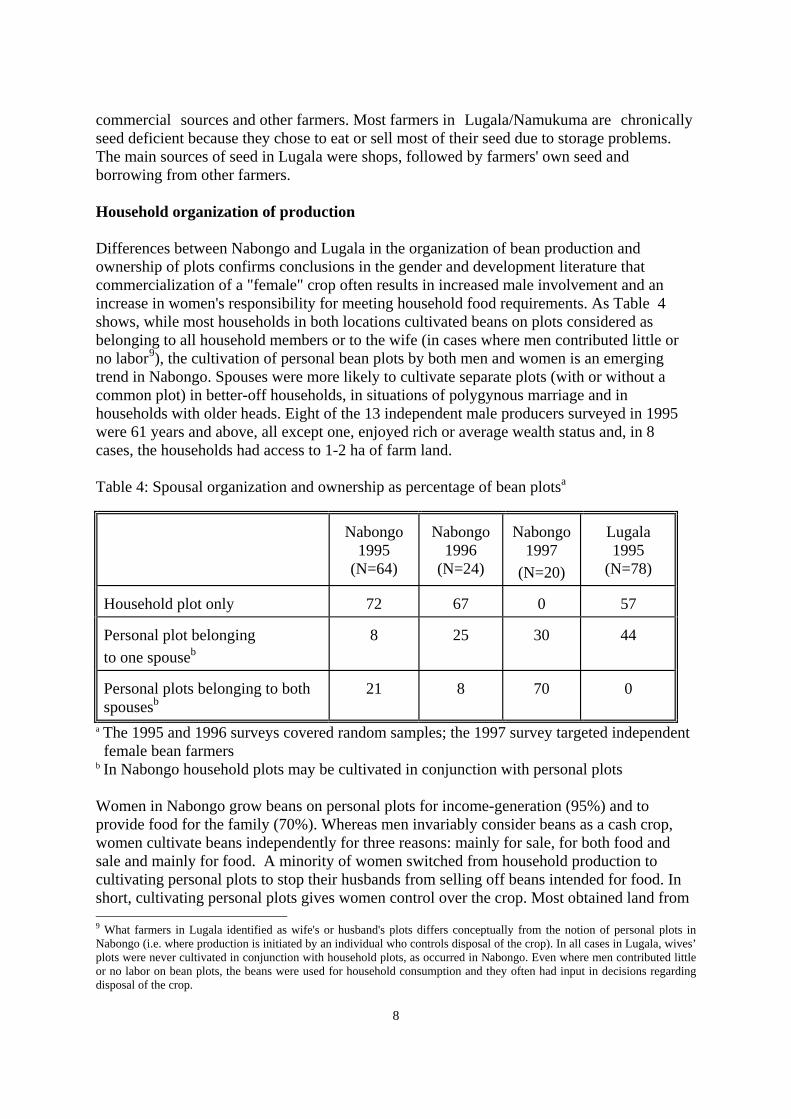
their husbands for independent production. Although women's earnings from personal plots were significantly less than men's (an average of Ush. 12,600 in season A compared to Ush 30,136 for men, with similar means in season B), 45% of women regarded beans as their most important source of independent income. Women spent these earnings on food and household necessities (40%), medical expenses (30%), clothes, school-related expenses and personal items (20% each). Differences in men's and women's plot sizes and the varieties grown reflect gender differences in the functions of independent bean production. The size of men's and women's personal plots are nearly equal in season B, but on average, due to their better access to labor, land and time, men plant a greater number of plots and a larger total area in the main growing season (Table 5). Men also plant fewer varieties than women (a mean of 1 compared to 2 for women) and concentrate on two commercial seed types (K20 and Kanyebwa), while women sow up to 4 varieties (K20, Kanyebwa, Buwanga and Mutike). Table 5: Characteristics of independent bean production by women and men farmers in
Nabongo
Women (N=20)
Men (N=11)
Season A
Season B
Season A
Season B
Mean number of plots
2
1
3
1
Seed sown (kg)
14
13
21
15
Area planted (ha)
0.2
0.2
0.3
0.2
Women's independent bean production may improve household and/or female welfare, but may also have the negative consequence of shifting some of men's responsibility for providing for their families to women. In a situation where women are expected to provide for the household, and given an ideology of "maternal altruism", women are less free than men to dispose of the harvest from personal plots as they like. Wives' plots contributed the bulk of beans consumed by the household in 18% and 65% of cases respectively in two surveys. In contrast, men's personal plots were the principal source of home-consumed beans in only 5% of cases interviewed in each survey. The majority (55%) of men who grew beans in 1994a used less than 20% of their harvest to feed their households and some men used the harvest from the second season for seed for the following season. Bean production in 1994 All households that planted crops in Nabongo in 1994 (with the exception of one in 1994b) sowed beans. On average, farmers planted a mean of 2.5 plots on a total of 0.49 ha in the first season and 1.8 plots covering 0.32 ha in the second season. Total area (during the first season only) and number of plots were positively associated with wealth. Quantities harvested (Figure 7) in the first season, but not in the second season, differed significantly by wealth group (P≤.03). Nabongo households significantly out-produced Lugala households (P≤.0001 for the amount sown and harvested) in 1994, although yields were extremely low in both areas, as Table 6 shows for the most popular varieties. Bean production per household was
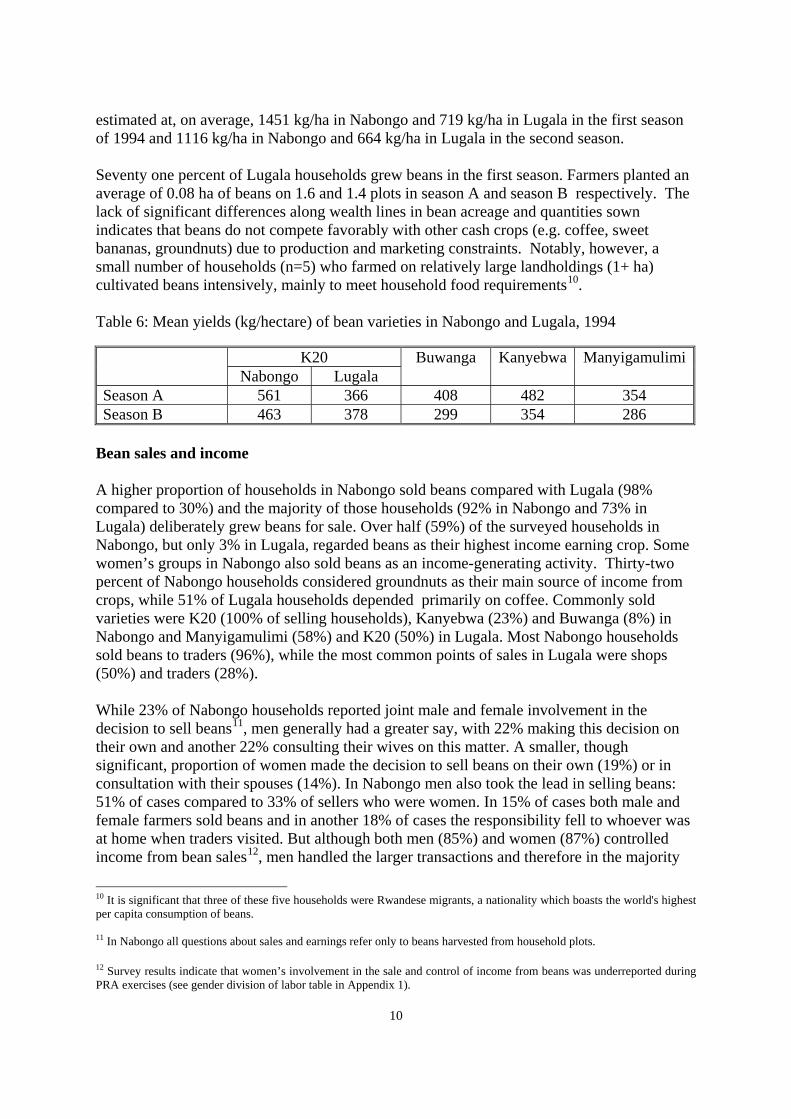
10
estimated at, on average, 1451 kg/ha in Nabongo and 719 kg/ha in Lugala in the first season of 1994 and 1116 kg/ha in Nabongo and 664 kg/ha in Lugala in the second season. Seventy one percent of Lugala households grew beans in the first season. Farmers planted an average of 0.08 ha of beans on 1.6 and 1.4 plots in season A and season B respectively. The lack of significant differences along wealth lines in bean acreage and quantities sown indicates that beans do not compete favorably with other cash crops (e.g. coffee, sweet bananas, groundnuts) due to production and marketing constraints. Notably, however, a small number of households (n=5) who farmed on relatively large landholdings (1+ ha) cultivated beans intensively, mainly to meet household food requirements10. Table 6: Mean yields (kg/hectare) of bean varieties in Nabongo and Lugala, 1994
K20 Nabongo Lugala
Buwanga Kanyebwa Manyigamulimi
Season A 561 366 408 482 354 Season B 463 378 299 354 286
Bean sales and income A higher proportion of households in Nabongo sold beans compared with Lugala (98% compared to 30%) and the majority of those households (92% in Nabongo and 73% in Lugala) deliberately grew beans for sale. Over half (59%) of the surveyed households in Nabongo, but only 3% in Lugala, regarded beans as their highest income earning crop. Some women’s groups in Nabongo also sold beans as an income-generating activity. Thirty-two percent of Nabongo households considered groundnuts as their main source of income from crops, while 51% of Lugala households depended primarily on coffee. Commonly sold varieties were K20 (100% of selling households), Kanyebwa (23%) and Buwanga (8%) in Nabongo and Manyigamulimi (58%) and K20 (50%) in Lugala. Most Nabongo households sold beans to traders (96%), while the most common points of sales in Lugala were shops (50%) and traders (28%). While 23% of Nabongo households reported joint male and female involvement in the decision to sell beans11, men generally had a greater say, with 22% making this decision on their own and another 22% consulting their wives on this matter. A smaller, though significant, proportion of women made the decision to sell beans on their own (19%) or in consultation with their spouses (14%). In Nabongo men also took the lead in selling beans: 51% of cases compared to 33% of sellers who were women. In 15% of cases both male and female farmers sold beans and in another 18% of cases the responsibility fell to whoever was at home when traders visited. But although both men (85%) and women (87%) controlled income from bean sales12, men handled the larger transactions and therefore in the majority
10 It is significant that three of these five households were Rwandese migrants, a nationality which boasts the world's highest per capita consumption of beans. 11 In Nabongo all questions about sales and earnings refer only to beans harvested from household plots.
12 Survey results indicate that women’s involvement in the sale and control of income from beans was underreported during PRA exercises (see gender division of labor table in Appendix 1).
11
of households (71%) they controlled the larger share of these earnings. Women controlled the second largest amount of income from bean sales in 78% of households. Due to the less important role of beans in the domestic economy in Lugala, women play a more independent role in bean sales, marketing and control of earnings. In 42% of bean selling households, women made the decision to sell the crop on their own, while in 35% of cases men made that decision. Couples jointly made the decision in 19% of cases and in 4% of households the female farmer consulted with the male farmer. Men (45%) and women (41%) were nearly equally involved in selling beans on their own or together (14%), although generally men handled bulk sales, while women sold small quantities for housekeeping money. Consequently, both men (58%) and women (69%) had control over income from bean sales, although in 54% of households men handled the largest amounts of earnings, while in 42% of cases women assumed this responsibility. Between 1989 and 1993 the majority of households in Nabongo, but few in Lugala, sold beans grown in the first season each year (Table 7). Among Lugala households, annual sales were slightly more common in the second season. The data show significant differences in quantities of beans sold between wealth groups in the first season (Nabongo: P≤.02; Lugala;P≤ .05). While rich households in Nabongo sold greater amounts of beans, the opposite trend was observed in Lugala (Figure 8). Farmers typically sold smaller quantities of beans after the second season (a mean of 82 kg in Nabongo and 41 kg in Lugala) due to smaller harvests, but differences by wealth were not significant in either location. Poor households in Nabongo face a classic dilemma: low production due to small farm size, labor and other constraints, few cash crop options and a high dependence on beans as a source of protein. Consequently, these households sell a higher proportion of their harvest compared to better off households. Forty-six percent of poor households, compared to 44% of average households and 25% of the rich, sold half or more of the beans harvested in 1994a. Among selling households in Lugala, the majority, irrespective of wealth status, sold a third or more of their harvest (Figure 8). Table 7: Frequency of bean sales over 5 years, 1989-94 (percent of households)
Number of seasons Nabongo Lugala Season A 5-6 78 4 3-4 17 38 <2 4 58 Season B 5 27 14 3-4 53 36 <2 19 50
From the harvest of the first season of 1994, farmers earned an average of between Ush.25,000-29,000 (Figure 9); earnings from the second season were less. Mean annual bean earnings were Ush 38,371 in Nabongo and Ush 25,157 in Lugala. Based on an annual estimated mean income of Ush. 507,718 and Ush 632,016 for rural households in Eastern and Central Uganda, respectively (Republic of Uganda, 1993), in 1994 beans accounted for 9% of total household income in Nabongo and 4% in Lugala.
12
A comparison of bean earnings by rural households in 1990 and 1994, however, suggests little significant change despite general improvements in the national economy. Seventy-three percent of farmers in Nabongo and 93% in Lugala reported annual earnings from beans of less than Ush 50,000 compared with 67% of farmers surveyed in 1990 in Mbale/Kapchorwa and 41% in 4 districts of the central region (Venegas, Muwanga and Lwasa, 1992). This situation may be attributed to low production, transport problems (lack of and high cost), low prices and lack of regular markets. These factors also explain why, despite the more commercialized nature of bean production in Nabongo, mean incomes from bean sales did not differ significantly in either season between the two locations. The relative scarcity of beans in Lugala, higher prices commanded in Kampala markets and the later timing of sale after the harvest by households that do not rely heavily on beans for income, may account for higher farmgate prices relative to Nabongo. Based on level of production and sale of beans grown in the first season, Nabongo farmers can be classified into four categories (Table 8): Category 1: deficit household (≤10% of population): these include the poorest households (the elderly, female headed households, delinquents, etc.) who have a shortage of labor and other resources and do not produce enough beans for consumption or regular sale. Category 2: self-sufficient households (30-35%): produce enough beans to allow for sale of small amounts (< 60 kg) on a regular basis. The majority rely on other crops as their principal source of income and some households buy beans to eat during periods of shortage. Beans are a principal source of protein due to limited cash availability and per capita consumption is high. Most of these households fall in the middle and poor wealth categories and have limited access to land and labor. Category 3: surplus households (40-45%):these mainly average wealth category households cultivate beans as a cash crop and produce enough to satisfy household needs. Per capita consumption is moderate to high. They sell a high proportion of their harvest (61-200 kg) and often experience shortages of beans. Category 4: commercial households (< 20%): well-off households with sufficient labor which cultivate a large bean acreage and sell 200+ kg. They consume modest amounts of beans since they can afford to purchase other protein rich foods (meat, fish) regularly.
13
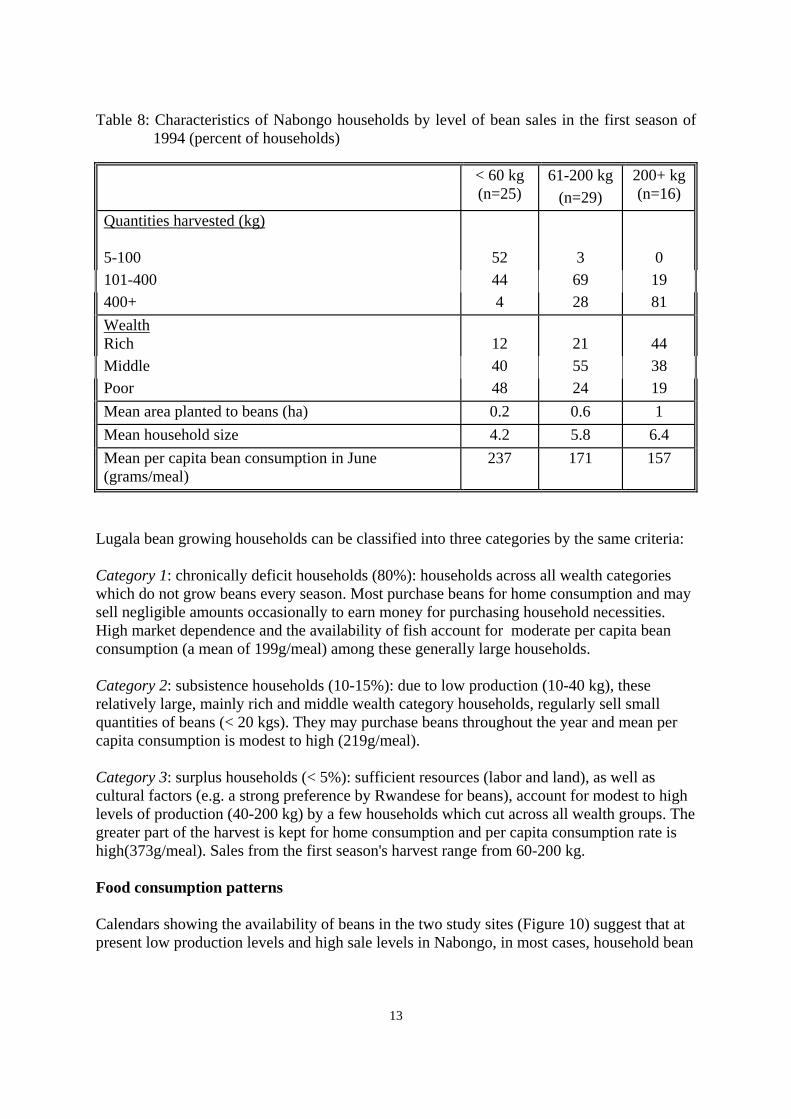
Table 8: Characteristics of Nabongo households by level of bean sales in the first season of 1994 (percent of households)
< 60 kg (n=25)
61-200 kg (n=29)
200+ kg (n=16)
Quantities harvested (kg) 5-100
52
3
0
101-400 44 69 19 400+ 4 28 81 Wealth Rich
12
21
44
Middle 40 55 38 Poor 48 24 19 Mean area planted to beans (ha) 0.2 0.6 1 Mean household size 4.2 5.8 6.4 Mean per capita bean consumption in June (grams/meal)
237 171 157
Lugala bean growing households can be classified into three categories by the same criteria: Category 1: chronically deficit households (80%): households across all wealth categories which do not grow beans every season. Most purchase beans for home consumption and may sell negligible amounts occasionally to earn money for purchasing household necessities. High market dependence and the availability of fish account for moderate per capita bean consumption (a mean of 199g/meal) among these generally large households. Category 2: subsistence households (10-15%): due to low production (10-40 kg), these relatively large, mainly rich and middle wealth category households, regularly sell small quantities of beans (< 20 kgs). They may purchase beans throughout the year and mean per capita consumption is modest to high (219g/meal). Category 3: surplus households (< 5%): sufficient resources (labor and land), as well as cultural factors (e.g. a strong preference by Rwandese for beans), account for modest to high levels of production (40-200 kg) by a few households which cut across all wealth groups. The greater part of the harvest is kept for home consumption and per capita consumption rate is high(373g/meal). Sales from the first season's harvest range from 60-200 kg. Food consumption patterns Calendars showing the availability of beans in the two study sites (Figure 10) suggest that at present low production levels and high sale levels in Nabongo, in most cases, household bean

14
stores are low or depleted 3-4 months after harvest13. Rural households respond to periodic food scarcity by using different coping strategies such as short-term dietary changes, reliance on wild foods and reducing or rationing consumption. In both locations, the average number of meals per week ranged from 19-20, with little observed seasonal difference. The poor in both communities ate fewer meals than better off households, but this difference was only statistically significant in June in Nabongo and in September in Lugala. In Nabongo, households across all wealth categories ate fewer meals in June (19 compared to 20 in September) on average due to limited availability of several main staples (matoke, sweet potatoes, yams). Nabongo households enjoyed a more diverse diet of staple foods in September compared to June when only two staples, maize posho14 and matoke, were frequently consumed (Table 9). Households in Lugala ate a wider variety of starches at both times of the year, with little seasonal difference in consumption frequency. With the exception of matoke in both locations and cassava posho in Lugala, there was little wealth-related difference in consumption frequency for staple foods. Partly because they can afford to buy this prestigious food, better off households ate matoke more frequently in Nabongo in June (P≤.01) and during both seasons in Lugala (P≤.04 in June and P≤.06 in September). Poor households in Lugala ate cassava posho more frequently in June than other wealth groups (P≤.09). Table 9: Frequency of starch consumption (average number of meals/week) Nabongo Lugala June
(N=80) September
(N=40) June N=78
September N=49
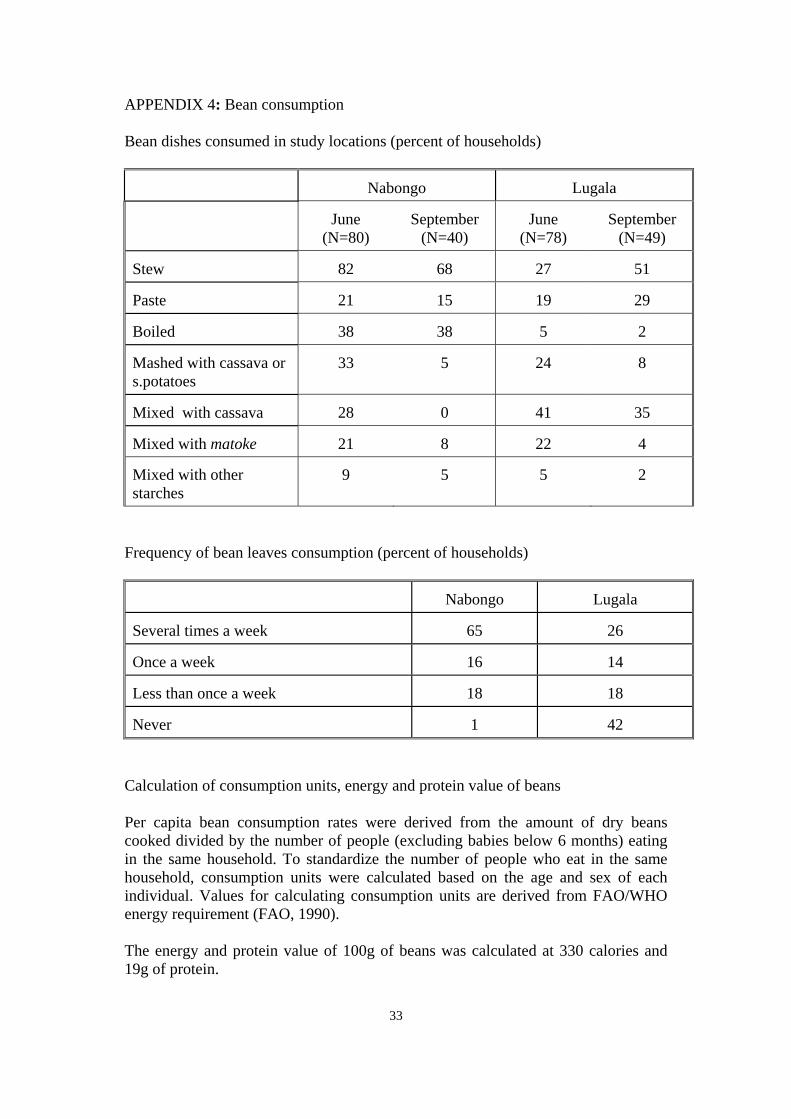
Maize posho 6.6 4.4 0.9 0.6 Sorghum or millet posho 0.8 NA NA NA Cassava posho NA NA 0.6 0.9 Matoke 2.2 4.1 4.2 5.2 Sweet potatoes NA 2.6 2.0 2.6 Fresh cassava 0.7 NA 5.8 7.6 Yam NA 1.0 NA NA Arrowroot 0.2 NA 1.0 0.7 Other starches 1.4 0.9 0.3 0.5 NA = Not eaten or eaten by few respondents Starches are accompanied by relishes variously made from beans, bean leaves, groundnuts, tomatoes (Lugala), bitter tomato, pumpkin leaves, cabbage, eggplant, cowpea leaves (Nabongo) and an assortment of wild vegetables such as Amaranthus spp. (Luganda: dodo, bugga) and Solanum aethiopicum (Luganda: nakati). Animal protein is more rarely consumed (Table 10).
13 In Nabongo, September is a period of low bean consumption but not necessarily low availability because: 1. Substitute foods (groundnuts and vegetables) are available, and 2. some households prefer to reserve beans for the December-February “hungry” season.
14 Posho is a stiff form of porridge made variously from maize, cassava, millet or sorghum.
15
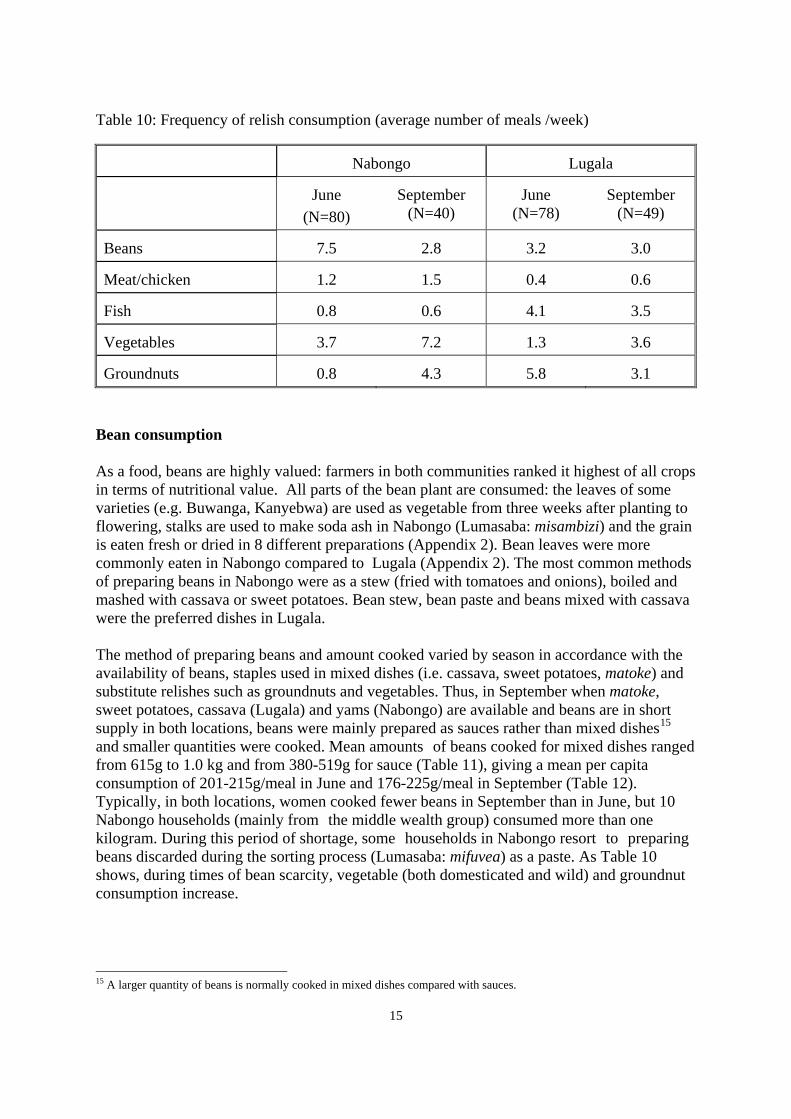
Table 10: Frequency of relish consumption (average number of meals /week)
Nabongo
Lugala
June
(N=80)
September
(N=40)
June
(N=78)
September
(N=49) Beans
7.5
2.8
3.2
3.0
Meat/chicken
1.2
1.5
0.4
0.6
Fish
0.8
0.6
4.1
3.5
Vegetables
3.7
7.2
1.3
3.6
Groundnuts
0.8
4.3
5.8
3.1
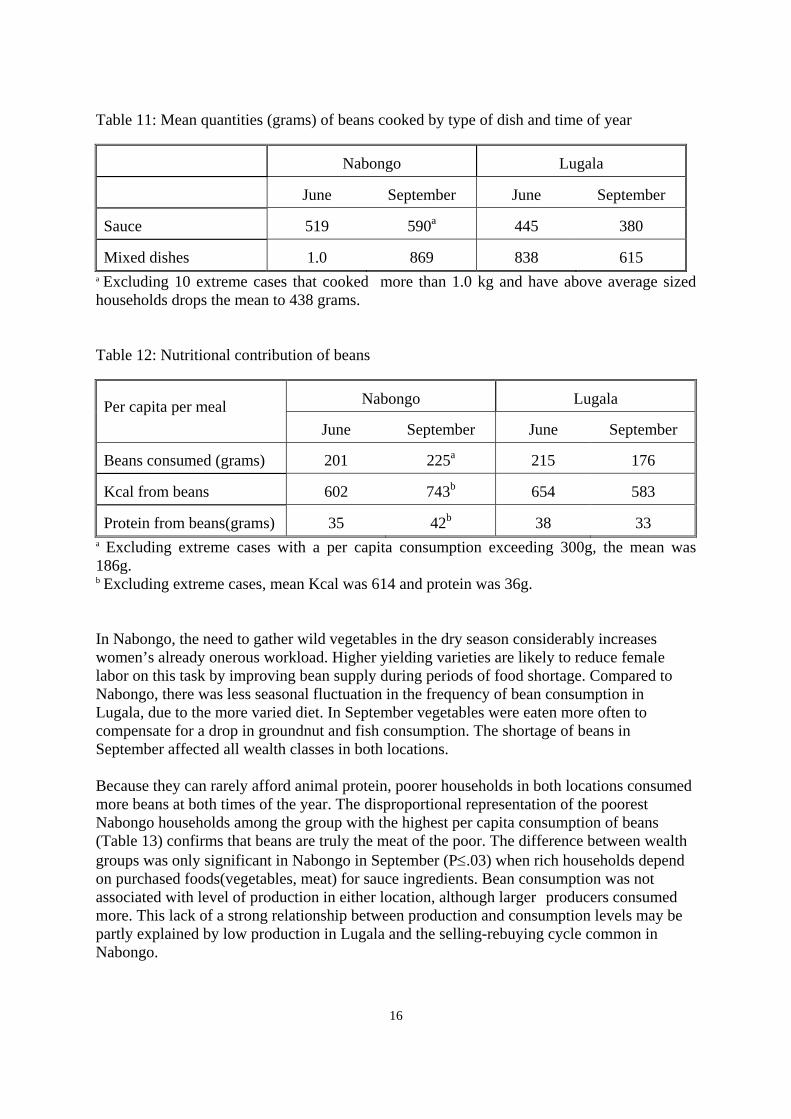
Bean consumption As a food, beans are highly valued: farmers in both communities ranked it highest of all crops in terms of nutritional value. All parts of the bean plant are consumed: the leaves of some varieties (e.g. Buwanga, Kanyebwa) are used as vegetable from three weeks after planting to flowering, stalks are used to make soda ash in Nabongo (Lumasaba: misambizi) and the grain is eaten fresh or dried in 8 different preparations (Appendix 2). Bean leaves were more commonly eaten in Nabongo compared to Lugala (Appendix 2). The most common methods of preparing beans in Nabongo were as a stew (fried with tomatoes and onions), boiled and mashed with cassava or sweet potatoes. Bean stew, bean paste and beans mixed with cassava were the preferred dishes in Lugala. The method of preparing beans and amount cooked varied by season in accordance with the availability of beans, staples used in mixed dishes (i.e. cassava, sweet potatoes, matoke) and substitute relishes such as groundnuts and vegetables. Thus, in September when matoke, sweet potatoes, cassava (Lugala) and yams (Nabongo) are available and beans are in short supply in both locations, beans were mainly prepared as sauces rather than mixed dishes15 and smaller quantities were cooked. Mean amounts of beans cooked for mixed dishes ranged from 615g to 1.0 kg and from 380-519g for sauce (Table 11), giving a mean per capita consumption of 201-215g/meal in June and 176-225g/meal in September (Table 12). Typically, in both locations, women cooked fewer beans in September than in June, but 10 Nabongo households (mainly from the middle wealth group) consumed more than one kilogram. During this period of shortage, some households in Nabongo resort to preparing beans discarded during the sorting process (Lumasaba: mifuvea) as a paste. As Table 10 shows, during times of bean scarcity, vegetable (both domesticated and wild) and groundnut consumption increase. 15 A larger quantity of beans is normally cooked in mixed dishes compared with sauces.
16
Table 11: Mean quantities (grams) of beans cooked by type of dish and time of year
Nabongo
Lugala
June
September
June
September
Sauce
519
590a
445
380
Mixed dishes
1.0
869
838
615
a Excluding 10 extreme cases that cooked more than 1.0 kg and have above average sized households drops the mean to 438 grams. Table 12: Nutritional contribution of beans
Nabongo
Lugala
Per capita per meal
June
September
June
September Beans consumed (grams)
201
225a
215
176
Kcal from beans
602
743b
654
583
Protein from beans(grams)
35
42b
38
33
a Excluding extreme cases with a per capita consumption exceeding 300g, the mean was 186g. b Excluding extreme cases, mean Kcal was 614 and protein was 36g. In Nabongo, the need to gather wild vegetables in the dry season considerably increases women’s already onerous workload. Higher yielding varieties are likely to reduce female labor on this task by improving bean supply during periods of food shortage. Compared to Nabongo, there was less seasonal fluctuation in the frequency of bean consumption in Lugala, due to the more varied diet. In September vegetables were eaten more often to compensate for a drop in groundnut and fish consumption. The shortage of beans in September affected all wealth classes in both locations. Because they can rarely afford animal protein, poorer households in both locations consumed more beans at both times of the year. The disproportional representation of the poorest Nabongo households among the group with the highest per capita consumption of beans (Table 13) confirms that beans are truly the meat of the poor. The difference between wealth groups was only significant in Nabongo in September (P≤.03) when rich households depend on purchased foods(vegetables, meat) for sauce ingredients. Bean consumption was not associated with level of production in either location, although larger producers consumed more. This lack of a strong relationship between production and consumption levels may be partly explained by low production in Lugala and the selling-rebuying cycle common in Nabongo.

17
Seasonal bean consumption patterns reflect three common situations: household self-sufficiency in beans, coping strategies to stretch bean supplies and unavailability. Notably, few households in Nabongo bought beans, whether or not they had beans in store during the “hungry” season (Table 14). By contrast, the majority of Lugala households depended on the market for beans during periods of scarcity. The introduction of higher yielding bean varieties is likely to have significant impact on food security among Nabongo households that are not self-sufficient in this crop, especially during periods of food shortage. However, impact on food security in Nabongo will be contingent on whether or not new varieties are used for both food and sale or are mainly reserved for home consumption. The impact of modern varieties on food security in Lugala is likely to be higher and more widespread compared with Nabongo, given the high level of market dependence and modest consumption levels. Table 13: Characteristics of Nabongo households by level of bean consumption
Per capita bean consumption (quartiles/g per meal)
1st (n=25) 2nd (n=15) 3rd (n=20) 4th (n=20)Consumption, June (g) 119 162 224 >225 Kcal from beans, per capita 328 476 609 1254 Protein from beans, per capita (g) 19 27 35 72 Buys beans during periods of scarcity (%) 24 13 50 30 Poorest households (%) 32 20 40 50 Household size 5.6 5.0 5.8 4.4 Table 14: Frequency of buying beans for food during periods of food shortage (percent of
households) Nabongo Lugala Several times a week 1 14 At least once a month 14 24 Less than once a month 15 27 Never 70 35
Based on a calculated mean per capita energy intake from beans (see Appendix 4), beans provided, on average, 28-35% of the estimated 2100 kcal/capita required for maintenance of good health and 48 grams or 69-88% of daily recommended protein intake for adults. In Nabongo there was little seasonal difference in the contribution of beans to daily energy and protein intake but, on average, Lugala households got a higher proportion of their energy and protein from beans in June. Based on per capita consumption data from June and September, annual per capita bean consumption is estimated at 58 kg for Nabongo and 38 kg for Lugala. These figures can be compared against per capita estimates for Rwanda and Western Kenya, which at 66 kg per annum are among the highest in the world (Jaetzold and Schmidt, 1983; CIAT, 1996).

18
CONCLUSIONS This study highlighted the importance of beans in the farming system and domestic economy of two distinct environments in Uganda. Within small geographical areas, there are important differences between bean growing households in terms of social differentiation, production, consumption, sales and male and female involvement in production and marketing. These differences have obvious and important implications for the impact of agricultural intervention and they need to be documented and quantified. The Nabongo communities provide a snapshot of a bean growing area in transition from subsistence to commercial production. Farmers in the study communities rely heavily on beans for food and as a source of household and individual income. Average annual per capita bean consumption is high at 58 kg. Most households produce enough beans for food with a surplus for sale and a small number, who sell several hundred kilograms of beans per season, can be designated, by Ugandan standards, commercial producers. In Nabongo beans provide, on average, an estimated 9% of household income. However, many households jeopardize food security by selling off a significant proportion of their harvest when prices are low and are forced to buy beans at a higher price during periods of scarcity. With the commercialization of the crop has come increased male involvement in independent production and decision-making, especially regarding disposal of the crop. Such a situation forces women farmers to bear a double burden: the responsibility for cultivating household plots and for meeting production shortfalls from their personal plots. These latter plots also enable women to earn independent income and improve household welfare. The Lugala area provides a picture of a subsistence bean producing environment in the banana-based system of central Uganda. There, beans remain a "female" crop mainly cultivated for household consumption. Since beans compete with other protein rich foods (e.g. fish) in this lake side location, annual per capita consumption is relatively low, on average, at 38 kg. Low production is attributed to biotic, abiotic and socio-economic constraints (e.g. high incidence of malaria and AIDS) and few households are self-sufficient in beans. Semi-subsistence households earn up to 4% of household income from beans, an indication of the crop’s income earning potential in this location. Despite the different role played by beans in the domestic economy of the two locations, farmers in Nabongo and Lugala experience broadly similar production constraints, including diseases and pests, shortage of seed, lack of improved varieties and other inputs (e.g. fertilizers), all of which contribute to low production. Poor transport systems, low prices offered by middlemen and other market related factors also inhibit production. Yet, most of these constraints can be alleviated by known technologies and interventions including improved varieties, seed production and storage technologies, better agronomic practices and food crop "banks" to discourage immediate post-harvest sales. In 1995, the International Center for Tropical Agriculture (CIAT) and two NGOs, Mission: Moving Mountains in Mbale and World Vision International in Ssii Sub-county, Mukono, set out to change the situation of bean production in Nabongo and Lugala by introducing two modern bean varieties. Between 1995 and 1997, over 800 kg of seed of two new bean varieties, K132 and K131, were sold to farmers in 8 communities through designated farmer distributors with the objective of investigating their impact in the future16. 16 Seed was distributed in Lugala over 2 seasons: 1995a and 1996a. Seed distribution started in Namukuma in 1996b.
19
Assessing the social impact of new crop varieties is a complex exercise, which requires going beyond documenting changes in yield and production. Both qualitative and quantitative baseline data are needed, since many areas of change may be obscure or invisible. Farmers should also be involved in assessing the impact of new technology to better identify areas of change likely to be missed by researchers and to encourage community empowerment. The new varieties, K132 and K131, appear to be improving food security and incomes and alleviating women’s workload in collecting wild vegetables (Appendix 4). Negative impacts anticipated include: a reduction in varietal diversity, increase in domestic conflicts and greater male involvement in independent bean production. Response to the two cultivars is however likely to vary in terms of various factors including area planted to beans, proportion of beans sold and amount consumed. Response will depend on the importance households put on meeting their food needs and their ability to be self-sufficient. However, as Gilbert (1995:34) rightly points out, “the relationship between production for home consumption objectives, technology adoption and subsequent adjustments in resource allocations is not well understood…”. Moreover, overlooking consumers’ preference for animal protein and their tendency to diversify their diets with higher income may lead to erroneous conclusions about the nature of the impact of new bean cultivars on consumption patterns. The present study has contributed to providing a detailed understanding of bean production and consumption patterns and how the crop affects the lives of men and women farmers in two Ugandan communities. Assessing the impact of agricultural technology in Uganda and other parts of Africa is usually hampered by the lack of baseline data. Impact assessment has therefore been largely limited to documenting easily perceived changes such as production, yield and area attributed to the new technology. More obscured areas of change such as consumption, income, gender relations and resource allocation decision-making cannot be documented without the detailed understanding of the social and economic complexities of farming households provided by a sociological baseline study. The information generatedby this study will be used to investigate qualitative and quantitative changes in the lives of Uganda farmers brought about by the introduction of new bean varieties.
20
Fig 1: Map showing study districts and counties

21

22
23
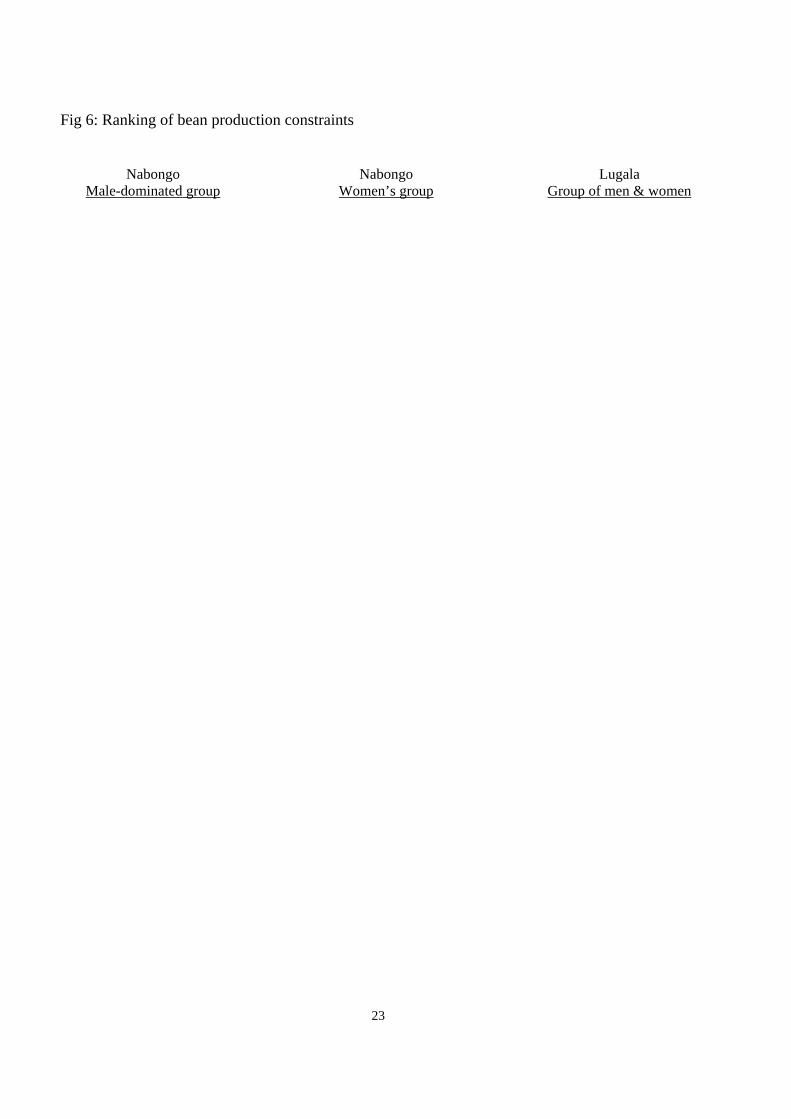
Fig 6: Ranking of bean production constraints
Nabongo Male-dominated group
Nabongo Women’s group
Lugala Group of men & women

26
Fig.7: Mean quantities of beans harvested Fig. 8: Mean quantities of beans sold in 1994 Fig. 9: Mean earnings from beans in 1994 Fig. 10: Bean availability calendar

27
APPENDIX 1: Cropping calendars and gender division of labor Cropping Calendars Nabongo FARMING ACTIVITIES J F M A M J J A S O N D BEANS: SLASHING PLOUGHING PLANTING 1ST WEEDING 2ND WEEDING HARVESTING POST-HARVEST MAIZE: SLASHING PLOUGHING PLANTING 1ST WEEDING 2ND WEEDING HARVESTING SHELLING AND STORAGE GROUNDNUTS: SLASHING PLOUGHING PLANTING 1ST WEEDING 2ND WEEDING HARVESTING DRYING Lugala FARMING ACTIVITIES J F M A M J J A S O N D BEANS: LAND PREPARATION PLANTING WEEDING HARVESTING POST-HARVEST MAIZE: LAND PREPARATION PLANTING WEEDING HARVESTING
28
Gender division of labor for major crops, Nabongo
Crop Operation
Men
Women
Beans: Slashing Ploughing Planting Weeding Harvesting Threshing/winnowing Drying Selling/control of income Maize: Slashing Ploughing Planting Weeding Harvesting Transporting/storage Selling/control of income Groundnuts: Slashing Ploughing Planting Weeding Harvesting Drying Selling/control of income
********** **** ** ***** ********** ********** ***** ******* *** * ******* **** ********** ********** * *** ** * ***** **********
****** ********** ******** ********** ********** ***** ********** ***** *** ******* ********* *** ****** ****** ******* ******** ********* ***** **********
29
Gender division of labor for major crops, Lugala Crop Operation
Men
Women
Beans: Slashing 1st ploughing 2nd ploughing Planting Weeding Post-harvest Control of income Banana: Digging of holes Desuckering Mulching Weeding Harvesting Control of income Cassava: Slashing Ploughing Planting Weeding Control of income
********* ***** **** *** ** ********* ******** *** ***** *** ********* ******** ********* ***** ***** *** *******
* ***** ****** ******* ******** ********** * ** ******* ***** ******* * ** * ***** ***** ******* ***
30
APPENDIX 2: Crop prices Farmgate prices of major crops (1995) at key seasonal periods (Ush/kg), Nabongo
Planting time Beginning of harvest End of harvest
Groundnuts 1200 800 – 1000 500 – 600
Beans 500 250 – 350 150 – 200
Arrowroot 200 (heap of 3) 200 (heap of 5) 200 ( heap of 6)
Cotton 200 250 150
Matoke (bunch) 5000 2500 – 3000 1000 – 2000 Prices of major crops (1995) at key seasonal periods (Ush/kg), Lugala
Periods of scarcity
Periods of abundance
Coffee 500-600
400-500
Matoke
2500- 4000
1500-2500
Beans*
1000
600-700
* Prices are farmgate, except for beans

31
APPENDIX 3: Bean varieties and farmer preferences
Common bean varieties grown in Nabongo Parish, 1994a
Local name
Color and pattern
Seed size
Percent of survey respondents
Tanzania (K20)
Red, mottled
Large
99
Kanyebwa
Red/pink, mottled
Medium
52
Buwanga
White, mono-colored
Small
44
Khaki
Green, mono-colored
Large
8
Mutabule
Mix of seed types
Large
4
Bubesemu
Red, mono-colored
Small
3
Mutike
Dark red, mono-colored
Large
1
Naminya
Unknown
Unknown
1
Unknown
Yellow
Small
1
Common bean varieties grown in Lugala Parish, 1994a
Local name
Color and pattern
Seed size
Percent of survey respondents
Manyigamulimi
Dark red, mono-colored
Large
61
Kawanda (K20)
Red, mottled
Large
45
Ebitabule
Mix of seed types
Mixed
24
Mutike
Dark red, mono-colored
Large
6
Unknown
Red, mono-colored
Large
2
Kimute
Unknown
Unknown
2
Kabongo
Unknown
Unknown
2
Obweru
White, mono-colored
Small
2
Unknown
Light brown
Medium
2
NOTE: Two additional varieties were planted in 1994b: Nambale omumpi (5%) and Obudugavu (2%).
32
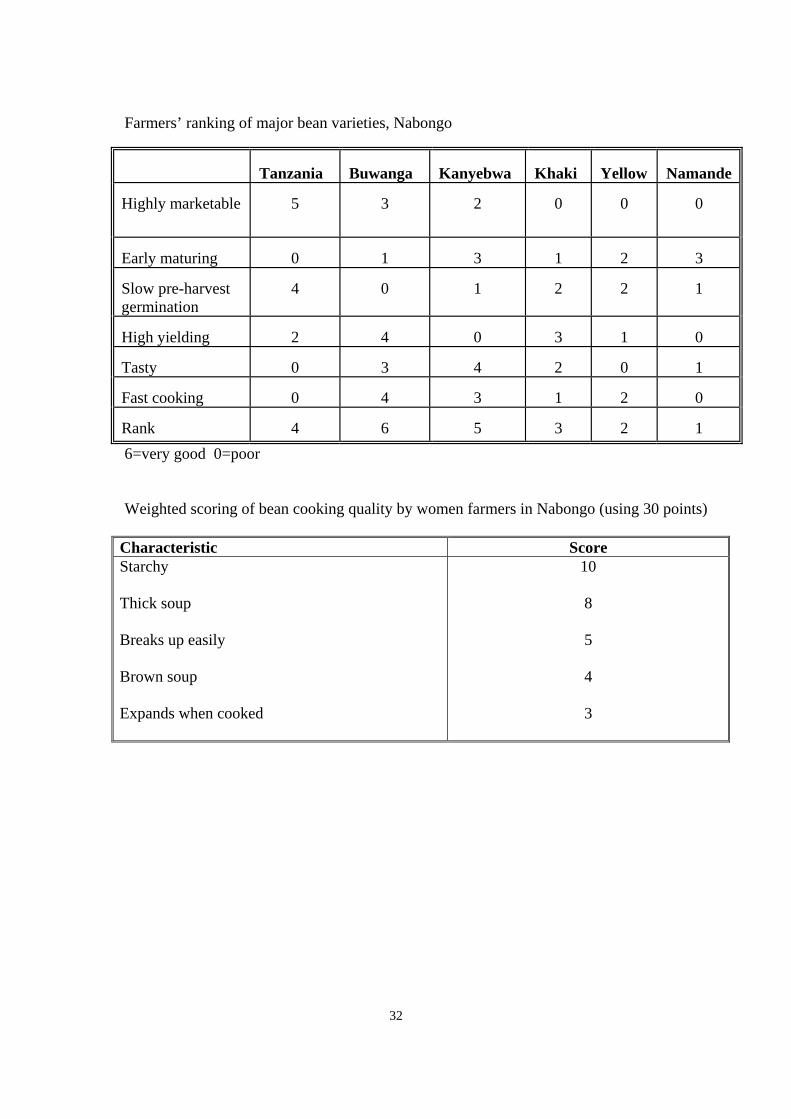
Farmers’ ranking of major bean varieties, Nabongo
Tanzania
Buwanga
Kanyebwa
Khaki
Yellow
Namande
Highly marketable
5
3
2
0
0
0
Early maturing
0
1
3
1
2
3
Slow pre-harvest germination
4
0
1
2
2
1
High yielding
2
4
0
3
1
0
Tasty
0
3
4
2
0
1
Fast cooking
0
4
3
1
2
0
Rank
4
6
5
3
2
1
6=very good 0=poor Weighted scoring of bean cooking quality by women farmers in Nabongo (using 30 points)
Characteristic Score Starchy Thick soup Breaks up easily Brown soup Expands when cooked
10 8 5 4 3
33
APPENDIX 4: Bean consumption Bean dishes consumed in study locations (percent of households)
Nabongo
Lugala
June
(N=80)
September
(N=40)
June
(N=78)
September
(N=49) Stew
82
68
27
51
Paste
21
15
19
29
Boiled
38
38
5
2
Mashed with cassava or s.potatoes
33
5
24
8
Mixed with cassava
28
0
41
35
Mixed with matoke
21
8
22
4
Mixed with other starches
9
5
5
2
Frequency of bean leaves consumption (percent of households)
Nabongo
Lugala
Several times a week
65
26
Once a week
16
14
Less than once a week
18
18
Never
1
42
Calculation of consumption units, energy and protein value of beans Per capita bean consumption rates were derived from the amount of dry beans cooked divided by the number of people (excluding babies below 6 months) eating in the same household. To standardize the number of people who eat in the same household, consumption units were calculated based on the age and sex of each individual. Values for calculating consumption units are derived from FAO/WHO energy requirement (FAO, 1990). The energy and protein value of 100g of beans was calculated at 330 calories and 19g of protein.

34
APPENDIX 5: Impact indicators Anticipated impacts of K132 and K131 identified by researchers and farmers
Indicators Indicator identified by Researchers Farmers in
Nabongo Farmers in Lugala
All parties
Yield (+) Area planted to beans (+) Labour (+)
Production
Input use (+) Varietal diversity
Disappearance of K20 and other local varieties (-)
Male involvement in bean production (+)
Cultivation of personal plots by spouses (+)
Intra-household issues
Conflict between men and women (+)
Per capita bean consumption (+)
Frequency of bean consumption (+)
Proportion of harvest consumed (+)
Frequency of purchasing beans (-)
Time women spend in searching for wild vegetables (-)
Expenditure on sauce ingredients during periods of food scarcity (-)
Food security
Health of families (+) Income from bean sales (absolute and proportional to household income) (+)
Amount of beans sold (+)
Income
Farmgate price of new varieties (+/-)
NOTE: + = increase; - = decrease
35
REFERENCES CIAT, 1996. The Pan-Africa bean research alliance: strengthening collaborative bean research in Sub-Saharan Africa, 1996-1999. A proposal for Canadian International Development Agency, Swiss Development Cupertino and United States Agency for International Development. David, S. 1997. Dissemination and adoption of new technology: a review of experiences in bean research in Eastern and Central Africa, 1992-1996. Network on Bean Research in Africa, Occasional Publications Series, no. 21, CIAT, Kampala, Uganda. Ferguson, A, and R. Mkandawire 1993. Common beans and farmer managed diversity: regional variation in Malawi. Culture and Agriculture, No 45-46. FAO, 1990. Conducting small-scale nutrition surveys: a field manual, Rome Italy. Gilbert, E. 1995. The meaning of the maize revolution in sub-Saharan Africa: Seeking guidance from past impact. ODI, Agricultural Administration Network. Network Paper 55, ODI. London. Hoogendijk, M., and S. David, 1997. Bean production systems in Mbale District, Uganda with emphasis on varietal diversity and the adoption of new climbing varieties. Network on Bean Research in Africa, Occasional Publications Series, no. 20, CIAT, Kampala, Uganda. Jaetzold, R. and H. Schmidt, 1983. Natural conditions and farm management information. Ministry of Agriculture, Kenya in cooperation with the German Agency for Technical Cooperation (GTZ). Pachico, D. 1993. "The demand for bean technology" in G. Henry (ed.) Trends in CIAT commodities, CIAT Working Document no. 128: 60-73, Cali, Colombia. Republic of Uganda 1992. The 1991 Population and Housing Census District Summary Series, Mbale and Mukono. Republic of Uganda, 1993. Report on the Uganda National Integrated Household Survey, 1992-93, Vol. 1. Ministry of Finance and Economic Planning. Entebbe, Uganda. Venegas, M., J. Muwanga and S. Lwasa, 1992. The marketing system for beans in Uganda. Department of Agricultural Economics, Makerere University, Working paper 92-2, Kampala, Uganda.

36
PUBLICATIONS OF THE NETWORK ON BEAN RESEARCH IN AFRICA Workshop Series No. 1. Proceeding of the Bean Fly Workshop, Arusha, Tanzania, 16-20 November 1986. No. 2. Proceeding of a Workshop on Bean Research in Eastern Africa, Mukono, Uganda, 22-25
June 1986. No. 3. Proceeding of a Workshop on Soil Fertility Research for Bean Cropping Systems in Africa,
Addis Ababa, Ethiopia, 5-9 September 1988. No. 4. Proceeding of a Workshop on Bean Varietal Improvement in Africa, Maseru, Lesotho, 30
January-2 February 1989. No. 5. Actes du Troisieme Seminaire Regional sur L'Amelioration du Haricot dans la Region des
Grands Lacs, Kigali, Rwanda, 18-21 Novembre 1987. No. 6. Proceedings of First SADCC Regional Bean Research Workshop, Mbabane, Swaziland, 4-7
October 1989. No. 7. Proceedings of Second Workshop on Bean Research in Eastern Africa, Nairobi, 5-8 March
1990. No. 8. Actes de l'Atelier sur la Fixation Biologique d'Azote du Haricot en Afrique, Rubona,
Rwanda, 27-29 October 1988. No. 9. Actes du Quatrieme Seminaire Regional sur L'Amelioration du Haricot dans la Region des
Grands Lacs, Bukavu, Zaire, 21-25 Novembre 1988. No. 10. Proceeding of a Workshop on National Research Planning for Bean Production in Uganda,
Kampala, Uganda, 28 January-1 February 1991. No. 11. Proceeding of the First Meeting of the Pan-African Working Group on Bean Entomology,
Nairobi, Kenya, 6-9 August, 1989. No. 12. Progress in Improvement of Common Bean in Eastern and Southern Africa. Proceedings of
the Ninth SUA/CRSP and Second SADCC/CIAT Bean Research Workshop, Morogoro, Tanzania, 17-22 September, 1990.
No. 13. Proceeding of a Working Group Meeting on Virus Diseases of Beans and Cowpea in Africa,
Kampala, Uganda, January 17-21, 1990. No. 14. Proceeding of the First Meeting of the SADCC/CIAT Working Group on Drought in Beans,
Harare, Zimbabwe, May 9-11, 1988. No. 15. Proceeding of the First Pan-African Working Group Meeting on Anthracnose of Beans,
Ambo, Ethiopia, February 17-23, 1991. No. 16. Actes du Cinquieme Seminaire Regional sur l'Amelioration du Haricot dans la Region des
Grands Lacs, Bujumbura, Burundi, 13-18 Novembre, 1989. No. 17. Actes du Sixieme Seminaire Regional sur l'Amelioration du Haricot dans la Region des
Grands lacs, 21-25 Janvier 1991. No. 18. Actes de la Conference sur le Lancement des Varietes, la Production et la Distribution de
Semaines de Haricot dans la Region des Grands Lacs, Goma, Zaire, 2-4 Novembre 1989.
37
No. 19. Recommendations of Working Groups on Cropping Systems and Soil Fertility Research for Bean Production Systems, Nairobi, Kenya, 12-14 February 1990.
No. 20. Proceeding of First African Bean Pathology Workshop, Kigali, Rwanda, 14-16 November, 1987.
No. 21. Soil Fertility Research for Maize and Bean Production Systems of the Eastern Africa
Highlands: Proceedings of a Working Group Meeting, Thika, Kenya, 1-4 September 1992. No. 22. Actes de l'Atelier sur les Strategies de Selection Varietale dans la Region des Grands Lacs,
Kigali, Rwanda, 17-20 Janvier 1991. No. 23. Proceeding of the Pan-African Pathology Working Group Meeting, Thika, Kenya, 26-30
May 1992. No. 24. Proceeding of a Bean Research Planning in Tanzania: Uyole Research Centre, 18-24 May
1992. No. 25. Second Meeting of the Pan-African Working Group on Bean Entomology, Harare, 19-22
September 1993. No. 26. Bean Improvement for Low Fertility Soils in Africa: Proceedings of a Working Group
Meeting, Kampala, Uganda, 23-26 May 1994. No. 27. Third SADC/CIAT Bean Research Workshop, Mbabane, Swaziland, 5-7 October 1992. No. 28. Proceedings of Third Multidisciplinary Workshop on Bean Research in Eastern Africa,
Thika, Kenya, 19-22 April 1993. No. 29. SADC Working Group Meeting of Bean Breeders, Lilongwe, Malawi, 26-29 September
1994. No. 30. Regional Planning of the Bean Research Network in Southern Africa, Mangochi, Malawi, 6-
8 March, 1991. No. 31. Fourth SADC Regional Bean Research Workshop, Potchefstroom, South Africa, 2-4
October 1995. No. 32. Alternative Approaches to Bean Seed Production and Distribution in Eastern and Southern
Africa: Proceedings of a Working Group Meeting, Kampala, Uganda, 10–13 October 1994. No. 33. Eastern Africa Working Group Meeting on Bean Breeding, Kampala, Uganda, 30 May
1994. No. 34. Pan-Africa Working Group on Bacterial and Viral Diseases of Bean, Kampala, Uganda, 13-
16 June 1994. No. 35. Seminaire Regional Restreint du RESAPAC tenu a Bukavu du 25 au 27 Janvier 1995. No. 36. VIIIe Seminaire Regional du RESAPAC tenu a Mukono, Uganda, du 5 au 8 Novembre
1995. No. 37. Second Pan-Africa Working Group on Fungal Diseases of Bean, Kakamega, Kenya, 5-8
June 1995. Occasional Publications Series No. 1. Agromyzid Pests of Tropical Food Legumes: a Bibliography. N.S. Talekar. 1988. No. 2. CIAT Training in Africa. R.A. Kirkby, J.B. Smithson, D.J. Allen and G.E. Habich. 1989.

38
No. 3a. First African Bean Yield and Adaptation Nursery (AFBYAN I): Part I. Performance in
Individual Environments. J.B. Smithson. 1990. No. 3b. First African Bean Yield and Adaptation Nursery (AFBYAN I): Part II. Performance across
Environments. J.B. Smithson and W. Grisley. 1992. No. 4. Assessment of Yield Loss caused by Biotic Stress on Beans in Africa. C.S. Wortmann.
1992. No. 5. Interpretation of Foliar Nutrient Analysis in Bean - the Diagnosis and Recommendation
Integrated System. C.S. Wortmann. 1993. No. 6. The Banana-Bean Intercropping System in Kagera Region of Tanzania - Results of a
Diagnostic Survey. C.S. Wortmann, C. Bosch and L. Mukandala. 1993. No. 7. Bean Stem Maggot Research Methods: A Training Course at Bujumbura, Burundi, 1-8
November, 1991. J.K.O. Ampofo. 1991. No. 8. On-Farm Storage Losses to Bean Bruchids, and Farmers' Control Strategies: A Travelling
Workshop in Eastern and Southern Africa. D.P. Giga, J.K.O Ampofo, S. Nahdy, F. Negasi, M. Nahimana and S.N. Msolla. 1992.
No. 9. A Training Manual for Bean Research. J. Mutimba. (ed). No. 10. Bean Germplasm Conservation based on Seed Drying with Silica Gel and Low Moisture
Storage. M. Fischler. 1993. No. 11. African Bean Production Environments: Their Definition, Characteristics and Constraints.
C.S. Wortmann and D.J. Allen. 1994. No. 12. Intensifying Production among Smallholder Farmers: The Impact of Improved Climbing
Beans in Rwanda. L. Sperling, U. Scheidegger, R. Buruchara, P. Nyabyenda and S. Munyanes. 1994.
No. 13. Analysis of Bean Seed Channels in the Great Lakes Region: South Kivu, Zaire, Southern
Rwanda, and Select Bean-Growing Zones of Burundi. L. Sperling. 1994. No. 14. Second African Bean Yield and Adaptation Nursery (AFBYAN II). J.B. Smithson, H.E.
Gridley and W. Youngquist. 1995. No. 15. Enhancing Small Farm Seed Systems: Principles derived from Bean Research in the Great
Lakes Region. L. Sperling, U. Scheidegger and R. Buruchara. 1995. No. 16. Les recherches multienvironmentales sur haricots effectuees au Rwanda de 1985 a 1990. P.
Nyabyenda. 1996. No. 17. Point de la recherche multienvironmentale sur haricot au Rwanda jusqu'en 1993. P.
Nyabyenda. 1996. No. 18 Synthese des rapports preliminaires et definitifs des sous-projets de recherche regional du
RESAPAC pour 1994-1995. P. Nyabyenda. No. 19. An Investigation of Alternative Bean Seed Marketing Channels in Uganda. S. David, S.
Kasozi and C. Wortmann. 1997. No. 20. The Indigenous Climbing Bean System in Mbale District of Uganda with Emphasis on the
Adoption of New Varieties and Genetic Diversity. M. Hoogendijk and S. David. 1997.

39
No. 21. Dissemination and Adoption of New Technology: A Review of Experiences in Bean Research in Eastern and Central Africa, 1992-1996. S. David. 1997.
No. 22. Snap Bean Seed Production and Dissemination Channels in Kenya. M. Kamau. 1997. No. 23. A Survey on Insect Pests and Farmers' Control Measures on Snap Beans in Kirinyaga
District, Kenya. J.H. Nderitu, J.J. Anyango and J.K.O. Ampofo. 1998. No. 24. Socio-economic survey of three bean growing areas of Malawi. J. Scott and M. Maideni.
1998. No. 25. Farmers’ perceptions of bean pest problems in Malawi. S. Ross. 1998. No. 26. The appropriateness and effectiveness as an agricultural extension tool. J. Munro. 1998. No. 27. Accomplishments of participatory research for systems improvement in Iganga District,
Uganda 1993 to 1997. C.S. Wortmann, M. Fischler, F. Alifugani and C.K. Kaizzi. 1998. Reprint Series No. 1. Common beans in Africa and their constraints. D.J. Allen, M. Dessert, P. Trutmann and J.
Voss. P.9-31 in: H.F. Schwartz and M.A. Pastor-Corrales (eds.), Bean Production Problems in the Tropics, 2nd Ed. CIAT, Cali, Colombia. 1989.
No. 2. Insects and other pests in Africa. A.K. Karel and A. Autrique. P.455-504 in: H. F. Schwartz
and M.A. Pastor-Corrales (eds.), Bean Production Problems in the Tropics, 2nd Ed. CIAT, Cali, Colombia. 1989.
No. 3. Diagnosis and correction of soil nutrient problems of common bean (Phaseolus vulgaris) in
the Usambara Mountains of Tanzania. J.B. Smithson, O.T. Edje and K.E. Giller. Agric. Sci. 120:233-240. 1993.
No. 4. Banana and bean intercropping research: factors affecting bean yield and land use
efficiency. C.S. Wortmann, T. Sengooba and S. Kyamanywa. Expl. Agric. 28:287-294; 1992. and
The banana-bean intercropping system - bean genotype x cropping system interactions. C.S. Wortmann, and T. Sengooba. Field Crops Research 31:19-25. 1993.
No. 5. Contribution of bean morphological characteristics to weed suppression. C.S. Wortmann.
Agron. J. 85(4): 840-843. 1993. No. 6. The dynamics of adoption: distribution and mortality of bean varieties among small farmers
in Rwanda. L. Sperling and M.E. Loevinsohn. Agric. Systems 41:441-453. 1993. No. 7. Bean sieving, a possible control measure for the dried bean beetles, Acanthoscelides
obtectus (Say)(Coleroptera: Bruchidae). M.S. Nahdy. J. Stored Prod. Res. 30:65-69; 1994. and
An additional character for sexing the adults of the dried bean beetle Acanthoscelides obtectus (Say)(Coleroptera: Bruchidae). M.S. Nahdy. J. Stored Prod. Res. 30:61-63. 1994.
No. 8. Crotalaria ochroleuca as a green manure crop in Uganda. C.S. Wortmann, M. Isabirye and
S. Musa. African Crop Science J. 2:55-61. 1994. No. 9. Rethinking the farmer's role in plant breeding: local bean experts and on-station selection in
Rwanda. L. Sperling, M.E. Loevinsohn and B. Ntabomvura. Expl. Agric. 29: 509-519. 1993. No. 10. Toxic concentrations of iron and manganese in leaves of Phaseolus vulgaris L. growing on
freely-drained soils of pH 6.5 in Northern Tanzania. K.E. Giller, F. Amijee, S.J. Brodrick,
40
S.P. McGrath, C. Mushi, O.T. Edje and J.B. Smithson. Communications in Soil Science and Plant Analysis, 23 (15&16):1663-1669. 1992.
No. 11. Overcoming bean production constraints in the Great Lakes region of Africa: integrating
pest management strategies with genetic diversity of traditional varietal mixtures. [A set of the following seven publications]:
No. 11a. The impact of pathogens and arthropod pests on common bean production in Rwanda. P.
Trutmann and W. Graf. International Journal of Pest Management, 39(3): 328-333. 1993. No. 11b. Management of common bean diseases by farmers in the central African highlands. P.
Trutmann, J. Voss and J. Fairhead. International Journal of Pest Management, 39(3): 334-342. 1993.
No. 11c. Local knowledge and farmer perceptions of bean diseases in the central African highlands.
P. Trutmann, J. Voss and J. Fairhead. Agriculture and Human Values, Vol. 13: 1996. No. 11d. Disease control and small multiplication plots improve seed quality and small farm dry bean
yields in Central Africa. P. Trutmann and E. Kayitare. Journal of Applied Seed Production, 9:36-40. 1991.
No. 11e. Managing angular leaf spot on common bean in Africa by supplementing farmer mixtures
with resistant varieties. M.M. Pyndji and P. Trutmann. Plant Disease, 76: 1144-1147. 1992. No. 11f. Partial replacement of local common bean mixtures by high yielding angular leaf spot
resistant varieties to conserve local genetic diversity while increasing yield. P. Trutmann and M.M. Pyndji. Annals of Applied Biology, 125:45-52. 1994.
No. 11g. Seed treatments increase yield of farmer varietal field bean mixtures in the central African
highlands through multiple disease and beanfly control. P. Trutmann, K.B. Paul and D. Cishahayo. Crop Protection Vol.11 (Oct.92): 458-464. 1992.
No. 12. Studies on seed transmission of Xanthomonas campestris pv phaseoli in common beans in
Uganda. A.F. Opio, J. M. Teri and D. J. Allen. Afr. Crop Science J. 1(1): 59-67; 1993. and Pathogenic variation in Xanthomonas campestris pv. phaseoli, the causal agent of common bacterial blight in Phaseolus beans. A.F. Opio, D. J. Allen and J. M. Teri. Plant Pathology 45: 1126-1133. 1996.
No. 13. Developing cultivars of the common bean (Phaseolus vulgaris L.) for southern Africa: bean
common mosaic virus resistance, consumer preferences and agronomic requirements. O.Z. Mukoko, N.W. Galwey and D.J. Allen. Field Crops Research 40:165-177; 1995. and
Breeding the common bean (Phaseolus vulgaris L.) for resistance to bean common mosaic virus: alternatives to backcrossing. O.Z. Mukoko and N.W. Galwey. Euphytica 82:91-104. 1995.
No. 14. Seed yield and stability of bean multiline. C.S. Wortmann, H.E. Gridley and S.M. Musaana.
Field Crops Research 46: 153-159. 1996. No. 15. Soil fertility management in bean production systems in Africa. [A set of the following three
publications]: No. 15a. Bean improvement for low fertility soils in Africa. C.S. Wortmann, L. Lunze, V.A. Ochwoh
and J. Lynch. African Crop Science Journal, Vol. 3 (4): 469-477. 1995. No. 15b. Estimation of the fertilizer response of maize and bean intercropping using sole crop
response equations. C.S. Wortmann, H.F. Schnier and A.W. Muriuki. African Crop Science Journal, Vol. 4 (1): 51-55. 1996.
41
No. 15c. Soil and foliar phosphorus determination in Rwanda: procedures and interpretation. P. Drechsel, B. Mutwewingabo, F. Hagedorn and C.S. Wortmann. African Crop Science Journal, Vol. 4 (2): 167-175. 1996.